damage assessment: validating the efficacy of the
TRANSCRIPT

Running head: A BETTER DAMAGE ASSESSMENT 1
Damage Assessment: Validating the Efficacy of the Windshield Survey
Norvin Collins
Tualatin Valley Fire & Rescue
Tigard, OR
September 2011
A BETTER DAMAGE ASSESSMENT 2
Certification Statement
I hereby certify that this paper constitutes my own product, that where the language of
others is set forth, quotation marks so indicate, and that appropriate credit is given where I have
used the language, ideas, expressions, or writings of another.
Signed: ________________________________________

A BETTER DAMAGE ASSESSMENT 3
Abstract
The intent of this paper was to determine the efficacy of Tualatin Valley Fire & Rescue's
(TVF&R) initial assessment performed by fire response crews immediately following a
manmade or natural disaster such as an earthquake or terrorist attack.
The problem was that the public safety, specifically TVF&R’s, efficacy in regards to
rapid damage assessment process has not been validated. More specifically, the use of the
windshield survey to conduct the damage assessment by fire response crews has not been
evaluated.
The purpose of this study was to evaluate the public safety, specifically TVF&R’s,
efficacy in regards to rapid damage assessment and windshield survey process used following a
large scale manmade or natural disaster.
To meet the purpose of this paper, descriptive research method answered the following
questions: (a) what is the region's geographical and historic susceptibility to natural disasters, (b)
what are the standards for rapid damage assessment including forms used by first responding
companies at TVF&R, (c) what standard(s) or procedure(s) are used by other fire departments in
the Pacific Northwest to conduct a rapid damage assessment, and (d) what national standard(s) or
procedure(s) exist to conduct a rapid damage assessment?
Analysis of the rapid damage assessment process used by TVF&R consisted of numerous
evaluation tools. Descriptive research was broken down into three categories: comprehensive
literature review including historic and current practices, personal interviews, and survey
instrument distributed separately to regional and national fire service agencies to ascertain the
processes necessary for a successful rapid damage assessment.

A BETTER DAMAGE ASSESSMENT 4
The results validated a risk of natural or manmade disaster potential to the region,
national and regional coordination should be improved, and TVF&R had a rapid damage
assessment process that met standards but could be improved. Therefore, recommendations
followed to include creation or leveraging partnerships, communication, and drills pertaining to
disaster response.

A BETTER DAMAGE ASSESSMENT 5
CONTENTS
Certification Statement ....................................................................................................................2
Abstract ............................................................................................................................................3
Table of Figures ...............................................................................................................................7
Introduction .............................................................................................................................8
Background & Significance ....................................................................................................9
Organizational Impact ...................................................................................................13
Area of Impact and Current Issues ................................................................................14
Literature Review ..................................................................................................................16
Procedures .............................................................................................................................27
Research Methodology..................................................................................................27
Literature Review ..........................................................................................................28
Survey Instrument .........................................................................................................28
Limitations and Assumption .........................................................................................29
Results ...................................................................................................................................30
Research Question 1:.....................................................................................................30
Research Question 2:.....................................................................................................31
Research Question 3:.....................................................................................................32
Research Question 4:.....................................................................................................34
Discussion/Implications ........................................................................................................35
Recommendations .................................................................................................................38
References ......................................................................................................................................40
Appendix A Active Northwest Tremors .......................................................................................44
Appendix B Portland Metro Fault Lines .......................................................................................45
Appendix C Interviewees ..............................................................................................................46

A BETTER DAMAGE ASSESSMENT 6
Appendix D General Damage Assessment Survey .......................................................................47
Appendix E Regional Assessment Survey ....................................................................................49
Appendix F TVF&R Vulnerability Indexes .................................................................................51
Appendix G Excerpt from FRP – Major and Disaster Operations ...............................................55
Appendix H Major Emergency Operations – Company Officer and Duty Chief .........................61
Appendix I Windshield Survey Examples – Stations 67 and 33 ..................................................65

A BETTER DAMAGE ASSESSMENT 7
Table of Figures
Figure 1. : TVF&R Jurisdiction.....................................................................................................10
Figure 2. : Ring of Fire. .................................................................................................................12
Figure 3. : Satellite images of the Chengdu-China area, before and after the earthquake (a) before; (b) one day after; (c) 4 days after. ...............................................................................21
Figure 4. : Overall flowchart of context-based damage mapping. ................................................22
Figure 5. : (a) Damage ratio map; (b) false colour composite QuickBird 3 June 2008; (c) reference damage points taken from http:?www.virtualdisasterviewer.com. ..........................22

A BETTER DAMAGE ASSESSMENT 8
Introduction
This paper seeks to determine the efficacy of Tualatin Valley Fire & Rescue's (TVF&R)
initial assessment performed by fire response crews immediately following a manmade or natural
disaster such as an earthquake or terrorist attack. TVF&R currently requires fire response crews
to perform a windshield survey within their first-due areas using the fire apparatus and a pre-
prepared map to include route and buildings to assess.
The public looks to the emergency responders for direction and help for all types of
emergencies ranging from a child with a stuck finger to a traffic crash with entrapped occupants
to floods and earthquakes. The fire service is expected to be able to respond to any and all types
of incidents no matter how small. The Pacific Northwest (for this paper defined as Oregon and
Washington) is prone to natural disasters that include severe weather (rains, ice, and snow
storms), flooding, wind events, and earthquakes. The greater Portland, Oregon area also has the
potential for manmade disasters including major hazardous materials incidents, bridge collapse,
or airline incidents. In order to conduct a complete damage assessment, a plan must be in place
that prioritizes target hazards, including infrastructure. The public expects the emergency
services to be fully response ready to mitigate all issues; however, following a natural or
manmade disaster, a critical assessment and triaging must take place first to meet the greatest
needs. There is potential for all emergency services, police and fire, to partner with city and
county public works to conduct the damage assessment in a more efficient manner in a shorter
time.
The problem is that the public safety, specifically TVF&R’s, efficacy in regards to rapid
damage assessment process has not been validated. More specifically, the use of the windshield
survey to conduct the damage assessment by fire response crews has not been evaluated.
A BETTER DAMAGE ASSESSMENT 9
The purpose of this study is to evaluate the public safety, specifically TVF&R’s, efficacy
in regards to rapid damage assessment and windshield survey process used following a large
scale manmade or natural disaster.
Descriptive research methodology will be used to document the following research
approach: (a) determine the available data for this region to proactively assess potential impact of
a disaster including types, (b) analysis of this data to include a sampling of assessment needs
following a large scale incident, and (c) draw conclusions and synthesize information regarding
TVF&R’s rapid damage assessment process.
To meet the purpose of this paper, descriptive research method will be used to answer the
following questions: (a) what is the region's geographical and historic susceptibility to natural
disasters, (b) what are the standards for rapid damage assessment including forms used by first
responding companies at TVF&R, (c) what standard(s) or procedure(s) are used by other fire
departments in the Pacific Northwest to conduct a rapid damage assessment, and (d) what
national standard(s) or procedure(s) exist to conduct a rapid damage assessment?
Background & Significance
Tualatin Valley Fire & Rescue is the largest combination and fire district in the State of
Oregon; it is the second largest overall fire department in the state behind Portland Fire &
Rescue. TVF&R consists of approximately 500 operational (career and volunteer) and staff
personnel protecting 210 square miles and 440,000 residents. TVF&R, being a special
protection district, protects nine different cities (Beaverton, Durham, King City, Rivergrove,
Sherwood, Tigard, Tualatin, West Linn, and Wilsonville) and portions of three counties

A BETTER DAMAGE ASSESSMENT 10
Figure 1. : TVF&R Jurisdiction.

A BETTER DAMAGE ASSESSMENT 11
(Clackamas, Multnomah, and Washington) responding to approximately 31,000 incidents in
2010 (Figure 1). These incidents are predominately medical (EMS) in nature; however, the
District staffs a Technical Rescue Team, Water Rescue Team, and one of the State’s Regional
HazMat Teams. The Operations Division administrative personnel support 22 stations staffing
apparatus on a 3-shift, 24-hour rotation (A, B, C staffing model). All apparatus are advanced life
support (ALS) units with a minimum of one paramedic staffing. These crews are led by a
company officer (one Lieutenant per crew with one Captain overseeing each station), in three
battalions, and one of the nine Battalion Chiefs on shift daily. TVF&R is located in the Pacific
Northwest (PNW) with its cities suburbs of Portland in Oregon (Peck, 2010).
Brantley (2003) describes that “volcanoes are not randomly distributed over the Earth's
surface. Most are concentrated on the edges of continents, along island chains, or beneath the sea
forming long mountain ranges. More than half of the world's active volcanoes above sea level
encircle the Pacific Ocean to form the circum-Pacific "Ring of Fire” (Figure 2). He goes to say
that the plate tectonics theory explains the relationship between volcanoes and other large
geologic features. Cities along the West Coast, including Oregon and Washington, need be
concerned with the relationship of the tectonic plates, specifically the Juan de Fuca plate. As this
plate subducts beneath North America, at a rate of 3 to 4 centimeters per year, geological activity
along the “Ring of Fire” will be present (Tilling, Heliker, & Wright, 2003); “… the subduction
of the Juan de Fuca plate beneath the North America plate is believed to directly or indirectly
cause most of the earthquakes and young geologic features in Washington and Oregon” (Noson,
Qamar, & Thorsen, 2003; Rosenberg, 2011). The climate combined with goegraphical elements
presents the opportunity of the PNW to experience major disasters of varying magnitude in the
years to come.

A BETTER DAMAGE ASSESSMENT 12
Figure 2. : Ring of Fire.
Following the events of September 11 and the hurricaine/flooding in Louisiana, the
Department of Homeland Security (DHS) has attempted to increase the national standards for
disaster response between emergency responders. The National Response Framework (NRF) is
designed to provide the framework for consistent response to disasters throughout the nation
(DHS, 2008). The Portland Metro region has adopted the guidelines from the DHS and the NRF;
therefore, the local departments have developed a set of disaster tools for use immediately
following an event. The Offices of Emergency Management have worked to coordinate drills
and Geographical Information Systems (GIS) tools for the area for consistency between
departments; however, validation of the application of these tools has not been completed by
each department on a regular basis.

A BETTER DAMAGE ASSESSMENT 13
Organizational Impact
In the event of a catastrophic event, the Oregon Emergency Response System (OERS)
operates under Oregon Revised Statutes (ORS) 401, Executive Order of the Governor and
Oregon Administrative Rules (OAR) Chapter 104, Division 40 to provide coordination of state
resources in response to natural and technological emergencies and civil unrest involving multi-
jurisdictional cooperation between all levels of government and the private sector (State of
Oregon, 2011).
TVF&R maintains a set of strategic goals to guide how the organization responds to
inside and outside requests as well as principles for mitigation of incidents from the
administrative level. The response to the potential impact of a major disaster is guided by the
following strategic goals:
a. “Goal III: Enhance preparedness for catastrophic and unforeseen events
• Maintain District’s ability to prepare for, respond to, and recover from major
emergencies and catastrophic events.
• Improve District’s structural and non-structural seismic mitigation in all
facilities to assure stability following an event.
• Enhance regional emergency management capabilities through partnerships,
training, and challenging exercises.
b. Goal VI: Promote craftsmanship, innovation, and excellence throughout the
organization
• Maintain or improve CFAI accredited agency status, CFOD, the current ISO
rating, the GFOA status, the State Fire Marshal’s Office “exempt jurisdiction”

A BETTER DAMAGE ASSESSMENT 14
status, local fire code adoption including multi-family appendices, and
compliance with DPSST and NIMS.
• Improve overall performance based upon the processes, systems, and criteria
established by Continuous Quality Improvement (CQI) programs.
• Increase the percentage of TVF&R employees who have initiated or achieved
four-year and advanced degrees.
c. Goal VII: Leverage use of existing resources for the greatest community good
• Develop and maintain partnerships that create efficiencies.
• Maintain or improve the value of state, federal, and foundation grants that
enhance TVF&R’s ability to better serve customers.
• Develop greater diversification of revenue sources.
• Increase the percentage of environmentally friendly practices for daily
operations” (TVF&R, 2009)
Following these guidelines and principles, this research intends to evaluate the best
approach for response, citizen care, and impact to the community TVF&R serves while
maintaining cooperation and partnerships with other government and private agencies.
Area of Impact and Current Issues
Tualatin Valley Fire & Rescue is committed to providing local and regional support and
guidance regardless of magnitude of the incident. Responders operate under Fire Rescue
Protocols (FRPs) that are consistent on a regional basis; these were agreed to between the
counties of Washington, Clackamas, Multnomah, and Clark. Within these FRPs are guidelines
for disaster response. For any guidelines, be they fire/rescue or medical protocols, to remain

A BETTER DAMAGE ASSESSMENT 15
relevant, timely, and pertinent to the situation, they must be reviewed and validated on a regular
basis. TVF&R’s protocols are reviewed annually, but they have not been validated within the
past 10 years. Another problem for TVF&R responders is the lack of consistency between
stations in regards to structures and infrastructures to evaluate.
While the departments in the Portland Metro area have guidelines for disasters and major
incidents, they would be overwhelmed in a short time with an earthquake or large scale natural
disaster. The geological society predicts a major seismic event within the region in the
foreseeable future. This would impact both life safety and the economic stability of the area.
The research conducted in this paper ties directly to the National Fire Academy’s
Executive Analysis of Fire Service Operations in Emergency Management (EAFSOEM) Course
as part of the Executive Fire Officer’s Program. One of the main premises in the course was
focusing on the need for consistency of rapid damage assessment tools for communication,
triage, and resource utilization purposes (NFA, 2009). The data gathered from these initial
assessments will have impact on the eventual outcome and recovery time following the event
according to the course. This research is intended to combine these concepts in the evaluation
and validation of the rapid damage assessment process at TVF&R.
The primary mission of TVF&R is to provide exceptional emergency prevention,
preparedness and incident response services through cost effective innovation, data driven
decision making, individual excellence and outstanding customer service (TVF&R, 2009, p. 2).
This applied research paper will also help to strengthen both TVF&R’s commitment to data
driven decision making in regards to operational impacts to community safety and recovery
following a natural or manmade disaster; furthermore, it will demonstrate continued partnerships
with other governmental and private agencies.

A BETTER DAMAGE ASSESSMENT 16
The research project supports operational objectives 1 (one) 2 (two), and 3 (three) as
described in The United States Fire Administrations’ (USFA) Operational Policies (USFA,
2011). These operational objectives are as follows: (1) “reduce risk at the local level through
prevention and mitigation,” (2) “improve local planning and preparedness,” and (3) “improve the
fire and emergency services’ capability for response to and recovery from all hazards” (NFA,
2008, p. II-2; USFA, 2011). The relevance of the operational objective is based on the ability for
TVF&R personnel to respond to emergency incidents in a timely manner following a natural or
manmade disaster while reducing recovery time for the community. This research paper intends
to address both the objectives of the USFA and the expectation previously mentioned from the
NFA; furthermore, it will provide an evaluation of the validity of TVF&R’s Rapid Damage
Assessment/Windshield Survey process with recommendations for improvement/s.
Literature Review
The ability for the emergency services to respond effectively to respond to incidents is
crucial to the success of the organization and the community. These incidents may be large or
small. As incidents become larger, they become more complex with multiple partnerships.
Disasters, natural or manmade, generally occur over a short period of time and produce a large
area of damage. A quick development of the event can just as quickly overwhelm emergency
responders. During these times of greatest personal challenge, the citizens that each firefighter is
sworn to protect, need leadership and guidance more than at any other time. Having a strong
understanding of the potential hazards to the area the fire departments protect and a set of tools
to use in the event of a catastrophic event will assure those citizen’s expectations are met; in the
eyes of the citizen, this is the emergency responder’s greatest hour.

A BETTER DAMAGE ASSESSMENT 17
As stated, understanding the region’s potential for disaster is the first step in preparing for
an unfortunate event. The beginning of understanding starts with a common set of terminology.
There are terms that are unique to disasters and emergency services, and these terms are not
always the same from jurisdiction to jurisdiction. Therefore, the following is intended to create a
common foundation to draw.
• Disaster: a calamitous event, especially one occurring suddenly and
causing great loss of life, damage, or hardship, as a flood, airplane crash,
or business failure ("Disaster," 2011).
• Earthquake: a series of vibrations induced in the earth's crust by the abrupt
rupture and rebound of rocks in which elastic strain has been slowly
accumulating ("Earthquakes," 2011).
• Fault line: the intersection of a fault with the surface of the earth or other
plane of reference ("Fault Lines," 2011).
• Magnitude: earthquake magnitude a measure of the size of an earthquake
based on the quantity of energy released: specified on the Richter scale
("Magnitude," 2011).
• Rapid Damage Assessment: gathering of information related to the impact
of an event, or series of events, on life and property within a defined area
(NFA, 2009, p. 6-2).
The PNW is as vulnerable to manmade disasters as any other portion of the nation;
consequently, preparedness for terrorist attacks and HazMat incidents are incidents that local
responders training on regularly. It is easier, in a way, to train and prepare for these types of
disasters because they involve known hazards and magnitudes. On the other hand, preparing for

A BETTER DAMAGE ASSESSMENT 18
what Mother Nature can throw at a community is neither stagnant nor predictable. Over the past
decade, the PNW has faced drought, floods, minor earthquakes, tidal waves and other natural
disasters of varying size and duration. With the changing climate in recent years, the projection
of increased nature induced incidents is evident (Bumbaco & Mote, 2010; Komar, Allan, &
Ruggiero, 2011). According to Komar, et.al. (2011), the tidal activity along the coastal regions
is tied to the tectonics and seasonal variations. The Portland Metro region is far enough inland
that there is not direct impact of tidal influence; however, the weather patterns are affected by
those tidal changes which do impact this region.
The last major flood in the Willamette Valley area was in 1996; this flood was the largest
since 1964 (Willingham, 2008). Minor flooding occurs, Vernonia, OR in 2007 for example, in
the area on a seasonal basis do to population/building increases, logging practices, and land
saturation. The flood of 1996 was the first time in recent history where damage assessment tools
were used for triaging of priorities and reduction in recovery times. Impact from this flood was
seen throughout the region. Floods tend to be slower in development with the exception of a
dam or levee break. Earthquakes, however, are short term in duration but can have major
impact.
Much of the PNW is prone to earthquakes. The last earthquake in Oregon was
September 19, 2011 with a magnitude of 1.7 on the east side of the state. There have been many
tremors throughout the region over the years as illustrated in Appendix A (USGS, 2005).
According to the University of Washington Department of Siesmology, this region is susceptible
to 8.0 magnitude earthquakes because of the Juan de Fuca fault line which it sits (Noson, 1998).
Noson goes on to note there are significant numbers of earthquakes each year, many of which are
A BETTER DAMAGE ASSESSMENT 19
not noticed by the population. Not only is the PNW prone for earthquake activity, there is a fault
line that runs directly through TVF&R’s area.
The main fault line runs through the West Hills that are covered by TVF&R; should these
plates create a sustained quake, the epicenter could dramatically impact response to damaged or
destroyed stuctures and infrastructure (Appendix B). Many of the structures within the Portland
Metro area have been improved to withstand eathquakes; however, this is an ongoing process
that has been hampered by today’s economic climate. Regardless of the structural improvements
made to buildings, bridges, or roads, there will be widespread damage requiring assessment and
people in need of rescue or help. Rapid damage assessments are the only way to gain a true
vision of the scope of damage in a timely manner.
Damage assessment takes on many forms, but at the heart it is concerned with rapid
assessment of structural and infrastructural damage in order to triage priorities for rescue and
recovery. The Greek philosopher Claudius Galenus described damage assessment following the
great fire of Rome as “the avoidance of grief” (McLaughlin, 2011). From the beginning of
organized society, catastrophes have existed. While these occurrences are the darkest hours of
existence, they allow the greatest examples of how the world can put aside differences to meet
the greatest good. The United States is far advanced in many areas; however, we can learn from
the world the rest of the time in regards to its approach to assessment and recovery from natural
disasters.
To understand damage assessment, one must look outside the area in which he or she
lives. The world is exposed to all of the same disaster potentials as the United States and many
experience more than we do; therefore, we can learn from each other to prevent, mitigate, and
recover from disasters. After the disaster has occurred, the first step in mitigation is to conduct a

A BETTER DAMAGE ASSESSMENT 20
rapid damage assessment. There are different tools available that have become available to aid
in this process. GIS and satellite imagery are growing in modeling for prevention and large scale
assessment following the disaster. These images can give both an area perspective as well as
detailed building assessment information; this has been found to be helpful in countries such as
Italy, China, and the United States (Luino, Cirio, Biddoccu, Agangi, Giulietto, Godone, &
Nigrelli, 2009; Korkmaz & Kutay, 2010; Vu & Ban, 2010).
Luino, et.al., (2009) goes on to discuss how flood modeling from a small river in Italy
that floods regularly can be used for predicting the economic impact on the different regions and
magnitude of the flood; “the approach is suitable to large-area damage assessment and could be
appropriate for land use planning, civil protection and risk mitigation.” Being able to tie pre- to
post-disaster imagery creates a better picture for emergency workers to begin searches and
knowledge of structures in the area; figure 3 illustrates a potential use for this type of imagery.
Tying this concept for area flood damage to building assessment, Vu & Ban (2010) present a
flow chart for the application of satellite imagery to damage assessment (figures 4 and 5).
The United States has spent time at the National level to create a system for damage
assessment; it is defined in the NRF and guides emergency responders in an all-hazards response
(DHS, 2008). ESF#5, in the NRF, defines the role of Emergency Management as a coordinating
point for assembly, assignment, and deployment of resources in times of domestic incidents.

A BETTER DAMAGE ASSESSMENT 21
Figure 3. : Satellite images of the Chengdu-China area, before and after the earthquake (a)
before; (b) one day after; (c) 4 days after.

A BETTER DAMAGE ASSESSMENT 22
Figure 4. : Overall flowchart of context-based damage mapping.
Figure 5. : (a) Damage ratio map; (b) false colour composite QuickBird 3 June 2008; (c)
reference damage points taken from http:?www.virtualdisasterviewer.com.

A BETTER DAMAGE ASSESSMENT 23
The plan specifically guides the process within four areas:
1. Gain and Maintain Situational Awareness
2. Activate and Deploy Resources and Capabilities
3. Coordinate Response Actions
4. Demobilization
The plan goes on to delineate the role of an Emergency Manager:
• Alerts and notifications
• Staffing and deploying of Department of Homeland Security (DHS) and DHS/Federal
Emergency Management Agency (FEMA) response teams, as well as response teams
from other Federal departments and agencies
• Incident action planning
• Coordination of operations, direction, and control
• Logistics management
• Information collection, analysis, and management
• Facilitation of requests for Federal assistance
• Resource acquisition and management
• Federal worker safety and health
• Facilities management
• Financial management
The initial priority following a domestic incident is to provide a rapid damage assessment.
There are consistencies between United States assessments and those throughout the world.
There are sometimes conflicting priorities and many objectives associated with a damage
assessment. In A Guide to Successful Damage and Needs Assessment, it is noted that (Planitz,
1999):

A BETTER DAMAGE ASSESSMENT 24
“The objectives of damage and needs assessments are to determine the nature and extent
of the disaster, damage and secondary threats, needs of the population, resource
availability and local response capacity, options for relief assistance, long-term recovery
and development, and needs for international assistance.”
The guide continues to define five primary elements in the assessment process: (a) planning and
preparation, (b) survey and data collection, (c) interpretation and forecasting, (d) reporting, and
(e) monitoring (p. 5-6). Finally, Planitz (1999, p. 10) recommends a general, non-detailed report
covering:
1. Disaster Identification
2. Location and/or Facility Details
3. Communication Details
4. Access Details
5. Human & Operational Details
6. Structural Damages
7. Production Damages
8. Equipment Damages
9. Water Supply Damages
10. Power supply Damages
11. Remaining Threats
12. Source Information
13. Reporting Officer details
While FEMA, through the DHS, set forth guidelines for conducting a rapid damage
assessment, this assessment must meet the individual needs of the area where it is being used.

A BETTER DAMAGE ASSESSMENT 25
Many in emergency services consider FEMA to be the definitive guiding agency for disasters;
and while they provide guidance and requirements necessary for support funding, the American
Red Cross (ARC) has a parallel process that is very similar for damage assessment that is used
worldwide (American Red Cross, 2003). Comparatively, the four assessment guidelines that the
ARC (2003) proposes are almost the same as FEMA’s: (a) impact assessment, (b) preliminary
damage assessment, (c) area assessment, and (d) detailed damage assessment. As stated,
assessments should be consistent and follow a format; the format, however, can be regionalized.
The Southern portion of the United States should have a process for frequently
encountered disasters such as floods and hurricanes whereas states like Kansas need tools for
assessment damage following tornadoes. Each of the areas systems must remain flexible to meet
National Incident Management System (NIMS) compliance and be able to overlay in an all-
hazards environment. The PNW’s tools should include the possibility for floods, earthquakes,
and wind events. While the procedures for the PNW are better for floods and wind events, much
of the knowledge for responding to earthquakes come from procedures gleamed from California.
Immediately following the event, an assessment of the emergency responder’s buildings,
equipment, and personnel occur first, before any assessment of the department’s jurisdiction
(Grendze, 2011; Hard, 2007; McCormick, 2010; Wood, 2010). This first damage assessment is
the true beginning of the process; some items to include in this assessment are damage to
building, damage to apparatus, ability to respond, building on generator power, etc. (Grendze,
2011). Once these assessments are complete, the report needs to be communicated to a central
command or coordinator. Smaller departments or areas will have a difficult time coordinating
this information as resources are limited. It is important to remember, however, that good
documentation of building status before and damage occurred is necessary for timely processing

A BETTER DAMAGE ASSESSMENT 26
and/or approval of FEMA recovery dollars (FEMA, 2007). Medium and larger departments
have the on-duty Chief Officer act as the collection point and initial Incident Commander for the
event. Once reports are delivered to the appropriate person, many crews are then required to
conduct a “drive-by” or “windshield” survey of the company’s first-due area.
Consistent with DHS guidelines, there are broad categories that each assessment should
include: Life hazards, to include rescue or trapped numbers; target hazard damage, to include
buildings and infrastructure; status of established safe areas; and transportation hazards, to
include road access, bridge access, or downed lines, i.e. power. Santa Rosa, CA, uses a damage
assessment form and procedure that is consistent with other California departments; as they
respond together on major incidents, it is important to have common nomenclature. Both Santa
Rosa and Brea have conducted pre-incident mapping and company assignments to use during the
rapid damage assessment phase on the incident (McCormick, 2010; Wood, 2011).
The Stafford Disaster Relief Act denotes what type of documentation is necessary to
recovery and associated government support (FEMA, 2007). Creation of reporting forms or
mapping having conforming symbols and terms makes obtaining recovery funding easier. The
PNW has differing terminology and symbols from jurisdiction to jurisdiction; however, many
Emergency Management Systems through the PNW have separate mapping systems with
federally consistent nomenclature. Redmond, WA, for example, uses nomenclature for the
region and meets federal requirements (Ganz, 1998). Many of the mapping programs accessible
to emergency services have these approved symbols and colors provided by state or local
emergency managers.
In summary, the first step to understanding and assessing any process is a common set of
terminology; this allows for better communication and coordination. The PNW is an area that is

A BETTER DAMAGE ASSESSMENT 27
in danger from both manmade and Natural disasters. Living on or near active fault lines and
volcanoes creates the necessity for emergency service professionals to pre-plan hazards to create
mapping and response guidelines necessary to conduct a rapid damage assessment immediately
following an event. There is opportunity for better coordination and communication between
public safety agencies, emergency managers, and FEMA. However, as long there are policies
that conform to federal and local guidelines, a rapid damage assessment can occur to reduce life
and property loss. The agencies of PNW are not insulated from improving their processes and
learning from the experiences of others.
Procedures
Research Methodology
Analysis of the rapid damage assessment and windshield survey process used by
YVR&R consists of numerous evaluation tools. The outcome of this descriptive research intends
to provide the author with information necessary to evaluate the District's current process with
recommendations for improvement to remain consistent with regional and national standards.
The comprehensive literature review includes books, journals, and additional written material
available from various sources including but not limited to local libraries, the National Fire
Academy's Learning Resource Center, Internet search drivers such as Bing.com or Google.com,
regional and national geographical databases, and scholarly/professional search drivers such as
Academic Search Premier. These reviews came in addition to jurisdictional and local
demographic documents. A Zoomerang® survey (Appendix D), developed, distributed, and
results collected from regional and national fire departments (n=150), will establish data
pertinent disaster assessment. Finally, personal interviews, based on a Zoomerang® survey
(Appendix E), conducted with Emergency Managers (n=4) from the Portland Metro region

A BETTER DAMAGE ASSESSMENT 28
(Appendix C) will ascertain perspective and coordination of other regional partners in emergency
services. The design of the research supported the research questions presented.
Literature Review
While the literature review set the foundation from the historical perspective in regards to
rapid damage assessment tools and standards as well as potential impacts from disasters, in-depth
assessment and comparison to other fire departments, both locally and nationally, establishes the
quality and consistency of TVF&R’s program. Much of the literature available is anticipated to
be from government and emergency service providers. An academic search is necessary to find
other documents from a scientific perspective for anticipation of incident magnitude and
duration. Because there have been limited natural disasters that are long-lasting in the United
States, a limited amount of non-theoretical information is available for the PNW. The literature
will focus on the following areas: (a) geological profile of the region, (b) necessary
characteristics for a rapid damage assessment tool, and (c) standards available from other fire
departments in the region and nation in regards to damage assessment or windshield surveys.
Survey Instrument
A Zoomerang® survey developed by the author to ascertain current practices from other
regions and fire departments is distributed to develop a data set of current and accepted practices
in disaster assessment. The surveys (Appendix D and E) are designed to be sent to local and
regional fire departments and emergency managers; they contained questions consistent with the
research questions and were presented without bias. Many of the departments surveyed are from
the PNW and are used because of similar demographics, geological profile, and disaster types.
This targeted distribution is deemed broad enough to evaluate current practices at TVF&R with
regional and national departments to maintain consistency.

A BETTER DAMAGE ASSESSMENT 29
Limitations and Assumption
The limitations and assumptions of this research are relative to the limited availability of
literature and studies pertaining to disaster response, specifically, outside the emergency services
professions. Until greater information is specific to disaster response coordination, the
uniqueness of the industry will allow for varied interpretation and application of data derived for
issues. The information compiled was interpreted by the author in coordination with TVF&R’s
Emergency Manager to assure proper interpretation of data, standards, and recommended
enhancements of the current rapid damage assessment tools; consequently, there may be some
inherent bias towards current District standards.
A limitation anticipated is the inconsistency from department to department and the lack
of private industry providing a comparable service. Additionally, there is not a standard for
terminology that has been adopted by all emergency services throughout the country; therefore,
there is a need to establish a consistent set of terminology for data to be reliably evaluated.
As with all research for a target issue, assumptions are made sometimes falsely. The
ability to compare one city to another is difficult, even for the same demographics. The
standards for assessing damage following a disaster within the first fire hours has changed over
the years; therefore, the foundational literature is targeted to be approximately less than 10 years
old. This information is considered to be relevant today and used as foundational.
Another assumption is that all interviewees were honest and forthcoming with
information that was with understanding and knowledge of their organization’s opinion or
position on the topics asked. Assumptions are made about the reliability of the research and
quality of the research; thus, only peer reviewed articles were used for the literature review.
Results are assessed objectively from the perspective of the citizen’s and community's response

A BETTER DAMAGE ASSESSMENT 30
needs in regards to disaster assessment time while keeping a balance of the other competing
needs for emergency responders following major disasters.
Results
The results of this research are a culmination, in part, of a literature review, internal
document search of TVF&R, a distributed survey (n=150), and personal interviews (n=4). The
research questions, with associated research method, used for this paper are: (a) what is the
region's geographical and historic susceptibility to natural disasters, research conducted through
a literature review; (b) what are the standards for rapid damage assessment including forms used
by first responding companies at TVF&R, research conducted through an internal TVF&R
review; (c) what standard(s) or procedure(s) are used by other fire departments in the Pacific
Northwest to conduct a rapid damage assessment, research conducted through personal
interviews and surveys; and (d) what national standard(s) or procedure(s) exist to conduct a rapid
damage assessment, research conducted be distributing a survey?
Research Question 1:
Research question 1: What is the region's geographical and historic susceptibility to
natural disasters?
The Pacific Northwest and the Portland Metro region are within the “Ring of Fire”
volcanoes and have major fault lines running through the area. Figure 1 shows the “Ring of
Fire” in relation to the cities and major geographical structures. In addition to the volcanoes,
Attachment A and B show the Juan de Fuca fault lines and activity that run the region. The
activity associated with this fault line has increased over the past few decades. According to
Science Daily (2010), the Pacific Northwest has odds of a 1 in 3 chance that a mega-earthquake
will hit within the next 50 years. Recent climate changes have also caused scientists to

A BETTER DAMAGE ASSESSMENT 31
reconsider the impacts of rising ocean waters, weather patterns, and other season changes
(Ruggiero, 2010). Ruggiero describes the possibility of waves in the 55 foot height range in the
future, and goes on to explain that the “possible causes might be changes in storm tracks, higher
winds, more intense winter storms, or other factors… probably are related to global warming, but
could also be involved with periodic climate fluctuations such as the Pacific Decadal Oscillation,
…what is clear is the waves are getting larger.”
The region has seen a shortening of the summer season with an increase in storms
associated with fall, winter, and spring; this has brought increased rains, wind, and colder
temperatures. Each of these alone can increase the chances for natural disasters, but all together,
which has been seen, dramatically increases the potential. TVF&R has used hazard modeling
tools to rate the vulnerability of the District; the indexes show vulnerability in several areas
(Attachment E).
Research Question 2:
Research question 2: What are the standards for rapid damage assessment including
forms used by first responding companies at TVF&R?
The Office of Emergency Management (OEM) for TVF&R has worked cooperatively with
Integrated Operations (iOps) to develop protocols to guide the District during major events
including manmade and natural disasters. The regional fire agencies have worked together to
complete a set of common Fire Rescue Protocols (FRP) so all the agencies operate in a similar
manner during all incidents. The FRPs specifically contemplate and guide major events. “In a
catastrophic event, such as a severe earthquake, dispatch functions may not be operating. This
requires crews to drive their first response area to identify, prioritize, and manage incidents on
their own” (TVFR, 2011). It goes on to give direction for company officers and duty chiefs to

A BETTER DAMAGE ASSESSMENT 32
operate during times of limited dispatch connection; there is a transition from normal to disaster
mode (Attachment F):
• It identifies immediate actions required of incident managers and company officers to
preserve the emergency resource capabilities of TVF&R.
• It supersedes normal procedures.
• It continues until otherwise determined by the Chief or the Incident Commander (IC).
Such determination can allow varying degrees of return-to-normal operations in
geographic areas of the District.
Associated with the FRP are guidelines for company officers and duty chiefs to perform during
these events. The guidelines are broken down into worksheets and windshield survey maps
(Attachments G, H, and I).
First due companies are expected to complete the assigned windshield survey before
rendering aid. When asked, many company officers voice this as a concern because of the
public’s lack of awareness and the innate desires of the firefighters to support others in need.
The station Captain is responsible for suggesting which structures are included in the windshield
survey; very few have received training or education as to the selection of the structures. There
is a wide discrepancy between stations as to what is included.
Research Question 3:
Research question 3: What standard(s) or procedure(s) are used by other fire departments
in the PNW to conduct a rapid damage assessment?
While all emergency services and many city public works providers are involved in
damage assessments or response following an event, 87.9% (n=95) of the survey respondents

A BETTER DAMAGE ASSESSMENT 33
that provided a rapid damage assessment were fire agencies. There is the opportunity for citizens
within TVF&R’s jurisdiction to participate in CERT and assist in damage assessment; however,
there have not been collective drills to assess the coordination of these citizen’s efforts.
Throughout the PNW, those departments protecting urban and suburban areas use career
companies to provide the assessment when an assessment exists. Of the 150 respondents, 28%
(n=42) did not have an assessment plan in policy; this included major populations with full
career departments.
Predominately, the Emergency Operations Centers (EOC), 71.1%, are responsible for
either assigning crews or collecting the reports from the surveys while only 11.5% are fire
department driven. This dichotomy within the EOCs is interesting from the Emergency
Manager’s (EM) perspective because those surveyed were adamant, 3 out of the 4 surveyed, that
all emergency services were used for damage assessment. All of the EMs agreed that a better job
could be done when coordinating the sharing of report information in a timely manner, whether
electronic or otherwise. This sharing of information is recommended to begin during the
preplanning phase and continue throughout any major events was also agreed upon by all EMs.
The greatest weakness among those departments that provide rapid damage assessments
is the use of consistent, FEMA, forms during the assessment; furthermore, many, 91.3%, of those
same jurisdictions did not have preplanned routes for companies to take for damage assessments.
One advantage that the Metro OEM has is the availability of regional target hazard electronic
mapping system that all agencies in the Portland Metro region can access and update. Upon
initial review, the City of Portland had the majority of the detail with very little from TVF&R,
Clackamas Fire District #1, or Clark County. All of the mapping nomenclature is consistent with
FEMA standards.

A BETTER DAMAGE ASSESSMENT 34
Research Question 4:
Research question 4: What national standard(s) or procedure(s) exist to conduct a rapid
damage assessment?
The demographics of the respondents were predominately from career departments
(57.3%), combination departments (35.3%), and volunteer departments (7.3%). These
departments conduct a drill to refresh the system every one to two years. Consistent with the
PNW, the fire service was the agency most likely to provide the damage assessment;
furthermore, the reports were given to the EOC or IC in most cases.
Following national standards is important so communities can receive federal recovery
funding (FEMA, 2008). The requirements include a good tracking method to demonstrate
damage of buildings and infrastructures in the impacted area. The forms and information that
would be covered in a NIMS planning document would be appropriate. Additionally, all costing
for personnel and logistical expenditures would also be appropriate. An evaluation of
departments from across the country revealed many departments have a structured rapid damage
assessment process (80%); however, slightly less than half (46.2%) use the standard FEMA
Rapid Damage Assessment form. Survey results showed that those that do not use the standard
form collect the same data. The greatest discrepancy is the nomenclature that departments use to
denote target hazards or critical infrastructure.
Departments that conduct a windshield or damage assessments use the front line fire
department apparatus (92%) completing routes to assess buildings either preplanned (35%) or
assigned by the IC (56%); the remaining assessment area was geographical in nature without a
specified group of buildings or infrastructure to assess. 95% of the organizations surveyed stated
that response companies were given latitude to stop and render aid while completing the damage

A BETTER DAMAGE ASSESSMENT 35
assessment and continue to use a common dispatch protocol if available immediately following a
catastrophe. Upon further questioning of the EMs, there are no plans in place to complete the
initial damage assessment if the response crews stop to render assistance before the assessment is
completed.
Discussion/Implications
It is clear from the literature review, personal interviews, and TVF&R data that there is
an the opportunity to improve the rapid damage assessment process while meeting the
community response expectations during a disaster and maintaining or improving partnerships
with other governmental agencies. TVF&R has committed to the citizens they serve to provide
exceptional service and to support them through partnerships and prevention activities (TVF&R,
2009).
The research questions intended to initially set a foundation, creating a logically defined
need for an emergency services organization in the PNW to provide a rapid damage assessment
following a manmade or natural disaster. Following the establishment of the foundational need,
the question of how effective is TVF&R’s rapid damage assessment, the windshield survey,
compared to other rapid damage assessment processes from the PNW and the nation.
TVF&R is within the “Ring of Fire” region of the world with potential impact from
volcanic or tectonic plate activity (Brantley, 2003; Tilling, et.al., 2003; Rosenberg, 2011; Noson,
et.al., 2003). In addition to these disasters, Komar, et.al. (2011), agrees with others that the
climate changes that occurred will change the stability of the PNW (Bumbaco & Mote, 2010).
With this change comes the potential for increased natural disasters throughout the year,
droughts in the summer with increased erosion to flooding and the effects of super saturated soil
in the fall and winter months. Depending on the severity and duration of these phenomena the
A BETTER DAMAGE ASSESSMENT 36
need for a flexible damage assessment tool becomes necessary. TVF&R is one of the leaders in
the PNW; therefore, the Incident Management Teams (IMT) from TVF&R are called upon to
provide structure during a disaster. The Vernonia flood of 2007 was a prime example. While
this community was outside TVF&R’s jurisdiction, crews and an IMT were dispatched to
perform a rapid damage assessment, triage, and initial documentation of the disaster magnitude.
The flood in Vernonia was the most recent time when TVF&Rs damage assessment and
disaster response procedures were tested. The opportunity for regular drilling is always available
to evaluate a process, but responding to an actual event will provide valuable insight into the
areas of opportunity for improvement. It was found that the current system worked well but had
areas that could be improved. Documentation consistent with FEMA regulations and verbiage
was one such area. While it was demonstrated by survey results and national regulations that an
exact standard form is not necessary, a document that tracks conditions before, immediately
following, and continuing throughout recovery phase of a disaster to include information that is
consistent with preferred federal verbiage streamlines the funding mechanisms to the
community. TVF&R’s forms were found to have many of the elements necessary, but there was
an educational component missing in the newest officers and IMT members of how best to
gather and document that information.
Survey results confirmed that while TVF&R’s process was consistent with processes
from region as well as the nation, the processes could be better and shared for the betterment of
the community. The greatest opportunity was a creating or leveraging partnerships between law
enforcement, public works, citizen groups (i.e. CERT), and the fire service for providing and
communicating the rapid damage assessment information. Coordination of each of these
agencies generally comes after a city or county EOC is established; consequently, this is well

A BETTER DAMAGE ASSESSMENT 37
after the initial assessments occur. As with any incident, one that starts strong and well
organized has a better chance for a successful outcome. This philosophy is no different for
disasters.
The first area of enhancement this research demonstrates is the mapping system for the
assessment. Consistency can be improved by the use of the region’s collective GPS database.
Updating this program by all partners will provide better direction of necessary buildings and
structures following an event. Many times the priorities of each agency conflict with one
another. Additionally, the myopic views of one agency can overlook a high priority of another
agency without communication mechanisms to reduce those chances. A common platform for
sharing information reduces the chances of mis-communication; the Portland Metro region is
fortunate enough to have one such system. Once a common map can be produced, it can be
shared and coordinated between responding groups to better cover the geographical area without
redundant assessments by each individual group.
The second area supported by this research is that direction is needed on how to address
the response crews being able to complete the necessary damage assessment while also being
able to provide initial assistance to those citizens in need. This is an organizational question that
was not explored in this research but is necessary for ultimate success of the damage assessment
process.
The final area of opportunity presented from this research is the greater partnership with
other agencies through regular drills. The communities that spent time with early coordination
and communication were demonstrated to have hadbetter outcomes during actual events (Ganz,
1998; McCormick, 2010; Wood, 2010; American Red Cross, 2003). While the Portland metro
region works together on many issues, the Office of Emergency Management is predominately

A BETTER DAMAGE ASSESSMENT 38
the only group working to bring all the agencies together for disaster preparedness. Surveys
showed this responsibility belonging to this group, and rightfully so; however, they alone cannot
create change. The fire service is a logical first partner to lead the way because it was
demonstrated that the collection of initial damage assessment was provided by them.
In summary, as the International Association of Fire Chiefs states “the role of the fire
service as America’s first responder demands a level of equipment, training and related support
to effectively meet those responsibilities, to serve communities and the country during times of
significant events,” so, too, must the each department predicate response to that established role
(2002, p. 4). It is our responsibility as leaders of the fire service to provide our citizens with the
best support during all emergency events, large or small. The PNW is in danger of experiencing
a catastrophic event in the foreseeable future. TVF&R has a strong foundation for disaster
response with established protocols and processes which is consistent with the national fire
service. It too has the opportunity to further evaluate and improve the processes for enhanced
response and support of the citizens they are sworn to protect. This research provides direction
and data driven support for potential improvements to TVF&R’s system.
Recommendations
The purpose of this research paper was to provide data supported evidence to assess the
efficacy of TVF&R’s Rapid Damage Assessment policies and procedures following a manmade
or natural disaster. Each of the research questions were designed to create information necessary
for TVF&R to evaluate the initial windshield surveys provided by the crews and the forms used
to report the findings. Based on the research presented, the following recommendations are
supported:
(a) Continue the use of the windshield survey performed by the first due companies.

A BETTER DAMAGE ASSESSMENT 39
(b) Re-evaluate and update the list of “target hazards” on the windshield surveys in
coordination with the EMs in the area, more specifically, the EM for TVF&R. This re-design or
listing of target hazards should comply with DHS and FEMA recommended symbols and
nomenclature.
(c) Partner with other agencies for the coordination and completion of the rapid damage
assessment following an event. These partnerships should include law enforcement and public
works within TVF&R’s protected cities and counties.
(d) Create a process where information gathered during the damage assessments can be
shared with the other partners, i.e. EOCs, law enforcement, public works, MACs, and/or FEMA.
(e) Develop a joint drill between the above mentioned partners as to the purpose,
development, delegation, and implementation of a regional Rapid Damage Assessment program.
This drill should also include a mechanism to share the information gathered from the individual
assessments into a common data set available to all regional partners.
(f) Work with the Public Information Officers to develop a public education campaign
discussing the timeliness and availability of emergency services immediately following a major
event. This education should explain the damage assessment process and how, when completed
in a timely manner, will reduce both the time to gain assistance and improve recovery efforts.

A BETTER DAMAGE ASSESSMENT 40
References
American Red Cross. (2003). Damage Assessment (ARC 30-3049) [Brochure]. Retrieved
September 15, 2011, from redcross.org Web site: https://arcims.redcross.org/website/
Maps/Documents/A30-3049_Nov2003.pdf
Brantley. (2003, May 13). Ring of Fire. Retrieved September 15, 2011, from USGS.gov Web
site: http://vulcan.wr.usgs.gov/Glossary/PlateTectonics/description_plate_tectonics.html
Bumbaco, K. A., & Mote, P. W. (2010). Three Recent Flavors of Drought in the Pacific
Northwest. Journal of Applied Meteorology & Climatology, 49(9), 2058-2068.
doi:10.1175/2010JAMC2423.1
DHS. (2008, January). National Response Framework. Retrieved September 15, 2011, from
FEMA.gov Web site: http://www.fema.gov/pdf/emergency/nrf/nrf-core.pdf
Disaster. (2011). In Dictionary.com. Retrieved September 30, 2011, from dictionary.com Web
site: http://dictionary.reference.com
Earthquakes. (2011). In Dictionary.com. Retrieved September 30, 2011, from dictionary.com
Web site: http://dictionary.reference.com
Fault Lines. (2011). In Dictionary.com. Retrieved September 30, 2011, from dictionary.com
Web site: http://dictionary.reference.com
FEMA. (2007, June). Robert T. Stafford Disaster Relief and Emergency Assistance Act, as
amended, and Related Authorities. Retrieved September 15, 2011, from FEMA.gov Web
site: http://www.fema.gov/pdf/about/stafford_act.pdf
Ganz, M. (1998). Analyzing the Effectiveness of Rapid Damage Assessment Procedures and
Forms that are Currently Utilized by the Redmond, Washington, Fire Department
(National Fire Academy). Emmitsburg, MD: Executive Fire Officer Program.
A BETTER DAMAGE ASSESSMENT 41
Grendze, P. (2011). Developing a rapid damage assessment guideline for the City of Mentor
(National Fire Academy). Emmitsburg, MD: Executive Fire Officer Program.
Hard, D. (2007). Developing a rapid damage assessment procedure for Klamath County Fire
District No. 1 (National Fire Academy). Emmitsburg, MD: Executive Fire Officer
Program.
IAFC. (2002). Policy Statement [Brochure]. Washington, DC: Author.
Komar, P. D., Allan, J. C., & Ruggiero, P. (2011). Sea Level Variations along the U.S. Pacific
Northwest Coast. Journal of Coastal Research, 27(5), 808-823. doi:10.2112/
JCOASTRES-D-10-00116.1
Korkmaz, K., & Kutay, M. (2010). Automated Hazard Assessment Techniques Using Satellite
Images Following the 2008 Sichuan China Earthquake. Human & Ecological Risk
Assessment, 16(3), 463-477. doi:10.1080/10807031003779831
Luino, F., Cirio, C., Biddoccu, M., Agangi, A., Giulietto, W., Godone, F., & Nigrelli, G. (2009).
Application of a model to the evaluation of flood damage. Geoinformantica, 13(3), 339-
353. doi:10.1007/s10707-008-0070-3
Magnitude. (2011). In Dictionary.com. Retrieved September 30, 2011, from dictionary.com Web
site: http://dictionary.reference.com
McCormick, M. (2010). Development of a rapid damage assessment procedure for the City of
Santa Rosa Fire Department (National Fire Academy). Emmitsburg, MD: Executive Fire
Officers Program.
McLaughlin, R. (2011). Galen and the Great Fire of Rome. History Today, 61(9), 27-33.
Retrieved from EBSCOhost.

A BETTER DAMAGE ASSESSMENT 42
National Fire Academy. (2008). Executive Fire Officer Program (Operational policies and
procedures). Emmitsburg, MD: National Fire Academy.
National Fire Academy. (2009). Executive Analysis of Fire Service Operations in Emergency
Management - Student Manual (2nd ed.). Emmitsburg, MD: National Fire Academy.
Noson, L. Q. (1998). Washington State Earthquake Hazards. Olympia, WA: Washington
Department of Natural Resources.
Noson, L., Qamar., & Thorsen. (2003, May 13). Earthquakes and Plate Tectonics. Retrieved
September 15, 2011, from USGS.gov Web site: http://vulcan.wr.usgs.gov/Glossary/
PlateTectonics/description_plate_tectonics.html
Peck, W. (2010). Factsheet [Brochure]. Tigard, OR: Tualatin Valley Fire & Rescue.
Planitz, A. (1999). A Guide to Successful Damage and Needs Assessment. In Provention
Consorstium. Retrieved September 15, 2011, from proventionconsortium.org Web site:
http://www.proventionconsortium.org/themes/default/pdfs/guide_damage.pdf
Rosenberg, M. (2011). Pacific Ring of Fire. In About.com. Retrieved September 30, 2011, from
about.com Web site: http://geography.about.com/cs/earthquakes/a/ringoffire.htm
State of Oregon. (2011, August 30). Oregon Emergency Response System (OERS). Retrieved
September 15, 2011, from www.oregon.gov Web site: http://www.oregon.gov/OMD/
OEM/tech_resp/oers.shtml
Tilling, Heliker., & Wright. (2003, January 27). Active Volcanoes and Plate Tectonics. Retrieved
September 30, 2011, from USGS.gov Web site: http://vulcan.wr.usga.gov/Glossary/
PlateTectonics/Maps/map_plate_tectonics_world.html
Tualatin Valley Fire, & Rescue. (2009). Strategic Plan (Strategic Plan 2009). Tigard, OR:
Author

A BETTER DAMAGE ASSESSMENT 43
U. S. Fire Administration. (2011). United States Fire Administration strategic plan. Emmitsburg,
MD: USFA.
USGS. (2005). PNSN - Pacific Northwest Seismograph Network. Retrieved September 30, 2011,
from USGS.gov Web site: http://pubs.usgs.gov/fs/2004/3073/images/Network_opt.jpg
Vu, T., & Ban, Y. (2010). Context-based mapping of damaged buildings from high-resolution
optical satellite images. International Journal of Remote Sensing, 31(13), 3411-3425.
doi:10.1080/10431161003727697
Willingham, W. (2008). Willamette River Flood of 1996. In The Oregon Encyclopedia.
Retrieved September 30, 2011, from oregonencyclopedia.org Web site: http://
www.oregonencyclopedia.org/entry/view/willamette_river_flood_of_1996/
Wood, S. (2010). Earthquake infrastructure and facility windshield rapid assessment for the
Brea Fire Department (National Fire Academy). Emmitsburg, MD: Executive Fire
Officer Program.

A BETTER DAMAGE ASSESSMENT 44
Appendix A
Active Northwest Tremors

A BETTER DAMAGE ASSESSMENT 45
Appendix B
Portland Metro Fault Lines

A BETTER DAMAGE ASSESSMENT 46
Appendix C
Interviewees
1. Internal TVF&R
a. Jeff Rubin
Emergency Manager, TVF&R
b. David Houghton
Emergency Manager, Multnomah County
2. External from TVF&R
a. Steve Muir
Emergency Manager, Washington County
b. Mike Mumaw
Emergency Manager, City of Beaverton

A BETTER DAMAGE ASSESSMENT 47
Appendix D
General Damage Assessment Survey

A BETTER DAMAGE ASSESSMENT 48

A BETTER DAMAGE ASSESSMENT 49
Appendix E
Regional Assessment Survey

A BETTER DAMAGE ASSESSMENT 50

A BETTER DAMAGE ASSESSMENT 51
Appendix F
TVF&R Vulnerability Indexes
TVF&R Hazard Vulnerability Analysis A hazard analysis allows TVF&R to focus its energy and resources on those hazards that are most likely and that would have the most serious impact on its citizens. The following analysis is a broad overview of the hazards that may affect the District, considered in terms of their potential impact on District operations and the people it serves. Given District size and geographic/physiographic diversity, it is important to recognize that each hazard covers a range of probabilities and vulnerabilities (e.g., Skyline has a much greater wildfire hazard than central Beaverton). Additional details and considerations may be found in the hazard-specific annexes. Geographic description The District serves a population of approximately 450,000, covering a total land area of approximately 210 square miles (Figure 1). The District spans suburban through rural/frontier environments, including portions of several major highways (Interstates 5 and 205, State Highways 8, 10, 43, 99W, 210, and 217), rail lines (commuter, passenger, and freight), and approaches for Portland and Hillsboro International Airports. Detailed information on specific areas may be found in county Natural Hazard Mitigation Plans for the counties and, where they have been completed, cities within the District. Analysis Category totals are determined by multiplying the weighting factor by the severity rating for each criterion listed (higher scores indicate greater risk). The results are listed in descending order of core. Severity Rating Low 1-3 points Medium 4-6 points High 7-10 points Event history (weighting factor = 2): based on significant events per 100 years. Low 0-1 event/100 years Medium 2-3 events/100 years High 4+ events/100 years Vulnerability (weighting factor = 5): based on estimated percentage of population or property likely to be affected by the incident. Low <1% affected Medium 1-10% affected

A BETTER DAMAGE ASSESSMENT 52
High >10% affected Maximum Threat (weighting factor = 10): also based on affected population or property. Low <5% affected Medium 5-25% affected High >25% affected Probability (weighting factor = 7): based on the likelihood of another occurrence with significant District impact within a specified period of time. Low ≤ 1 chance/50 years (≤ 2% annual) Medium > 1 chance/50 years (> 2% annual) High > 1 chance/10 years (> 10% annual) 1. SEVERE WEATHER: includes windstorms, snow and ice storms, and extended periods of extreme heat or cold, but not floods. Extreme heat events are considered in terms of their impact on District residents, but not in conjunction with either drought or increased fire risk. History-High (18 points) Vulnerability-High (35 points) Maximum Threat-High (90 points) Probability-High (56 points) Total-199 points 2. EARTHQUAKE: includes associated hazards such as landslides and rockfalls that could be triggered by an earthquake. Although the region has a history of small earthquakes, actual damage has been slight. Principal risk resides with a Cascadia Subduction Zone earthquake, possibly in excess of Magnitude 9, and with local crustal earthquakes that could cause more local but less regional impact. History-Low (6 points) Vulnerability-High (50 points) Maximum Threat-High (100 points) Probability-Low (7 points) Total-163 points 3. INFECTIOUS DISEASE OUTBREAK: includes pandemics, other novel disease outbreaks (e.g., SARS), and large-scale food- and water-borne disease outbreaks, but not seasonal disease cycles or acts of terrorism. History-Medium (12 points) Vulnerability-Low (15 points) Maximum Threat-High (100 points) Probability-Medium (35 points) Total-162 points

A BETTER DAMAGE ASSESSMENT 53
4. HAZARDOUS MATERIALS: includes fixed-site and transportation incidents as well as drug labs, but not acts of terrorism. TVF&R’s Fire Prevention Division maintains information on sites using/storing hazardous materials; this information is supplied by businesses as required by state and federal law. Fire Prevention, in coordination with TVF&R’s Hazardous Materials Team, also works with law enforcement to maintain awareness on non-reporting sites such as clandestine drug labs. History-High (14 points) Vulnerability-High (35 points) Maximum Threat-Medium (60 points) Probability-High (49 points) Total-158 Points 5. UTILITY FAILURE: includes shortage or loss of power for periods > 24 hours, and shortages of fuels, pipeline interruptions (except for those that qualify as hazmat), such as oil, gasoline, and diesel. History-Low (6 points) Vulnerability-Medium (30 points) Maximum Threat-High (80 points) Probability-Medium (28 points) Total-144 points 6. VOLCANIC ACTIVITY: includes ash-fall that might result from an eruption of Mt. Saint Helens or Mt. Hood. The District does not have any direct exposure to lahars or lava flows. History-Medium (8 points) Vulnerability-High (40 points) Maximum Threat-High (80 points) Probability-Low (7 points) Total-135 points 7. FIRE: level II urban and interface fires are relatively common within the District. Most are handled easily through mutual aid without activation of this plan. The District faces a threat of wildland/urban interface fires from large areas of mostly undeveloped property within and adjacent to District boundaries, in incorporated and unincorporated areas. History-High (16 points) Vulnerability-Medium (25 points) Maximum Threat-Medium (50 points) Probability-High (49 points) Total-140 points

A BETTER DAMAGE ASSESSMENT 54
8. FLOOD: the District contains substantial portions of two rivers (Willamette and Tualatin) and several smaller streams that are subject to flooding. Despite flood controls, there is a history of minor and severe flooding (the last severe flood causing significant damage to Tualatin in 1996). Flooding related to dam failure is considered separately in this analysis. History-High (20 points) Vulnerability-Medium (25 points) Maximum Threat-Medium (50 points) Probability-Medium (42 points) Total-137 points 9. CIVIL DISTURBANCE/TERRORISM: includes riots, violent protests or strikes, and acts of terrorism, as well as related infrastructure disruptions (regardless of where they occur). History-Low (4 points) Vulnerability-Low (15 points) Maximum Threat-High (90 points) Probability-Low (14 points) Total-123 points 10. TRANSPORTATION: non-hazmat incidents involving automobiles, aircraft, and rail. History-High (20 points) Vulnerability-Low (5 points) Maximum Threat-Low (20 points) Probability-High (70 points) Total-115 points 11. DROUGHT: extreme and prolonged drought may threaten drinking water and fire suppression supplies, as well as water-dependent agriculture and industry. History-Medium (8 points) Vulnerability-Medium (20 points) Maximum Threat-Medium (40 points) Probability-Low (14 points) Total-82 points 12. DAM FAILURE: includes the Tualatin River basin downstream from Scoggins Dam and any of the hydroelectric dams on the Clackamas River (directly affecting a very small portion of West Linn). History-Low (2 points) Vulnerability-Low (5 points) Maximum Threat-Low (10 points) Probability-Low (7 points) Total-24 points

A BETTER DAMAGE ASSESSMENT 55
Appendix G
Excerpt from FRP – Major and Disaster Operations
PROCEDURES 1. FACILITY DAMAGE CONTROL PLAN
The Facility Damage Control Plan is a pre-planning function to be developed and maintained by the Chief Officer responsible for each District facility. For stations, it is the Station Captain. Facility Damage Control Plan: It outlines the potential problems at the facility, addresses personnel safety, facility issues and equipment following a major emergency or disaster. The plan includes:
A. Accounting for Personnel
B. Structural Surveys of the Facility
C. Apparatus Checks (if applicable)
D. Communication Availability
E. Hazardous Areas
F. Safe Areas
G. Emergency Power
H. Condition of Fuel Tanks
I. Use and Disbursement of Emergency Provisions
J. Facility-specific items that are relevant to efficient and safe operations. In addition, a list of actions to be taken to ensure the in-service status of the assigned unit(s) shall be listed by priority. Station Captains and Chief Officers must review and update the Facility Damage Control Plan by January 1 each year.
For stations, a copy of the plan with a copy of their windshield survey rate is to be placed with the move up maps in or near the apparatus bay, as well as in the online First-In Guide . The supervising Duty Chief reviews and maintains a copy of the plans submitted in their Battalion. For other District facilities, the responsible Chief Officer designates an appropriate location for the plan.
2. MODES OF OPERATION
A. There are four operational modes that determine how resources are assigned. All companies must monitor Dispatch to determine the operational mode in effect. See Diagram 1.
i. Normal Operations:
FireComm dispatches companies per routine protocols. Normal communications are functioning.

A BETTER DAMAGE ASSESSMENT 56
ii. Expanded Operations:
iii.
FireComm and normal communications are functioning. High demand for single discipline (Fire, LE, PW – most likely Fire activation is for major wildland incident in county); other disciplines functioning normally. IMT assigned through Fire Defense Board to staff Expanded Dispatch at 9-1-1 center (WCCCA or C-COM). FOC may be activated.
Major Emergency Operations:
iv.
FireComm and normal communications are functioning. FireComm dispatches companies, via incident prioritization (see Section 8). In this situation, typically only one apparatus is dispatched to assess the situation and request additional resources. Companies have latitude to take action on any situation that is immediately life threatening. Action is limited to only that which is necessary to render the situation non-life threatening. Companies will be available for immediate response to higher priority incidents.
Disaster Operations:
• In Disaster Operations mode, Duty Chiefs coordinate all resources and incidents in their Battalion. Duty Chiefs are the point of all operational and support issues in their Battalion.
Normal communications are not functioning. FireComm is not receiving 9-1-1 calls or not able to dispatch calls. In this mode, companies should conduct a windshield of their first response area, prioritizing incidents they come across, and respond accordingly. Company Officers must use voice communications only, and should attempt to relay findings and actions to their Duty Battalion Chief. Companies may only be able to use Simplex channels (Simplex 1-3) or Training 1 for communications. To the extent possible, Company Officers should log incidents.
B. Duty Chiefs may change the operational mode, based on further knowledge of the overall situation, and consultation with each other. If an IMT or the FOC has been activated, the IMT/FOC should be consulted as well.
3. ACTIVATION
A. Major Emergency Operations:
i. Activation by Duty Chiefs: The Duty Chiefs, in consultation with one another, may activate this procedure when appropriate, but are expected to consult with District Chiefs and/or the on-call IMT IC if circumstances permit.
ii. A Duty Chief should direct FireComm to implement ‘Major Emergency’ guidelines. In addition, the Duty Chief initiates activation of this procedure by tapping out the on-call IMT from a District computer, via FireComm, or by contacting the on-call IMT IC. The IMT reports to TVF&R’s FOC, or an alternate site designated by the implementing Chief.
iii. Activation by Administrative Staff: The Fire Chief, Deputy Chief, Assistant Chiefs, or on-call IMT Incident Commander may initiate activation.
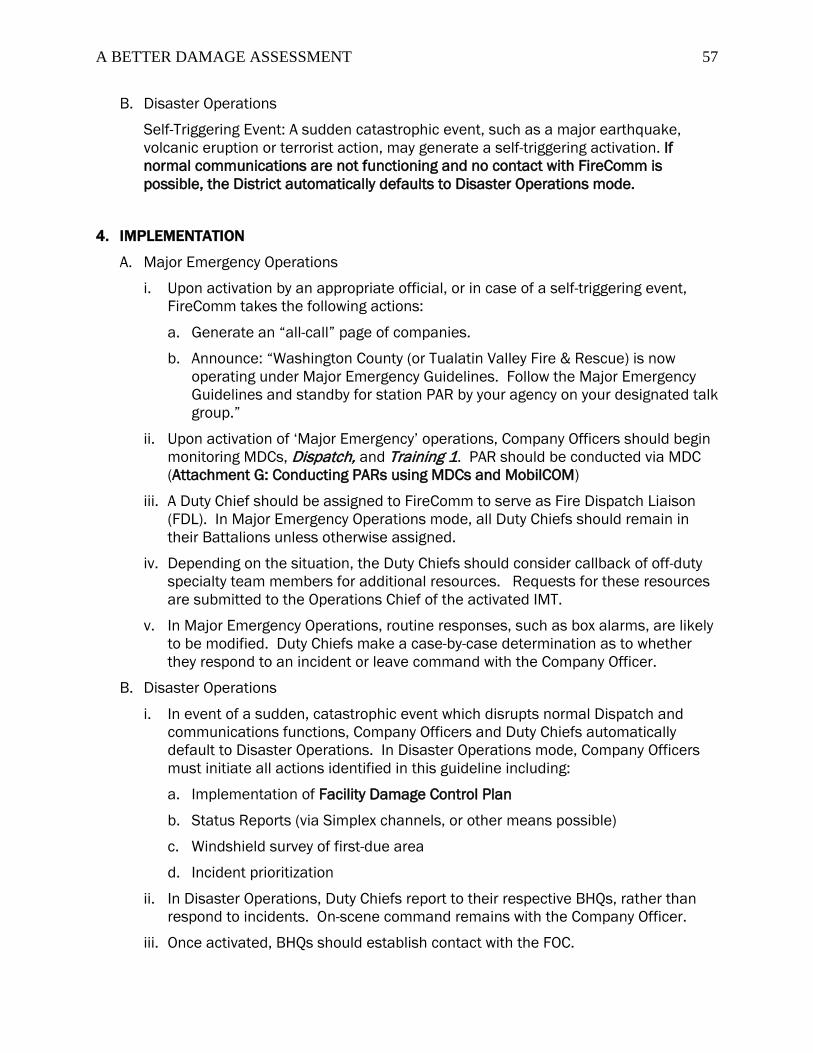
A BETTER DAMAGE ASSESSMENT 57
B. Disaster Operations
Self-Triggering Event: A sudden catastrophic event, such as a major earthquake, volcanic eruption or terrorist action, may generate a self-triggering activation. If normal communications are not functioning and no contact with FireComm is possible, the District automatically defaults to Disaster Operations mode.
4. IMPLEMENTATION
A. Major Emergency Operations
i. Upon activation by an appropriate official, or in case of a self-triggering event, FireComm takes the following actions:
a. Generate an “all-call” page of companies.
b. Announce: “Washington County (or Tualatin Valley Fire & Rescue) is now operating under Major Emergency Guidelines. Follow the Major Emergency Guidelines and standby for station PAR by your agency on your designated talk group.”
ii. Upon activation of ‘Major Emergency’ operations, Company Officers should begin monitoring MDCs, Dispatch, and Training 1. PAR should be conducted via MDC (Attachment G: Conducting PARs using MDCs and MobilCOM)
iii. A Duty Chief should be assigned to FireComm to serve as Fire Dispatch Liaison (FDL). In Major Emergency Operations mode, all Duty Chiefs should remain in their Battalions unless otherwise assigned.
iv. Depending on the situation, the Duty Chiefs should consider callback of off-duty specialty team members for additional resources. Requests for these resources are submitted to the Operations Chief of the activated IMT.
v. In Major Emergency Operations, routine responses, such as box alarms, are likely to be modified. Duty Chiefs make a case-by-case determination as to whether they respond to an incident or leave command with the Company Officer.
B. Disaster Operations
i. In event of a sudden, catastrophic event which disrupts normal Dispatch and communications functions, Company Officers and Duty Chiefs automatically default to Disaster Operations. In Disaster Operations mode, Company Officers must initiate all actions identified in this guideline including:
a. Implementation of Facility Damage Control Plan
b. Status Reports (via Simplex channels, or other means possible)
c. Windshield survey of first-due area
d. Incident prioritization
ii. In Disaster Operations, Duty Chiefs report to their respective BHQs, rather than respond to incidents. On-scene command remains with the Company Officer.
iii. Once activated, BHQs should establish contact with the FOC.

A BETTER DAMAGE ASSESSMENT 58
5. PERSONNEL ACCOUNTABILITY REPORT
The Personnel Accountability Report (PAR) is conducted to determine the status of companies following a potentially damaging event. (Diagram 4 – PAR status checklist) A. Fire station/company PAR is conducted by the Battalion Chief or District Chief via
MDCs, using Nextels and Training 1 as backups and/or for exception reporting (e.g., station damage, crews out of service) (Attachment G: Conducting PARs using MDCs and MobilCOM)
B. If one of the Duty Chiefs is not able to assume his duties, a Company Officer or Chief Officer at the BHQ assumes those duties until relieved.
C. During PAR of stations/companies, Duty Chiefs must account for all staffed apparatus, either by the station report or by separately checking with units that might be out of quarters. Immediate follow-up should be initialized by Duty Chiefs for those units not answering PAR.
D. Subsequent PARs may be conducted to further ascertain the status of companies.
E. If an event occurs during normal work hours, District Chiefs are responsible for ensuring that a PAR is conducted for Operating Center staff (including Integrated Operations day staff who may be in the field) on Training 1 (or designated alternate system) after the station PAR.
6. STATUS REPORTS
A. Major Emergency Operations
If a PAR is conducted, Status Reports are given by each station/apparatus/occupied District facility to their Battalion Duty Chief.
i. Status Check: Immediately upon the activation of Major Emergency Operations mode, crews complete a status check of personnel and apparatus using the Facility Damage Control Plan. This information is relayed to the Duty Chief as a status report during PAR.
ii. Status Report: Fire station status reports during PAR must be brief, providing only pertinent, immediate, "need to know" information in the following order (as provided on Company Officer Checklist). The actual verbal report is by negative reporting. Only report those items that are not normal, unit availability, and special comment information, if out of the ordinary.
a. Personnel: Minor injury, major injury, trapped, fatality.
b. Facility: Minor damage, major damage, doors stuck.
c. Power: Auxiliary power, no power.
d. Units Available: Engines, trucks, rescues, relief apparatus (indicate whether staffed.)
e. Special Comment: Briefly report fires and damage visible from station. Do not comment unless important.
f. If status is normal, respond: “Engine 67 available.”

A BETTER DAMAGE ASSESSMENT 59
iii. If structural damage prevents removal of apparatus from a station, personnel shall, if safety permits, retrieve turnouts, breathing apparatus, and portable radios. Determine what assistance is required for extrication of apparatus. Report availability and conditions to the Duty Chief on Training 1.
iv. Following the preparation for PAR and status reports, stations, companies and facilities should monitor CAD and Dispatch for further frequency assignments from the FireComm.
B. Disaster Operations
If companies are unable to establish contact with FireComm or their Duty Chief, companies should consider themselves to be in Disaster Operations mode.
7. WINDSHIELD SURVEY
One of the most important functions for emergency service personnel following a disaster is to evaluate the impact on departmental resources. This assessment may include observations of structural damage, flooding, injuries, access, fire load, water supply, status of critical resources (such as hospitals, power stations, etc.) and status of transportation capabilities with regard to both road accessibility and the operational capability of District equipment. Windshield surveys are cursory procedures conducted to assess the scope of the problem and assist in identifying response priorities in a company's first response area. Following the completion of PAR, crews should be prepared to conduct pre-planned windshield surveys of their first response area, if
When in Disaster Operations mode, Company Officers
directed by the Duty Chief. Duty-crews’ windshield surveys may be supplemented by demand units and uniformed non-response personnel from Integrated Operations and Training.
should automatically initiate a windshield survey
A. A rapid assessment of response areas to determine potential or actual life-threatening situations is essential. This assessment enables the department to prioritize incidents and concentrate resources in areas where life loss potential is greatest. Companies may have to bypass fires, collapsed buildings and other ongoing, non-life threatening emergencies to accurately assess their district for the highest life safety priority.
.
B. As with PAR, windshield survey status reports should be by negative reporting. Only those situations that are NOT normal are reported. Windshield survey status reports should be communicated to the Battalion Duty Chief on Training 1 unless otherwise designated.
C. Assess "critical facilities," transportation, etc. (identified in pre-planning).
D. Identify situations and potential resource requirements based on the windshield survey. Communicate situation status (using negative reporting) and priority needs only to the Duty Chief, as soon as practical.
E. Should the windshield surveys indicate significant damage, a Duty Chief may determine a need to change the mode of operation.

A BETTER DAMAGE ASSESSMENT 60
NOTE: For earthquakes, significant after-shocks may require supplemental windshield surveys.
F. Walk-Ins: If citizens request assistance via direct arrival at a station, or by stopping a company during the windshield survey, companies should render immediate aid if possible. Companies MUST notify FireComm of their status by staying in service to be available to respond to higher priority calls; if there is no contact with FireComm, companies should attempt to notify their Battalion Chief/BHQ. Companies should log all calls. After the emergency phase, companies should contact FireComm for the assignment of incident numbers for these calls. Stations may experience an influx of civilians seeking medical attention and shelter. Triage is a critical factor. Serious injuries and illnesses should be treated to stabilize, with transport handled in the most expedient manner. Minor injuries should be directed to the nearest hospital. Persons seeking shelter should be directed to the nearest facility. Law Enforcement may be requested to assist in this area. The main emphasis must be to keep citizens out of the Fire Stations.
This includes groups of citizens volunteering to assist with response, either ad hoc or as members of Community Emergency Response Teams (CERTs). Stations should not become assembly points for community volunteers.

A BETTER DAMAGE ASSESSMENT 61
Appendix H
Major Emergency Operations – Company Officer and Duty Chief
Begin monitoring Dispatch and Training 1.
• Check functionality of all communications assets (cell, radio, MDC)
Prepare for PAR on MDC (conducted by a Duty Chief) (Attachment G: Conducting PARs using MDCs and MobilCOM).
• Prepare status report for PAR:
o Station completes a status check of personnel, apparatus and station integrity to relay to Duty Chief during PAR. Use Facility Damage Control Plan.
Status report:
• Brief and concise – provide only pertinent/immediate “need to know” information.
• Negative reporting – report only abnormal findings
o Personnel (injury, entrapment, fatality)
.
o Facility (damage, inoperable bay doors)
o Power (regular, auxiliary, none)
o Apparatus (available and staffed)
o Special Comment (visible damage or fire in local area)
Conduct windshield survey of first-response area, if directed by Duty Chief
• Negative reporting – report
:
only abnormal findings
• Relay status reports to Duty Chief on Training 1
.
• Assess “critical” facilities:
o Schools (if in session)
o Hospitals/nursing homes
o Government buildings
o Bridges
o Overpasses
o Hazmat storage facilities
INCIDENT PRIORITIES
• Priority One
•
– IMMEDIATE ATTENTION – Known life-safety risk and/or multiple victims/patients.
Priority Two
•
– Unknown life-safety risk or minor injuries.
Priority Three – Property damage, non-medical alarms, public assistance calls.

A BETTER DAMAGE ASSESSMENT 62
MAJOR EMERGENCY OPERATIONS DUTY CHIEF CHECKLIST
Determine need for implementation of “Major Emergency” guidelines, based on:
• Resource needs cannot keep pace w/ demand.
• Either existing situation or emergency situation w/ potential (e.g., high wind).
NOTE: TVF&R’s policy is to conduct PAR of all companies following a distinguishable earthquake. Many other agencies do not follow such procedures, so Duty Chiefs may need to direct FireComm to have TVF&R companies switch to Training 1 to standby for PAR.
Direct FireComm to implement “Major Emergency” guidelines.
Send “all-call” page (or direct FireComm to send “all-call” page) to on-call IMT (“On-call IMT report to FOC”).
If possible, contact on-call IMT Incident Commander and advise of situation.
Monitor Dispatch and Training 1.
• Duty Chief responsibilities:
o Conduct PAR of Companies on MDCs/MobilCOM (Attachment G); use Training 1 as needed to announce PAR and receive exception reports.
o One Duty Chief (on-duty or called in) should be assigned as Fire Dispatch Liaison (FDL) at FireComm.
Monitor PAR to ascertain status of companies. For any company not answering PAR, initiate follow-up action.
Direct companies to conduct windshield surveys of their first-due area. If windshield surveys indicate significant damage, Duty Chiefs may need to change the operational mode. This should be done in consultation with the District Ops Chief at FireComm.

A BETTER DAMAGE ASSESSMENT 63
DISASTER OPERATIONS COMPANY OFFICER CHECKLIST
In an incident generating failure of 9-1-1 communications and the trunked radio system (most likely scenario being a significant earthquake), Company Officers should:
Begin monitoring Dispatch, Simplex 1 and Training 1. Check status of MDCs, landlines, and cell phones for functionality.
Prepare for PAR (conducted by your Duty Chief). Battalions to monitor Dispatch, Simplex 1 and Training 1. If the radios are not in Failsoft and not functioning, complete the station status check and conduct the windshield survey. All reporting should be conducted on Simplex 1. If radios are in Failsoft, expect a significant amount of system busies.
Prepare status report for PAR:
• Station completes a status check of personnel, apparatus, and station integrity to relay to Duty Chief during PAR. Use Facility Damage Control Plan (Attachment F).
Conduct Windshield Survey of first-response are:
• Negative reporting to BHQs – report only abnormal findings
• Relay status reports to BHQ on Simplex 1, (attempt MDC and Training 1 first).
.
• Assess “critical” facilities:
o Schools (if in session)
o Hospitals/nursing homes
o Government buildings
o Bridges
o Overpasses
o Hazmat storage facilities
INCIDENT PRIORITIES
• Priority One
•
– IMMEDIATE ATTENTION – Known life-safety risk and/or multiple victims/patients.
Priority Two
• – Unknown life-safety risk or minor injuries.
Priority Three – Property damage, alarms (except medical), public assistance calls.

A BETTER DAMAGE ASSESSMENT 64
DISASTER OPERATIONS DUTY CHIEF CHECKLIST
Determine need for implementation of “Disaster Operations” guidelines, based on:
• Failure of the 9-1-1 system, the 800-MHz radio system, or both (most likely scenario is a significant earthquake).
Attempt to check status of FireComm.
Monitor Dispatch and Training 1; when it is confirmed that there is no trunked radio function, monitor Simplex 1.
• Default Duty Chief responsibilities:
o Attempt a PAR of companies on MDCs, Training 1, or, if necessary, Simplex 1.
o Staff Battalion Headquarters (BHQ)
o Initiate Human Repeater Communications Plan (Diagram 5), as needed
Duty Chiefs should monitor incidents and activities in their Battalions. Attempt to assist each other in resource allocation, if communication and incident load allows. Duty Chiefs and their respective BHQs are the focal point for all activities in their Battalion.
Duty Chiefs should attempt to keep the FOC briefed of their Battalions’ status and support requests through non-traditional communications (e.g., satellite phones, Ham Radio, human repeaters, runners, etc.).
When staffing allows, fire stations should have a Station Commander position staffed. This position is the contact point for that station’s status, resource needs, and staffing with their Duty Chief.
Duty Chiefs coordinate the distribution of Specialty Team personnel to each Battalion. Off-duty Specialty Team personnel report to home station per policy.
All Integrated Operations staff are resources for their respective Battalions and should report to their respective BHQs by default under Disaster Operations

A BETTER DAMAGE ASSESSMENT 65
Appendix I
Windshield Survey Examples – Stations 67 and 33