damian oliver tom karmel
TRANSCRIPT

Pre-vocational programs and their
impact on traineeship completion and
satisfaction
Damian OliverTom Karmel
NATIONAL CENTRE FOR VOCATIONAL EDUCATION RESEARCH
NATIONAL CENTRE FOR VOCATIONAL EDUCATION RESEARCH OCCASIONAL PAPER


Pre-vocational programs and their impact on traineeship completion and satisfaction
Damian Oliver Tom Karmel NCVER
The views and opinions expressed in this document are those of the author/
project team and do not necessarily reflect the views of the Australian Government
or state and territory governments.
NATIONAL CENTRE FOR VOCATIONAL EDUCATION RESEARCH
OCCASIONAL PAPER

© Commonwealth of Australia, 2011
With the exception of the Commonwealth Coat of Arms, the Department’s logo, any material
protected by a trade mark and where otherwise noted all material presented in this document is
provided under a Creative Commons Attribution 3.0 Australia
<http://creativecommons.org/licenses/by/3.0/au> licence.
The details of the relevant licence conditions are available on the Creative Commons website
(accessible using the links provided) as is the full legal code for the CC BY 3.0 AU licence
<http://creativecommons.org/licenses/by/3.0/legalcode>.
The Creative Commons licence conditions do not apply to all logos, graphic design, artwork and
photographs. Requests and enquiries concerning other reproduction and rights should be directed
to the National Centre for Vocational Education Research (NCVER).
This document should be attributed as Oliver, D & Karmel, T 2011, Pre-vocational programs and
their impact on traineeship completion and satisfaction, NCVER.
This work has been produced by NCVER on behalf of the Australian Government, and state and
territory governments, with funding provided through the Australian Department of Education,
Employment and Workplace Relations.
The views and opinions expressed in this document are those of NCVER and do not necessarily
reflect the views of the Australian Government or state and territory governments.
ISBN 978 1 921955 61 7 web edition
978 1 921955 62 4 print edition
TD/TNC 104.45
Published by NCVER, ABN 87 007 967 311
Level 11, 33 King William Street, Adelaide SA 5000
PO Box 8288 Station Arcade, Adelaide SA 5000, Australia
P +61 8 8230 8400 F +61 8 8212 3436 E [email protected] W http://www.ncver.edu.au

About the research Pre-vocational programs and their impact on traineeship completion and satisfaction
Damian Oliver and Tom Karmel, NCVER
Pre-vocational programs, including VET in Schools, are providing a pathway into traineeships in the
same way that pre-apprenticeships are an established route into apprenticeships in the traditional
trades. This report is a parallel piece to an earlier report on the effect of pre-apprenticeships on
apprentice satisfaction and completion rates.
Key messages Early school leavers, especially those who leave school after Year 11, are more likely to complete
a traineeship if they have completed a pre-vocational course beforehand.
Trainees in lower-skilled occupational categories such as sales workers, labourers, and machinery
operators and drivers are more likely to complete their training if they have completed a pre-
vocational course beforehand. Pre-vocational programs also increase the likelihood of completing
a clerical and administrative traineeship.
Pre-vocational courses reduce the likelihood of trainees in higher-skilled occupational categories
(such as managers and professionals) completing their training. Pre-vocational programs also
reduce the likelihood of completing a traineeship in community and personal services.
The findings suggest that pre-vocational programs should focus on general employment and
educational skills and give less emphasis to developing advanced occupational skills. They appear
to be more relevant to the lower-skilled section of the labour market, and it could be concluded
that traditional Year 12 is a better preparation for trainees in the more skilled occupations.
Tom Karmel
Managing Director, NCVER


NCVER 5
Contents Tables and figures 6
Introduction 7
Background 9
Participation in pre-vocational programs 9
Satisfaction 10
Completion 14
Reasons for non-completion 18
Final comments 22
References 24
Appendices
A 25
B 26
C 28
D 33

6 Pre-vocational programs and their impact on traineeships
Tables and figures Tables 1 Participation in a pre-vocational program by occupation 9
2 Standardised scoring coefficients for satisfaction with job-related
and training-related aspects of traineeship 10
3 Regression coefficients — satisfaction with job-related aspects of
apprenticeship/traineeship 12
4 Regression coefficients — satisfaction with off-the-job training-related
aspects of apprenticeship 13
5 Net effect of a pre-apprenticeship on trainee satisfaction with
off-the-job training by occupation 13
6 Effect of undertaking pre-vocational program and other variables
on likelihood of completing traineeship 15
7 Probability of completing a traineeship by occupation and whether
undertaken a pre-vocational program 16
8 Highest level of education and average skill level by occupation 17
9 Logistic regression of ‘Main reason for not completing training is
because apprentice didn’t like the type of work or training’ 19
10 Probability of choosing a work or training-related reason as main
reason for not completing a traineeship (%) 20
B1 Individual and employment characteristics of apprentices and trainees,
by whether completed a pre-vocational or pre-apprenticeship course 26
B2 Selected outcomes of trainees, by whether completed a
pre-vocational program 27
C1 Correlation matrix — satisfaction with apprenticeship 29
C2 Reduced correlation matrix — satisfaction with traineeship 30
C3 Rotated factor pattern — satisfaction with traineeship 31
C4 F-test statistics for comparing unrestricted and restricted models
of satisfaction 32
D1 Summary of deviance tests for interaction effects — logistic regression
of likelihood of completing an apprenticeship or traineeship 34
D2 Summary of deviance tests for interaction effects — logistic regression
of main reason for not completing traineeship 34
Figures 1 Impact of pre-vocational programs on reason for non-completion
and likelihood of completion of a traineeship 21
C1 Scree plot of Eigenvalues 30

NCVER 7
Introduction Our recent publication (Karmel & Oliver 2011) examined the impact of pre-apprenticeships on levels
of apprenticeship satisfaction and completion. We found that pre-apprenticeships do have an effect
on apprenticeship completion and satisfaction but the effect is not uniform. Pre-apprenticeships had
a small, positive effect on apprentices’ satisfaction with the job-related aspects of their
apprenticeship but no effect on satisfaction with training-related aspects. In the construction, food
and electrotechnology trades, pre-apprenticeships modestly increased the likelihood of completion.
However, apprentices in the automotive and engineering trades and in hairdressing were less likely to
complete their training if they had undertaken a pre-apprenticeship. Similarly, pre–apprenticeships
led to a higher likelihood of completion among apprentices who had finished Years 10 or 12, but not
for those with post-school qualifications or who left school after Year 11. The variation by occupation
and highest education level demonstrates that not all pre-apprenticeships are working well, leading
us to conclude that their design must be carefully considered.
In this report we extend the analysis to look at analogous programs designed to prepare people for
entry into a traineeship. Our primary intent is whether our findings for apprenticeships translate to
traineeships. We are once more interested in three questions:
Do pre-vocational programs increase the level of trainee satisfaction?
Do pre-vocational programs increase the likelihood of a trainee completing his or her traineeship?
Are trainees who do not complete their training less likely to quit because they didn’t like the
type of work or training if they have completed a pre-vocational program.
We are again interested in possible interaction effects. We consider the interaction of pre-vocational
program with highest education level and occupation, as we did in the pre-apprentice report, as well
as with sex.
The results show that the impact of pre-vocational programs on trainee satisfaction and completion
rates varies according to occupation and highest education level.
There is no substantial impact of pre-vocational programs on trainees’ satisfaction with aspects
relating to their job, although there is an impact in relation to trainees’ satisfaction with aspects of
their off-the-job training. In the case of community and personal service workers and sales workers,
however, it is negative.
Completing a pre-vocational program increases the likelihood of a trainee completing his or her
training among clerical and administrative occupations, machinery operators and drivers, sales
workers and labourers. Pre-vocational programs have a negative impact on completion rates in the
higher-skilled managerial and professional occupations as well as in community and personal
service occupations.
Pre-vocational programs substantially increase the likelihood of completing a traineeship among
trainees who leave school after Year 11, whereas pre-vocational programs reduce the likelihood of
completing a traineeship among trainees who complete Year 12. Pre-vocational programs make a
negligible difference to traineeship completion for trainees who left school after Year 10 as well as to
trainees who already possess a certificate III or higher qualification.

8 Pre-vocational programs and their impact on traineeships
Among trainees who did not complete their training, those who had completed a pre-vocational
program were less likely to quit because they did not like the type of work or training. This effect
was particularly strong among those who had left school after Year 11.
The evidence suggests that pre-vocational programs should be directed to early school leavers
(particularly those who leave after Year 11) who are interested in pursing a traineeship in
occupations requiring lower skill levels (particularly sales workers and labourers) or clerical and
administrative occupations. Pre-vocational programs have little to contribute to prospective trainees
who have completed a post-school qualification or who have completed Year 12. There is evidence
that they do not function well as an extension of the pre-apprenticeship model into higher-level
traineeships, namely, traineeships in managerial and professional occupations. They also perform
poorly in community and personal service occupations. This has implications for the curriculum of
pre-vocational programs, which are briefly discussed in the final comments.
NCVER 9
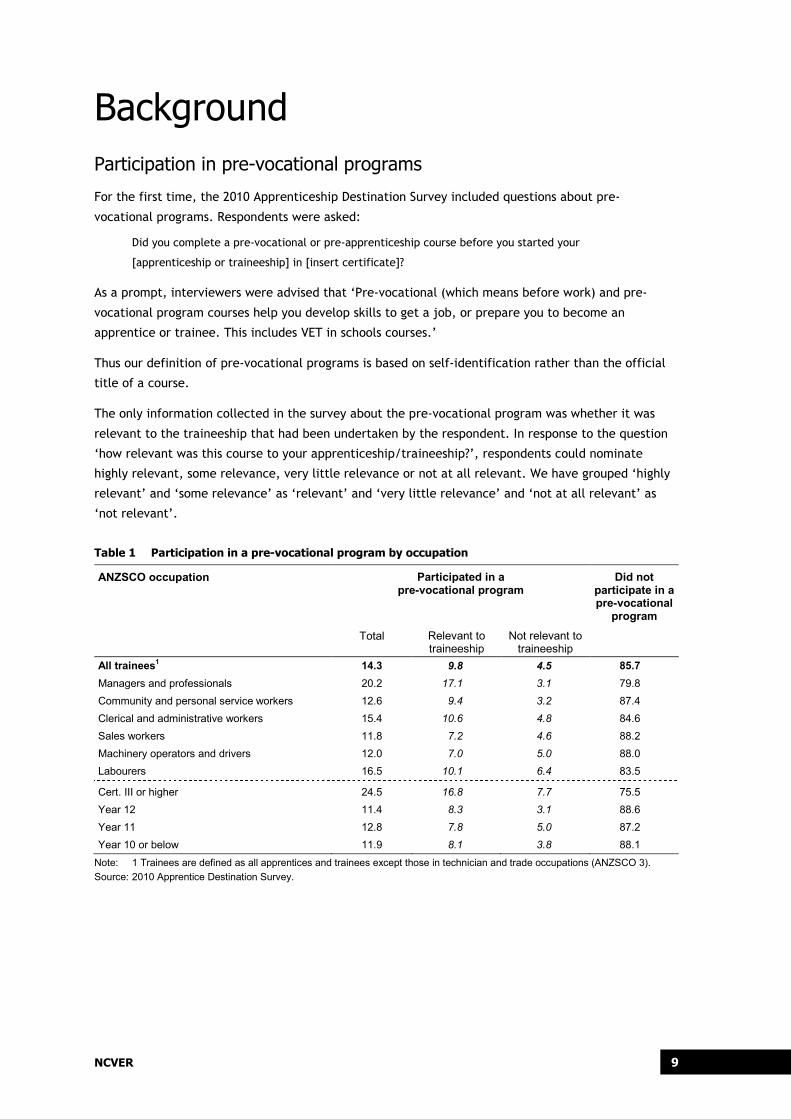
Background Participation in pre-vocational programs
For the first time, the 2010 Apprenticeship Destination Survey included questions about pre-
vocational programs. Respondents were asked:
Did you complete a pre-vocational or pre-apprenticeship course before you started your
[apprenticeship or traineeship] in [insert certificate]?
As a prompt, interviewers were advised that ‘Pre-vocational (which means before work) and pre-
vocational program courses help you develop skills to get a job, or prepare you to become an
apprentice or trainee. This includes VET in schools courses.’
Thus our definition of pre-vocational programs is based on self-identification rather than the official
title of a course.
The only information collected in the survey about the pre-vocational program was whether it was
relevant to the traineeship that had been undertaken by the respondent. In response to the question
‘how relevant was this course to your apprenticeship/traineeship?’, respondents could nominate
highly relevant, some relevance, very little relevance or not at all relevant. We have grouped ‘highly
relevant’ and ‘some relevance’ as ‘relevant’ and ‘very little relevance’ and ‘not at all relevant’ as
‘not relevant’.
Table 1 Participation in a pre-vocational program by occupation
ANZSCO occupation Participated in a pre-vocational program
Did not participate in a pre-vocational
program
Total Relevant to traineeship
Not relevant to traineeship
All trainees1 14.3 9.8 4.5 85.7 Managers and professionals 20.2 17.1 3.1 79.8 Community and personal service workers 12.6 9.4 3.2 87.4 Clerical and administrative workers 15.4 10.6 4.8 84.6 Sales workers 11.8 7.2 4.6 88.2 Machinery operators and drivers 12.0 7.0 5.0 88.0 Labourers 16.5 10.1 6.4 83.5
Cert. III or higher 24.5 16.8 7.7 75.5 Year 12 11.4 8.3 3.1 88.6 Year 11 12.8 7.8 5.0 87.2 Year 10 or below 11.9 8.1 3.8 88.1
Note: 1 Trainees are defined as all apprentices and trainees except those in technician and trade occupations (ANZSCO 3). Source: 2010 Apprentice Destination Survey.
10 Pre-vocational programs and their impact on traineeships
Satisfaction We would expect that pre-vocational programs would increase satisfaction with apprenticeships and
traineeships. Pre-vocational programs are intended to provide students with a realistic preview of the
range of tasks as well as the working and learning environment for a trainee. Research on graduate
employment suggests that unmet expectations contribute to lower satisfaction and higher levels of
turnover (Mabey, Clark & Daniels 1996). The Apprentice and Trainee Destination Survey asks
respondents 17 separate questions related to satisfaction with particular aspects of their
apprenticeship: one relating to the apprenticeship or traineeship overall; six items relating to off-the-
job training; and nine items relating to their employment. Apprentices employed by group training
schemes were asked an additional question. Respondents were asked to rate their satisfaction from
very satisfied to very dissatisfied.
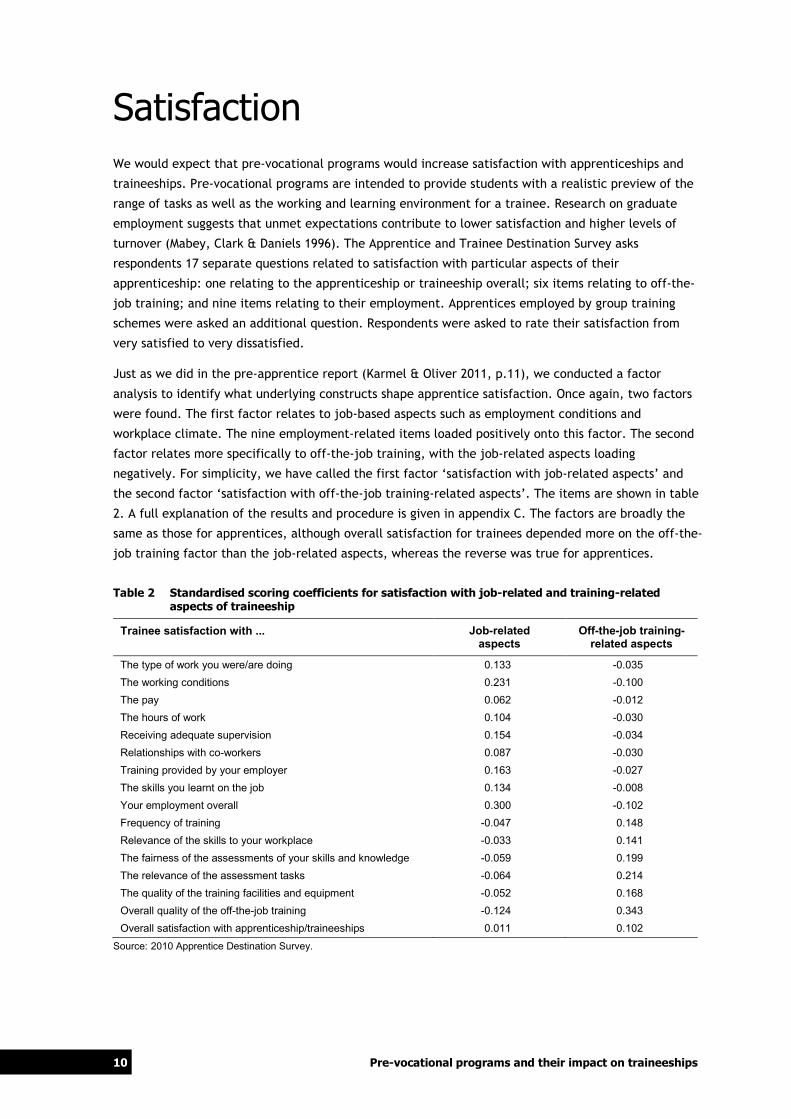
Just as we did in the pre-apprentice report (Karmel & Oliver 2011, p.11), we conducted a factor
analysis to identify what underlying constructs shape apprentice satisfaction. Once again, two factors
were found. The first factor relates to job-based aspects such as employment conditions and
workplace climate. The nine employment-related items loaded positively onto this factor. The second
factor relates more specifically to off-the-job training, with the job-related aspects loading
negatively. For simplicity, we have called the first factor ‘satisfaction with job-related aspects’ and
the second factor ‘satisfaction with off-the-job training-related aspects’. The items are shown in table
2. A full explanation of the results and procedure is given in appendix C. The factors are broadly the
same as those for apprentices, although overall satisfaction for trainees depended more on the off-the-
job training factor than the job-related aspects, whereas the reverse was true for apprentices.
Table 2 Standardised scoring coefficients for satisfaction with job-related and training-related aspects of traineeship
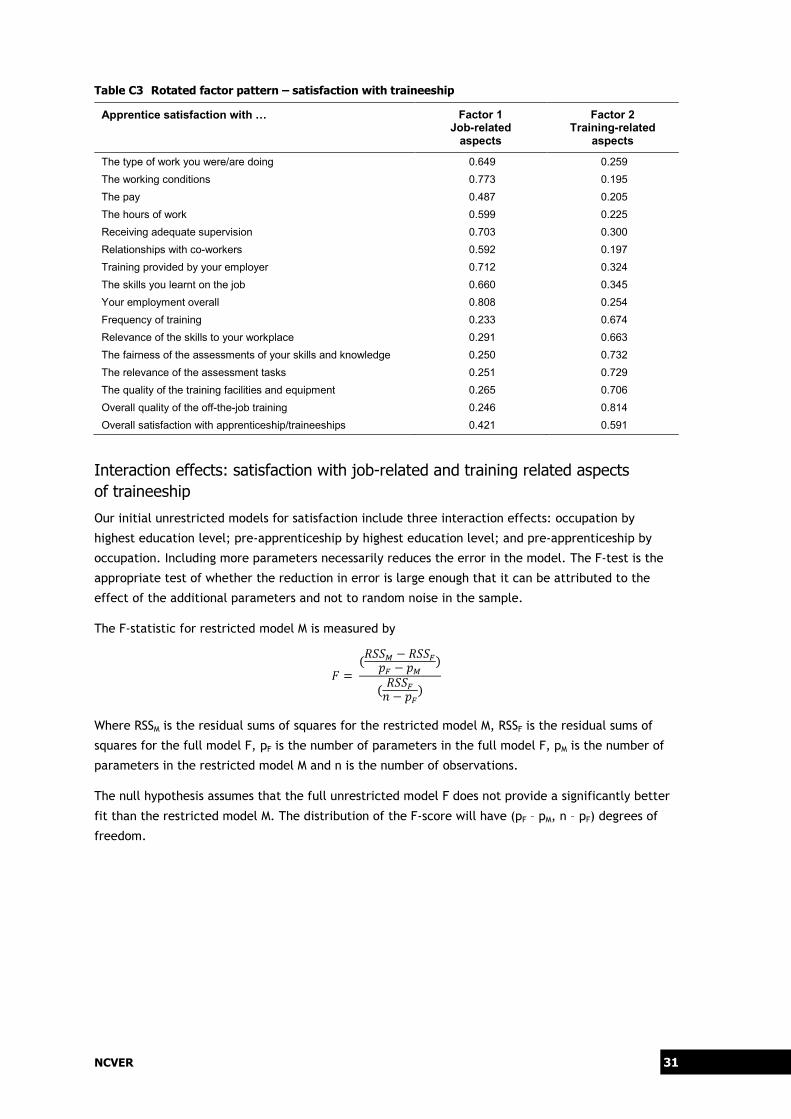
Trainee satisfaction with ... Job-related aspects
Off-the-job training-related aspects
The type of work you were/are doing 0.133 -0.035 The working conditions 0.231 -0.100 The pay 0.062 -0.012 The hours of work 0.104 -0.030 Receiving adequate supervision 0.154 -0.034 Relationships with co-workers 0.087 -0.030 Training provided by your employer 0.163 -0.027 The skills you learnt on the job 0.134 -0.008 Your employment overall 0.300 -0.102 Frequency of training -0.047 0.148 Relevance of the skills to your workplace -0.033 0.141 The fairness of the assessments of your skills and knowledge -0.059 0.199 The relevance of the assessment tasks -0.064 0.214 The quality of the training facilities and equipment -0.052 0.168 Overall quality of the off-the-job training -0.124 0.343 Overall satisfaction with apprenticeship/traineeships 0.011 0.102
Source: 2010 Apprentice Destination Survey.

NCVER 11
We now move to determine whether pre-vocational programs have any impact on these two satisfaction
factors. To test this, we run simple multiple regression models with the satisfaction scores as the
dependent variable. As an independent variable, we enter whether the respondent had completed a
pre-vocational program. We include as control variables, age, occupation, duration, whether the
apprenticeship was undertaken on a full-time or part-time basis, and prior level of education.1
The intention of pre-vocational programs is to prepare, especially, young people for the workforce
and assist them to find and complete a traineeship. As such, we expect that the skills already
possessed by the potential trainee are likely to affect the usefulness of a pre-vocational program. On
the presumption that higher levels of general education would provide a high skills base we would
expect that pre-vocational programs are most beneficial for apprentices with lower levels of
education. Therefore, we include an interaction term with previous level of education. Similarly,
there may theoretically be an added benefit for females undertaking pre-vocational programs if they
are moving into traditionally male occupations. We also considered interactions between pre-
vocational programs and age. In theory, pre-vocational programs might be less beneficial for older
trainees, irrespective of level of education, because of their experience in the workforce.
Pre-vocational programs are also promoted as an introduction to the type of work involved.
Therefore, we also include in the model whether there is an interaction between pre-vocational
programs and the occupation of the apprenticeship, although we suspect this relationship might not
be as strong as in the trades.
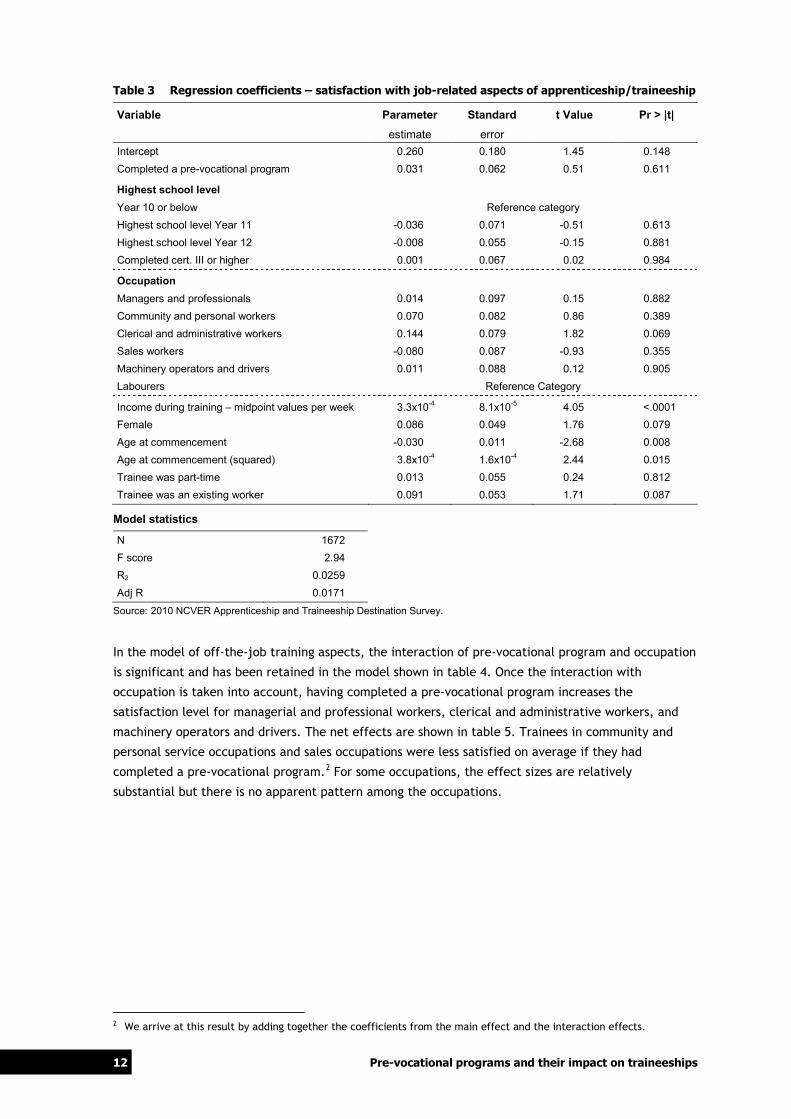
We test the significance of the interaction effects by running restricted models with the interaction
effects removed and comparing the fit of the restricted models to that of the unrestricted model
using F-tests. This procedure is outlined in table C4 in appendix C. The result is that none of the
interaction effects is significant in the model of job-related aspects. Therefore, the restricted model
is shown in table 3.
There is a small, positive non-significant effect of pre-vocational programs on satisfaction with job-
related aspects of the traineeship. The factor scores are standardised, meaning that the average score
is zero and around 95% of all responses are between -2 and 2. Completing a pre-vocational program
increases the satisfaction score by less than 1/25th of one standard deviation. This is much smaller
than the other effects present in the model, such as sex and age. Practically speaking, pre-vocational
programs have no impact on trainees’ satisfaction with the job-related aspects of their training.
1 To begin with, we also included sector of employment (private/public/group training organisation). However, these
variables were not significant and they were removed from the model to reduce standard errors.
12 Pre-vocational programs and their impact on traineeships
Table 3 Regression coefficients – satisfaction with job-related aspects of apprenticeship/traineeship
Variable Parameter Standard t Value Pr > |t| estimate error
Intercept 0.260 0.180 1.45 0.148 Completed a pre-vocational program 0.031 0.062 0.51 0.611
Highest school level Year 10 or below Reference category Highest school level Year 11 -0.036 0.071 -0.51 0.613 Highest school level Year 12 -0.008 0.055 -0.15 0.881 Completed cert. III or higher 0.001 0.067 0.02 0.984
Occupation Managers and professionals 0.014 0.097 0.15 0.882 Community and personal workers 0.070 0.082 0.86 0.389 Clerical and administrative workers 0.144 0.079 1.82 0.069 Sales workers -0.080 0.087 -0.93 0.355 Machinery operators and drivers 0.011 0.088 0.12 0.905 Labourers Reference Category
Income during training – midpoint values per week 3.3x10⁻⁴ 8.1x10⁻⁵ 4.05 <.0001 Female 0.086 0.049 1.76 0.079 Age at commencement -0.030 0.011 -2.68 0.008 Age at commencement (squared) 3.8x10⁻⁴ 1.6x10⁻⁴ 2.44 0.015 Trainee was part-time 0.013 0.055 0.24 0.812 Trainee was an existing worker 0.091 0.053 1.71 0.087
Model statistics
N 1672 F score 2.94 R2 0.0259 Adj R 0.0171
Source: 2010 NCVER Apprenticeship and Traineeship Destination Survey.
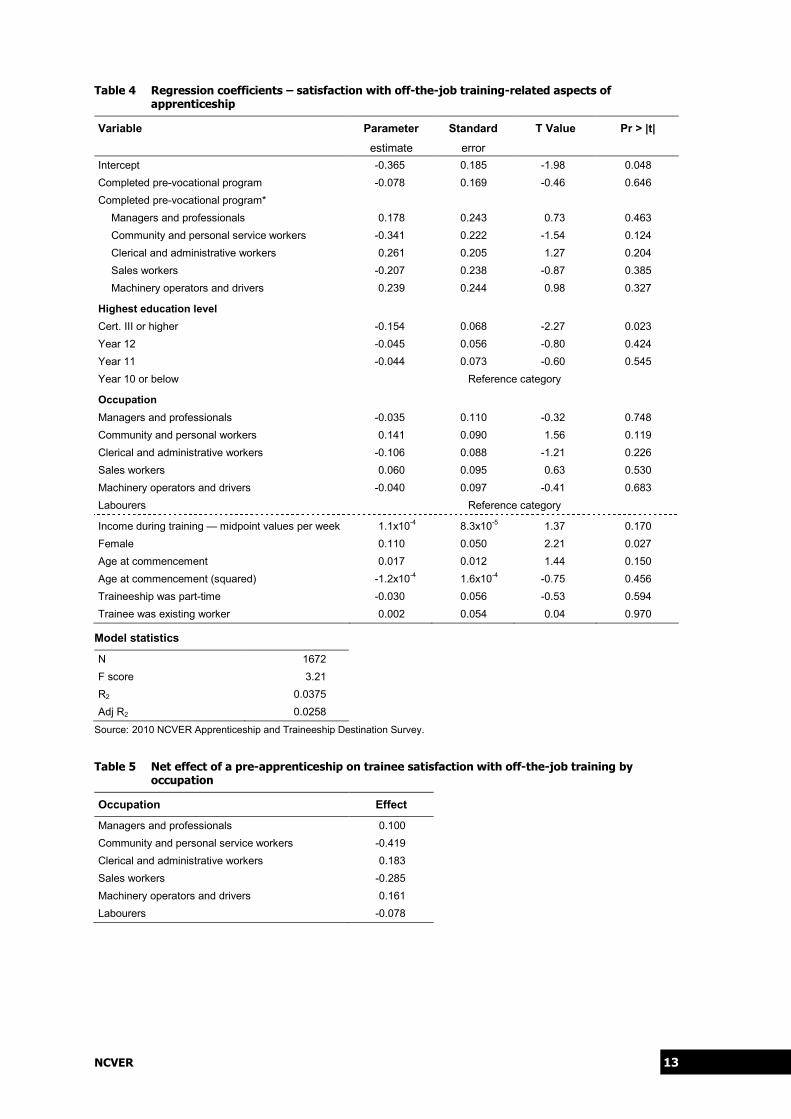
In the model of off-the-job training aspects, the interaction of pre-vocational program and occupation
is significant and has been retained in the model shown in table 4. Once the interaction with
occupation is taken into account, having completed a pre-vocational program increases the
satisfaction level for managerial and professional workers, clerical and administrative workers, and
machinery operators and drivers. The net effects are shown in table 5. Trainees in community and
personal service occupations and sales occupations were less satisfied on average if they had
completed a pre-vocational program.2
For some occupations, the effect sizes are relatively
substantial but there is no apparent pattern among the occupations.
2 We arrive at this result by adding together the coefficients from the main effect and the interaction effects.
NCVER 13
Table 4 Regression coefficients – satisfaction with off-the-job training-related aspects of apprenticeship
Variable Parameter Standard T Value Pr > |t| estimate error Intercept -0.365 0.185 -1.98 0.048 Completed pre-vocational program -0.078 0.169 -0.46 0.646 Completed pre-vocational program*
Managers and professionals 0.178 0.243 0.73 0.463 Community and personal service workers -0.341 0.222 -1.54 0.124 Clerical and administrative workers 0.261 0.205 1.27 0.204 Sales workers -0.207 0.238 -0.87 0.385 Machinery operators and drivers 0.239 0.244 0.98 0.327
Highest education level Cert. III or higher -0.154 0.068 -2.27 0.023 Year 12 -0.045 0.056 -0.80 0.424 Year 11 -0.044 0.073 -0.60 0.545 Year 10 or below Reference category
Occupation Managers and professionals -0.035 0.110 -0.32 0.748 Community and personal workers 0.141 0.090 1.56 0.119 Clerical and administrative workers -0.106 0.088 -1.21 0.226 Sales workers 0.060 0.095 0.63 0.530 Machinery operators and drivers -0.040 0.097 -0.41 0.683 Labourers Reference category
Income during training — midpoint values per week 1.1x10⁻⁴ 8.3x10⁻⁵ 1.37 0.170 Female 0.110 0.050 2.21 0.027 Age at commencement 0.017 0.012 1.44 0.150 Age at commencement (squared) -1.2x10⁻⁴ 1.6x10⁻⁴ -0.75 0.456 Traineeship was part-time -0.030 0.056 -0.53 0.594 Trainee was existing worker 0.002 0.054 0.04 0.970
Model statistics
N 1672 F score 3.21 R2 0.0375 Adj R2 0.0258
Source: 2010 NCVER Apprenticeship and Traineeship Destination Survey.
Table 5 Net effect of a pre-apprenticeship on trainee satisfaction with off-the-job training by occupation
Occupation Effect
Managers and professionals 0.100 Community and personal service workers -0.419 Clerical and administrative workers 0.183 Sales workers -0.285 Machinery operators and drivers 0.161 Labourers -0.078

14 Pre-vocational programs and their impact on traineeships
Completion Following the approach taken in the report examining pre-apprenticeships (Karmel & Oliver 2011), we
use the data from the Apprentice and Trainee Destination Survey to estimate the impact of pre-
vocational programs on the likelihood of completing a traineeship. For a number of reasons, including
different estimation techniques, sampling error and response bias, the estimates of the likelihood of
completing a traineeship differ from the completion rates published regularly by NCVER. Once again,
readers should continue to rely on the annual and quarterly reports for estimates of the completion
rate for each occupation.
The Apprentice and Trainee Destination Survey includes trainees who completed their training and
trainees who ended their traineeship without completing all the requirements. We test the impact of
pre-vocational programs in a binary logistic regression model. Our dependent variable is the
completion status of the apprentice (completed training or did not complete training) and our
independent variable is whether the apprentice undertook a pre-vocational program. As controls we
add age, sex, highest level of education, occupation of apprenticeship, part-time status and existing
worker status. We also include the interaction of highest level of education and occupation. It has
already been shown that the incidence of pre-vocational programs varies by occupation and highest
level of education and we want to be sure that we do not attribute any effect to pre-vocational
programs that is actually the result of underlying relationships between these two variables. Finally,
we include interactions of whether the apprentice had undertaken a pre-vocational program with (1)
sex (2) age (3) highest level of education, and (4) occupation. This enables us to test whether pre-
vocational programs improve completion rates in some circumstances but not in others.
To test whether the interaction effects do have an impact on the likelihood of completion, we ran
five reduced models, removing one interaction effect each time. Deviance scores based on likelihood
ratios are used to compare the fit achieved by the restricted models to the full model, taking into
account the additional parameter included in the full model. The procedure is outlined in appendix D.
The result is that all interaction effects except the interaction of pre-vocational program and age and
the interaction of pre-vocational program and sex significantly improve the model’s fit. Our suspicions
that pre-vocational programs might be less beneficial to older trainees and more beneficial to female
trainees are not supported by the data. Therefore, the model we present in table 6 includes three
interaction effects.

NCVER 15
Table 6 Effect of undertaking pre-vocational program and other variables on likelihood of completing traineeship
Parameter Estimate Standard error Wald ChiSq
Undertook a pre-vocational program 0.104 0.135 0.594 Pre-vocational program*
Cert. III or higher -0.097 0.202 0.228 Year 12 0.378 0.286 1.746 Year 11 -0.252 0.206 1.495 Managers and professionals -0.197 0.299 0.435 Community and personal service workers -0.488 0.249 3.834 Clerical and administrative workers 0.242 0.224 1.172 Sales workers 0.264 0.274 0.934 Machinery operators and drivers 0.081 0.332 0.060
Intercept 0.531 0.390 1.860 Female 0.251 0.088 8.146 Age at commencement 0.025 0.020 1.611 Age at commencement (squared) -1.2x10⁻⁴ 2.8x10⁻⁴ 0.177 Part-time worker -0.295 0.096 9.383 Existing worker -0.323 0.099 10.561
Highest level of education (ref cat.: Year 10) Cert. III or higher -0.135 0.100 1.800 Year 12 0.008 0.077 0.011 Year 11 0.042 0.105 0.161 Year 10 Reference category
Occupation
Managers and professionals -0.158 0.142 1.249 Community and personal service workers 0.141 0.096 2.153 Clerical and administrative workers 0.191 0.096 3.982 Sales workers -0.352 0.112 9.931 Machinery operators and drivers 0.491 0.127 14.884 Labourers Reference category
Cert. III or higher*
Managers and professionals 0.280 0.197 2.019 Community and personal service workers 0.331 0.158 4.408 Clerical and administrative workers 0.019 0.146 0.018 Machinery operators and drivers 0.060 0.210 0.082 Sales workers -0.539 0.220 6.003
Year 12* Managers and professionals -0.240 0.198 1.479 Community and personal service workers -0.150 0.131 1.317 Clerical and administrative workers 0.067 0.124 0.295 Sales workers 0.088 0.147 0.359 Machinery operators and drivers 0.040 0.179 0.049
Year 11* Managers and professionals -0.331 0.281 1.382 Community and personal service workers -0.044 0.171 0.065 Clerical and administrative workers 0.249 0.185 1.813 Sales workers 0.376 0.189 3.961 Machinery operators and drivers -0.054 0.236 0.052

16 Pre-vocational programs and their impact on traineeships
Model fit statistics
Criterion Intercept only Intercept and covariates
AIC 46682.876 44544.276 SC 46688.878 44772.353 -2 Log L 46680.876 44468.276 N 2987
Source: 2010 Apprentice and Trainees Destination Survey.
This variation indicates that some pre-vocational programs are better than others. So that the results
from this model (presented in table 6) are easier to interpret, we take the coefficients to calculate
the change in likelihood of completion of the traineeship associated with a pre-vocational program.
The probabilities, in table 7, quantify what was apparent from the coefficients: that the effect of
pre-vocational programs depends on the occupation of the traineeship and the trainee’s highest level
of education. Trainees in clerical and administrative occupations, sales occupations, labourer
occupations and machinery operators and drivers are more likely to complete their traineeship if they
have completed a pre-vocational program. There is evidence to suggest that they are having an
unintended impact in managerial and professional occupations and in community and personal service
occupations. Namely, trainees who have completed pre-vocational programs are less likely to
complete their training.
In relation to the interaction with the trainee’s highest level of education, we had predicted that pre-
vocational programs would be of most benefit to those with lower levels of education. The results are
not so straightforward. Trainees who left school after Year 11 are clearly more likely to complete
their training if they have undertaken a pre-vocational program. In the case of those who finished
Year 12, pre-vocational programs reduce the likelihood of completing a traineeship and, for all other
levels of education, it seems that pre-vocational programs have little impact on the likelihood of
completing a traineeship. The finding in relation to Year 11 is striking as pre-apprenticeships were
found to reduce the likelihood of completing an apprenticeship for those who finished school at Year
11 (Karmel & Oliver 2011, p.19).
Table 7 Probability of completing a traineeship by occupation and whether undertaken a pre-vocational program
Pre-vocational program
No pre-vocational program
Difference
Occupation Managers and professionals 57.4 61.0 -3.6 Community and personal service workers 58.1 68.3 -10.2 Clerical and administrative workers 76.2 70.6 5.6 Sales workers 64.9 57.5 7.4 Machinery operators and drivers 77.8 75.5 2.3 Labourers 58.6 55.0 3.6
Highest level of education Certificate III or higher qualification 66.0 65.8 0.2 Year 12 63.7 67.0 -3.3 Year 11 79.1 70.0 9.1 Year 10 66.9 65.1 1.8
Notes: Probabilities were calculated assuming trainee is full-time, not an existing worker and commences at age 28 and at the average level for all other variables not included in the prediction.

NCVER 17
Partly these results are explained by the relationship between education and skill level. Table 8 shows
for each major occupational grouping the average highest education level of the respondents as well
as the average skill level required for each occupation. The average skill level was calculated using
the occupation information available in the survey. On the basis of information contained in their
training contract, each respondent is allocated an occupation at the six-digit level. Using this level of
detail we have matched each respondent to a skill level in accordance with the Australian and New
Zealand Standard Classification of Occupations (ANZSCO) (ABS & Statistics NZ 2009). Skill levels range
from one to five. A skill level of one is commensurate with a bachelor degree or higher qualification
or at least five years relevant experience. A skill level of five would usually require completion of
compulsory secondary education or a certificate I.
Pre-vocational programs improved completion rates for trainees in sales, machinery operator and
driver, and labourer occupations. Respondents in these occupational categories were the most likely
to have left school without completing Year 12 and least likely to have completed a certificate III or
higher. They were also training for occupations with the lowest average skill level.
Pre-vocational programs did not improve completion rates for trainees in managerial and professional
occupations. This group of trainees was the most likely to have completed a certificate III or higher
before commencing their traineeship and the least likely to have left school without completing
Year 12. They were also training for occupations with the highest average skill level.
However, the relationship between occupation, highest education level and skill level does not
explain the effect of pre-vocational programs for the two remaining occupational categories. Both
community and personal service trainees and clerical and administrative trainees work in occupations
with mid-range skill levels, although the clerical and administrative trainees are in occupations with a
higher skill level than community and personal service trainees and are less likely to have left school
before completing Year 12. Based on the above results, we would expect that pre-vocational
programs would have a more positive effect among community and personal service trainees than
among clerical and administrative trainees, but we find the reverse is true. This suggests there may
be particular issues with pre-vocational programs for community and personal service trainees.
Table 8 Highest level of education and average skill level by occupation
Occupation Highest level of education (%) Average skill level
Certificate III or higher
Year 12 Less than Year 12
Managers and professionals 32.0 28.8 24.7 1.3 Community and personal service workers 19.8 34.3 46.0 3.9 Clerical and administrative workers 26.7 43.0 30.3 3.3 Sales workers 9.5 32.0 58.4 4.7 Machinery operators and drivers 17.6 29.9 55.5 4.0 Labourers 9.5 29.9 60.6 4.8
Source: 2010 NCVER Apprentice and Trainee Destination Survey,

18 Pre-vocational programs and their impact on traineeships
Reasons for non-completion The aim of this paper was an investigation of how a pre-vocational program affects the traineeship
experience. As well as the impact on satisfaction and the probability of completion, we investigate
whether undertaking a pre-vocational program affects reasons for non-completion. The Apprentice
and Trainee Destination Survey asks respondents who did not complete their training the main reason
for their non-completion. We divide the reasons for non-completion into three categories:
didn't like the type of work or the type of training
workplace reasons, such as didn’t get on with the boss or the pay was too low
other reasons, including personal reasons, being made redundant or the apprenticeship was
discontinued or cancelled.
We are most interested in the first category of reasons. We hypothesise that trainees who have
completed a pre-vocational program should be more familiar with the type of work or training
involved. We expect that apprentices who have undertaken a pre-vocational program will be more
likely to nominate workplace reasons or reasons from the ‘Other’ grouping. These two categories are
combined and used as the reference category because these reasons are mostly beyond the control of
the trainee and should be least likely to be influenced by pre-vocational programs. Our hypothesis
implies that we expect the pre-vocational program variable to be negatively related to the ‘didn’t
like type of work or training’ category.
We conduct a binary logistic regression, starting once again with a full model, including interaction
terms between the pre-vocational program variable, highest education level, occupation and sex. All
of the interaction terms except the interaction of pre-vocational program with age are significant at
the 0.001 level and the model with these interaction terms is retained (see appendix D). The results
are shown in table 9.
Once again, the effect of pre-vocational programs on reasons for non-completion depends on the
occupation of the apprenticeship and the apprentice’s highest level of education. They also depend
on sex, with pre-vocational programs affecting females’ reasons for leaving more than males. So that
the results are more easily interpretable, the probabilities for the main categories of interest (pre-
vocational program, occupation and highest level of education) are shown in table 10.
NCVER 19
Table 9 Logistic regression of ‘Main reason for not completing training is because apprentice didn’t like the type of work or training’
Parameter Estimate Standard error Wald Chi Sq
Undertook a pre-vocational program -3.507 0.252 193.007 Pre-vocational program*
Female -0.344 0.268 1.652 Cert. III or higher 3.591 0.375 91.785 Year 11 -10.643 0.352 912.902 Year 12 3.416 0.386 78.328 Managers and professionals -0.178 0.584 0.093 Community and personal service workers -0.147 0.544 0.073 Clerical and administrative workers 0.114 0.565 0.041 Sales workers 0.321 0.525 0.375 Machinery operators and drivers -0.393 0.874 0.202
Intercept 0.213 0.705 0.091 Female -0.019 0.101 0.036 Age at commencements -0.124 0.044 7.888 Age at commencement (squared) 0.002 0.001 7.691 Part-time worker -0.415 0.196 4.459 Existing worker -0.148 0.213 0.479 Duration -0.001 0.000 1.280
Highest level of education Cert. III or higher 0.397 0.202 3.864 Year 12 -0.184 0.204 0.809 Year 11 -0.041 0.252 0.027 Year 10 Reference category
Occupation Managers and professionals 0.164 0.328 0.248 Community and personal service workers 0.379 0.220 2.966 Clerical and administrative workers -0.086 0.220 0.154 Sales workers -0.090 0.229 0.153 Machinery operators and drivers -0.220 0.357 0.377 Labourers Reference category
Cert. III or higher* Managers and professionals -0.628 0.485 1.678 Community and personal service workers -0.309 0.336 0.845 Clerical and administrative workers -0.270 0.316 0.733 Sales workers 0.122 0.357 0.116 Machinery operators and drivers 0.364 0.481 0.571
Year 12* Managers and professionals 0.574 0.404 2.019 Community and personal service workers 0.037 0.290 0.016 Clerical and administrative workers 0.247 0.296 0.695 Sales workers 0.235 0.316 0.557 Machinery operators and drivers -1.181 0.710 2.767
Year 11* Managers and professionals -0.399 0.719 0.308 Community and personal service workers 0.154 0.379 0.165 Clerical and administrative workers 0.504 0.437 1.331 Sales workers -0.443 0.485 0.835 Machinery operators and drivers 1.117 0.575 3.775

20 Pre-vocational programs and their impact on traineeships
Model fit statistics
Criterion Intercept only Intercept and covariates
AIC 9271.806 8944.481 SC 9277.083 9155.571 -2 Log L 9269.806 8864.481 N 1447
Source: 2010 Apprentice and Trainees Destination Survey.
Table 10 Probability of choosing a work or training-related reason as main reason for not completing a traineeship (%)
Pre-vocational program
No pre-vocational program
Difference
Occupation Managers and professionals 0.7 12.7 -11.9 Community and personal service workers 1.0 15.9 -14.9 Clerical and administrative workers 0.9 11.8 -10.9 Sales workers 1.0 11.0 -10.0 Machinery operators and drivers 0.4 8.7 -8.3 Labourers 1.0 11.3 -10.3
Highest level of education Cert. III 12.8 14.0 -1.2 Year 12 8.2 10.6 -2.4 Year 11 0.0 13.5 -13.5 Year 10 9.5 10.0 -0.5
Notes: Probabilities were calculated assuming trainee is full-time, not an existing worker and commences at age 28 and at the average level for all other variables not included in the prediction.
Thus we find that pre-vocational programs do have an effect on reasons for not completing. This
effect is relatively uniform across the occupations, although stronger for community and personal
service workers and managers and professionals, the two occupational categories that did not show an
improvement in the likelihood of completion. So our conclusion is that pre-vocational programs do
provide a better understanding of what work and training apprentices can expect in undertaking an
apprenticeship. When we compare these effects with the earlier results relating to the probability of
completion, we find some evidence that this better understanding translates into higher completion
rates. This point is illustrated by figure 1.
In this figure, we plot for each occupation and prior education level the change to the likelihood of
completion against the change to the likelihood of giving ‘type of work or training’ as the reason for
non-completion. If improving an apprentice’s understanding of the type of work or training involved in
an apprenticeship is important to increasing completion rates, we would expect to see most data
points in the upper left quadrant. That is, trainees who complete a pre-vocational program should be
less likely to be dissatisfied with the type of work or training and therefore more likely to complete
their training. We see a fairly consistent pattern among the occupational results but little strong
relationship among the education results (where pre-vocational programs had little effect except for
those who left school after Year 11).
NCVER 21
Figure 1 Impact of pre-vocational programs on reason for non-completion and likelihood of completion of a traineeship
Source: Tables 7, 10.
-15
-10
-5
0
5
10
15
-15 -10 -5 0 5 10 15
Perc
enta
ge p
oint
cha
nge
to li
kelih
ood
of
com
plet
ion
Percentage point change to likelihood of 'type of work or training' as reason for non-completion
Occupation
Education

22 Pre-vocational programs and their impact on traineeships
Final comments Our analysis of pre-vocational programs suggests that they do have a contribution to make in
improving traineeship completions if appropriately targeted.
Non-completing trainees who have completed a pre-vocational program are less likely to discontinue
their training because they did not like the type of work or training and more likely to nominate a
workplace or personal reason. This is largely attributable to the very strong positive impact among
those who left school at Year 11 and there is little effect among the other levels of education.
Pre-vocational programs have only a moderate effect on trainees’ satisfaction with the job-related
aspects of their traineeship. There is more of an effect of pre-vocational programs on trainees’
satisfaction with the off-the-job-training aspects of their traineeship. For most occupations, this is
positive, but pre-vocational programs reduce satisfaction with off-the-job training in the community
and personal service and sales occupations.
Pre-vocational programs do increase the likelihood of completing a traineeship in most occupational
categories. In the community and personal services occupations and managerial and professional
occupations, pre-vocational programs appear not to be working well and reduce the likelihood of
completing a traineeship. In the case of managerial and professional occupations, there is some logic
to this result: these occupations have the highest skill requirements of all trainee occupations and
pre-vocational programs may struggle to prepare prospective trainees for all the requirements of
their training, especially if they are drawing on a group with less academic ability to begin with. The
flipside is that pre-vocational programs are working well in occupations with low skill requirements:
sales workers, labourers and machinery operators and drivers, as well as in clerical and administrative
occupations.
On the basis of the level of education results, it seems that pre-vocational programs are particularly
beneficial for those who left school after Year 11. This is in contrast to pre-apprenticeships, which
reduce the likelihood of completing an apprenticeship among those who leave school at Year 11.
Pre-vocational programs, particularly where delivered through VET in Schools, may be a preferable
alternative to completing Year 12 for students looking to complete a traineeship. Anlezark, Karmel
and Ong (2006) found that VET in Schools undertaken by Year 11 students reduces retention to Year
12 but contributes to a smoother transition into work for those who decide to leave school without
completing Year 12. To the extent that some pre-vocational programs are taken through the VET in
Schools setting, we could be confusing the result. Students could be leaving school at Year 11 because
a pre-vocational program has shown them an alternative path into a traineeship.
We must still account for the divergent effects of pre-apprenticeships and pre-vocational programs
for apprentices and trainees who leave school after Year 11. It could be that pre-apprenticeship
courses are not ideally suited to those who leave school after Year 11 and who may lack the ability
and motivation to complete Year 12, since ability and motivation also increase the odds of completing
a three-year apprenticeship in a traditional trade. Pre-vocational programs, on the other hand, may
fulfil a more useful role for those who leave school at Year 11 because they have a broader focus on
vocational skills and lead to traineeships that are typically much shorter in duration than
apprenticeships. One could also argue that traineeships are more about a way into employment, while
apprenticeships are more identified as acquiring the skills pertaining to a particular craft.

NCVER 23
On the basis of these results, we can make some reasonably certain conclusions about the
performance of pre-vocational programs. Pre-vocational programs fulfil a useful role in assisting early
school leavers, particularly those leaving after Year 11, to complete traineeships in occupations that
typically require lower skill levels. Pre-vocational programs reduce the likelihood of completing a
traineeship in the higher-level occupational categories such as managers and professionals.
Prospective trainees interested in these occupations would be better off directly entering a
traineeship, especially if they have completed Year 12. For occupations with mid-range skill levels,
the results are mixed. The implication is that the curriculum for pre-vocational programs should focus
more on general employability skills and less on theory or work experience directed toward a specific
occupation and they should be targeted to early school leavers.

24 Pre-vocational programs and their impact on traineeships
References Anlezark, A, Karmel, T & Ong, K 2006, Have school vocational education and training programs been
successful?, NCVER, Adelaide.
ABS (Australian Bureau of Statistics) and Statistics NZ 2009, Australian and New Zealand Standard Classification of Occupations, ABS, Canberra.
Karmel, T & Oliver, D 2011, Pre-apprenticeships and their impact on apprenticeship completion and satisfaction, NCVER, Adelaide.
Mabey, C, Clark, T & Daniels, K 1996, ‘A six year longitudinal study of graduate expectations: the implications for company recruitment and selection strategies’, International Journal of Selection and Assessment, vol.4, no.3, pp.139—50.
NCVER (National Centre for Vocational Education research) 2009, Apprentices and trainees, annual 2008, NCVER, Adelaide.
——2010a, Apprentices and trainee destinations 2010, NCVER, Adelaide.
——2010b, Apprentices and trainee destinations 2010, technical notes, NCVER, Adelaide.
NCVER 25
Appendix A Apprentice and Trainee Destination Survey
The Apprentice and Trainee Destination Survey provides information about the destinations of
apprentices and trainees approximately nine months after leaving their training. The findings relate
to apprentices and trainees who completed their training (completers) between April and June 2009,
or who cancelled or withdrew from an apprenticeship or traineeship and did not return to finish (non-
completers) during this period. The limited window may mean that we miss out on some groups of
apprentices and trainees. For example, those who left their training to return to school would be
unlikely to be in the survey.
The statistical publication from the survey (NCVER 2010a) presents employment outcomes, reasons for
non-completion, satisfaction with the apprenticeship or traineeship, and further study destinations. A
number of supporting documents are also available, including additional data tables and technical
notes <http://www.ncver.edu.au/publications/2262.html>.
As the survey is based on a sample and not the entire population of apprentices and trainees who
stopped their training, estimates produced by the survey are subject to sampling and non-sampling
error. Sampling error is a measure of the variability that occurs because a sample rather than the
entire population responds to a survey. Non-sampling error may occur for reasons such as non-
response bias, incorrect responses, interviewer errors, attrition, and processing errors (see NCVER
2010b). Non-response is typically not random, and often there is a tendency for the more successful
to respond. To a large extent, this bias is addressed through the use of multivariate models, and we
are confident that the relationships we have estimated between pre-apprenticeships and outcomes
are reasonably robust.
26 Pre-vocational programs and their impact on traineeships
Appendix B Table B1 Individual and employment characteristics of apprentices and trainees, by whether
completed a pre-vocational or pre-apprenticeship course
Pre-vocational
program No pre-vocational
program
Female 51.0 54.3 Male 49.0 45.7 Age at commencement 19 years and under 28.7 29.8 20–24 years 17.5 15.2 25 years and over 53.9 55.1 Previous level of education Cert. III or higher 33.5 17.3 Year 12 27.3 35.5 Year 11 11.8 13.4 Year 10 or below 27.3 33.8 Non-English speaking 9.9 12.0 English speaking/Not stated 90.1 88.0 Indigenous 2.9* 2.3 Non-Indigenous/Not stated 97.1 97.7 Have a disability 1.7* 1.8 Do not have a disability/Not stated 98.3 98.2 Metropolitan 59.6 60.0 Rural 40.4 40.0 Existing worker 64.8 64.3 Newly commencing worker 35.2 35.7
Notes: *Has a relative standard error > 25% and should be used with caution.
NCVER 27
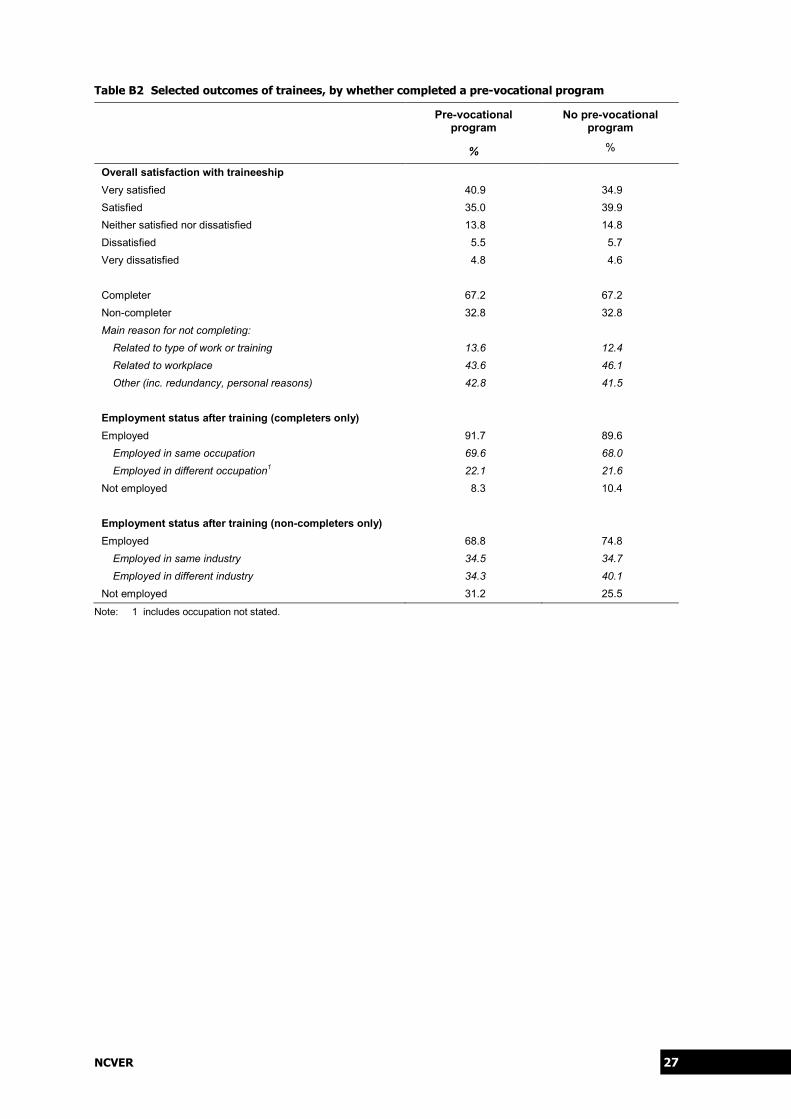
Table B2 Selected outcomes of trainees, by whether completed a pre-vocational program
Pre-vocational
program No pre-vocational
program
% %
Overall satisfaction with traineeship Very satisfied 40.9 34.9 Satisfied 35.0 39.9 Neither satisfied nor dissatisfied 13.8 14.8 Dissatisfied 5.5 5.7 Very dissatisfied 4.8 4.6
Completer 67.2 67.2 Non-completer 32.8 32.8 Main reason for not completing:
Related to type of work or training 13.6 12.4 Related to workplace 43.6 46.1 Other (inc. redundancy, personal reasons) 42.8 41.5
Employment status after training (completers only) Employed 91.7 89.6
Employed in same occupation 69.6 68.0 Employed in different occupation1 22.1 21.6
Not employed 8.3 10.4 Employment status after training (non-completers only) Employed 68.8 74.8
Employed in same industry 34.5 34.7 Employed in different industry 34.3 40.1
Not employed 31.2 25.5
Note: 1 includes occupation not stated.

28 Pre-vocational programs and their impact on traineeships
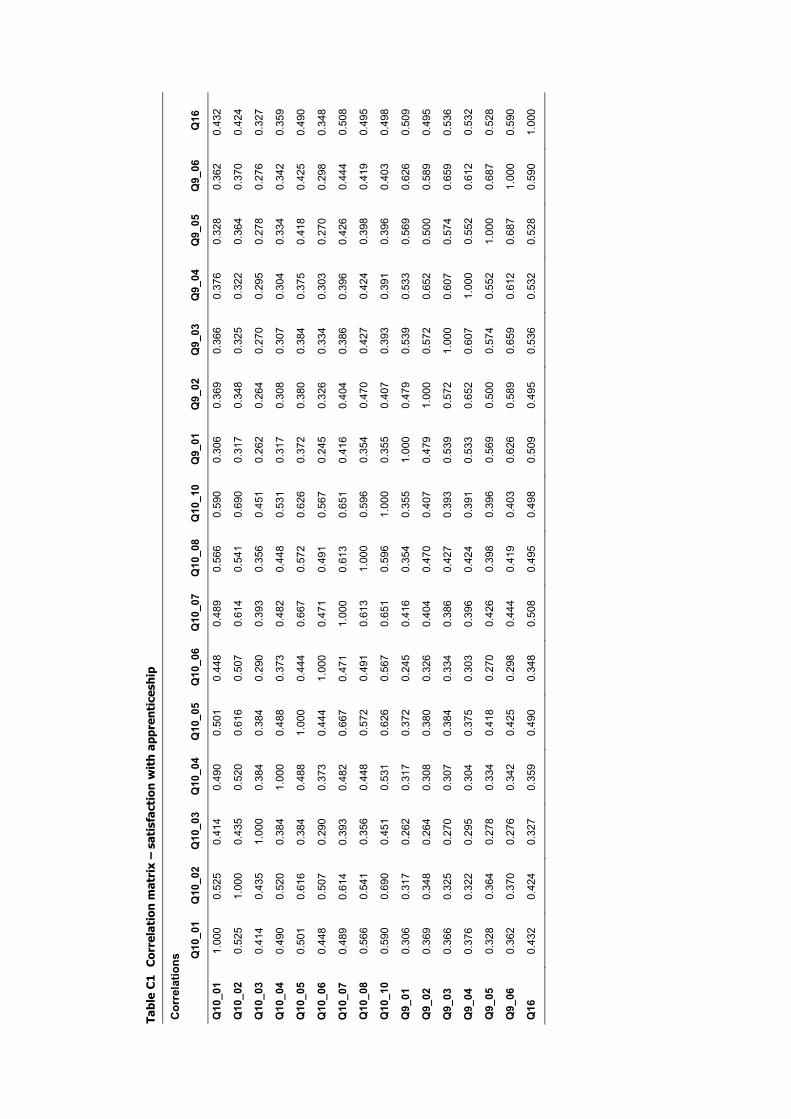
Appendix C Factor analysis – satisfaction
The questionnaire includes items relating to satisfaction with the employment- and training-related
aspects of the apprenticeship or traineeship. Exploratory factor analysis was used to see if separate
employment and training or a combined satisfaction scale can be constructed.
A total of 16 variables were used in the factor analysis: nine employment-related items; six off-the-
job training related items; and one overall satisfaction item. A tenth employment-related item was
dropped because it was only asked of apprentices and trainees who were employed by a group
training company.
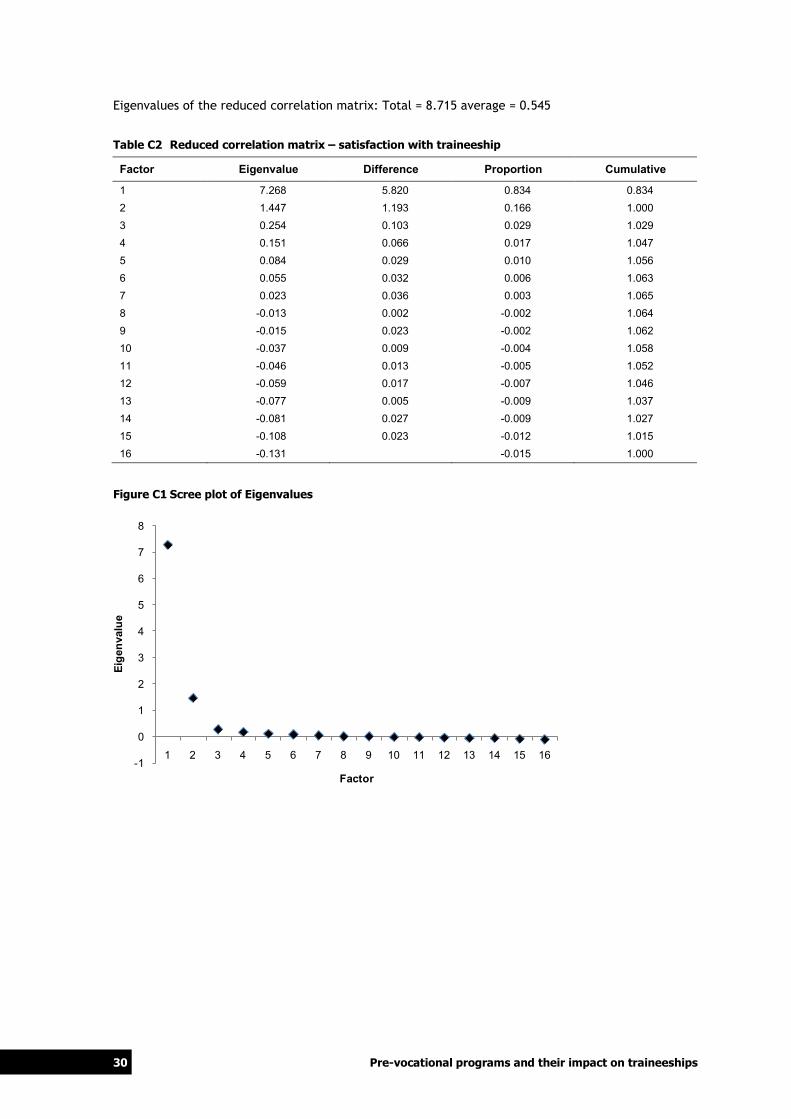
Common factor analysis was used, rather than principal components analysis, since the observed
variables are only indicators of the latent satisfaction constructs to be measured. Two factors were
selected on the basis of eigenvalues being greater than 1 (table C2). Orthogonal rotation using the
VARIMAX method produced the final factor matrix shown in table C3.
.
Tabl
e C
1 C
orre
lati
on m
atri
x –
sati
sfac
tion
wit
h ap
pren
tice
ship
Cor
rela
tions
Q
10_0
1 Q
10_0
2 Q
10_0
3 Q
10_0
4 Q
10_0
5 Q
10_0
6 Q
10_0
7 Q
10_0
8 Q
10_1
0 Q
9_01
Q
9_02
Q
9_03
Q
9_04
Q
9_05
Q
9_06
Q
16
Q10
_01
1.00
0 0.
525
0.41
4 0.
490
0.50
1 0.
448
0.48
9 0.
566
0.59
0 0.
306
0.36
9 0.
366
0.37
6 0.
328
0.36
2 0.
432
Q10
_02
0.52
5 1.
000
0.43
5 0.
520
0.61
6 0.
507
0.61
4 0.
541
0.69
0 0.
317
0.34
8 0.
325
0.32
2 0.
364
0.37
0 0.
424
Q10
_03
0.41
4 0.
435
1.00
0 0.
384
0.38
4 0.
290
0.39
3 0.
356
0.45
1 0.
262
0.26
4 0.
270
0.29
5 0.
278
0.27
6 0.
327
Q10
_04
0.49
0 0.
520
0.38
4 1.
000
0.48
8 0.
373
0.48
2 0.
448
0.53
1 0.
317
0.30
8 0.
307
0.30
4 0.
334
0.34
2 0.
359
Q10
_05
0.50
1 0.
616
0.38
4 0.
488
1.00
0 0.
444
0.66
7 0.
572
0.62
6 0.
372
0.38
0 0.
384
0.37
5 0.
418
0.42
5 0.
490
Q10
_06
0.44
8 0.
507
0.29
0 0.
373
0.44
4 1.
000
0.47
1 0.
491
0.56
7 0.
245
0.32
6 0.
334
0.30
3 0.
270
0.29
8 0.
348
Q10
_07
0.48
9 0.
614
0.39
3 0.
482
0.66
7 0.
471
1.00
0 0.
613
0.65
1 0.
416
0.40
4 0.
386
0.39
6 0.
426
0.44
4 0.
508
Q10
_08
0.56
6 0.
541
0.35
6 0.
448
0.57
2 0.
491
0.61
3 1.
000
0.59
6 0.
354
0.47
0 0.
427
0.42
4 0.
398
0.41
9 0.
495
Q10
_10
0.59
0 0.
690
0.45
1 0.
531
0.62
6 0.
567
0.65
1 0.
596
1.00
0 0.
355
0.40
7 0.
393
0.39
1 0.
396
0.40
3 0.
498
Q9_
01
0.30
6 0.
317
0.26
2 0.
317
0.37
2 0.
245
0.41
6 0.
354
0.35
5 1.
000
0.47
9 0.
539
0.53
3 0.
569
0.62
6 0.
509
Q9_
02
0.36
9 0.
348
0.26
4 0.
308
0.38
0 0.
326
0.40
4 0.
470
0.40
7 0.
479
1.00
0 0.
572
0.65
2 0.
500
0.58
9 0.
495
Q9_
03
0.36
6 0.
325
0.27
0 0.
307
0.38
4 0.
334
0.38
6 0.
427
0.39
3 0.
539
0.57
2 1.
000
0.60
7 0.
574
0.65
9 0.
536
Q9_
04
0.37
6 0.
322
0.29
5 0.
304
0.37
5 0.
303
0.39
6 0.
424
0.39
1 0.
533
0.65
2 0.
607
1.00
0 0.
552
0.61
2 0.
532
Q9_
05
0.32
8 0.
364
0.27
8 0.
334
0.41
8 0.
270
0.42
6 0.
398
0.39
6 0.
569
0.50
0 0.
574
0.55
2 1.
000
0.68
7 0.
528
Q9_
06
0.36
2 0.
370
0.27
6 0.
342
0.42
5 0.
298
0.44
4 0.
419
0.40
3 0.
626
0.58
9 0.
659
0.61
2 0.
687
1.00
0 0.
590
Q16
0.
432
0.42
4 0.
327
0.35
9 0.
490
0.34
8 0.
508
0.49
5 0.
498
0.50
9 0.
495
0.53
6 0.
532
0.52
8 0.
590
1.00
0
30 Pre-vocational programs and their impact on traineeships
Eigenvalues of the reduced correlation matrix: Total = 8.715 average = 0.545
Table C2 Reduced correlation matrix – satisfaction with traineeship
Factor Eigenvalue Difference Proportion Cumulative
1 7.268 5.820 0.834 0.834 2 1.447 1.193 0.166 1.000 3 0.254 0.103 0.029 1.029 4 0.151 0.066 0.017 1.047 5 0.084 0.029 0.010 1.056 6 0.055 0.032 0.006 1.063 7 0.023 0.036 0.003 1.065 8 -0.013 0.002 -0.002 1.064 9 -0.015 0.023 -0.002 1.062 10 -0.037 0.009 -0.004 1.058 11 -0.046 0.013 -0.005 1.052 12 -0.059 0.017 -0.007 1.046 13 -0.077 0.005 -0.009 1.037 14 -0.081 0.027 -0.009 1.027 15 -0.108 0.023 -0.012 1.015 16 -0.131 -0.015 1.000
Figure C1 Scree plot of Eigenvalues
-1
0
1
2
3
4
5
6
7
8
1 2 3 4 5 6 7 8 9 10 11 12 13 14 15 16
Eige
nval
ue
Factor
NCVER 31
Table C3 Rotated factor pattern – satisfaction with traineeship
Apprentice satisfaction with … Factor 1 Job-related
aspects
Factor 2 Training-related
aspects
The type of work you were/are doing 0.649 0.259 The working conditions 0.773 0.195 The pay 0.487 0.205 The hours of work 0.599 0.225 Receiving adequate supervision 0.703 0.300 Relationships with co-workers 0.592 0.197 Training provided by your employer 0.712 0.324 The skills you learnt on the job 0.660 0.345 Your employment overall 0.808 0.254 Frequency of training 0.233 0.674 Relevance of the skills to your workplace 0.291 0.663 The fairness of the assessments of your skills and knowledge 0.250 0.732 The relevance of the assessment tasks 0.251 0.729 The quality of the training facilities and equipment 0.265 0.706 Overall quality of the off-the-job training 0.246 0.814 Overall satisfaction with apprenticeship/traineeships 0.421 0.591
Interaction effects: satisfaction with job-related and training related aspects of traineeship
Our initial unrestricted models for satisfaction include three interaction effects: occupation by
highest education level; pre-apprenticeship by highest education level; and pre-apprenticeship by
occupation. Including more parameters necessarily reduces the error in the model. The F-test is the
appropriate test of whether the reduction in error is large enough that it can be attributed to the
effect of the additional parameters and not to random noise in the sample.
The F-statistic for restricted model M is measured by
Where RSSM is the residual sums of squares for the restricted model M, RSSF is the residual sums of
squares for the full model F, pF is the number of parameters in the full model F, pM is the number of
parameters in the restricted model M and n is the number of observations.
The null hypothesis assumes that the full unrestricted model F does not provide a significantly better
fit than the restricted model M. The distribution of the F-score will have (pF – pM, n – pF) degrees of
freedom.

32 Pre-vocational programs and their impact on traineeships
Table C4 F-test statistics for comparing unrestricted and restricted models of satisfaction
N No. of par
Residual sum squares
F score df1 df2 Sig value
Satisfaction with job-related aspects A Expanded model with all interactions 1672 41 16081 B Restricted model with no PRE|AGE interaction
1672 40 16083 0.203 1 1671 0.653
C Restricted model with no PRE|SEX interaction
1672 40 16092 1.116 1 1671 0.291
D Restricted model with no OCC|HEL interaction
1672 26 16253 1.163 15 1657 0.294
E Restricted model with no PRE|OCC interaction
1672 36 16169 1.785 5 1667 0.113
F Restricted model with no PRE|HEL interaction
1672 38 16116 1.183 3 1669 0.315
G Restricted model with no interactions 1672 15 16388 1.198 26 1646 0.226 Satisfaction with training-related aspects A Expanded model with all interactions 1672 41 16738 B Restricted model with no PRE|AGE interaction
1672 40 16745 0.682 1 1671 0.409
C Restricted model with no PRE|SEX interaction
1672 40 16739 0.097 1 1671 0.755
D Restricted model with no OCC|HEL interaction
1672 26 16919 1.176 15 1657 0.284
E Restricted model with no PRE|OCC interaction
1672 36 16894 3.040 5 1667 0.010
F Restricted model with no PRE|HEL interaction
1672 38 16746 0.260 3 1669 0.854
G Restricted model with no interactions 1672 16 17093 1.384 25 1647 0.098 H full model with only PRE|OCC interaction 1672 21 16942 G restricted model with no interactions 1672 16 17093 2.943 25 1647 0.000 Note: Shaded model indicates final model presented in analysis.

NCVER 33
Appendix D Likelihood of completing an apprenticeship or traineeship
To model the likelihood of completing training, we combine the completer and non-completer sub-
samples. We weight this data, using information from the same administrative data from which the
sample was drawn. The data have been weighted by state, completion status (completer/non-
completers) and occupation (trade/non-trade). We run a logistic regression where the dependent
variable is whether or not the apprenticeship was completed, using the proc survey logistic procedure
in SAS to take account of the survey strata.
We tested numerous possible interaction effects. We began with the unrestricted model, including
three interaction effects: occupation by highest education level; pre-apprenticeship by highest
education level; and pre-apprenticeship by occupation. We then ran three restricted models,
removing one interaction block in each model. Removing parameters necessarily results in an increase
in -2 log likelihood scores. The deviance statistic tests whether the increase in log likelihood is too
large and the assumption of a simplified model is not justified.
The deviance statistic for model M is measured by
D(M) = (-2ln lF – -2ln lM)
Where lF is the likelihood of the full model and lM is the likelihood of the restricted model M. The
deviance statistic has an approximate Chi-Square distribution, with pF- pM degrees of freedom, where
pF is the number of parameters in the full model and pM is the number of parameters in the restricted
model M.
When we tested the interaction blocks, we found that the model with the interactions between pre-
vocational program and age and between pre-vocational program and sex but with all other interaction
terms retained results in the best fit. The results of the deviance tests are shown in table D1.
Reasons for non-completion
We followed an identical process for examining the reasons for non-completion. The main reasons
for non-completion are divided into two categories: related to the type of work or training and all
other reasons.
We modelled the probability of nominating a reason related to the type of work or training, again
using the proc survey logistic procedure in SAS to take account of the survey strata. The deviance
tests for testing interaction effects for the reasons for non-completion are shown in table D2.

Tabl
e D
1 Su
mm
ary
of d
evia
nce
test
s fo
r in
tera
ctio
n ef
fect
s –
logi
stic
reg
ress
ion
of li
kelih
ood
of c
ompl
etin
g an
app
rent
ices
hip
or t
rain
eesh
ip
Mod
el
-2 L
og li
kelih
ood
Df
Dev
ianc
e te
sts
M
odel
s
com
pare
d C
hang
e
in d
f D
evia
nce
stat
istic
(Χ2 )
Sig
va
lue
Dec
isio
n
A.
Full
mod
el
4446
5.15
1 39
B
. M
odel
A w
ithou
t AG
E*P
REV
OC
inte
ract
ion
4446
6.15
1 38
B
to A
1
1.00
0 0.
317
Rem
ove
AG
E*P
REV
OC
C.
Mod
el B
with
out P
REV
OC
*SE
X in
tera
ctio
n 44
468.
276
37
C to
B
1 2.
125
0.14
5 R
emov
e S
EX*
PR
EV
OC
D
. M
odel
C w
ithou
t OC
C*H
EL
inte
ract
ion
4471
8.20
6 22
D
to C
15
24
9.93
0 0.
000
Ret
ain
OC
C*H
EL
E
. M
odel
C w
ithou
t PR
E*H
EL
inte
ract
ion
4449
6.63
5 34
E
to C
3
28.3
59
0.00
0 R
etai
n P
RE
*HE
L
F.
M
odel
C w
ithou
t PR
E*O
CC
inte
ract
ion
4454
4.37
8 32
F
to C
5
76.1
02
0.00
0 R
etai
n P
RE
*OC
C
Not
e:
Sha
ded
mod
el in
dica
tes
final
mod
el p
rese
nted
in a
naly
sis.
Tabl
e D
2 Su
mm
ary
of d
evia
nce
test
s fo
r in
tera
ctio
n ef
fect
s –
logi
stic
reg
ress
ion
of m
ain
reas
on f
or n
ot c
ompl
etin
g tr
aine
eshi
p
Mod
el
-2 L
og li
kelih
ood
Df
Dev
ianc
e te
sts
M
odel
s
com
pare
d C
hang
e
in d
f D
evia
nce
stat
istic
(Χ2 )
Sig
va
lue
Dec
isio
n
A.
Full
mod
el
8861
.047
39
B
. M
odel
A w
ithou
t AG
E*P
REV
OC
inte
ract
ion
8864
.481
38
B
to A
1
3.43
4 0.
064
Rem
ove
AG
E*P
REV
OC
C.
Mod
el B
with
out P
REV
OC
*SE
X in
tera
ctio
n 88
80.5
74
37
C to
B
1 16
.093
0.
000
Ret
ain
SEX*
PR
EV
OC
D.
Mod
el C
with
out O
CC
*HE
L in
tera
ctio
n 90
27.4
15
22
D to
B
15
162.
934
0.00
0 R
etai
n O
CC
*HE
L
E.
No
PR
E*A
GE,
No
PR
E*S
EX,
No
PR
E*H
EL
8922
.320
34
E
to B
3
57.8
39
0.00
0 R
etai
n P
RE
*HE
L
F.
No
PR
E*A
GE,
No
PR
E*S
EX,
No
PR
E*O
CC
88
89.2
28
32
F to
B
5 24
.747
0.
000
Ret
ain
PR
E*O
CC
Not
e:
Sha
ded
mod
el in
dica
tes
final
mod
el p
rese
nted
in a
naly
sis.

National Centre for Vocational Education Research Ltd
Level 11, 33 King William Street, Adelaide, South Australia
PO Box 8288, Station Arcade, SA 5000 Australia
Telephone +61 8 8230 8400 Facsimile +61 8 8212 3436
Website www.ncver.edu.au Email [email protected]