damodaran ch12
TRANSCRIPT

8/7/2019 damodaran ch12
http://slidepdf.com/reader/full/damodaran-ch12 1/65
Aswath Damodaran 1
ValuationAswath Damodaran

8/7/2019 damodaran ch12
http://slidepdf.com/reader/full/damodaran-ch12 2/65
Aswath Damodaran 2
First Principles
n Invest in projects that yield a return greater than the minimum
acceptable hurdle rate.
• The hurdle rate should be higher for riskier projects and reflect the
financing mix used - owners’ funds (equity) or borrowed money (debt)
• Returns on projects should be measured based on cash flows generated
and the timing of these cash flows; they should also consider both positive
and negative side effects of these projects.
n Choose a financing mix that minimizes the hurdle rate and matches the
assets being financed.
n If there are not enough investments that earn the hurdle rate, return thecash to stockholders.
• The form of returns - dividends and stock buybacks - will depend upon
the stockholders’ characteristics.
Objective: Maximize the Value of the Firm

8/7/2019 damodaran ch12
http://slidepdf.com/reader/full/damodaran-ch12 3/65
Aswath Damodaran 3
Discounted Cashflow Valuation: Basis forApproach
• where,• n = Life of the asset
• CFt = Cashflow in period t
• r = Discount rate reflecting the riskiness of the estimated cashflows
Value =CF
t
(1+ r)tt =1
t = n∑

8/7/2019 damodaran ch12
http://slidepdf.com/reader/full/damodaran-ch12 4/65
Aswath Damodaran 4
Equity Valuation versus Firm Valuation
n value just the equity stake in the business
n value the entire firm, which includes, besides equity, the other
claimholders in the firm

8/7/2019 damodaran ch12
http://slidepdf.com/reader/full/damodaran-ch12 5/65
Aswath Damodaran 5
I.Equity Valuation
n The value of equity is obtained by discounting expected cashflows to
equity, i.e., the residual cashflows after meeting all expenses, tax
obligations and interest and principal payments, at the cost of equity,
i.e., the rate of return required by equity investors in the firm.
where,
CF to Equityt = Expected Cashflow to Equity in period t
ke = Cost of Equity
n The dividend discount model is a specialized case of equity valuation,
and the value of a stock is the present value of expected future
dividends.
Value of Equity =CF to Equityt
(1+ k e )tt=1
t=n
∑
8/7/2019 damodaran ch12
http://slidepdf.com/reader/full/damodaran-ch12 6/65
Aswath Damodaran 6
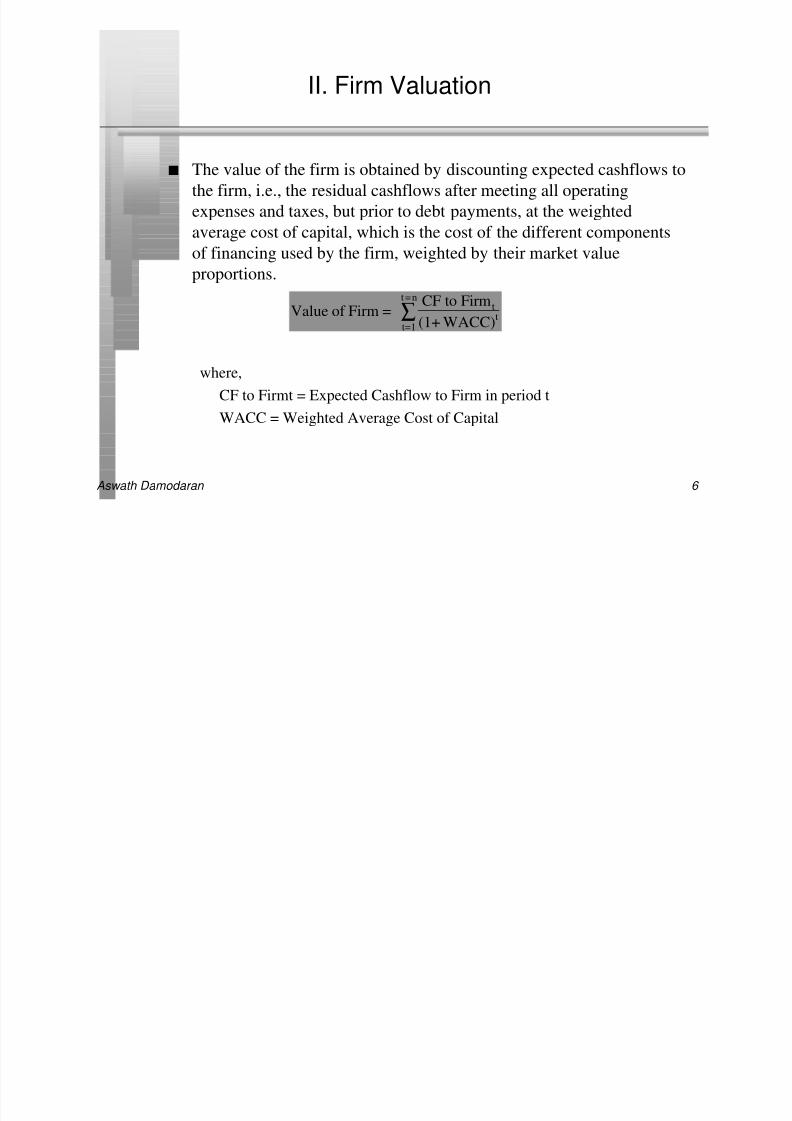
II. Firm Valuation
n The value of the firm is obtained by discounting expected cashflows to
the firm, i.e., the residual cashflows after meeting all operating
expenses and taxes, but prior to debt payments, at the weighted
average cost of capital, which is the cost of the different components
of financing used by the firm, weighted by their market value
proportions.
where,
CF to Firmt = Expected Cashflow to Firm in period t
WACC = Weighted Average Cost of Capital
Value of Firm =CF to Firmt
(1+ WACC)tt=1
t=n
∑

8/7/2019 damodaran ch12
http://slidepdf.com/reader/full/damodaran-ch12 7/65
Aswath Damodaran 7
Equity versus Firm Valuation
n It is often argued that equity valuation requires more assumptions than
firm valuation, because cash flows to equity require explicit
assumptions about changes in leverage whereas cash flows to the firm
are pre-debt cash flows and do not require assumptions about leverage.
Is this true?
o Yes
o No

8/7/2019 damodaran ch12
http://slidepdf.com/reader/full/damodaran-ch12 8/65
Aswath Damodaran 8
First Principle of Valuation
n Never mix and match cash flows and discount rates.
n The key error to avoid is mismatching cashflows and discount rates,
since discounting cashflows to equity at the weighted average cost of
capital will lead to an upwardly biased estimate of the value of equity,while discounting cashflows to the firm at the cost of equity will yield
a downward biased estimate of the value of the firm.
8/7/2019 damodaran ch12
http://slidepdf.com/reader/full/damodaran-ch12 9/65
Aswath Damodaran 9
Valuation: The Key Inputs
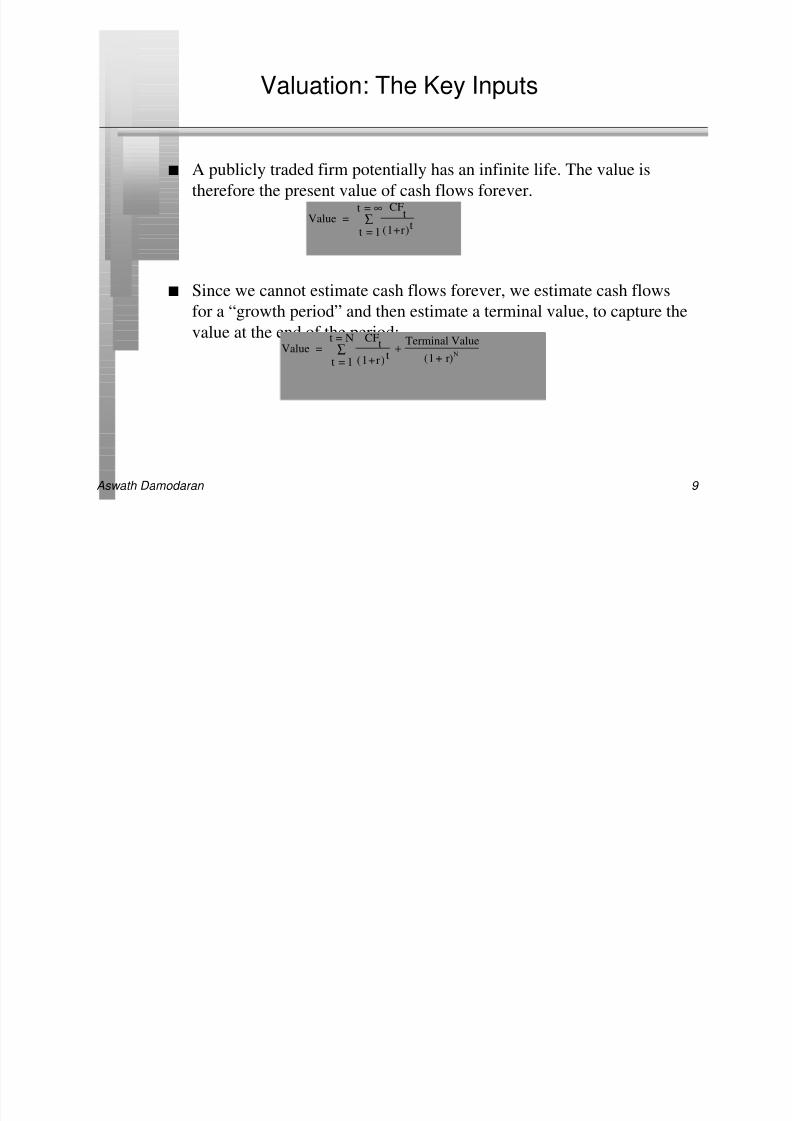
n A publicly traded firm potentially has an infinite life. The value is
therefore the present value of cash flows forever.
n Since we cannot estimate cash flows forever, we estimate cash flows
for a “growth period” and then estimate a terminal value, to capture the
value at the end of the period:
Value =CF
t
(1+r)tt = 1
t = ∞∑
Value =CF
t
(1+r)t
+Terminal Value
(1+ r)
N
t = 1
t = N∑
8/7/2019 damodaran ch12
http://slidepdf.com/reader/full/damodaran-ch12 10/65
Aswath Damodaran 10
Stable Growth and Terminal Value
n When a firm’s cash flows grow at a “constant” rate forever, the present
value of those cash flows can be written as:
Value = Expected Cash Flow Next Period / (r - g)
where,r = Discount rate (Cost of Equity or Cost of Capital)
g = Expected growth rate
n This “constant” growth rate is called a stable growth rate and cannot
be higher than the growth rate of the economy in which the firm
operates.
n While companies can maintain high growth rates for extended periods,
they will all approach “stable growth” at some point in time.
n When they do approach stable growth, the valuation formula above
can be used to estimate the “terminal value” of all cash flows beyond.
8/7/2019 damodaran ch12
http://slidepdf.com/reader/full/damodaran-ch12 11/65
Aswath Damodaran 11
Growth Patterns
n A key assumption in all discounted cash flow models is the period of
high growth, and the pattern of growth during that period. In general,
we can make one of three assumptions:
• there is no high growth, in which case the firm is already in stable growth• there will be high growth for a period, at the end of which the growth rate
will drop to the stable growth rate (2-stage)
• there will be high growth for a period, at the end of which the growth rate
will decline gradually to a stable growth rate(3-stage)
n The assumption of how long high growth will continue will depend
upon several factors including:• the size of the firm (larger firm -> shorter high growth periods)
• current growth rate (if high -> longer high growth period)
• barriers to entry and differential advantages (if high -> longer growth
period)

8/7/2019 damodaran ch12
http://slidepdf.com/reader/full/damodaran-ch12 12/65
Aswath Damodaran 12
Length of High Growth Period
n Assume that you are analyzing two firms, both of which are enjoying
high growth. The first firm is Earthlink Network, an internet service
provider, which operates in an environment with few barriers to entry
and extraordinary competition. The second firm is Biogen, a bio-
technology firm which is enjoying growth from two drugs to which it
owns patents for the next decade. Assuming that both firms are well
managed, which of the two firms would you expect to have a longer
high growth period?
o Earthlink Network
o Biogeno Both are well managed and should have the same high growth period

8/7/2019 damodaran ch12
http://slidepdf.com/reader/full/damodaran-ch12 13/65
Aswath Damodaran 13
Choosing a Growth Pattern: Examples
Company Valuation in Growth Period Stable Growth
Disney Nominal U.S. $ 10 years 5%(long term
Firm (3-stage) nominal growth rate
in the U.S. economyAracruz Real BR 5 years 5%: based upon
Equity: FCFE (2-stage) expected long term
real growth rate for
Brazilian economy
Deutsche Bank Nominal DM 0 years 5%: set equal to
Equity: Dividends nominal growth ratein the world
economy
8/7/2019 damodaran ch12
http://slidepdf.com/reader/full/damodaran-ch12 14/65
Aswath Damodaran 14
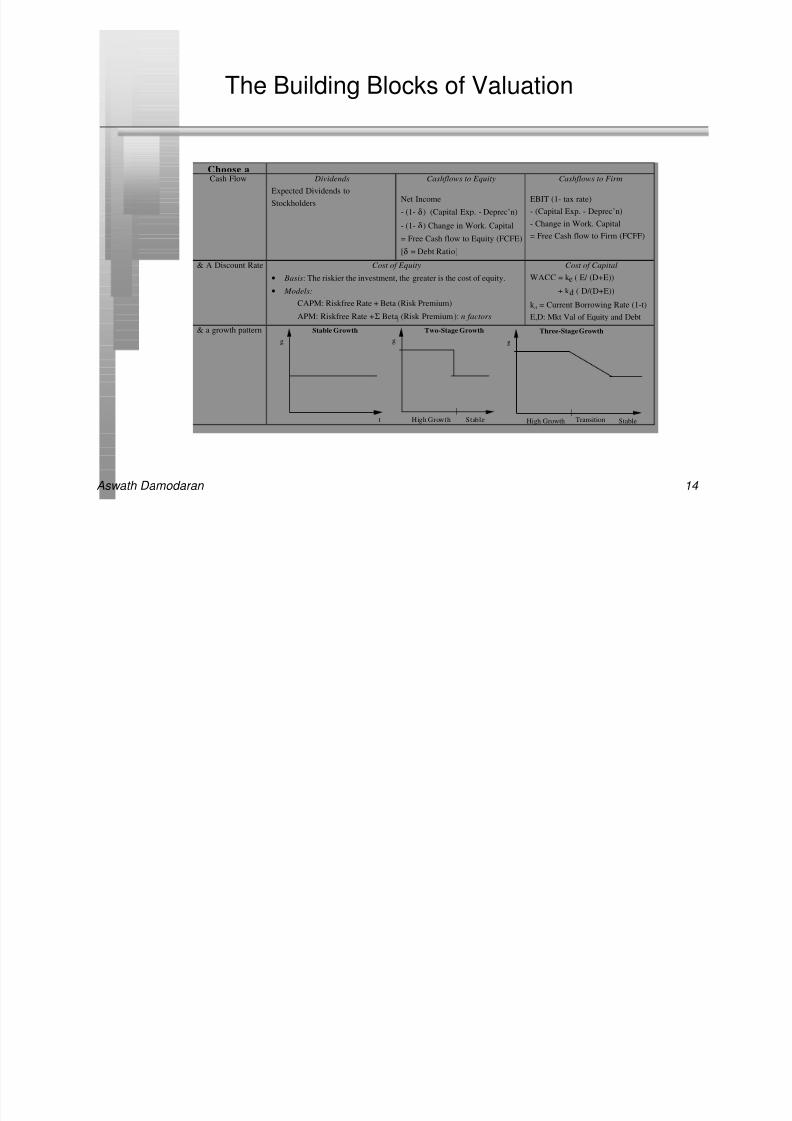
The Building Blocks of Valuation
Choose aCash Flow Dividends
Expected Dividends to
Stockholders
Cashflows to Equity
Net Income
- (1- δ) (Capital Exp. - Deprec’n)
- (1- δ) Change in Work. Capital
= Free Cash flow to Equity (FCFE)
[δ = Debt Ratio]
Cashflows to Firm
EBIT (1- tax rate)
- (Capital Exp. - Deprec’n)
- Change in Work. Capital
= Free Cash flow to Firm (FCFF)
& A Discount Rate Cost of Equity
• Basis: The riskier the investment, the greater is the cost of equity.
• Models:
CAPM: Riskfree Rate + Beta (Risk Premium)
APM: Riskfree Rate +Σ Betaj (Risk Premiumj): n factors
Cost of Capital
WACC = k e ( E/ (D+E))
+ k d ( D/(D+E))
k d = Current Borrowing Rate (1-t)
E,D: Mkt Val of Equity and Debt
& a growth pattern
t
g
Stable Growth
g
Two-Stage Growth
|
High Growth Stable
g
Three-Stage Growth
|
High Growth StableTransition

8/7/2019 damodaran ch12
http://slidepdf.com/reader/full/damodaran-ch12 15/65
Aswath Damodaran 15
Estimating Inputs: Discount Rates
n Critical ingredient in discounted cashflow valuation. Errors in
estimating the discount rate or mismatching cashflows and discount
rates can lead to serious errors in valuation.
n
At an intutive level, the discount rate used should be consistent withboth the riskiness and the type of cashflow being discounted.
8/7/2019 damodaran ch12
http://slidepdf.com/reader/full/damodaran-ch12 16/65
Aswath Damodaran 16
I. Cost of Equity
n The cost of equity is the rate of return that investors require to make an
equity investment in a firm. There are two approaches to estimating
the cost of equity;
• a risk and return model
• a dividend-growth model.
n Using the CAPM, for instance, gives you a cost of equity based upon
the beta of the equity in the firm.
8/7/2019 damodaran ch12
http://slidepdf.com/reader/full/damodaran-ch12 17/65
Aswath Damodaran 17
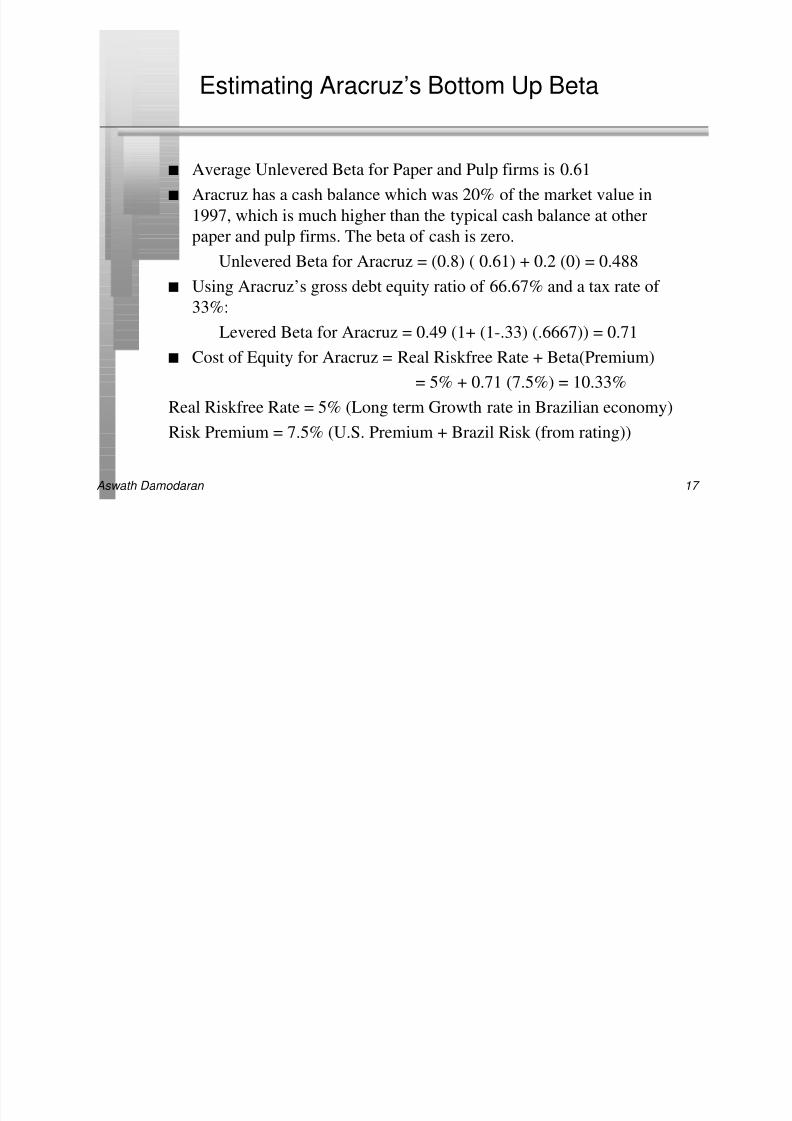
Estimating Aracruz’s Bottom Up Beta
n Average Unlevered Beta for Paper and Pulp firms is 0.61
n Aracruz has a cash balance which was 20% of the market value in
1997, which is much higher than the typical cash balance at other
paper and pulp firms. The beta of cash is zero.Unlevered Beta for Aracruz = (0.8) ( 0.61) + 0.2 (0) = 0.488
n Using Aracruz’s gross debt equity ratio of 66.67% and a tax rate of
33%:
Levered Beta for Aracruz = 0.49 (1+ (1-.33) (.6667)) = 0.71
n
Cost of Equity for Aracruz = Real Riskfree Rate + Beta(Premium)= 5% + 0.71 (7.5%) = 10.33%
Real Riskfree Rate = 5% (Long term Growth rate in Brazilian economy)
Risk Premium = 7.5% (U.S. Premium + Brazil Risk (from rating))
8/7/2019 damodaran ch12
http://slidepdf.com/reader/full/damodaran-ch12 18/65
Aswath Damodaran 18
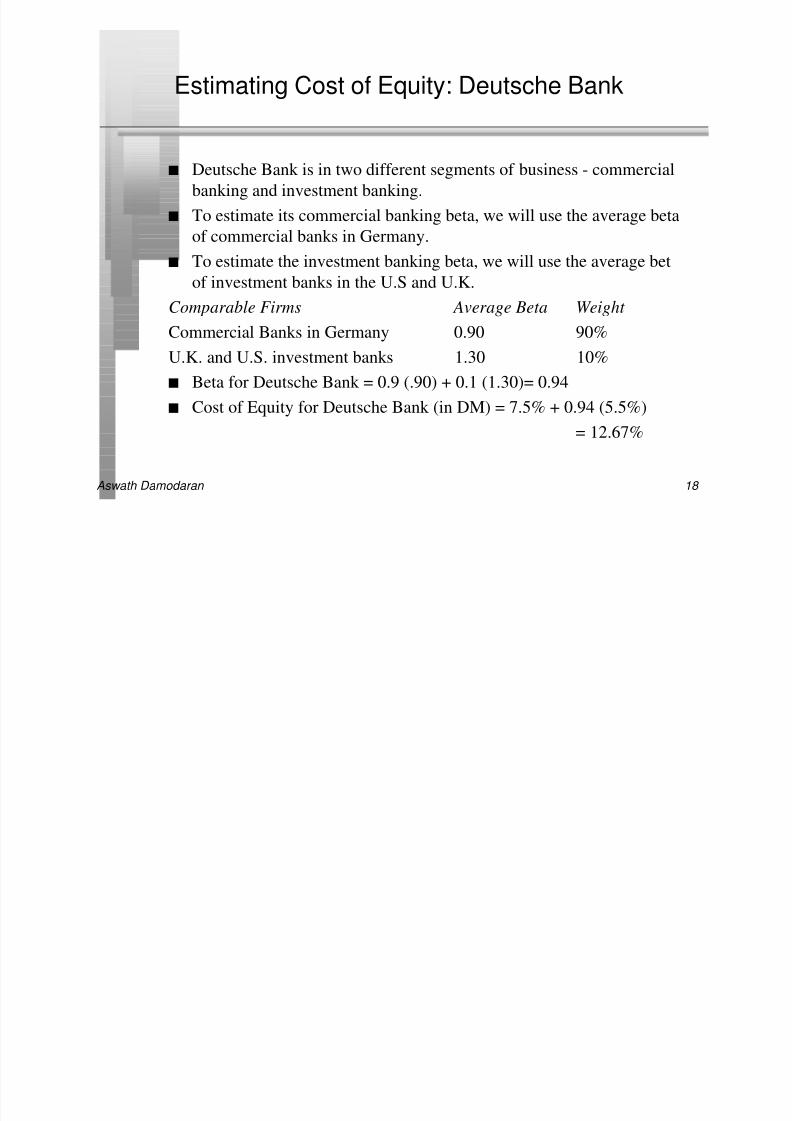
Estimating Cost of Equity: Deutsche Bank
n Deutsche Bank is in two different segments of business - commercial
banking and investment banking.
n To estimate its commercial banking beta, we will use the average beta
of commercial banks in Germany.n To estimate the investment banking beta, we will use the average bet
of investment banks in the U.S and U.K.
Comparable Firms Average Beta Weight
Commercial Banks in Germany 0.90 90%
U.K. and U.S. investment banks 1.30 10%n Beta for Deutsche Bank = 0.9 (.90) + 0.1 (1.30)= 0.94
n Cost of Equity for Deutsche Bank (in DM) = 7.5% + 0.94 (5.5%)
= 12.67%

8/7/2019 damodaran ch12
http://slidepdf.com/reader/full/damodaran-ch12 19/65
Aswath Damodaran 19
II. Cost of Capital
n It will depend upon:
• (a) the components of financing: Debt, Equity or Preferred stock
• (b) the cost of each component
n In summary, the cost of capital is the cost of each component weightedby its relative market value.
n WACC = k e
(E/(D+E)) + k d
(D/(D+E))

8/7/2019 damodaran ch12
http://slidepdf.com/reader/full/damodaran-ch12 20/65
Aswath Damodaran 20
Reviewing Disney’s Costs of Equity & Debt
Business E/(D+E) Cost of D/(D+E) After-tax Cost of Capital
Equity Cost of Debt
Creative Content 82.70% 14.80% 17.30% 4.80% 13.07%
Retailing 82.70% 16.35% 17.30% 4.80% 14.36%
Broadcasting 82.70% 12.61% 17.30% 4.80% 11.26%
Theme Parks 82.70% 13.91% 17.30% 4.80% 12.32%
Real Estate 66.67% 12.08% 33.33% 4.80% 9.65%
Disney 81.99% 13.85% 18.01% 4.80% 12.22%
n Disney’s Cost of Debt (based upon rating) = 7.50%

8/7/2019 damodaran ch12
http://slidepdf.com/reader/full/damodaran-ch12 21/65
Aswath Damodaran 21
Estimating Cost of Capital: Disney
n Equity
• Cost of Equity = 13.85%
• Market Value of Equity = $50.88 Billion
• Equity/(Debt+Equity ) = 82%n Debt
• After-tax Cost of debt = 7.50% (1-.36) = 4.80%
• Market Value of Debt = $ 11.18 Billion
• Debt/(Debt +Equity) = 18%
n Cost of Capital = 13.85%(.82)+4.80%(.18) = 12.22%
8/7/2019 damodaran ch12
http://slidepdf.com/reader/full/damodaran-ch12 22/65
Aswath Damodaran 22
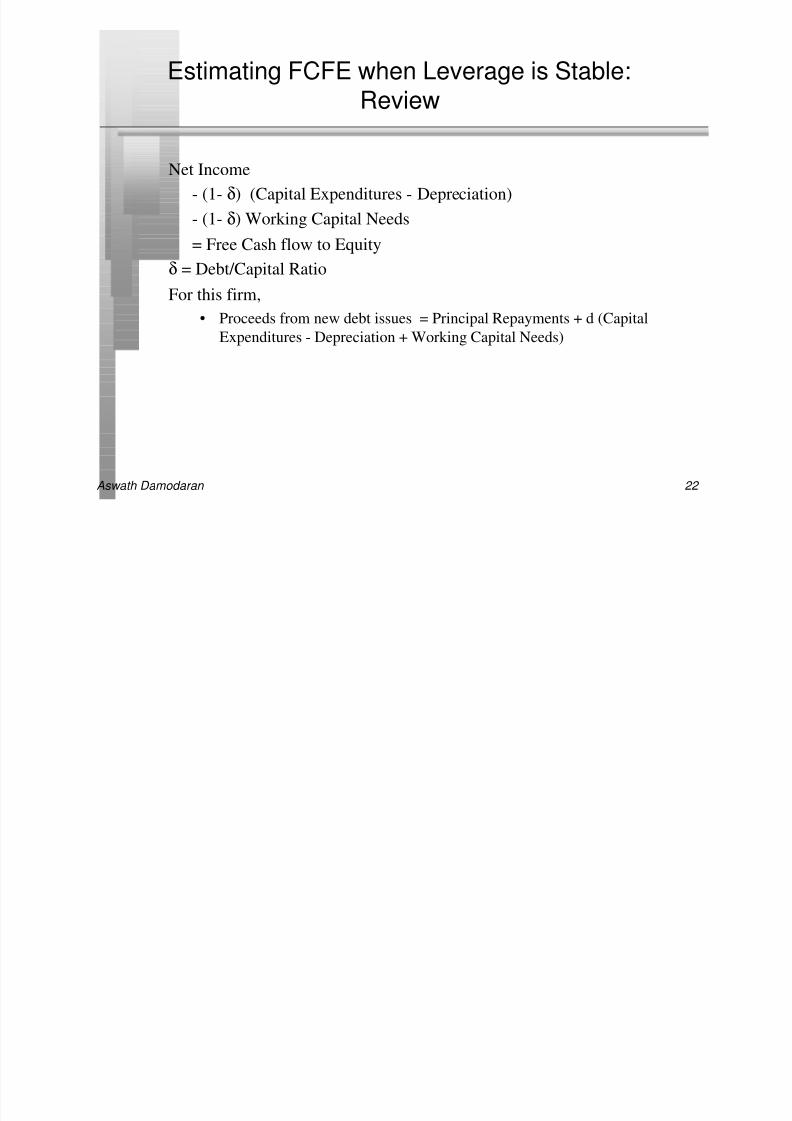
Estimating FCFE when Leverage is Stable:Review
Net Income
- (1- δ) (Capital Expenditures - Depreciation)
- (1- δ) Working Capital Needs
= Free Cash flow to Equityδ = Debt/Capital Ratio
For this firm,
• Proceeds from new debt issues = Principal Repayments + d (Capital
Expenditures - Depreciation + Working Capital Needs)

8/7/2019 damodaran ch12
http://slidepdf.com/reader/full/damodaran-ch12 23/65
Aswath Damodaran 23
Estimating FCFE next year: Aracruz
All inputs are per share numbers:
Earnings BR 0.222
- (CapEx-Depreciation)*(1-DR) BR 0.042
-Chg. Working Capital*(1-DR) BR 0.010Free Cashflow to Equity BR 0.170
n Earnings: Since Aracruz’s 1996 earnings are “abnormally” low, I used
the average earnings per share from 1992 to 1996.
n Capital Expenditures per share next year = 0.24 BR/share
n Depreciation per share next year = 0.18 BR/sharen Change in Working Capital = 0.03 BR/share
n Debt Ratio = 39%
8/7/2019 damodaran ch12
http://slidepdf.com/reader/full/damodaran-ch12 24/65
Aswath Damodaran 24
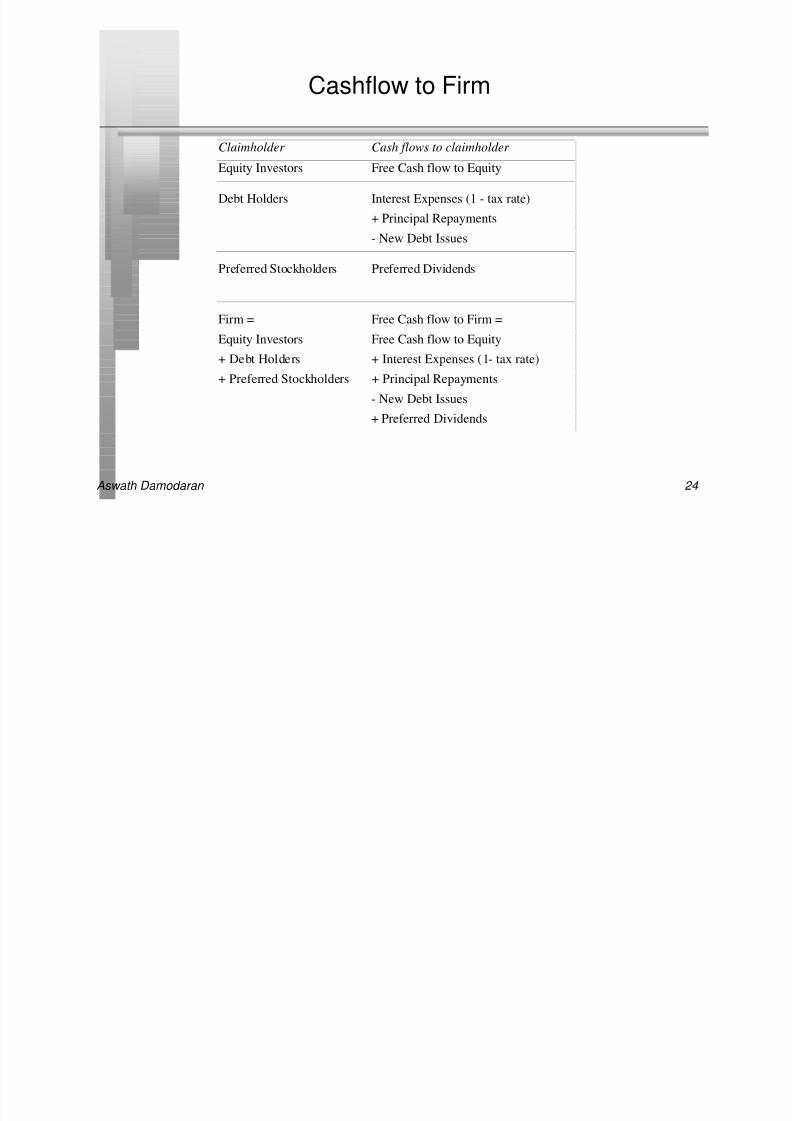
Cashflow to Firm
Claimholder Cash flows to claimholder
Equity Investors Free Cash flow to Equity
Debt Holders Interest Expenses (1 - tax rate)
+ Principal Repayments
- New Debt Issues
Preferred Stockholders Preferred Dividends
Firm = Free Cash flow to Firm =
Equity Investors Free Cash flow to Equity
+ Debt Holders + Interest Expenses (1- tax rate)
+ Preferred Stockholders + Principal Repayments
- New Debt Issues
+ Preferred Dividends

8/7/2019 damodaran ch12
http://slidepdf.com/reader/full/damodaran-ch12 25/65
Aswath Damodaran 25
A Simpler Approach
EBIT ( 1 - tax rate)
+ Depreciation
- Capital Spending
- Change in Working Capital= Cash flow to the firm

8/7/2019 damodaran ch12
http://slidepdf.com/reader/full/damodaran-ch12 26/65
Aswath Damodaran 26
Estimating FCFF: Disney
n EBIT = $5,559 Million
n Capital spending = $ 1,746 Million
n Depreciation = $ 1,134 Million
n Non-cash Working capital Change = $ 617 Millionn Estimating FCFF
EBIT (1-t) $ 3,558
+ Depreciation $ 1,134
- Capital Expenditures $ 1,746
- Change in WC $ 617= FCFF $ 2,329 Million

8/7/2019 damodaran ch12
http://slidepdf.com/reader/full/damodaran-ch12 27/65
Aswath Damodaran 27
Expected Growth in EPS
gEPS = Retained Earningst-1/ NIt-1 * ROE
= Retention Ratio * ROE
= b * ROE
• Proposition 1: The expected growth rate in earnings for a companycannot exceed its return on equity in the long term.

8/7/2019 damodaran ch12
http://slidepdf.com/reader/full/damodaran-ch12 28/65
Aswath Damodaran 28
Estimating Expected Growth in EPS: Disney,Aracruz and Deutsche Bank
Company ROE Retention Exp. Forecast Retention Exp
Ratio Growth ROE Ratio Growth
Disney 24.95% 77.68% 19.38% 25% 77.68% 19.42%
Aracruz 2.22% 65.00% 1.44% 13.91% 65.00% 9.04%Deutsche Bank 7.25% 39.81% 2.89% 14.00% 45.00% 6.30%
ROE: Return on Equity for most recent year
Forecasted ROE = Expected ROE for the next 5 years
• For Disney, forecasted ROE is expected to be close to current ROE
• For Aracruz, the average ROE between 1994 and 1996 is used, since 1996was a abnormally bad year
• For Deutsche Bank, the forecast ROE is set equal to the average ROE for
German banks
8/7/2019 damodaran ch12
http://slidepdf.com/reader/full/damodaran-ch12 29/65
Aswath Damodaran 29
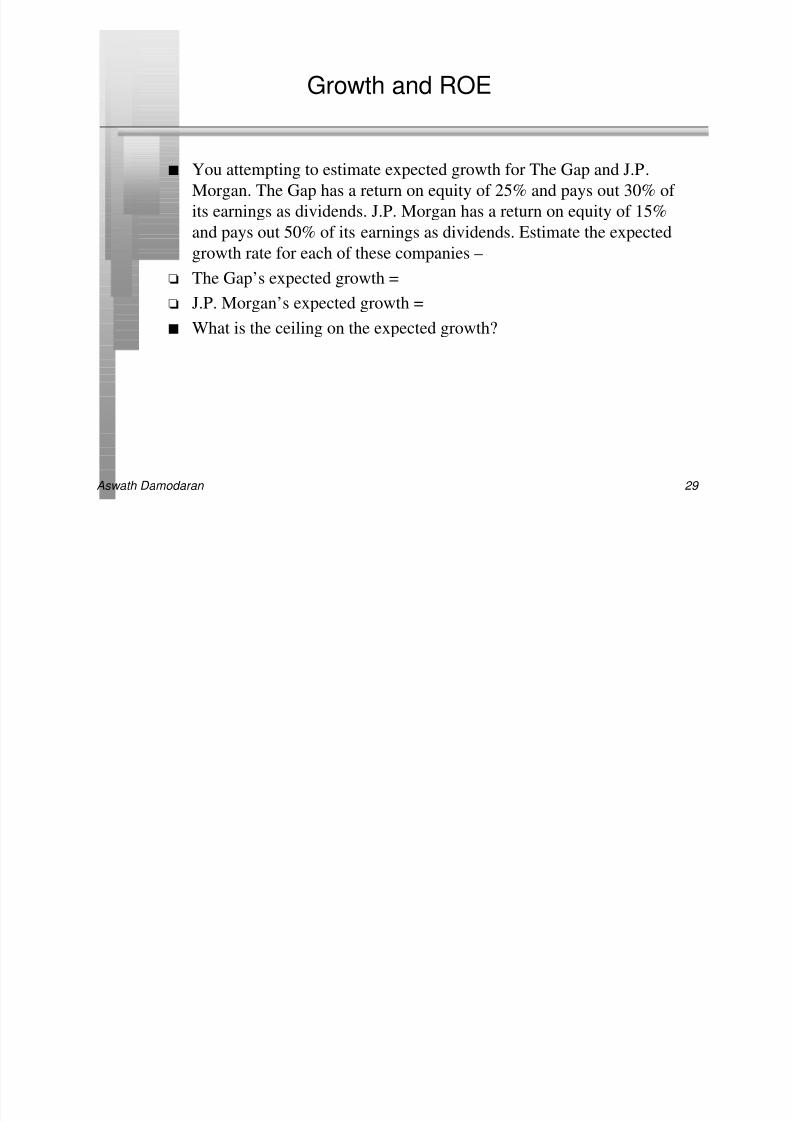
Growth and ROE
n You attempting to estimate expected growth for The Gap and J.P.
Morgan. The Gap has a return on equity of 25% and pays out 30% of
its earnings as dividends. J.P. Morgan has a return on equity of 15%
and pays out 50% of its earnings as dividends. Estimate the expected
growth rate for each of these companies –
o The Gap’s expected growth =
o J.P. Morgan’s expected growth =
n What is the ceiling on the expected growth?

8/7/2019 damodaran ch12
http://slidepdf.com/reader/full/damodaran-ch12 30/65
Aswath Damodaran 30
ROE and Leverage
n ROE = ROC + D/E (ROC - i (1-t))
where,
ROC = (Net Income + Interest (1 - tax rate)) / BV of Capital
= EBIT (1- t) / BV of CapitalD/E = BV of Debt/ BV of Equity
i = Interest Expense on Debt / BV of Debt
t = Tax rate on ordinary income
n Note that BV of Assets = BV of Debt + BV of Equity.
8/7/2019 damodaran ch12
http://slidepdf.com/reader/full/damodaran-ch12 31/65
Aswath Damodaran 31
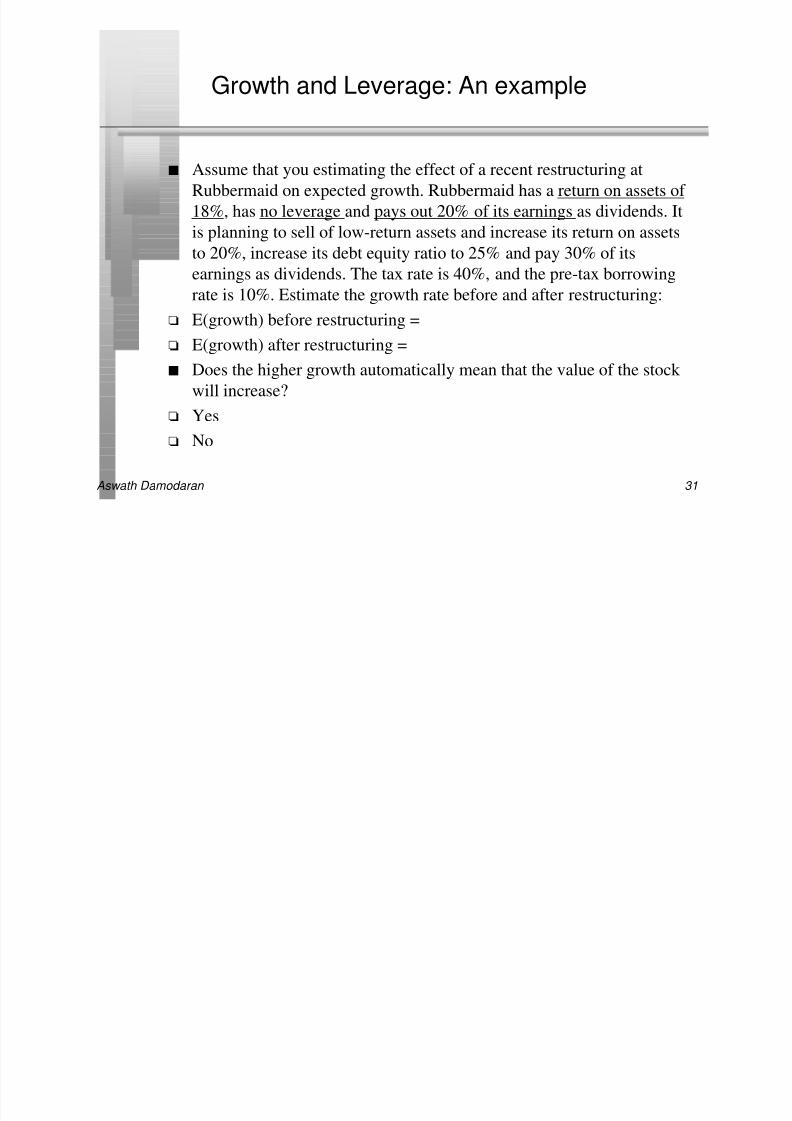
Growth and Leverage: An example
n Assume that you estimating the effect of a recent restructuring at
Rubbermaid on expected growth. Rubbermaid has a return on assets of
18%, has no leverage and pays out 20% of its earnings as dividends. It
is planning to sell of low-return assets and increase its return on assets
to 20%, increase its debt equity ratio to 25% and pay 30% of its
earnings as dividends. The tax rate is 40%, and the pre-tax borrowing
rate is 10%. Estimate the growth rate before and after restructuring:
o E(growth) before restructuring =
o E(growth) after restructuring =
n Does the higher growth automatically mean that the value of the stock will increase?
o Yes
o No

8/7/2019 damodaran ch12
http://slidepdf.com/reader/full/damodaran-ch12 32/65
Aswath Damodaran 32
Decomposing ROE: Disney in 1996
n Return on Capital
= (EBIT(1-tax rate) / (BV: Debt + BV: Equity)
= 5559 (1-.36)/ (7663+11668) = 18.69%
n Debt Equity Ratio= Debt/Market Value of Equity = 45.00%
= 8.98%
n Interest Rate on Debt = 7.50%
n Expected Return on Equity = ROC + D/E (ROC - i(1-t))
= 18.69 % + .45 (18.69% - 7.50(1-.36)) = 24.95%

8/7/2019 damodaran ch12
http://slidepdf.com/reader/full/damodaran-ch12 33/65
Aswath Damodaran 33
Expected Growth in EBIT And Fundamentals
n Reinvestment Rate and Return on Capital
gEBIT = (Net Capital Expenditures + Change in WC)/EBIT(1-t) * ROC
= Reinvestment Rate * ROC
n
Proposition 2: No firm can expect its operating income to grow overtime without reinvesting some of the operating income in net capital
expenditures and/or working capital.
n Proposition 3: The net capital expenditure needs of a firm, for a given
growth rate, should be inversely proportional to the quality of its
investments.
8/7/2019 damodaran ch12
http://slidepdf.com/reader/full/damodaran-ch12 34/65
Aswath Damodaran 34
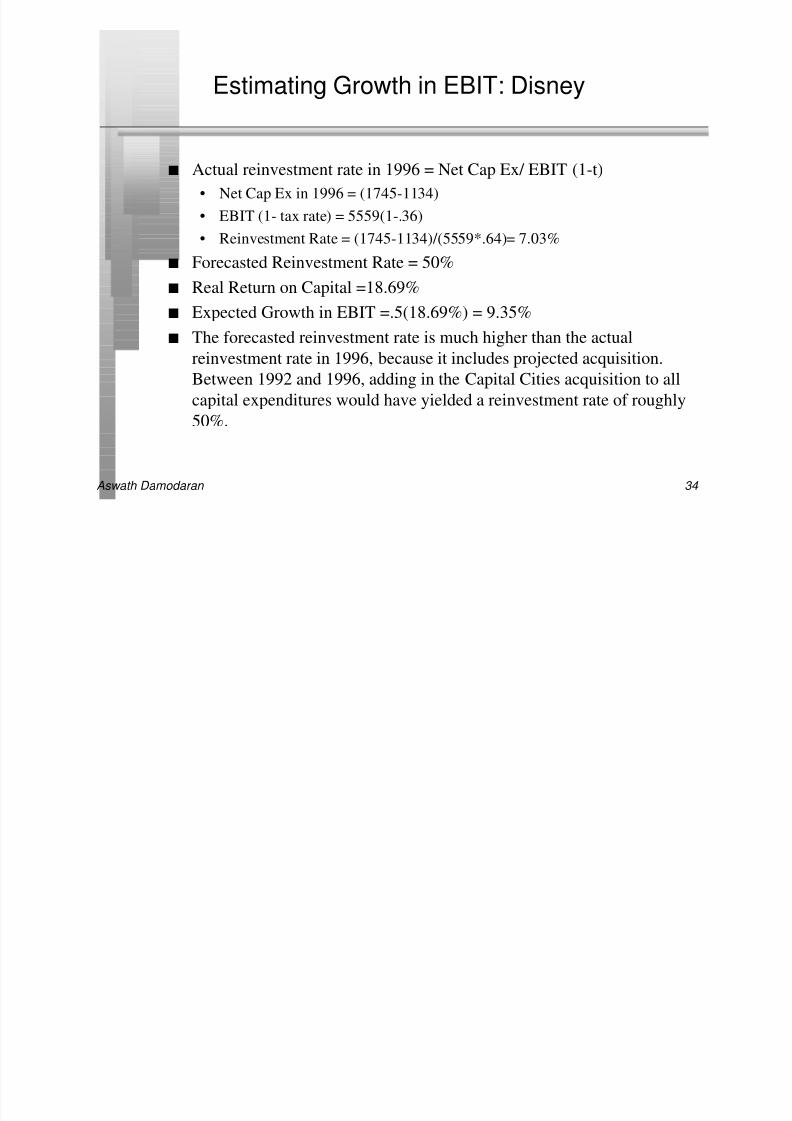
Estimating Growth in EBIT: Disney
n Actual reinvestment rate in 1996 = Net Cap Ex/ EBIT (1-t)
• Net Cap Ex in 1996 = (1745-1134)
• EBIT (1- tax rate) = 5559(1-.36)
• Reinvestment Rate = (1745-1134)/(5559*.64)= 7.03%n Forecasted Reinvestment Rate = 50%
n Real Return on Capital =18.69%
n Expected Growth in EBIT =.5(18.69%) = 9.35%
n The forecasted reinvestment rate is much higher than the actual
reinvestment rate in 1996, because it includes projected acquisition.Between 1992 and 1996, adding in the Capital Cities acquisition to all
capital expenditures would have yielded a reinvestment rate of roughly
50%.

8/7/2019 damodaran ch12
http://slidepdf.com/reader/full/damodaran-ch12 35/65
Aswath Damodaran 35
The No Net Cap Ex Assumption
n Many analysts assume that capital expenditures offset depreciation,
when doing valuation. Is it an appropriate assumption to make for a
high growth firm?
o Yes
o No
n If the net cap ex is zero and there are no working capital requirements,
what should the expected growth rate be?

8/7/2019 damodaran ch12
http://slidepdf.com/reader/full/damodaran-ch12 36/65
Aswath Damodaran 36
Return on Capital, Profit Margin and AssetTurnover
n Return on Capital
= EBIT (1-t) / Total Assets
= [EBIT (1-t) / Sales] * [Sales/Total Assets]
= After-tax Operating Margin * Asset Turnovern Thus, a firm can improve its return on capital in one of two ways:
• It can increase its after-tax operating margin
• It can improve its asset turnover, by selling more of the same asset base
n This is a useful way of thinking about
• choosing between a low-price, high-volume strategy and a high-price,
lower-volume strategy
• the decision of whether to change price levels (decrease or increase) and
the resulting effect on volume

8/7/2019 damodaran ch12
http://slidepdf.com/reader/full/damodaran-ch12 37/65
Aswath Damodaran 37
Firm Characteristics as Growth Changes
Variable High Growth Firms tend to Stable Growth Firms tend to
Risk be above-average risk be average risk
Dividend Payout pay little or no dividends pay high dividends
Net Cap Ex have high net cap ex have low net cap ex
Return on Capital earn high ROC (excess return) earn ROC closer to WACC
Leverage have little or no debt higher leverage
8/7/2019 damodaran ch12
http://slidepdf.com/reader/full/damodaran-ch12 38/65
Aswath Damodaran 38
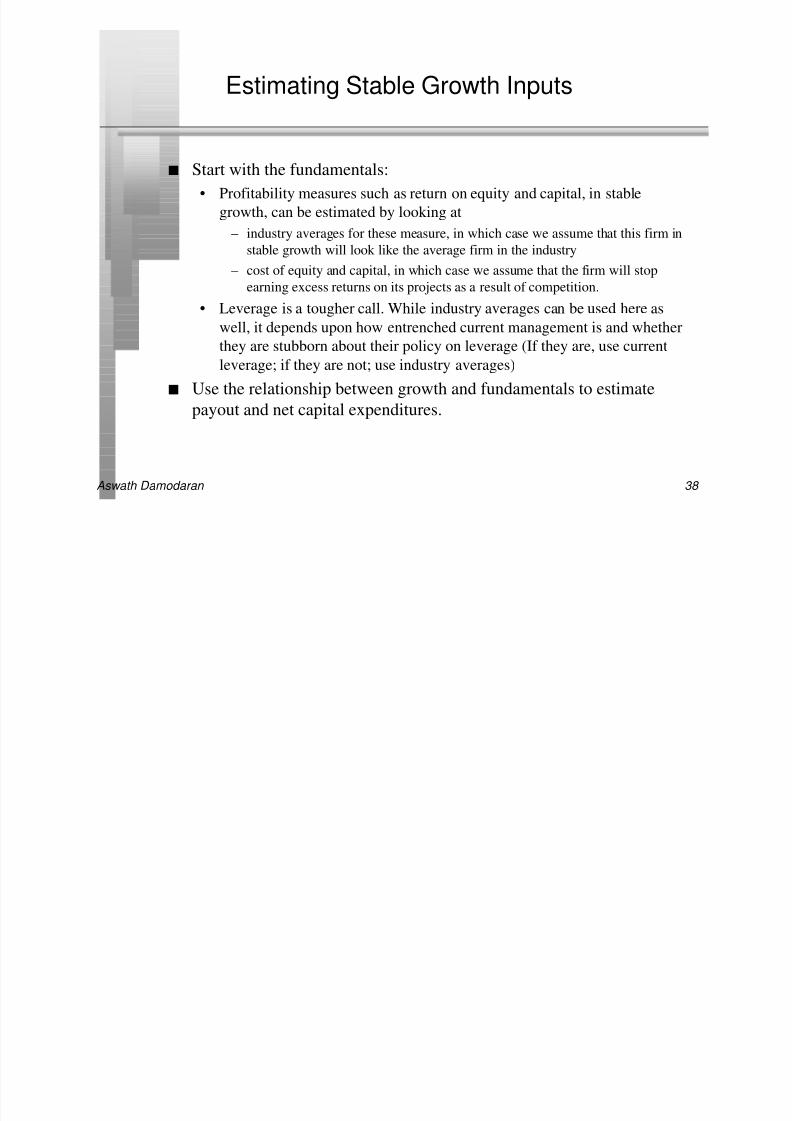
Estimating Stable Growth Inputs
n Start with the fundamentals:
• Profitability measures such as return on equity and capital, in stable
growth, can be estimated by looking at
– industry averages for these measure, in which case we assume that this firm in
stable growth will look like the average firm in the industry
– cost of equity and capital, in which case we assume that the firm will stop
earning excess returns on its projects as a result of competition.
• Leverage is a tougher call. While industry averages can be used here as
well, it depends upon how entrenched current management is and whether
they are stubborn about their policy on leverage (If they are, use current
leverage; if they are not; use industry averages)n Use the relationship between growth and fundamentals to estimate
payout and net capital expenditures.
8/7/2019 damodaran ch12
http://slidepdf.com/reader/full/damodaran-ch12 39/65
Aswath Damodaran 39
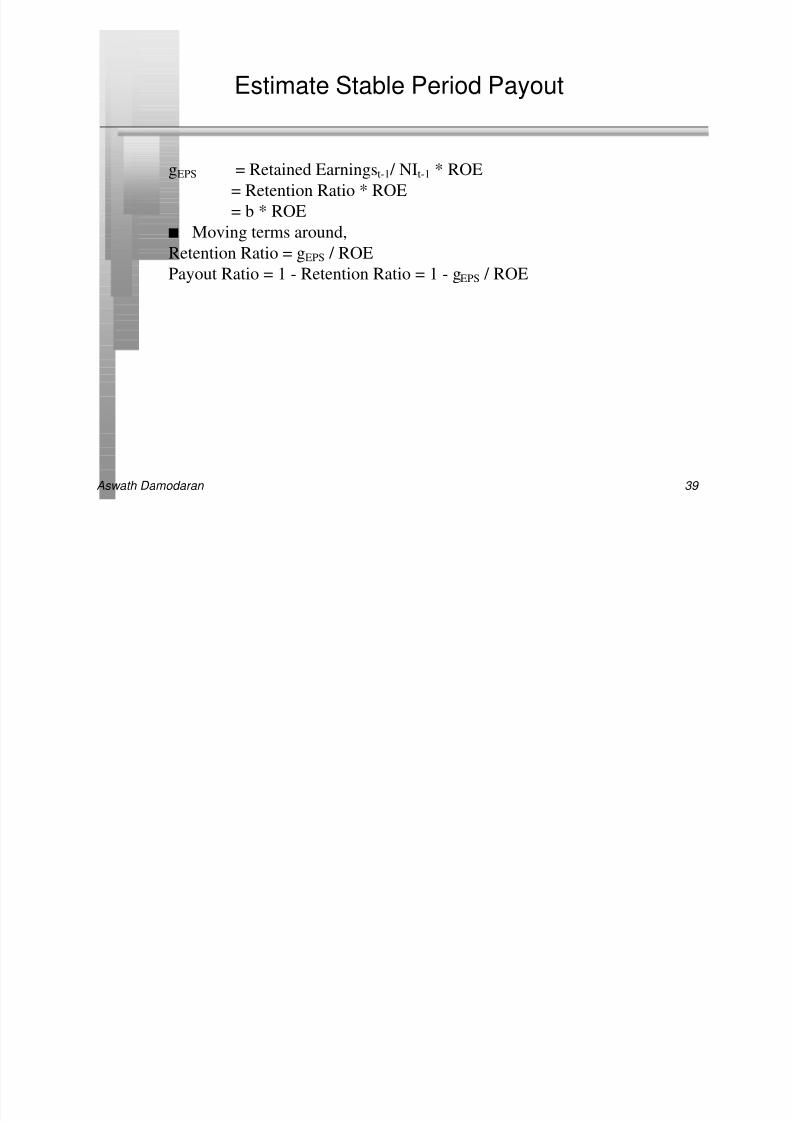
Estimate Stable Period Payout
gEPS = Retained Earningst-1/ NIt-1 * ROE
= Retention Ratio * ROE
= b * ROE
n Moving terms around,
Retention Ratio = gEPS / ROEPayout Ratio = 1 - Retention Ratio = 1 - gEPS / ROE

8/7/2019 damodaran ch12
http://slidepdf.com/reader/full/damodaran-ch12 40/65
Aswath Damodaran 40
Estimating Stable Period Net Cap Ex
gEBIT = (Net Capital Expenditures + Change in WC)/EBIT(1-t) * ROC
= Reinvestment Rate * ROC
n Moving terms around,
Reinvestment Rate = gEBIT / Return on Capitaln For instance, assume that Disney in stable growth will grow 5% and
that its return on capital in stable growth will be 16%. The
reinvestment rate will then be:
Reinvestment Rate for Disney in Stable Growth = 5/16 = 31.25%
n In other words,
• the net capital expenditures and working capital investment each year
during the stable growth period will be 31.25% of after-tax operating
income.

8/7/2019 damodaran ch12
http://slidepdf.com/reader/full/damodaran-ch12 41/65
Aswath Damodaran 41
The Importance of Terminal Value
n The bulk of the present value in most discounted cash flow valuations
comes from the terminal value. Therefore, it is reasonable to conclude
that the assumptions about growth during the high growth period do
not affect value as much as assumptions about the terminal price.
o True
o False
n Explain.

8/7/2019 damodaran ch12
http://slidepdf.com/reader/full/damodaran-ch12 42/65
Aswath Damodaran 42
Valuation: Deutsche Bank
n Sustainable growth at Deutsche Bank = ROE * Retention Ratio
= 14% (.45) = 6.30% { I used the normalized numbers for this]
n Cost of equity = 7.5% + 0.94 (5.5%) = 12.67%.
n Current Dividends per share = 2.61 DMn Model Used:
• Stable Growth (Large firm; Growth is close to stable growth already)
• Dividend Discount Model (FCFE is tough to estimate)
n Valuation
• Expected Dividends per Share next year = 2.61 DM (1.063) = 2.73 DM• Value per Share = 2.73 DM / (.1267 - .063) = 42.89 DM
n Deutsche Bank was trading for 119 DM on the day of this analysis.

8/7/2019 damodaran ch12
http://slidepdf.com/reader/full/damodaran-ch12 43/65
Aswath Damodaran 43
What does the valuation tell us?
n Stock is tremendously overvalued: This valuation would suggest that
Deutsche Bank is significantly overvalued, given our estimates of
expected growth and risk.
n Dividends may not reflect the cash flows generated by Deutsche Bank.
TheFCFE could have been significantly higher than the dividends
paid.
n Estimates of growth and risk are wrong: It is also possible that we
have underestimated growth or overestimated risk in the model, thus
reducing our estimate of value.
8/7/2019 damodaran ch12
http://slidepdf.com/reader/full/damodaran-ch12 44/65
Aswath Damodaran 44
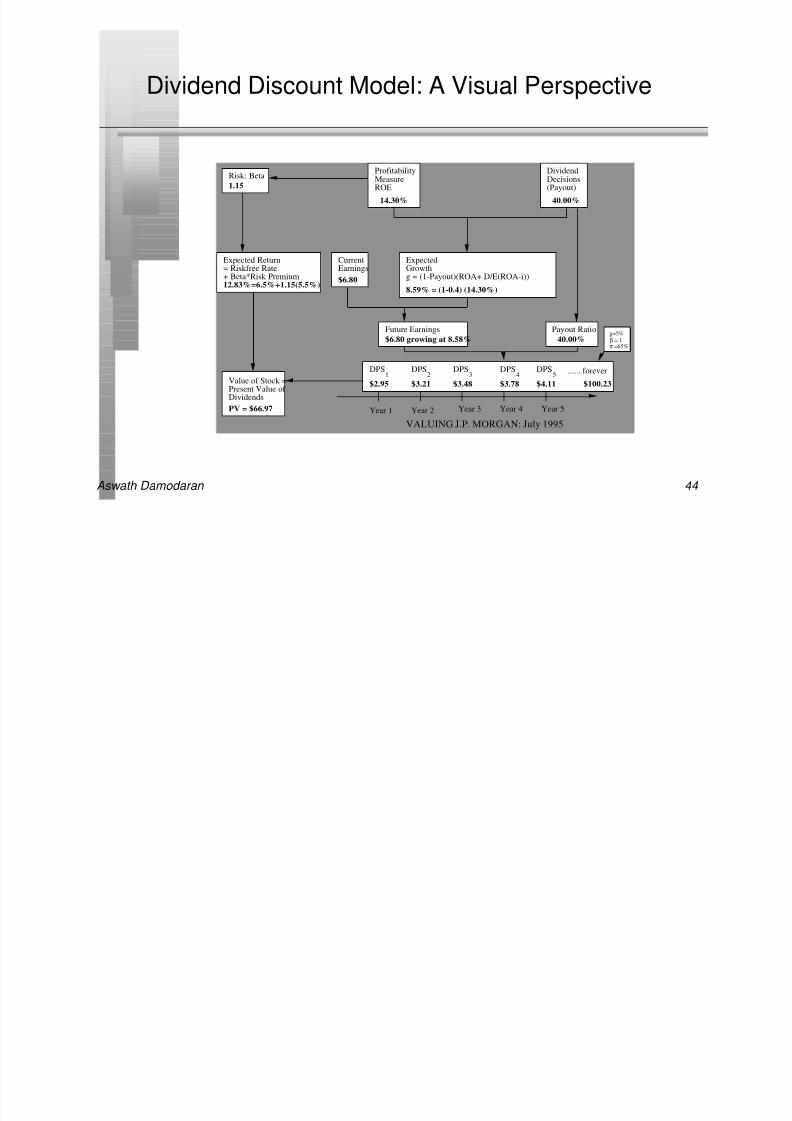
Dividend Discount Model: A Visual Perspective
ProfitabilityMeasureROE
DividendDecisions(Payout)
CurrentEarnings
ExpectedGrowthg = (1-Payout)(ROA+ D/E(ROA-i))
Risk: Beta
Expected Return= Riskfree Rate+ Beta*Risk Premium
Future Earnings Payout Ratio
DPS DPS DPS DPS DPS1 2 3 4 5 ...... foreverValue of Stock =Present Value of Dividends
Year 1 Year 2
1.15
14.30% 40.00%
8.59% = (1-0.4) (14.30%)
$6.80
40.00%$6.80 growing at 8.58%
$2.95 $3.21 $3.48 $3.78 $4.11 $100.23
Year 3 Year 4 Year 5
12.83%=6.5%+1.15(5.5%)
PV = $66.97
VALUING J.P. MORGAN: July 1995
g=5%β = 1π =65%

8/7/2019 damodaran ch12
http://slidepdf.com/reader/full/damodaran-ch12 45/65
Aswath Damodaran 45
Valuation: Aracruz Cellulose
n The current earnings per share for Aracruz Cellulose is 0.044 BR.
n These earnings are abnormally low. To normalize earnings, we use the
average earnings per share between 1994 and 1996 of 0.204 BR per
share as a measure of the normalized earnings per share.
n Model Used:
• Real valuation (since inflation is still in double digits)
• 2-Stage Growth (Firm is still growing in a high growth economy)
• FCFE Discount Model (Dividends are lower than FCFE: See Dividend
section)
8/7/2019 damodaran ch12
http://slidepdf.com/reader/full/damodaran-ch12 46/65
Aswath Damodaran 46
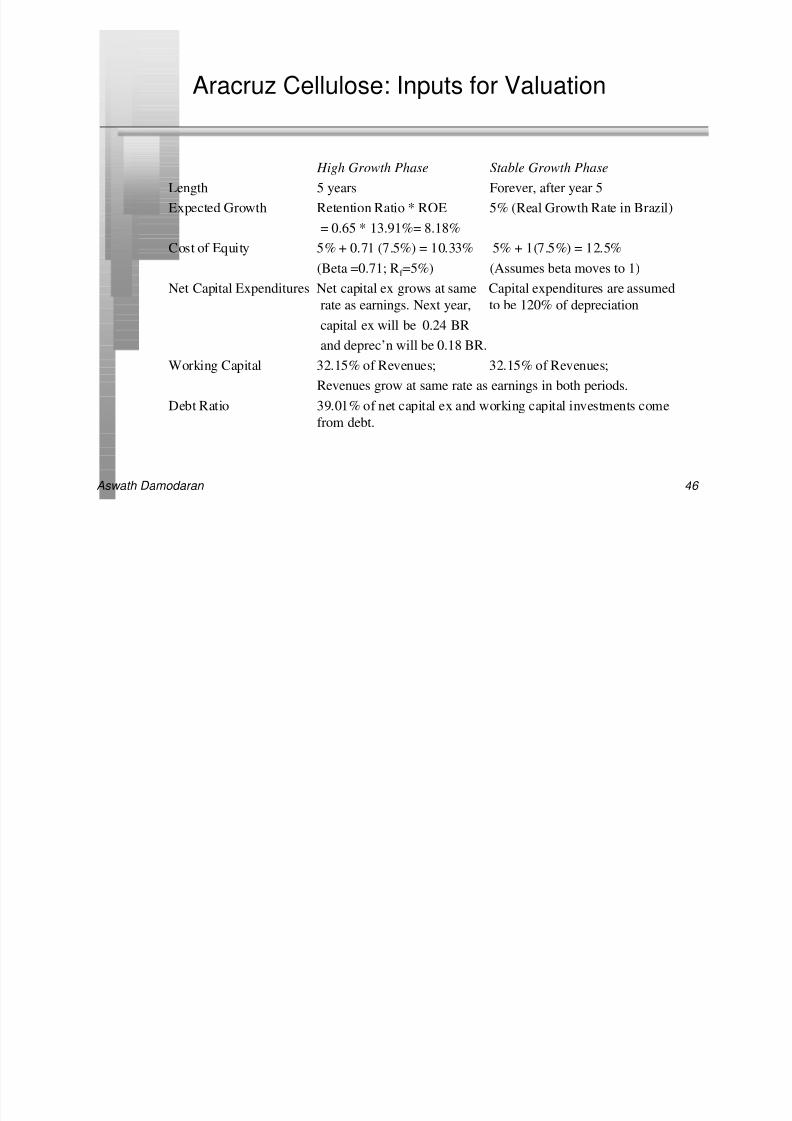
Aracruz Cellulose: Inputs for Valuation
High Growth Phase Stable Growth Phase
Length 5 years Forever, after year 5
Expected Growth Retention Ratio * ROE 5% (Real Growth Rate in Brazil)
= 0.65 * 13.91%= 8.18%
Cost of Equity 5% + 0.71 (7.5%) = 10.33% 5% + 1(7.5%) = 12.5%(Beta =0.71; Rf =5%) (Assumes beta moves to 1)
Net Capital Expenditures Net capital ex grows at same Capital expenditures are assumed
rate as earnings. Next year, to be 120% of depreciation
capital ex will be 0.24 BR
and deprec’n will be 0.18 BR.
Working Capital 32.15% of Revenues; 32.15% of Revenues;Revenues grow at same rate as earnings in both periods.
Debt Ratio 39.01% of net capital ex and working capital investments come
from debt.
8/7/2019 damodaran ch12
http://slidepdf.com/reader/full/damodaran-ch12 47/65
Aswath Damodaran 47
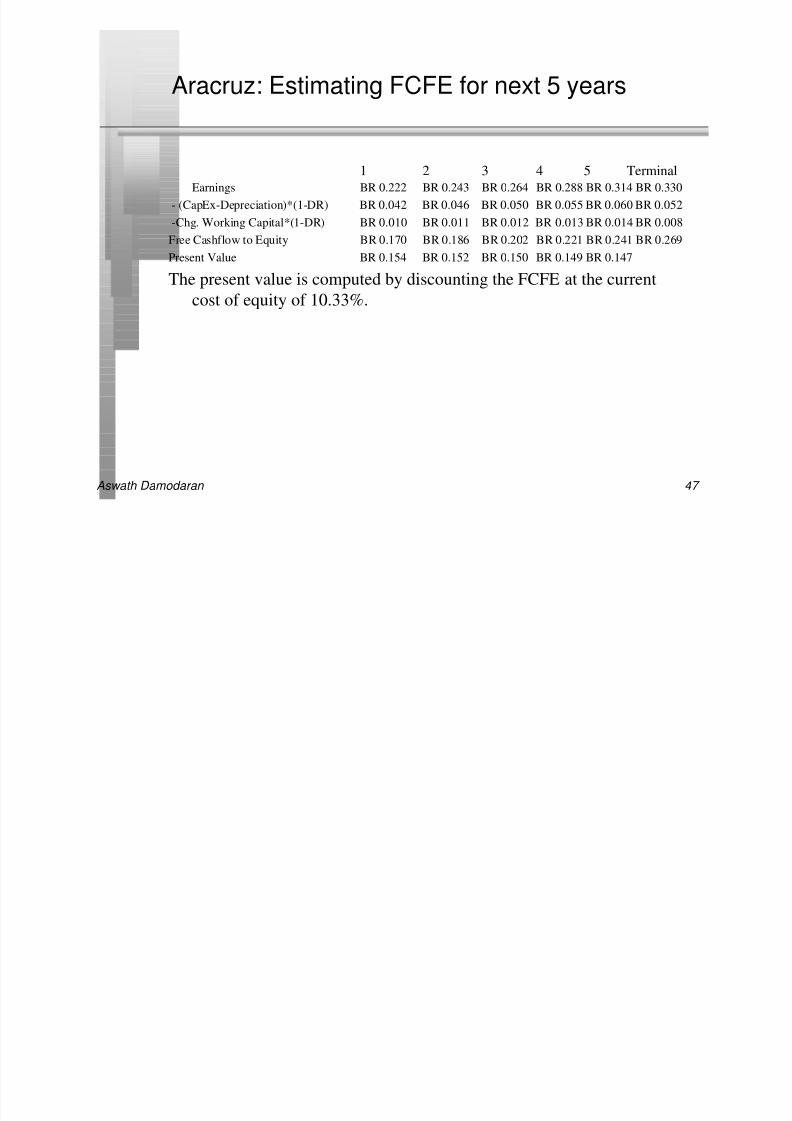
Aracruz: Estimating FCFE for next 5 years
1 2 3 4 5 TerminalEarnings BR 0.222 BR 0.243 BR 0.264 BR 0.288 BR 0.314 BR 0.330
- (CapEx-Depreciation)*(1-DR) BR 0.042 BR 0.046 BR 0.050 BR 0.055 BR 0.060 BR 0.052
-Chg. Working Capital*(1-DR) BR 0.010 BR 0.011 BR 0.012 BR 0.013 BR 0.014 BR 0.008
Free Cashflow to Equity BR 0.170 BR 0.186 BR 0.202 BR 0.221 BR 0.241 BR 0.269
Present Value BR 0.154 BR 0.152 BR 0.150 BR 0.149 BR 0.147
The present value is computed by discounting the FCFE at the current
cost of equity of 10.33%.

8/7/2019 damodaran ch12
http://slidepdf.com/reader/full/damodaran-ch12 48/65
Aswath Damodaran 48
Aracruz: Estimating Terminal Price and Valueper share
n The terminal value at the end of year 5 is estimated using the FCFE in
the terminal year.
• The FCFE in year 6 reflects the drop in net capital expenditures after year
5.
n Terminal Value = 0.269/(.125-.05) = 3.59 BR
n Value per Share = 0.154 + 0.152 + 0.150 + 0.149 + 0.147 +
3.59/1.10335 = 2.94 BR
n The stock was trading at 2.40 BR in September 1997.
n The value per share is based upon normalized earnings. To the extent
that it will take some time to get t normal earnings, discount this valueper share back to the present at the cost of equity of 10.33%.

8/7/2019 damodaran ch12
http://slidepdf.com/reader/full/damodaran-ch12 49/65
Aswath Damodaran 49
The FCFE Model: A Visual Perspective
<-Int. Rate & Default Risk
Financing
Decisions(D/E)
Investment
Decisions(ROA)
CurrentEPS
Net CapEx(1-D/(D+E))
Extraordinary Items- Currency Changes- Interest Rate Changes- Warrant/Option Exercise- Pension Liabilities
ExtraordinaryGains/Losses FCFE/shar
Total Risk
MarketRisk Firm-SpecificRisk
Dividend
Decisions(Payout=1-b)
Expected Growth Rateg = b (ROA + D/E (ROA - i))
Beta
Cost of Equity
k e = Rf + β (Risk Premium)
Expected EPSYear
Chg. WC (1-D/(D+E)
1 $1.85 $0.00 $2.63
2 $2.09 $1.88 $0.00 $2.97
3 $7.84 $2.37 $2.12 $0.00$3.36
4 $8.86 $2.67 $2.40$0.00
$3.79
5 $10.02 $3.02 $0.00 $4.29
Pn = $7.63 /(.145 - .06)
= $89.72
Value Per Share= PV of DPS + PV of Terminal Price= PV of FCFE + PV of Terminal Price
<-Project Risk
<-Uncertainty associated with extraordinary items
THE VALUE OF EQUITY IN NCR
Rating Constraint ->
Earnings Stability Constraints->
Expected Future Cash Flows
Discount Rat
Terminal Pric
Desire for Dividend Stabilit
CurrentNet CapExWC %
$6.14
$6.94
D/(D+E)
1.15
=9.0%+1.15*5.5%=15.33%
$54.50
26% 16.56% 8.98%
$5.43 NCx=$1.79WC=15%
$1.66
$2.71
T Yr $10 .62 $1.58 $1.41 $0.00
Beta=1.00Growth =6%CapEx is120% of Depr
=0.74(.1656+.0898(.1656-.0745(.66)))
8/7/2019 damodaran ch12
http://slidepdf.com/reader/full/damodaran-ch12 50/65
Aswath Damodaran 50
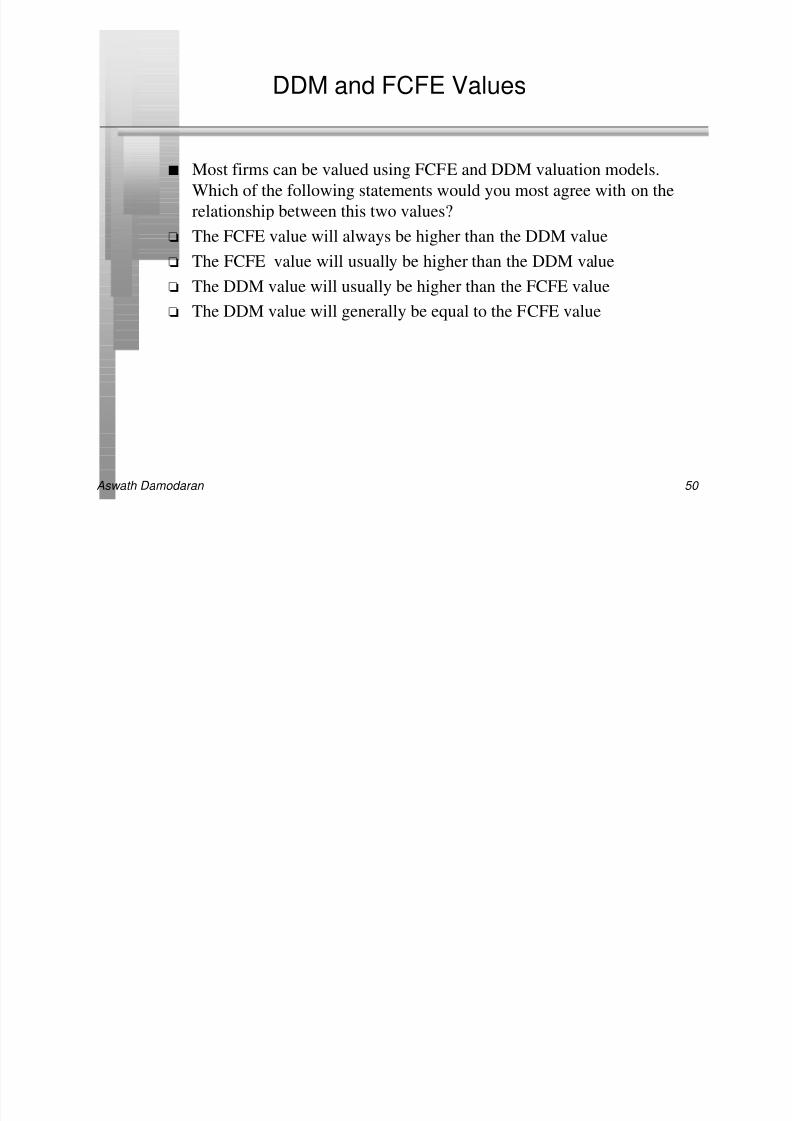
DDM and FCFE Values
n Most firms can be valued using FCFE and DDM valuation models.
Which of the following statements would you most agree with on the
relationship between this two values?
o The FCFE value will always be higher than the DDM value
o The FCFE value will usually be higher than the DDM value
o The DDM value will usually be higher than the FCFE value
o The DDM value will generally be equal to the FCFE value
8/7/2019 damodaran ch12
http://slidepdf.com/reader/full/damodaran-ch12 51/65
Aswath Damodaran 51
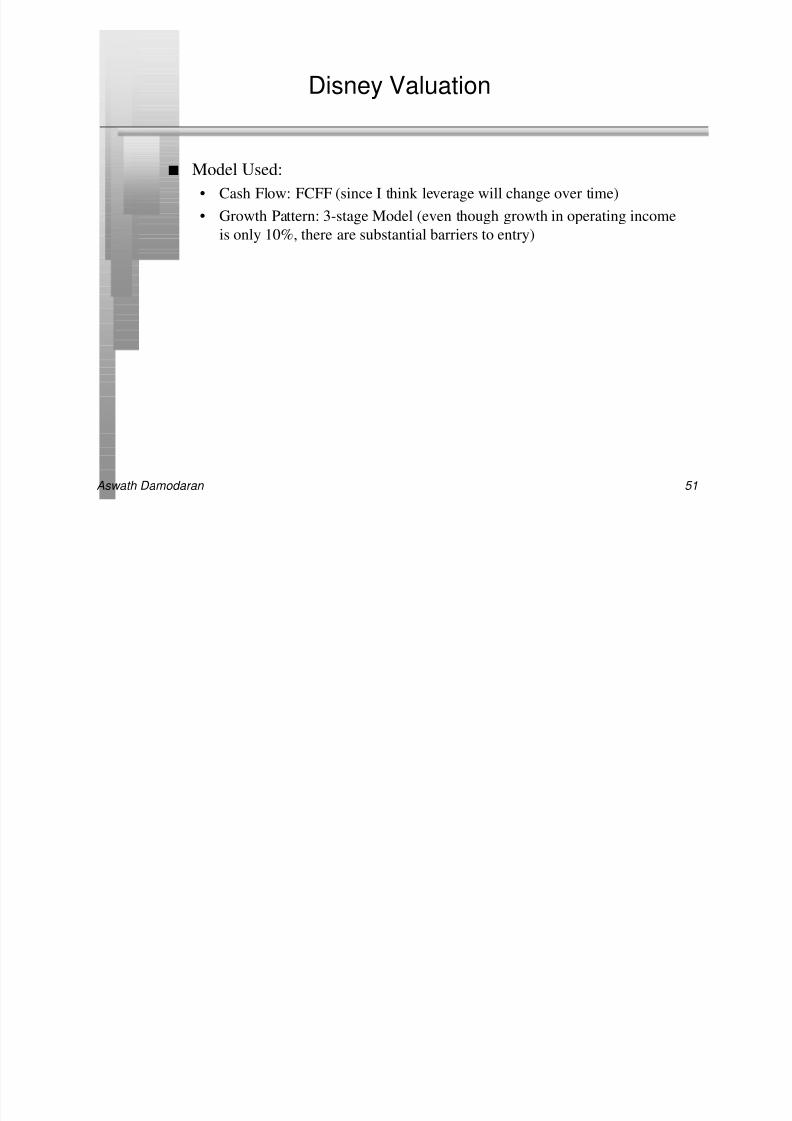
Disney Valuation
n Model Used:
• Cash Flow: FCFF (since I think leverage will change over time)
• Growth Pattern: 3-stage Model (even though growth in operating income
is only 10%, there are substantial barriers to entry)
8/7/2019 damodaran ch12
http://slidepdf.com/reader/full/damodaran-ch12 52/65
Aswath Damodaran 52
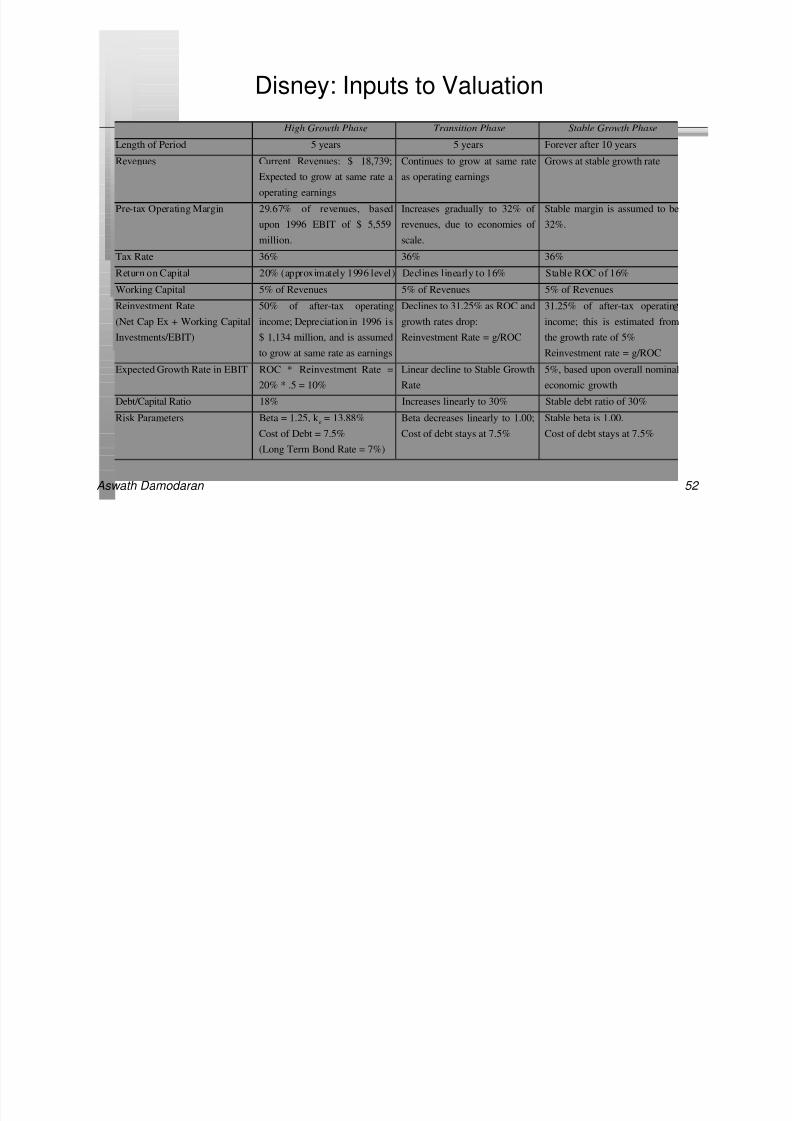
Disney: Inputs to Valuation
High Growth Phase Transition Phase Stable Growth Phase
Length of Period 5 years 5 years Forever after 10 years
Revenues Current Revenues: $ 18,739;
Expected to grow at same rate a
operating earnings
Continues to grow at same rate
as operating earnings
Grows at stable growth rate
Pre-tax Operating Margin 29.67% of revenues, based
upon 1996 EBIT of $ 5,559
million.
Increases gradually to 32% of
revenues, due to economies of
scale.
Stable margin is assumed to be
32%.
Tax Rate 36% 36% 36%
Return on Capital 20% (approximately 1996 level) Declines linearly to 16% Stable ROC of 16%
Working Capital 5% of Revenues 5% of Revenues 5% of Revenues
Reinvestment Rate
(Net Cap Ex + Working Capital
Investments/EBIT)
50% of after-tax operating
income; Depreciation in 1996 is
$ 1,134 million, and is assumed
to grow at same rate as earnings
Declines to 31.25% as ROC and
growth rates drop:
Reinvestment Rate = g/ROC
31.25% of after-tax operatin
income; this is estimated from
the growth rate of 5%
Reinvestment rate = g/ROC
Expected Growth Rate in EBIT ROC * Reinvestment Rate =20% * .5 = 10%
Linear decline to Stable GrowthRate
5%, based upon overall nominaleconomic growth
Debt/Capital Ratio 18% Increases linearly to 30% Stable debt ratio of 30%
Risk Parameters Beta = 1.25, k e = 13.88%
Cost of Debt = 7.5%
(Long Term Bond Rate = 7%)
Beta decreases linearly to 1.00;
Cost of debt stays at 7.5%
Stable beta is 1.00.
Cost of debt stays at 7.5%
8/7/2019 damodaran ch12
http://slidepdf.com/reader/full/damodaran-ch12 53/65
Aswath Damodaran 53
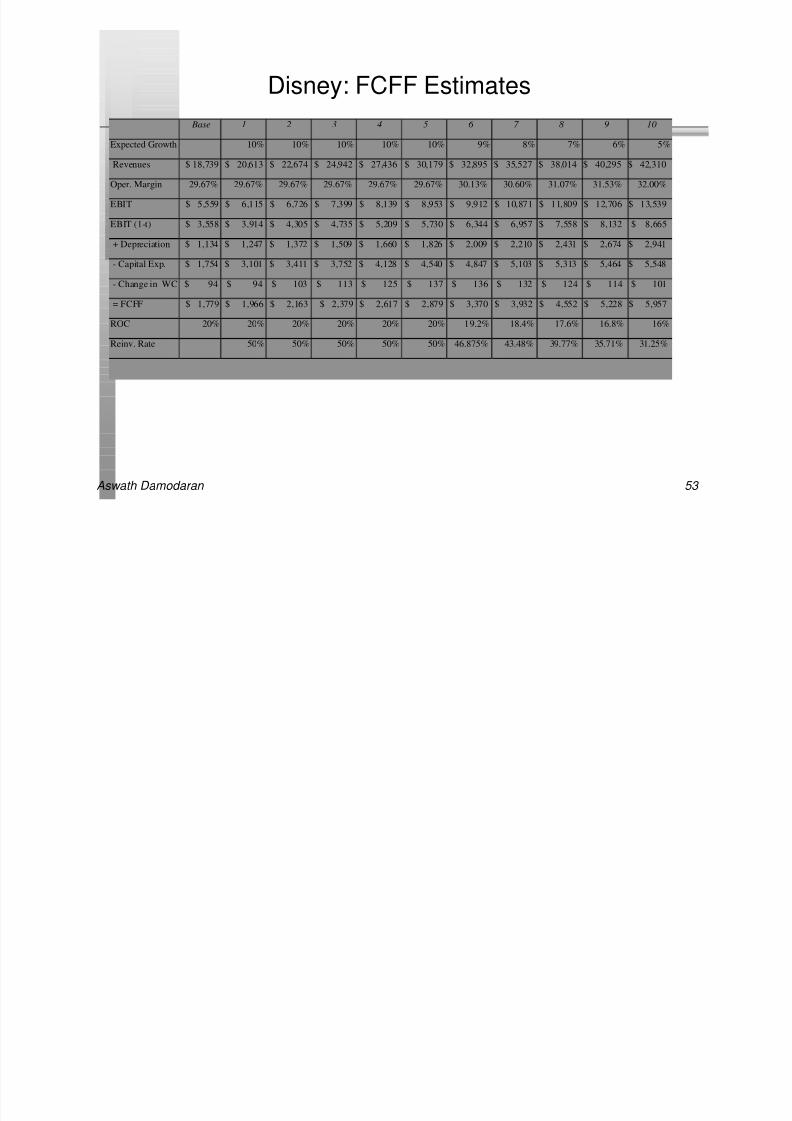
Disney: FCFF Estimates
Base 1 2 3 4 5 6 7 8 9 10
Expected Growth 10% 10% 10% 10% 10% 9% 8% 7% 6% 5%
Revenues $ 18,739 $ 20,613 $ 22,674 $ 24,942 $ 27,436 $ 30,179 $ 32,895 $ 35,527 $ 38,014 $ 40,295 $ 42,310
Oper. Margin 29.67% 29.67% 29.67% 29.67% 29.67% 29.67% 30.13% 30.60% 31.07% 31.53% 32.00%
EBIT $ 5,559 $ 6,115 $ 6,726 $ 7,399 $ 8,139 $ 8,953 $ 9,912 $ 10,871 $ 11,809 $ 12,706 $ 13,539
EBIT (1-t) $ 3,558 $ 3,914 $ 4,305 $ 4,735 $ 5,209 $ 5,730 $ 6,344 $ 6,957 $ 7,558 $ 8,132 $ 8,665
+ Depreciation $ 1,134 $ 1,247 $ 1,372 $ 1,509 $ 1,660 $ 1,826 $ 2,009 $ 2,210 $ 2,431 $ 2,674 $ 2,941
- Capital Exp. $ 1,754 $ 3,101 $ 3,411 $ 3,752 $ 4,128 $ 4,540 $ 4,847 $ 5,103 $ 5,313 $ 5,464 $ 5,548
- Change in WC $ 94 $ 94 $ 103 $ 113 $ 125 $ 137 $ 136 $ 132 $ 124 $ 114 $ 101
= FCFF $ 1,779 $ 1,966 $ 2,163 $ 2,379 $ 2,617 $ 2,879 $ 3,370 $ 3,932 $ 4,552 $ 5,228 $ 5,957
ROC 20% 20% 20% 20% 20% 20% 19.2% 18.4% 17.6% 16.8% 16%
Reinv. Rate 50% 50% 50% 50% 50% 46.875% 43.48% 39.77% 35.71% 31.25%
8/7/2019 damodaran ch12
http://slidepdf.com/reader/full/damodaran-ch12 54/65
Aswath Damodaran 54
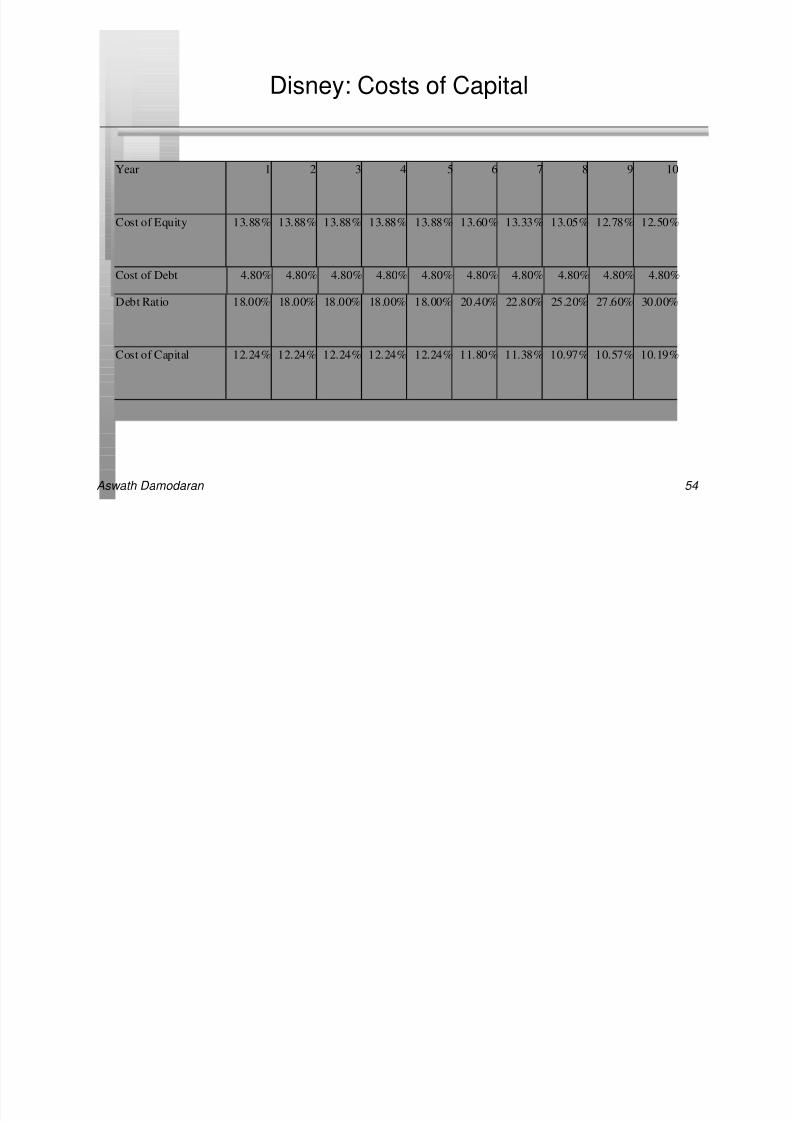
Disney: Costs of Capital
Year 1 2 3 4 5 6 7 8 9 10
Cost of Equity 13.88% 13.88% 13.88% 13.88% 13.88% 13.60% 13.33% 13.05% 12.78% 12.50%
Cost of Debt 4.80% 4.80% 4.80% 4.80% 4.80% 4.80% 4.80% 4.80% 4.80% 4.80%
Debt Ratio 18.00% 18.00% 18.00% 18.00% 18.00% 20.40% 22.80% 25.20% 27.60% 30.00%
Cost of Capital 12.24% 12.24% 12.24% 12.24% 12.24% 11.80% 11.38% 10.97% 10.57% 10.19%
8/7/2019 damodaran ch12
http://slidepdf.com/reader/full/damodaran-ch12 55/65
Aswath Damodaran 55
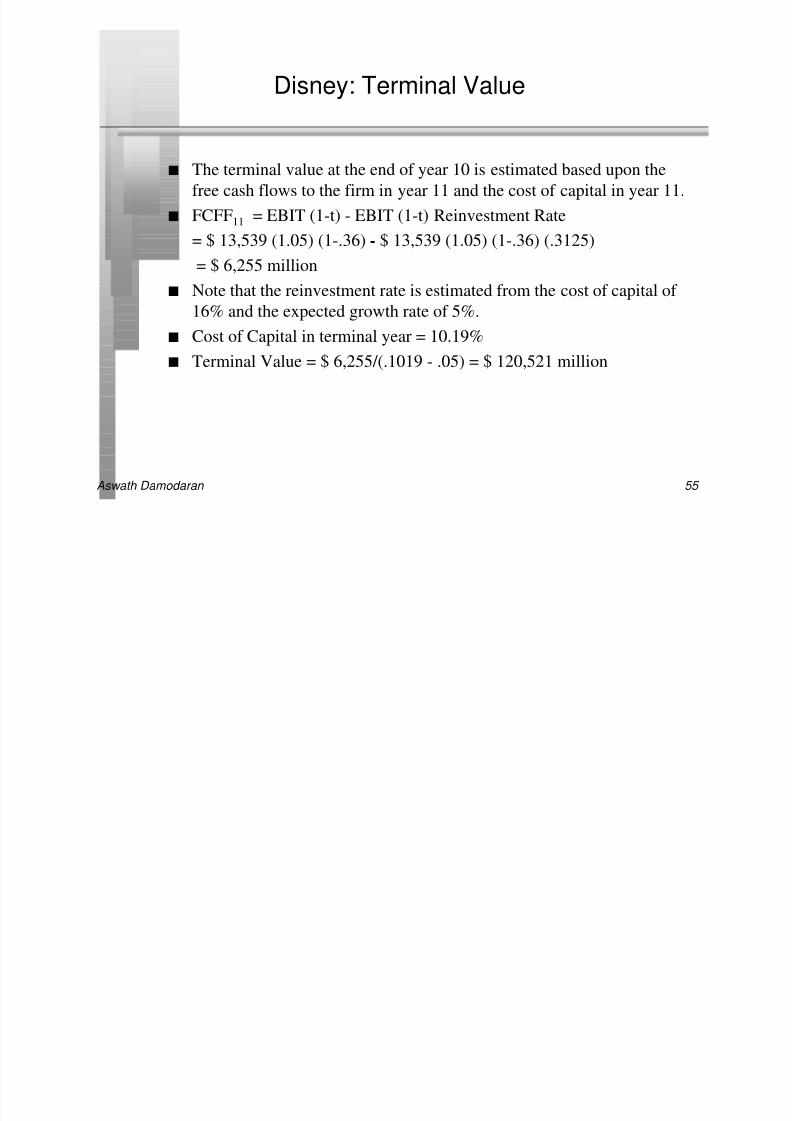
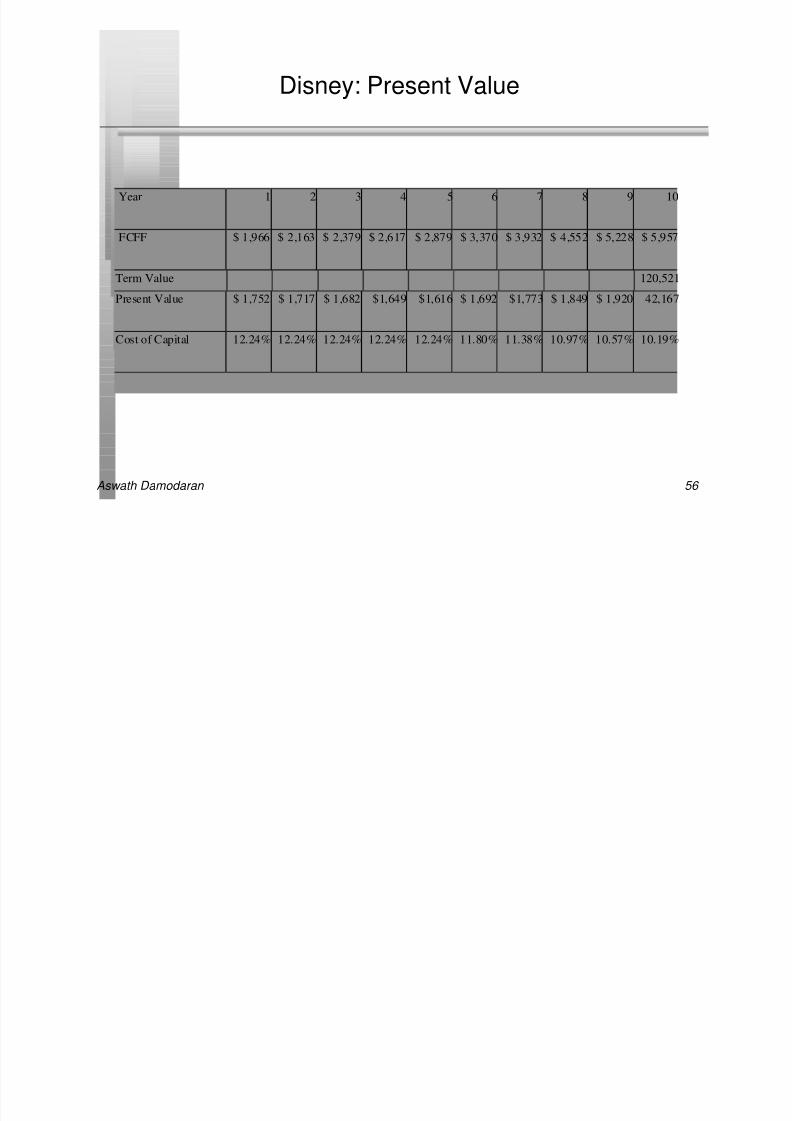
Disney: Terminal Value
n The terminal value at the end of year 10 is estimated based upon the
free cash flows to the firm in year 11 and the cost of capital in year 11.
n FCFF11 = EBIT (1-t) - EBIT (1-t) Reinvestment Rate
= $ 13,539 (1.05) (1-.36) - $ 13,539 (1.05) (1-.36) (.3125)
= $ 6,255 million
n Note that the reinvestment rate is estimated from the cost of capital of
16% and the expected growth rate of 5%.
n Cost of Capital in terminal year = 10.19%
n Terminal Value = $ 6,255/(.1019 - .05) = $ 120,521 million
8/7/2019 damodaran ch12
http://slidepdf.com/reader/full/damodaran-ch12 56/65
Aswath Damodaran 56
Disney: Present Value
Year 1 2 3 4 5 6 7 8 9 10
FCFF $ 1,966 $ 2,163 $ 2,379 $ 2,617 $ 2,879 $ 3,370 $ 3,932 $ 4,552 $ 5,228 $ 5,957
Term Value 120,521
Present Value $ 1,752 $ 1,717 $ 1,682 $1,649 $1,616 $ 1,692 $1,773 $ 1,849 $ 1,920 42,167
Cost of Capital 12.24% 12.24% 12.24% 12.24% 12.24% 11.80% 11.38% 10.97% 10.57% 10.19%

8/7/2019 damodaran ch12
http://slidepdf.com/reader/full/damodaran-ch12 57/65
Aswath Damodaran 57
Present Value Check
n The FCFF and costs of capital are provided for all 10 years. Confirm
the present value of the FCFF in year 7.
8/7/2019 damodaran ch12
http://slidepdf.com/reader/full/damodaran-ch12 58/65
Aswath Damodaran 58
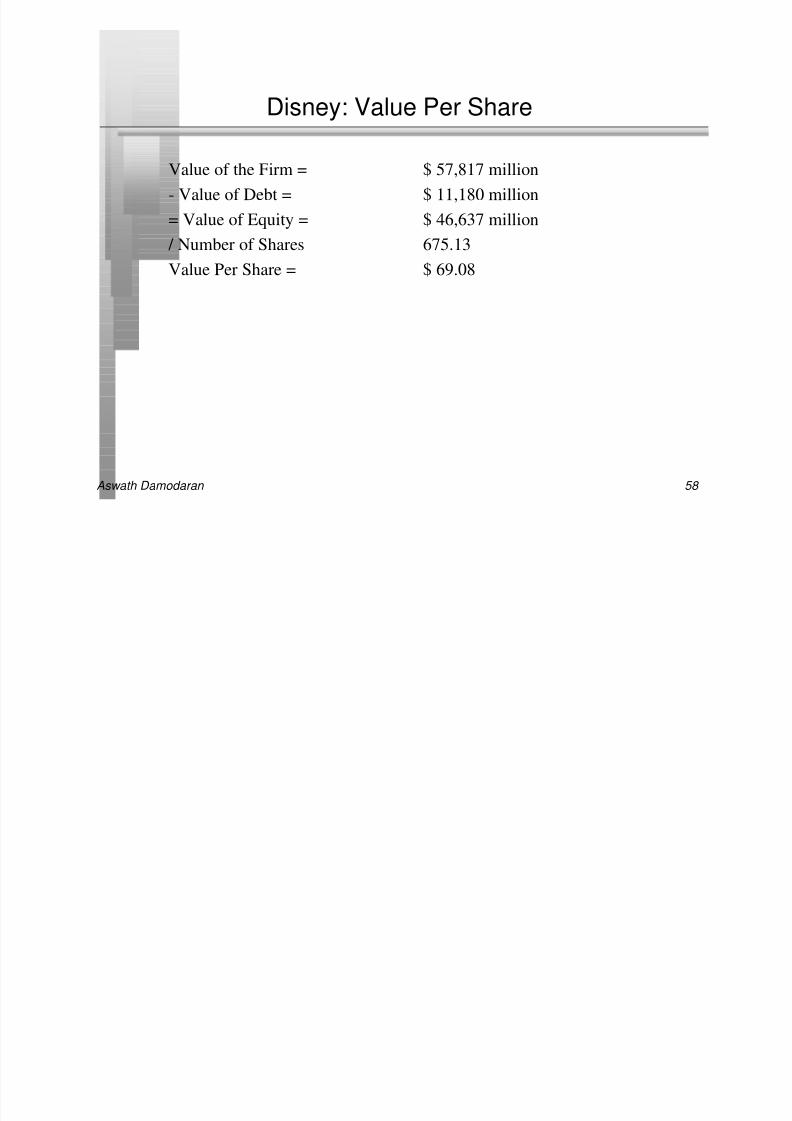
Disney: Value Per Share
Value of the Firm = $ 57,817 million
- Value of Debt = $ 11,180 million
= Value of Equity = $ 46,637 million
/ Number of Shares 675.13Value Per Share = $ 69.08
8/7/2019 damodaran ch12
http://slidepdf.com/reader/full/damodaran-ch12 59/65
Aswath Damodaran 59
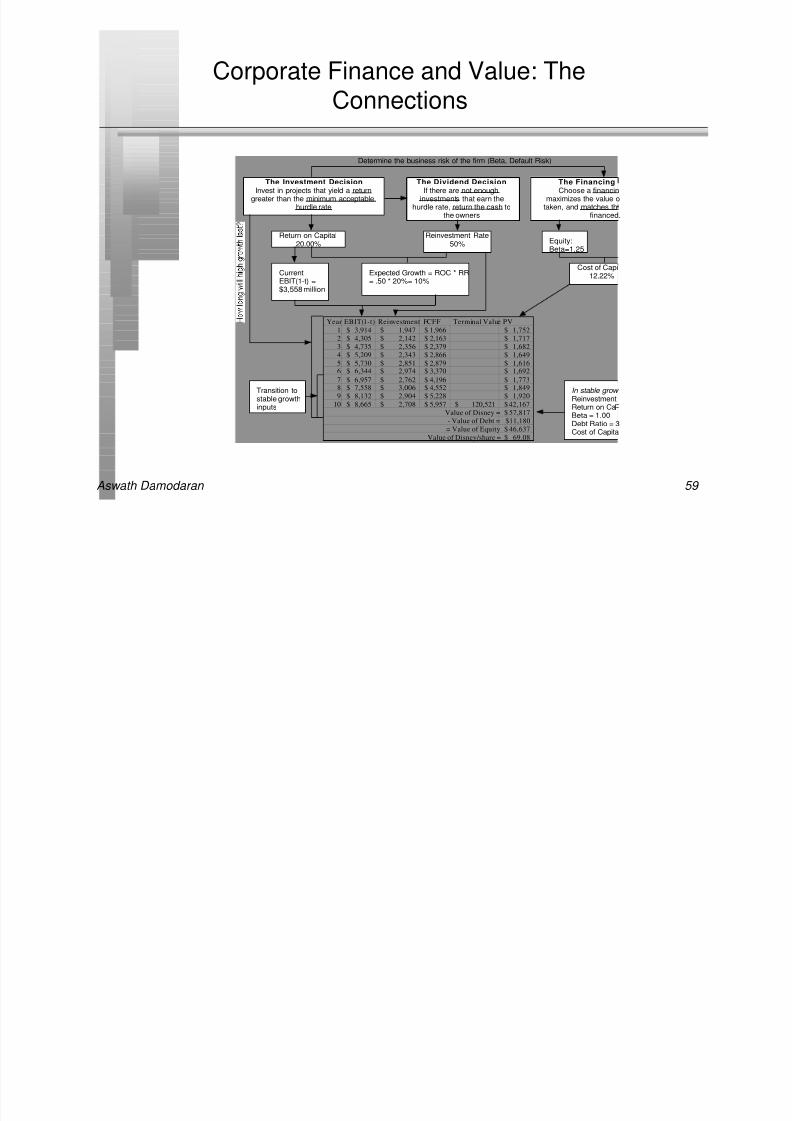
Corporate Finance and Value: TheConnections
The Investment DecisionInvest in projects that yield a return
greater than the minimum acceptablehurdle rate
The FinancingChoose a financin
maximizes the value otaken, and matches th
financed.
The Dividend DecisionIf there are not enough
investments that earn thehurdle rate, return the cash to
the owners
CurrentEBIT(1-t) =$3,558 million
Return on Capital20.00%
Reinvestment Rate50%
Expected Growth = ROC * RR= .50 * 20%= 10%
Cost of Capi12.22%
Determine the business risk of the firm (Beta, Default Risk)
Equity:
Beta=1.25
In stable grow ReinvestmentReturn on CaBeta = 1.00Debt Ratio = 3Cost of Capita
Transition tostable growthinputs
Year EBIT(1-t) Reinvestment FCFF Terminal Value PV1 3,914$ 1,947$ 1,966$ 1,752$2 4,305$ 2,142$ 2,163$ 1,717$3 4,735$ 2,356$ 2,379$ 1,682$4 5,209$ 2,343$ 2,866$ 1,649$5 5,730$ 2,851$ 2,879$ 1,616$
6 6,344$ 2,974$ 3,370$ 1,692$7 6,957$ 2,762$ 4,196$ 1,773$8 7,558$ 3,006$ 4,552$ 1,849$9 8,132$ 2,904$ 5,228$ 1,920$
10 8,665$ 2,708$ 5,957$ 120,521$ 42,167$57,817$
$11,18046,637$
69.08$
Value of Disney =
= Value of Equity- Value of Debt =
Value of Disney/share =

8/7/2019 damodaran ch12
http://slidepdf.com/reader/full/damodaran-ch12 60/65
Aswath Damodaran 60
Relative Valuation
n In relative valuation, the value of an asset is derived from the pricing
of 'comparable' assets, standardized using a common variable such as
earnings, cashflows, book value or revenues. Examples include --
• Price/Earnings (P/E) ratios
– and variants (EBIT multiples, EBITDA multiples, Cash Flow multiples)
• Price/Book (P/BV) ratios
– and variants (Tobin's Q)
• Price/Sales ratios
8/7/2019 damodaran ch12
http://slidepdf.com/reader/full/damodaran-ch12 61/65
Aswath Damodaran 61
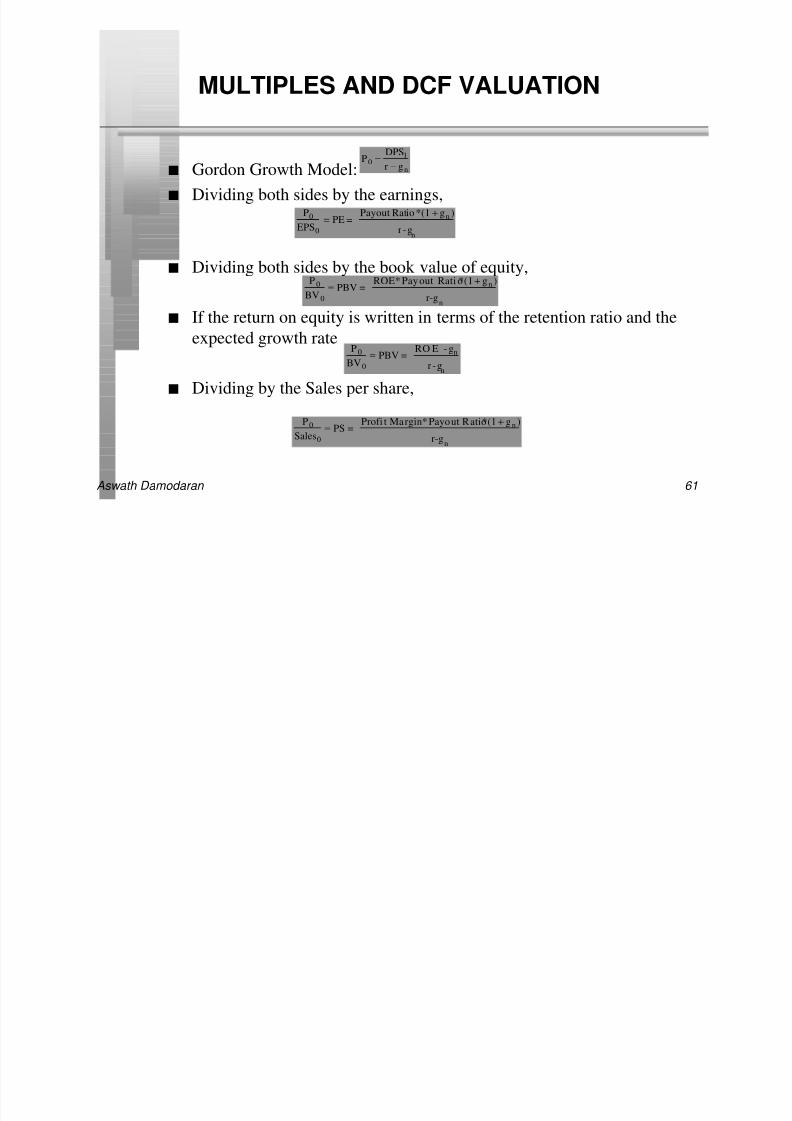
MULTIPLES AND DCF VALUATION
n Gordon Growth Model:
n Dividing both sides by the earnings,
n Dividing both sides by the book value of equity,
n If the return on equity is written in terms of the retention ratio and the
expected growth rate
n Dividing by the Sales per share,
P0 =DPS1
r − gn
P0
EPS0
= PE =Payout Ratio *(1 + gn )
r -gn
P 0
BV0
= PBV =RO E - gn
r -gn
P 0
BV0
= PBV =ROE* Payout Rati o*(1 + gn )
r-gn
P0
Sales0
= PS =Profi t Margin*Payout Ratio*(1 + gn )
r-gn

8/7/2019 damodaran ch12
http://slidepdf.com/reader/full/damodaran-ch12 62/65
Aswath Damodaran 62
Disney: Relative Valuation
Company PE Expected Growth PEG
King World Productions 10.4 7.00% 1.49
Aztar 11.9 12.00% 0.99
Viacom 12.1 18.00% 0.67
All American Communications 15.8 20.00% 0.79GC Companies 20.2 15.00% 1.35
Circus Circus Enterprises 20.8 17.00% 1.22
Polygram NV ADR 22.6 13.00% 1.74
Regal Cinemas 25.8 23.00% 1.12
Walt Disney 27.9 18.00% 1.55
AMC Entertainment 29.5 20.00% 1.48Premier Parks 32.9 28.00% 1.18
Family Golf Centers 33.1 36.00% 0.92
CINAR Films 48.4 25.00% 1.94
Average 27.44 18.56% 1.20
8/7/2019 damodaran ch12
http://slidepdf.com/reader/full/damodaran-ch12 63/65
Aswath Damodaran 63
Is Disney fairly valued?
n Based upon the PE ratio, is Disney under, over or correctly valued?
o Under Valued
o Over Valued
o
Correctly Valuedn Based upon the PEG ratio, is Disney under valued?
o Under Valued
o Over Valued
o Correctly Valued
n Will this valuation give you a higher or lower valuation than thediscounted CF valutaion?
o Higher
o Lower

8/7/2019 damodaran ch12
http://slidepdf.com/reader/full/damodaran-ch12 64/65
Aswath Damodaran 64
Relative Valuation Assumptions
n Assume that you are reading an equity research report where a buy
recommendation for a company is being based upon the fact that its PE
ratio is lower than the average for the industry. Implicitly, what is the
underlying assumption or assumptions being made by this analyst?
o The sector itself is, on average, fairly priced
o The earnings of the firms in the group are being measured consistently
o The firms in the group are all of equivalent risk
o The firms in the group are all at the same stage in the growth cycle
o The firms in the group are of equivalent risk and have similar cash
flow patterns
o All of the above
8/7/2019 damodaran ch12
http://slidepdf.com/reader/full/damodaran-ch12 65/65
Aswath Damodaran 65
First Principles
n Invest in projects that yield a return greater than the minimum
acceptable hurdle rate.
• The hurdle rate should be higher for riskier projects and reflect the
financing mix used - owners’ funds (equity) or borrowed money (debt)
• Returns on projects should be measured based on cash flows generatedand the timing of these cash flows; they should also consider both positive
and negative side effects of these projects.
n Choose a financing mix that minimizes the hurdle rate and matches the
assets being financed.
n
If there are not enough investments that earn the hurdle rate, return thecash to stockholders.
• The form of returns - dividends and stock buybacks - will depend upon
the stockholders’ characteristics.
Objective: Maximize the Value of the Firm