damping, stiffness and added mass in hydraulic turbines · pdf filedamping, stiffness and...
TRANSCRIPT

DAMPING, STIFFNESS AND ADDED MASS IN HYDRAULIC TURBINESREPORT 2015:106
HYDROPOWER


Damping, Stiffness and Added Mass in Hydraulic Turbines
Preliminary Experiments and Analysis
RAZVAN ROMAN, DIANA BUCUR, JAN-OLOV AIDANPAA, MICHEL J. CERVANTES
ISBN 978-91-7673-106-2 | © 2015 ENERGIFORSK
Energiforsk AB | Phone: 08-677 25 30 | E-mail: [email protected] | www.energiforsk.se


DAMPING, STIFFNESS AND ADDED MASS IN HYDRAULIC TURBINES
5
Förord
Målet med projektet var att bestämma fluid-strukturinteraktionens påverkan på
styvhet, tröghetsmoment och dämpning i en Francisturbin. Huvudsaklig
projektutförare var Razvan Roman, Politehnica University of Bucharest/Luleå tekniska
universitet inom ramen för Svenskt Vattenkraftcentrum (SVC).
SVC är ett centrum för utbildning och forskning inom vattenkraft och gruvdammar.
Nuvarande etapp pågår 2013-2016 med en budget på ca 110 miljoner kr.
SVC har etablerats av Energimyndigheten, Energiforsk och Svenska Kraftnät
tillsammans med Luleå tekniska universitet, Kungliga Tekniska Högskolan, Chalmers
tekniska högskola och Uppsala universitet.
Medverkande företag och branschföreningar är: Alstom Hydro Sweden, Andritz Hydro, E.ON
Vattenkraft Sverige, Falu Energi & Vatten, Fortum Generation, Holmen Energi, Jämtkraft, Jönköping
Energi, Karlstads Energi, Mälarenergi, Norconsult, Rainpower, Skellefteå Kraft, Sollefteåforsens,
Statkraft Sverige, Sweco Energuide, Sweco Infrastructure, SveMin, Umeå Energi, Vattenfall Research
and Development, Vattenfall Vattenkraft, Voith Hydro, WSP Sverige och ÅF Industry.
Ytterligare information finns på www.svc.nu.
Stockholm, augusti 2015
Sara Sandberg

DAMPING, STIFFNESS AND ADDED MASS IN HYDRAULIC TURBINES
6
Sammanfattning
Numera, med den nya betoningen på förnybara energikällor, hydrauliska
turbiner används för att upprätthålla stabilitet på nätet genom att variera sin
last. Effekterna av vattnet till löpjulen under dess transienta regimer lägger
nya egenskaper; adderad massa, styvhet och dämpning. Dessa egenskaper är
viktiga och inte riktigt känt; ett behov av en experimentell bestämning behövs
i både stationära och transienta regimer. En identifiering av denna effekt
skulle kunna förbättra operation av hydrauliska turbiner och kunde
minimera problem som dyker upp, som vibrationer. De adderad egenskaper
måste beaktas från utformningen av löpjulen. En komplett analys av en
hydraulisk turbin har inte ännu inte gjorts.
I rapporten presenteras en experimentell förfarande för att identifiera och
kvantifiera tillsatta adderada egenskaper på laboratorium i en Francis turbin
modell. Detta förfarande innebär att skapa övergående regimen genom
modifiering av magnetfältet hos generatorn excitation. Olika driftpunkter hos
den hydrauliska turbinen, som täcker hela arbetsområdet för turbinen,
undersöks. Den experimentell uppställning från Water Power Laboratory,
Norwegian University of Science and Technology, Trondheim, Norway
presenteras tillsammans med mät programmet och förfarandet. En preliminär
analys av de erhållna resultaten hittills presenteras.

DAMPING, STIFFNESS AND ADDED MASS IN HYDRAULIC TURBINES
7
Summary
Nowadays, with the new emphasis on renewable energy sources, hydraulic
turbines are used to maintain grid stability by varying their load. The effects
of the water to the runner during this kind of transient regimes add new
properties; added mass, stiffness and damping. These properties are
important and not really known; a need for an experimental determination of
them is needed in both steady and transient regimes. An identification of this
effect could improve the working of the hydraulic turbines and could
minimize problems that appear, like vibrations. The added properties need to
be taken into consideration from the design stage of the runner. A complete
analyze for a hydraulic turbine has not yet been completed.
The report presents an experimental procedure for identifying and
quantifying added properties on laboratory a Francis turbine model. This
procedure implies creating transient regimes through modification of the
magnetic field of the generator excitation. Different operating points of the
hydraulic turbine, covering the entire operating range of the turbine, are
investigated. The experimental setup from the Water Power Laboratory,
Norwegian University of Science and Technology, Trondheim, Norway is
presented along with measuring program and the implemented procedure. A
preliminary analysis of the results obtained so far is presented.

DAMPING, STIFFNESS AND ADDED MASS IN HYDRAULIC TURBINES
8
List of content
1 Introduction 9
2 Test rig description 10
3 Used sensors 13
4 Description of rig modifications 21
5 Measurement program 22
6 Signal Treatment – sinusoidal perturbation 25
7 Evaluation procedure 28
8 Results: added properties 29
9 Results: flow parameters 34
10 Conclusion 38

DAMPING, STIFFNESS AND ADDED MASS IN HYDRAULIC TURBINES
9
- 9 / 29 -
1 Introduction
In the recent years, with signing of Kyoto Convention in 1997, the emphasis on
renewable energies has increased significantly. Technologies in this field have got a
significant improvement, which lead to the use of large-scale wind and solar parks for
electricity production. The implementation of these renewable energy sources on large
scales, has introduced an increase number of fluctuations on the grid. The deregulation
of electricity markets, coupled to the increase use of intermittent renewable energy
sources to the grid, has resulted in an increase of the hydropower use to maintain grid
stability. Hydraulic turbines were initially designed as based load with few transient.
Nicolet (2007) suggests that frequent load variations and large number of start-stop
cycles may cause vibration, fatigue, wear and changes in the dynamic behaviour of
hydraulic turbines. Nowadays, great emphasis is on retrofitting these units in order to
increase performance and broaden the optimal functioning, Keck and Sick (2010). The
new hydraulic turbine design methods must take into account all these new problems
arising in operation. Two important points are represented by the turbine control
system through the governor and a part of rotor dynamics.
Turbine speed governor PID gains play a very important role in hydraulic transients
caused by load changes and grid instabilities. By optimal tuning of PID gains, the
dynamic performance of the generator unit can be well improved. The proper tuning of
governor in these systems plays important role in stable and acceptable performance of
the connected power system. Hydroelectric power generating system exhibits a high -
order and nonlinear behaviour. Appropriate mathematical models are able to simulate
such systems and to better overcome the transient regimes. The effect of a surrounding
fluid on the turbine runner is an important term of the system. The PID controller must
take into consideration the effect of the water given to the runner because the dynamics
of the runner are influenced in a great part by this effect. This is important in steady
(periodic) as well as transient regimes. The effect is synthesized by taking into
consideration some additional terms into the motion equation of the runner. The water
effect influences the inertia, the damping and the stiffness of the runner-shaft-generator
system.
An identification of this effect could improve the working of the hydraulic turbines and
could minimize problems that appear, like vibrations. In the last years a small interest
of this effect was considered, mostly on simple bodies like cylinders. A complete
analyse for a hydraulic turbine was not completed yet. Experimental and simulated
results of this kind of analyse are needed at this moment.
The following present experiments performed at the Norwegian University of Science
and Technology, Water Power Laboratory, on a Francis turbine in order to determine
the added mass.

DAMPING, STIFFNESS AND ADDED MASS IN HYDRAULIC TURBINES
10
- 10 / 29 -
2 Test rig description
All the measurements were made at the Water Power Laboratory at NTNU, Norway,
on a high head Francis model turbine.
The turbine represents a scaled-down model of the prototype operating at one of the
most important hydropower plants in Norway, Tokke Power Plant. The power plant is
located in the county of Telemark. It is owned by Statkraft Norway. It was
commissioned in 1961/1962 with four Francis units, each with a nominal power output
110 MW. At BEP, the operating discharge, head and runner diameter are 31 m P
3P/s, 377 m
and 1.778 m, respectively. During the experiments in the laboratory, the model had at
BEP an operating discharge of 0.2 m P
3P/s, a head of 12 m and a power 0.03 MW. The
runner diameter of the model is 0.349 m.
A schematic diagram for the hydraulic circuit of the rig is presented in Fig.2.1. The
model runner is able to run under open and closed loop of the hydraulic circuit.
Figur 2-1 Description of the main pipe system available at the laboratory
(1) – Basement reservoir
(2), (3) – Pumps
(4) – Overhead tank
(5) – Upstream pressure tank
(6) – Francis model turbine
(7) – Downstream tank
(8) – Weighting tank for flow meter calibration
(9) – Basement reservoir

DAMPING, STIFFNESS AND ADDED MASS IN HYDRAULIC TURBINES
11
- 11 / 29 -
For this experiment the open loop operating conditions was chosen with the objective
to get more realistic operating conditions. The open loop has a head of approximately
12.5 m. Water from the basement reservoir (1) is pumped with the help of pumps (2)
and (3) to the overhead tank (4). The laboratory is built up around a main pipe system.
In the basement room, two main pumps are installed which can be operated
individually or in series as well as in tandem configuration. The overhead tank (4) is
kept at a constant water level like a reservoir and has an overflow that returns the
excess water to the basement reservoir (1). From there the water goes trough the
upstream pressure tank (5). The water flows in the direction of lower pressure and
enters the pipe leading to the Francis turbine model (6). On its way, it passes a flow
meter. It also passes temperature and pressure transducers before entering the spiral
casing and the guide vanes. The hydraulic energy is transformed to rotating energy in
the runner, and the water then flows through the draft tube and into the downstream
pressure tank (7).
Figure 2.2 presents a schematic view of the test rig with the Francis model used for the
experiments. The water flows from the upstream pressure tank (1) through a gate valve
(always kept open during the Francis turbine running) that is operated by an electric
motor into the inlet pipe. On this inlet pipe, a flow meter (3) and a pressure sensor (4)
are coupled. This pressure sensor is located at 4.87 m from the casing inlet. The Francis
model turbine is equipped with a distributor that has 14 stay vanes and 28 guide vanes
before the runner inlet. The runner includes 15 full-length blades and 15 splitters (half-
length blades). A vertical shaft is used to connect the runner to the generator and
transmits the torque between them. The main shaft is supported on thrust block that
included thrust bearing and a radial bearing. To measure the differential pressure (Δp),
a differential pressure transducer was used. Two additional pressure transducers were
mounted, one of them in the vaneless space (the gap space between the guide vanes
and the runner) and one of them at the draft tube inlet.
Figur 2-2 Francis test rig
(1) – Upstream pressure tank
(2) - Valve
(3) – Flow meter
(4) – Inlet pipe pressure sensor
(5) – Francis model turbine
(6) – Generator
(7) - Downstream tank

DAMPING, STIFFNESS AND ADDED MASS IN HYDRAULIC TURBINES
12
- 12 / 29 -
The rig is equipped with a generator manufactured by Siemens type IGG6258 that has
the following technical parameters:
rated speed 1560 [rpm]
rated armature voltage 420 [V]
rated output 352 [kW]
rated torque 2150 [Nm]
maximum field weakening speed 2000 [rpm]
rated current 890 [A]
efficiency 92 [%]
maximum speed 2600 [rpm]
The output wire from the generator is connected to a DC converter, which is
manufactured by Siemens and is of type Simoreg 6RA70 DC Master. This unit is
connected to the power grid. The converter unit supplies and takes power to and from
the generator, so that the chosen operating point can be maintained. It is the converter
unit that fixes the rotational speed of the generator to the chosen value.

DAMPING, STIFFNESS AND ADDED MASS IN HYDRAULIC TURBINES
13
- 13 / 29 -
3 Used sensors
The instrumentation, calibration and measurement procedures were made considering
the guidelines available in IEC standards.
The parameters recorded during the experiment were: discharge, inlet pipe pressure,
differential pressure between the inlet of the spiral case and the outlet of the draft tube,
representing the total head of the turbine, vaneless space pressure, inlet draft tube
pressure, axial force, generator torque, friction torque, guide vanes angle and the
rotational speed.
The discharge was measured through a magnetic flow meter, KROHNE IFS 4000 series
with a range of operation between 0.00015 and 1 m P
3P/s. This is integrated with a signal
convertor ALTO SC 100 AS/F series to obtain the discharge. The gravimetric calibration
of the magnetic flow meter was carried out using the weighing tank method. This tank
is supported on three load cells (Hottinger RNTC). The calibration procedure for the
flow meter is as follow: a flow diverter diverts the water flow to and from the weighing
tank during a chosen time interval and the load cells weigh the volume of water. With
the help of the pump from the basement, the flow meter was calibrated with 10
different flows, in the range of 0.04 – 0.26 mP
3P/s. The output voltage from the signal
convertor is recorded at each flow passing through the measuring section of the flow
meter. The equation of the flow meter is linear: Q = c1 ∗ V + c2
Total uncertainty in the measurement for the flow is defined by:
(fQ)t = ±√(f∆m)t2 + +(fdiverter)t
2 + +(fρw)s
2 + (fQ,regression)s2
and includes the uncertainties from load cells for measuring the tank, from the flow
diverter, from the water density computation and the regression uncertainty.
(fRΔmR)t represents the total uncertainty in a reading of differential mass on the weighing
machine. The systematic uncertainty of the load cells was ±0.05%. The uncertainty of
the load cell included also a random uncertainty of ±0.0007%.
(fΔm)t = √(fΔm)s2 + (fΔm)r
2 = √0.052 + 0.00072 = 0.05 %
The uncertainties of the flow diverter both systematic and random are considered to be
±0.056%, respectively of ±0.07%.
(fdiverter)t = √(fdiverter)s2 + (fdiverter)r
2 = √0.072 + 0.0562 = 0.0896 %
(fρw)s is the relative uncertainty in the determination of the density of water. Because
the water temperature is measured with 0.5° in error or less this uncertainty was
considered to be, according to NS-ISO 4185, less than ±0.01%.
(fRQR, regression) represents the uncertainty in the regression process to obtain a
calibration curve. This is computed from the values registered when calibrating the
flow-measuring device and was considered to be ±0.008%.

DAMPING, STIFFNESS AND ADDED MASS IN HYDRAULIC TURBINES
14
- 14 / 29 -
With these values and using the guideline available in ISO/TR 7066 the total
uncertainty of the flow measurement is considered to be:
(fQ)s = √0.052 + 0.08962 + 0.012 + 0.0082 = 0.0907%
Figure 2.3 presents the calibration curve for the flow meter and the linear equation
obtained.
Figur 3-1 Calibration curve of discharge measurement
The calibration of the pressure sensors at the inlet pipe, vaneless space and for the draft
tube was carried out using a dead-weight tester (GE Series 3200), which has an
uncertainty of ± 0.05%. Calibrated weights are used with a piston to create a known
fluid pressure transmitted to the transducer to be calibrated. The transducer was
connected to a data acquisition system acquiring the voltage. The tester was used for all
of the pressure transducers and linear equations were obtained for each of them
(p=c1*V+c2, [p]=kPa). Because the calibration was carried out directly the uncertainties
taken in consideration are the one of the uncertainty of the tester and the uncertainty of
the regression:
(𝛿𝑃1)𝑠 = √(𝛿𝑡𝑒𝑠𝑡𝑒𝑟)2 + (𝛿𝑟𝑒𝑔.)
2 = √0.052 + 0.0083332 = 0.0506 %
(𝛿𝑃2)𝑠 = √(𝛿𝑡𝑒𝑠𝑡𝑒𝑟)2 + (𝛿𝑟𝑒𝑔.)
2 = √0.052 + 0.0062112 = 0.0503 %
(𝛿𝑃3)𝑠 = √(𝛿𝑡𝑒𝑠𝑡𝑒𝑟)2 + (𝛿𝑟𝑒𝑔.)
2 = √0.052 + 0.0094052 = 0.0508 %

DAMPING, STIFFNESS AND ADDED MASS IN HYDRAULIC TURBINES
15
- 15 / 29 -
In Table 1, the coefficients obtained for each transducer are presented and in Figures
2.4 to 2.6 are shown the calibration curves.
Tab.1 Pressure transducer parameters
Position Type C1 C2
Inlet pipe (PR1R) Druck PTX 610 124.9664 -249.5899
Vaneless space (PR2R) Kulite V4537-34 -70.7238 92.6861
Draft tube (PR3R) Kulite V4537-33 -79.6161 8.0616
Figur 3-2 Calibration curve – inlet pipe pressure transducer
Figur 3-3 Calibration curve – vaneless space pressure transducer

DAMPING, STIFFNESS AND ADDED MASS IN HYDRAULIC TURBINES
16
- 16 / 29 -
Figur 3-4 Calibration curve – draft tube pressure transducer
The pressure transducer used for measuring the differential pressure for obtaining the
head of the turbine is a Fuji Electric FHCW36W1 – AKCAY. This transducer has a low-
pressure side and a high pressure one. For the calibrating procedure the low-pressure
side was connected to a transparent tank with constant water level that served as,
reference level, and the high-pressure side was connected to the dead weight tester.
The standard weights supplied with the tester were used to develop known values for
the pressure. A digital type barometer, Vaisala PTB220, was used to measure the
atmospheric pressure in the laboratory. A total of 30 readings were made and a linear
equation was obtained based on the acquired voltage and known pressure. Figure 2.7
presents the calibration curve and the linear equation for the differential pressure
transducer.
Figur 3-5 Calibration curve – differential pressure transducer

DAMPING, STIFFNESS AND ADDED MASS IN HYDRAULIC TURBINES
17
- 17 / 29 -
A load cell, Hottinger Z6FC3, connected to a torque arm coupled to the generator
casing, measured the generator torque. Using the relation = 𝑚 ∗ 𝑔 ∗ 𝑙 , the shaft torque
was measured by applying a force and multiplying it with the length of the arm. A
metallic tape connected to the tail of the arm was used for the hanging tackle of the
calibrated weights. The arm length required to be measured before. This was computed
by adding the radius of the generator shaft (d/2), the length of the measuring rod that
was connected to the shaft (lR1)R, the length from the measuring rod to the end of the
torque arm (lR2R) and also a half of the metal tape thickness connected to the arm (t/2). A
schematic picture of the construction is presented in Figure 2.8.
𝑙 = (𝑑2⁄ ) + 𝑙1 + 𝑙2 + 𝑡
2⁄ = 104.992⁄ + 939.532 + 4.8 + 0.5
2⁄ = 997.077 𝑚𝑚
Figur 3-6 Generator Torque arm calibration
After measurements of the arm length, the calibrated weights could be applied on the
hanging tackle. A total of 200 kg were applied equivalent to a total of about 2000 Nm.
The output voltage from the load cell was acquired for known values of torque and the
calibration constants were determined as before by linear interpolation. The calibration
curve can be seen in Figure 9 along with the calibrations coefficients.
DAMPING, STIFFNESS AND ADDED MASS IN HYDRAULIC TURBINES
18
- 18 / 29 -
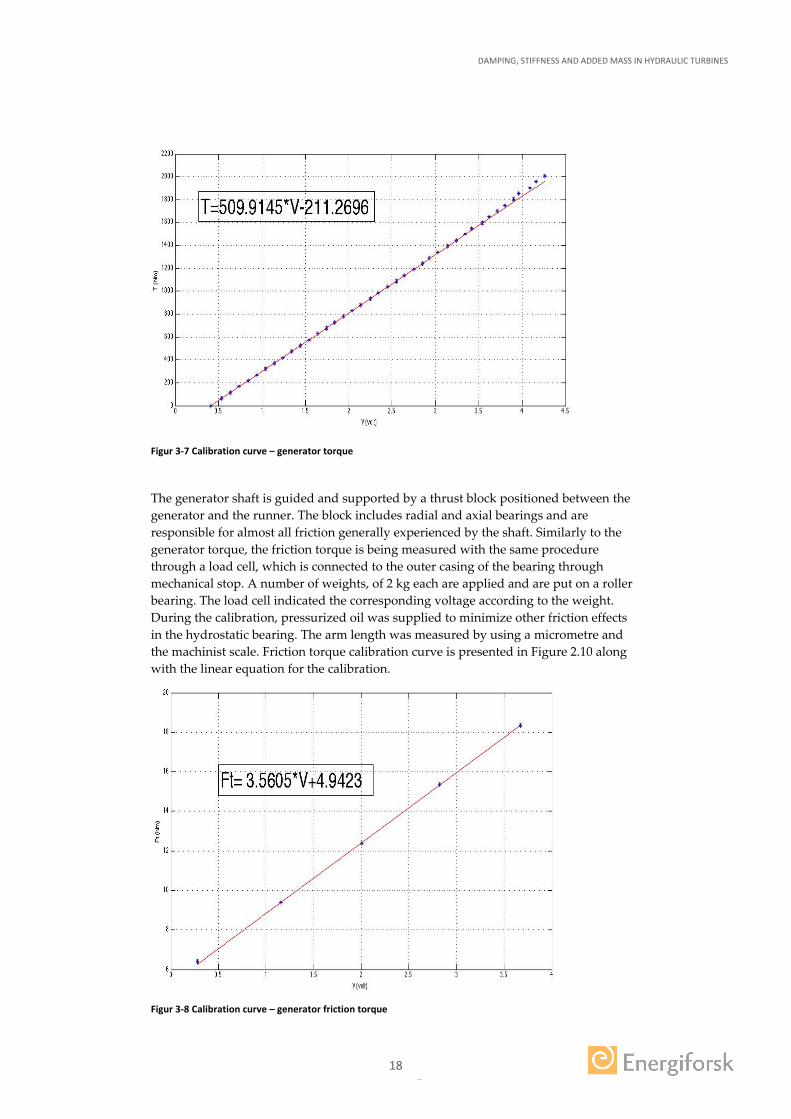
Figur 3-7 Calibration curve – generator torque
The generator shaft is guided and supported by a thrust block positioned between the
generator and the runner. The block includes radial and axial bearings and are
responsible for almost all friction generally experienced by the shaft. Similarly to the
generator torque, the friction torque is being measured with the same procedure
through a load cell, which is connected to the outer casing of the bearing through
mechanical stop. A number of weights, of 2 kg each are applied and are put on a roller
bearing. The load cell indicated the corresponding voltage according to the weight.
During the calibration, pressurized oil was supplied to minimize other friction effects
in the hydrostatic bearing. The arm length was measured by using a micrometre and
the machinist scale. Friction torque calibration curve is presented in Figure 2.10 along
with the linear equation for the calibration.
Figur 3-8 Calibration curve – generator friction torque

DAMPING, STIFFNESS AND ADDED MASS IN HYDRAULIC TURBINES
19
- 19 / 29 -
Before the experiment, the angular speed of the runner was measured using a photocell
and a circular disc with one cut fixed to the main shaft, an optical fork (OPB 960T51).
The photocell sends infrared light to the disc and a signal is sent to an acquisition
system every time the cut passes. The number of pulses per unit of time was computed
giving the runner rotational speed per unit of time. This system was checked with a
tachometer. Beside this system, an optical fork was mounted with a circular disc with
60 cuts. The calibration was made having the first system as a reference. Four
measuring points were made; the calibration curve and the linear equation coefficients
are showed in Figure 2.11.
For the guide vanes angular position, an angular position transducer was used,
Stegman AG612. A 12 V power supply was needed along with a signal converter. The
system used in the experiment was calibrated against this existing transducer that was
already calibrated. A new angular position transducer, also a Stegman AG612, was
introduced, and having the old one as a reference, a calibration curve and linear
coefficients for the calibration were obtained, as shown in Figure 2.12.
Figur 3-9 Calibration curve – rotational speed measuring system

DAMPING, STIFFNESS AND ADDED MASS IN HYDRAULIC TURBINES
20
- 20 / 29 -
Figur 3-10 Calibration curve – guide vanes opening angle
For the present experiment, one acquisition system was used. With the help of a
LABView v13.00 acquisition program and using two National Instruments data cards,
the signal from the sensors was digitalized. The data was acquired at a frequency of
3012 Hz through a NI 9222 (Fs≤10 kHz) module. Besides this an NI-USB cDaq 6211
module was used with the same acquisition data frequency.
In the USB NI 6211 the pressure sensor from the inlet pipe, the guide vanes transducer,
the rotational speed optical fork and the pressure sensors mounted in the vaneless
space and draft tube inlet was connected. The rest of the sensors, meaning the flow, the
axial thrust sensor, and generator and friction torque along with the differential
pressure sensor were connected to NI 9222 module.
By using one acquisition program, the problem of synchronizing was avoided. Many of
the signals were split from the initial configuration in the laboratory and cables could
be connected to the acquisition system.

DAMPING, STIFFNESS AND ADDED MASS IN HYDRAULIC TURBINES
21
- 21 / 29 -
4 Description of rig modifications
The sensors added to the rig were the pressure transducers situated in the vane less
space and in the draft tube, after the runner. A new optical fork was mounted to obtain
a better precision to measure the runner rotational speed and for the guide vanes angle
position another angular position transducer was used beside the existing one.
Another modification that was made in the rig was to the Simoreg DC-Master. An
option to external control of the torque was implemented beside the existing one,
which was used to control the rotational speed of the generator. The torque was
controlled through a 4-20 mA signal that was created with NI CompactRIO that is used
in control system and a current output card NI 9265. A cable was installed from the
Simoreg to the control room in the laboratory, through the control was made. The rig
control soft was also modified in concordance to these modifications.

DAMPING, STIFFNESS AND ADDED MASS IN HYDRAULIC TURBINES
22
- 22 / 29 -
5 Measurement program
The main objective of the measurements was to identify the added properties of the
Francis runner. To obtain these properties, transient regimes needed to be created.
During a transient operation, the angular speed, flow and runner torque vary with
time. The transient regimes were created by introducing a perturbation in the generator
magnetization, which created a variation in the mechanical torque of the turbine.
Since the Francis model installed in the laboratory could be operated over a wide range
of operating points, only three of them were chosen, which were representative for the
main regimes of the turbine: part load, near the best efficiency point and high load.
These points were chosen from the hill diagram of the Francis turbine.
For the present measurements the chosen points were:
Operating Point nRedR (-) qRedR (-)
Part Load (PL) 0,219 0,053
Best Efficiency Point (BEP) 0,195 0,151
High Load (HL) 0,198 0,161
where nRedR and qRed R represent
𝑛𝑒𝑑 =𝑛 ∗ 𝐷
√𝐸
𝑞𝑒𝑑 =𝑄
𝐷2 ∗ √𝐸
where n is the rotational speed of the runner in rotations per minute, D is the runner
diameter in meters, Q is the discharge to the turbine in m P
3P/s and E is total changed
energy in the runner in J/kg.
𝐸 =(𝑝𝑎𝑏𝑠1 − 𝑝𝑎𝑏𝑠2)
𝜌+
(𝑣12 − 𝑣2
2)
2+ (𝑧1 − 𝑧2)
where pabs1 and pabs2 are the absolute pressure values from the inlet and the outlet of
the turbine in Pa, v1 and v2 are the velocities corresponding to the pressure
measurements points in m/s and z1-z2 is the height difference between the measuring
points.
Controlling the rotational speed of the runner and the guide vanes angle makes the
control of the turbine. These two parameters act independently from each other. By
modifying these two parameters a certain operating point is reached and through the
PLC of the generator, this operating point is maintained. A sketch of the turbine control
is presented below in Fig.3.1.
After reaching the operating point that was considered for analysis, the control was
changed from rotational speed to torque. The measurements were executed keeping a
constant power level at the generator.
P = M ∗ ω

DAMPING, STIFFNESS AND ADDED MASS IN HYDRAULIC TURBINES
23
- 23 / 29 -
where P is the mechanical power of the turbine torque developed by the runner in Nm
and ω is the rotational speed in rad/s.
The PLC protects the generator from overload conditions and keeps the rotational
speed almost equal to the chosen set point value. Limitation blocks for the current and
the torque are being used as well. After the modifications implemented in the control
program of the turbine, there was the feature to modify the torque limit as well, of
course this could be done only within some limits without damaging the generator.
Figur 5-1 Francis turbine control
In the first stage of the experiment the torque limit was set to the maximum torque that
can be achieved by the generator, 2150 Nm. Modifying this value to the current torque
value that is currently developed by the turbine and decreasing the rotational speed set
point, the torque will have the tendency to increase but will be kept at the limit value.
The perturbation introduced in the system was made by varying this limit in
accordance to a sinusoid, a step or a impulse variation. Introducing the perturbation in
the torque limit, the rotational speed will vary as well, along the torque, creating the
transient in the system. The perturbations introduced in the system were of different
amplitudes, depending on the operating point torque value and in the case of the
sinusoidal perturbations different frequencies as well, ranging from 1 to 10 Hz. All the
measurements were done during this transient regime was on. The amplitude was
considered percentage from the current torque value at that operating point and for
BEP and HL 1.5% and 3% was investigated and for PL an additional 5% case.
A summary of the measurements performed are presented below in Tab.3.1:

DAMPING, STIFFNESS AND ADDED MASS IN HYDRAULIC TURBINES
24
- 24 / 29 -
Tab. 3.1. Conducted experiments
Operating point Perturbation type Amplitude of torque Frequency [Hz]
PL
sinusoidal
1.5% 1;2;3;4;5;6;7.5;9;10
3% 1;2;3;4;5;6;7.5;9;10
5% 1;2;3;4;5;6;7.5;9;10
step
1.5% -
3% -
5% -
impulse
1.5% -
3% -
5% -
BEP
sinusoidal 1.5% 1;2;3;4;5;6;7.5;9;10
3% 1;2;3;4;5;6;7.5;9;10
step 1.5% -
3% -
impulse 1.5% -
3% -
HL
sinusoidal 1.5% 1;2;3;4;5;6;7.5;9;10
3% 1;2;3;4;5;6;7.5;9;10
step 1.5% -
3% -
impulse 1.5% -
3% -

DAMPING, STIFFNESS AND ADDED MASS IN HYDRAULIC TURBINES
25
- 25 / 29 -
6 Signal Treatment – sinusoidal perturbation
For the ‘’added properties’’ investigation, the data got from the sensors, which
measured the torque, and the rotational speed was analysed.
The spectral analysis of the time signals was carried out using MATLAB codes. The
two signals were padded around zero by subtracting the mean value from the
instantaneous torque and rotational speed values. For the Fourier Transform, the
number of points considered is equal to the points that were acquired during a
measurement. The FFT resolution is Fs/NFFT where Fs represents the sampling rate of
the data acquisition, which for the present measurements is 3012 Hz and NFFT
represents the number of points considered from the time signal. Frequency f spans
over the interval [O, Fs/2] in this case because the Fs value is even.
The following figure presents the estimated frequency spectrum of the torque and
rotational speed time signals in steady state and also transient regime. Significant peaks
that are observed are related to the operating conditions of the turbine. In the case of
the transient regime, in both cases, rotational speed and torque, a peak at the
introduced perturbation frequency. Below a comparison between steady state and
transient regime is presented for the case of Best Operating Point 3% amplitude and 4
Hz frequency of the perturbation.
a) Frequency spectrum of rotational speed
time domain signal in steady state
regime
b) Frequency spectrum of rotational speed
time domain signal in transient regime
Fig. 6.1. Frequency spectrum – rotational speed time domain signal

DAMPING, STIFFNESS AND ADDED MASS IN HYDRAULIC TURBINES
26
- 26 / 29 -
a) Frequency spectrum of torque time
domain signal in steady state regime
b) Frequency spectrum of torque time
domain signal in steady state regime
Fig. 6.2. Frequency spectrum – torque time domain signal
Further, the signals were filtered, considering only the signal at the perturbation
frequency. MATLAB FFT filter was used in the analysis. The filter extracts only the
signal component that contains the perturbation frequency, in the case presented 4 Hz,
± 0.1 Hz. The figures below present the time domain rotational speed and torque signal,
before and after filtering. The signals are zero-padded for better presentation.
a) Time domain rotational speed signal
b) Filtered time domain rotational speed
signal around 4 Hz
Fig. 6.3. Raw and filtered rotational speed signal

DAMPING, STIFFNESS AND ADDED MASS IN HYDRAULIC TURBINES
27
- 27 / 29 -
a) Time domain torque signal
b) Time domain torque signal around 4 Hz
Fig. 6.4. Raw and filtered torque signal
After the filtering procedure, a Fourier Transform was used to obtain the signal
amplitude of the two filtered signals, rotational speed and torque and also to obtain the
phase shift between them. These three parameters are being used in the further
analysis.
a) Frequency spectrum of the rotational
speed filtered signal
b) Frequency spectrum of the torque
filtered signal
Fig. 6.5. Frequency spectrum – filtered torque and rotational speed filtered signals

DAMPING, STIFFNESS AND ADDED MASS IN HYDRAULIC TURBINES
28
- 28 / 29 -
7 Evaluation procedure
Assuming that the generator is stiff due to the connection with a rigid electric grid, the
single degree of freedom equation for the turbine runner is given by:
Jpθ̈ + Cθ̇ + Kθ = M
where Jp is the polar inertia, C is the damping, K is the stiffness, M is the moment, θ is
the angular displacement, θ̇ is the angular speed and θ̈ is the angular acceleration.
Then considering that the flow through the turbine will give additional inertia,
damping and stiffness, the equation of motion becomes:
(Jp + Jf)θ̈ + (C + Cf)θ̇ + (K + Kf)θ = M
where JRfR is the added inertia, CRfR is the added damping and KRfR is the added stiffness.
Rewriting the equation, we obtain:
Jfθ̈ + Cfθ̇ + Kfθ = M′
where M’ is the torsional moment, the perturbation which was introduced in the
system.
Considering M′ = T sin ωt and assuming KRfR = 0 the equation of motion becomes:
Jfθ̈ + Cfθ̇ = M
Further it is considered a harmonic solution of the equation:
θ = A sin ωt + B cos ωt = R sin(ωt + ϕ)
Substituting equation solution considered in the initial and equalling the two sides of
the equation can be obtained values for J and C.

DAMPING, STIFFNESS AND ADDED MASS IN HYDRAULIC TURBINES
29
- 29 / 29 -
8 Results: added properties
After analysing the entire set of data it was possible to extract the main parameters for
“added properties”, meaning the amplitude of each filtered signal and the phase shift
between them represents these parameters.
The first problem encountered was that the amplitude of the perturbation in the
rotational speed signal decreases significantly with the increase of the perturbation
frequency. This could be related to the fact that the PLC of the electric generator tries
to cancel the effect of the inserted perturbation. Another thing that could be related
with this effect is the high damping values of the system at certain frequencies. To
illustrate this, in Fig.4.1 is presented the case of Best Operating Point for 3%. It is easy
to observe that for frequencies above 5 Hz a peak cannot be observed at the inserted
frequency. The peak observed at 5.6 Hz is represented by the runner angular speed
considered for the BEP case.
Figur 8-1 Rotational speed amplitude variation
For each operating point considered for the analysis, the amplitude of the torque
perturbation and its effect in the rotational speed along with the phase shift between
the filtered signals of the torque and rotational speed are computed for each
investigated case. Below, the results are presented for the operating points taken in
consideration.

DAMPING, STIFFNESS AND ADDED MASS IN HYDRAULIC TURBINES
30
- 30 / 29 -
a) Torque perturbation amplitude
b) Rotational speed perturbation amplitude
c) Phase shift between signals
Fig.8.2 Best Operating Point

DAMPING, STIFFNESS AND ADDED MASS IN HYDRAULIC TURBINES
31
- 31 / 29 -
a) Torque perturbation amplitude
b) Rotational speed perturbation amplitude
c) Phase shift between signals
Fig.8.3 Part Load

DAMPING, STIFFNESS AND ADDED MASS IN HYDRAULIC TURBINES
32
- 32 / 29 -
a) Torque perturbation amplitude
b) Rotational speed perturbation amplitude
c) Phase shift between signals
Fig.8.4 High Load

DAMPING, STIFFNESS AND ADDED MASS IN HYDRAULIC TURBINES
33
- 33 / 29 -
The phase shift results indicate big differences with the change of the perturbation
frequency. This thing appears in all the considered cases.
For the HL and BEP cases the amplitude of the torque filtered signal is decreasing with
the increasing frequency perturbation and for the PL case the amplitude is almost
constant. The form of the variation for the rotational speed has the same form for all the
cases, and a high variation is observed. For frequencies above 6 Hz the amplitude of
the filtered signal has a value aprox. 1E-4 rad/s.
The phase shift results obtained during the analysis show a strange variation that could
be related to a particular operation of the entire system. The phase shift is changing for
each frequency and there is an almost pi/2 variation. Another thing, which is observed,
is that for different torque amplitudes the phase shift is almost constant for each
operating point considered.
To obtain values for the “added properties” there is a need to investigate the source of
the phase shift variation. With these current values we cannot estimate these values.

DAMPING, STIFFNESS AND ADDED MASS IN HYDRAULIC TURBINES
34
- 34 / 29 -
9 Results: flow parameters
Because during the transient regime, created in the system, additional parameters
beside the torque and rotational speed were measured, an analysis of the hydraulic
parameters could be made.
For better illustration of these effects the case of BEP with 3% amplitude and 1 Hz
perturbation frequency is presented for the main system parameters, like the flow and
the net head of the turbine.
The variation of the flow and the net head of the turbine between the same interval is
being presented below. The flow has a variation of about ±0.05 m P
3P/s. This variation is
related with the variation of the rotational speed. For the net head, for the considered
case to be presented here, the variation is about ±1 kPa.
a) Flow variation BEP 3% 1 Hz

DAMPING, STIFFNESS AND ADDED MASS IN HYDRAULIC TURBINES
35
- 35 / 29 -
b) Net head variation BEP 3%1 Hz
Fig.9.1 Head and flow variation during sinusoidal perturbation

DAMPING, STIFFNESS AND ADDED MASS IN HYDRAULIC TURBINES
36
Also for the step perturbation inserted into the system the variations of the flow and
net head are presented below.
a) Flow variation BEP 3% step perturbation
b) Net Head BEP 3% step perturbation
Fig.9.2. Head and flow variation during step perturbation

DAMPING, STIFFNESS AND ADDED MASS IN HYDRAULIC TURBINES
37
- 37 / 29 -
This set of data will be used to create a database for transient regimes in hydraulic
turbines to validate numerical simulation. Also a numerical simulation will be
performed to obtain the “added properties” recreating the conditions from the test rig.

DAMPING, STIFFNESS AND ADDED MASS IN HYDRAULIC TURBINES
38
- 38 / 29 -
10 Conclusion
The results obtained so far raise some questions that are related to the effects that may
appear in the system because of the generator’s PLC. The PLC may try to cancel the
perturbations effect in the rotational speed. Analyse of this problem is being conducted
now to proper identify the role of the PLC in the current experiment.
The phase shift results obtained in the experiment indicate a strange behaviour of the
system. This behaviour is currently being analysed by building a mechanical dynamic
model of the system, taking into consideration also the effect of the electrical generator
and its excitation. A cause of this phenomenon could be the small damping values that
are given by the water to system.


DAMPING, STIFFNESS AND ADDED MASS IN HYDRAULIC TURBINES Hydrauliska vattenturbiner används för att hålla nätet stabilt genom att variera lasten. Genom att kunna identifiera och mäta effekten av transienta regimer skulle man kunna förbättra driften av hydrauliska turbiner och minimera de problem som uppstår, till exempel vibrationer. Syftet här har varit att bestäm-ma fluid-strukturinteraktionens påverkan på styvhet, tröghetsmoment och dämpning i en Francisturbin.
Projektet ingår i Svenskt Vattenkraftcentrum, SVC som är ett centrum för utbildning och forskning inom vattenkraft och gruvdammar. Den nuvarande programperioden pågår mellan 2013 och 2016 och har en budget på cirka 110 miljoner kronor.
Svenskt Vattenkraftcentrum har etablerats av Energimyndigheten, Energiforsk och Svenska Kraftnät tillsammans med Luleå tekniska universitet, Kungliga Tekniska Högskolan, Chalmers tekniska högskola och Uppsala universitet.
Another step forward in Swedish energy researchEnergiforsk – Swedish Energy Research Centre is a research and knowledge based organization that brings together large parts of Swedish research and development on energy. The goal is to increase the efficiency and implementation of scientific results to meet future challenges in the energy sector. We work in a number of research areas such as hydropower, energy gases and liquid automotive fuels, fuel based combined heat and power generation, and energy management in the forest industry. Our mission also includes the generation of knowledge about resource-efficient sourcing of energy in an overall perspective, via its transformation and transmission to its end-use. Read more: www.energiforsk.se