dan cooper - loopnetimages2.loopnet.com/d2/d_2gqfzl-_cutyt-10h_8a1... · dan cooper...
TRANSCRIPT

Cooper Commercial Investment Group 6120 Parkland Blvd., Suite 206 Cleveland, OH 44124 www.coopergrp.com
Dan Cooper [email protected] (888) 525-5695 x12
Bob Havasi [email protected] (888) 525-5695 x10
In Connection with Licensed PA Broker

2
Table of Contents
INVESTMENT SUMMARY
Investment Highlights ………...…………….. 4
Investment Overview ……………………….. 5
Location Overview…………………………….. 6
FINANCIAL ANALYSIS
Offering Summary …….……………………… 8
Rent Roll ……………….…………………….…… 9
PROPERTY ANALYSIS
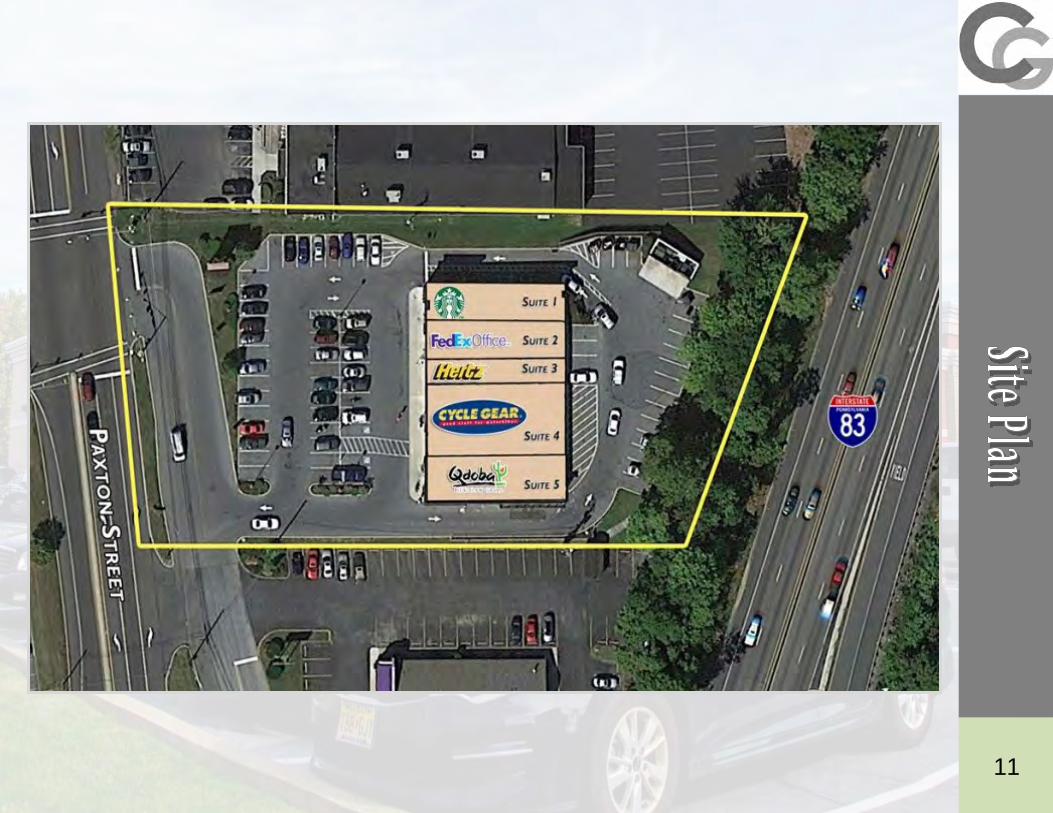
Site Plan ..….…………………………………….. 11
Aerial Maps …………………………………….. 12-13
Location Maps .…………………………………. 14
Demographics ..………………………………… 15
TENANT ANALYSIS
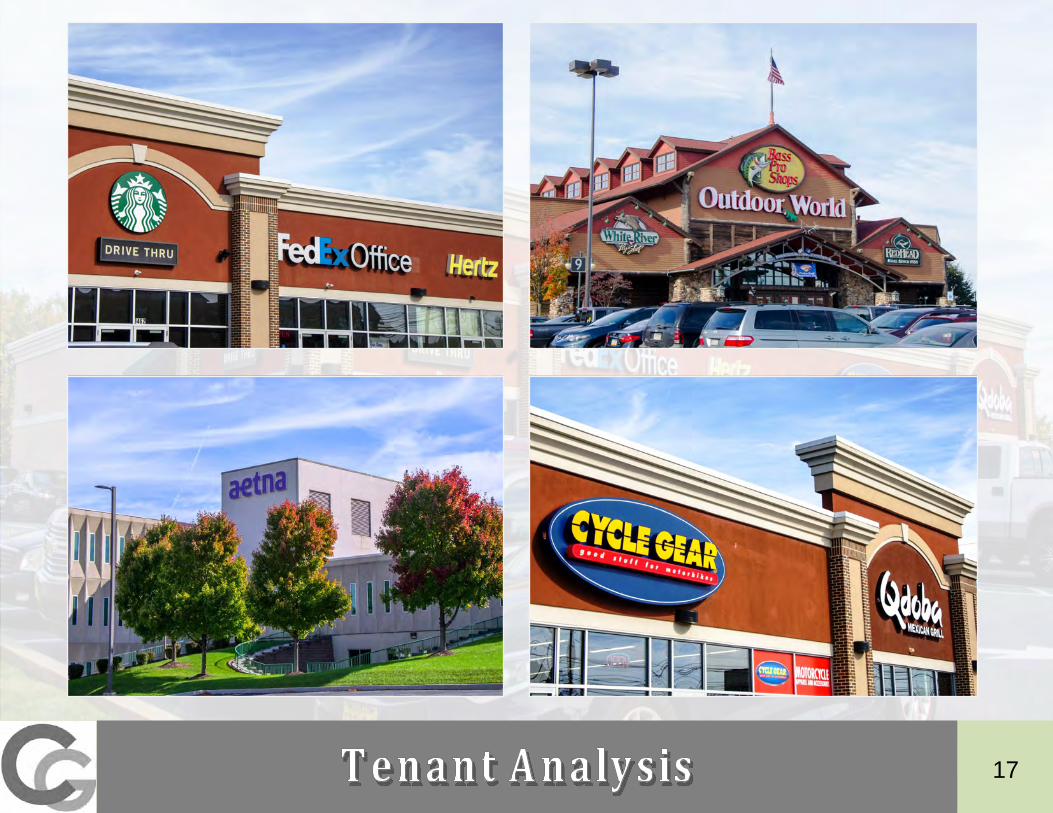
Tenant Profiles ……….………….…………….. 17-21
Disclosure & Confidentiality …..….……… 22
3

INVESTMENT HIGHLIGHTS
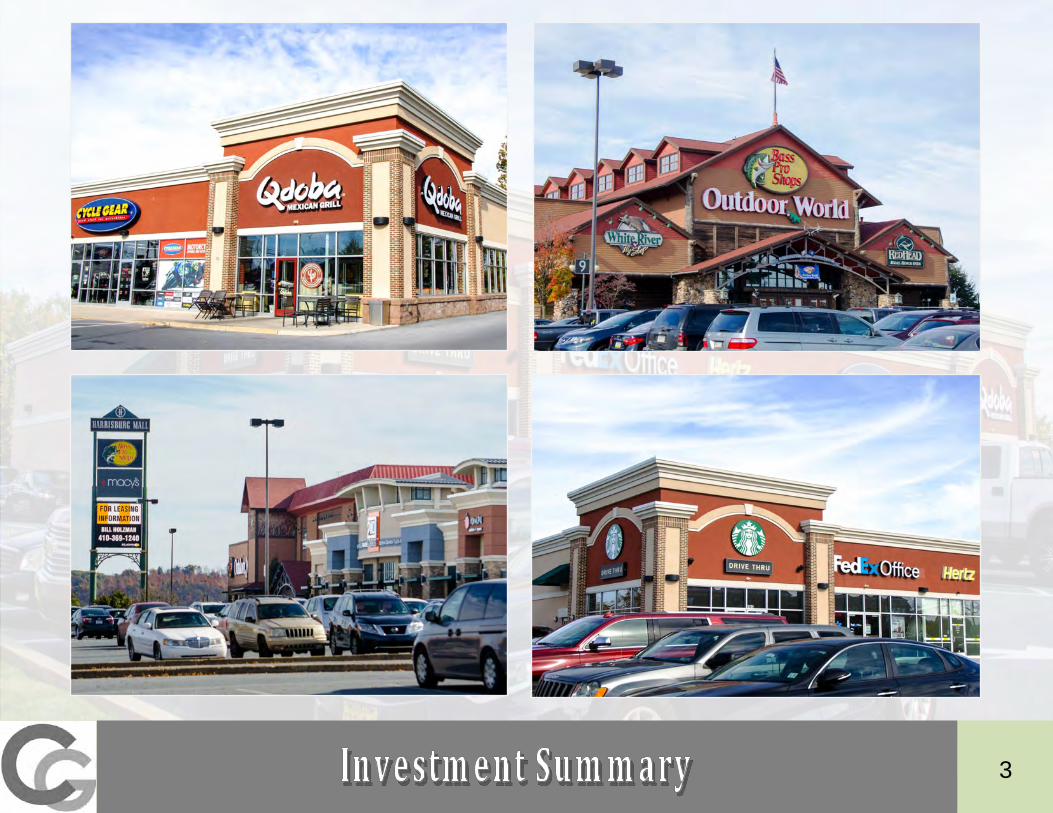
• 5-Tenant, 100% Occupied, NNN Trophy Center Ideally Positioned in Irreplaceable Location on Center of Main Retail Corridor
• 100% National Tenants: Great Retail Mix Consisting of Mostly Service-Oriented Businesses
• Multiple Lease Extensions, Including 10-Yr. Extension for Starbuck’s (NASDAQ: SBUX/S&P “A-”) with Mid-Term Rental Increases and NO TERMINATION RIGHTS
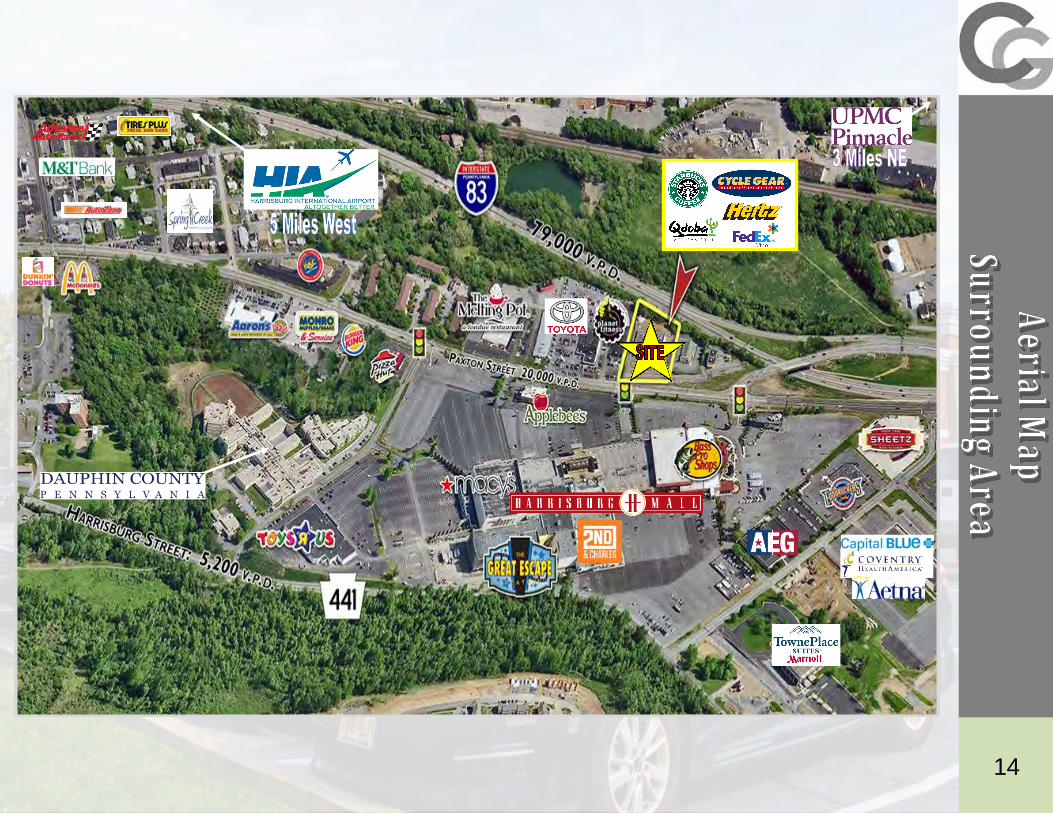
• Unbeatable Location: Extremely High Visibility and Directly Across From Best-in-Class Retailers, Featuring Largest Mall in Harrisburg Anchored by Bass Pro Shops, Macy’s and Regal Great Escape Theatres
• Strong Demographics in Growing Suburban Market: Average Household Incomes Over $68,000 Within 5-Miles and Over 4,000 Daytime Employees Within 1/4 Mile and 7,500 Within 1-Mile
• Signalized Entrance Off the Heavily Traveled Paxton Street with Great Visibility and Prominent Pylon Signage
4
Paxton Street Commons
• Direct Access to Large Population Base Drawing From Downtown Harrisburg with Over 377,000 People Within 10-Miles and Easy Access Located Less Than 7-Miles From Harrisburg International Airport
• Easy Accessible From I-83 and I-283 Exit Ramp (Less Than 1/2 Mile) with Over 79,000 VPD Along I-83 and 20,000 VPD Along Paxton Street (Visibility From Both Roadways)
• Built-In Employment Base with State Capital: Largest Employer, the Federal and State Governments Collectively Employing Approx. 40,000, Providing Excellent Stability to the Harrisburg Economy
• Surrounded by Major Employers: Giant Food Stores (8,902 Employees), Penn State Hershey Medical Center (8,849 Employees), Hershey Entertainment and Resort (7,500 Employees), Hershey Foods (6,500 Employees), Highmark Health Insurance (5,200 Employees), TE Connectivity (4,700 Employees) and UPMC Pinnacle (Nearly 4,000 Employees)
ADDITIONAL INVESTMENT HIGHLIGHTS
5
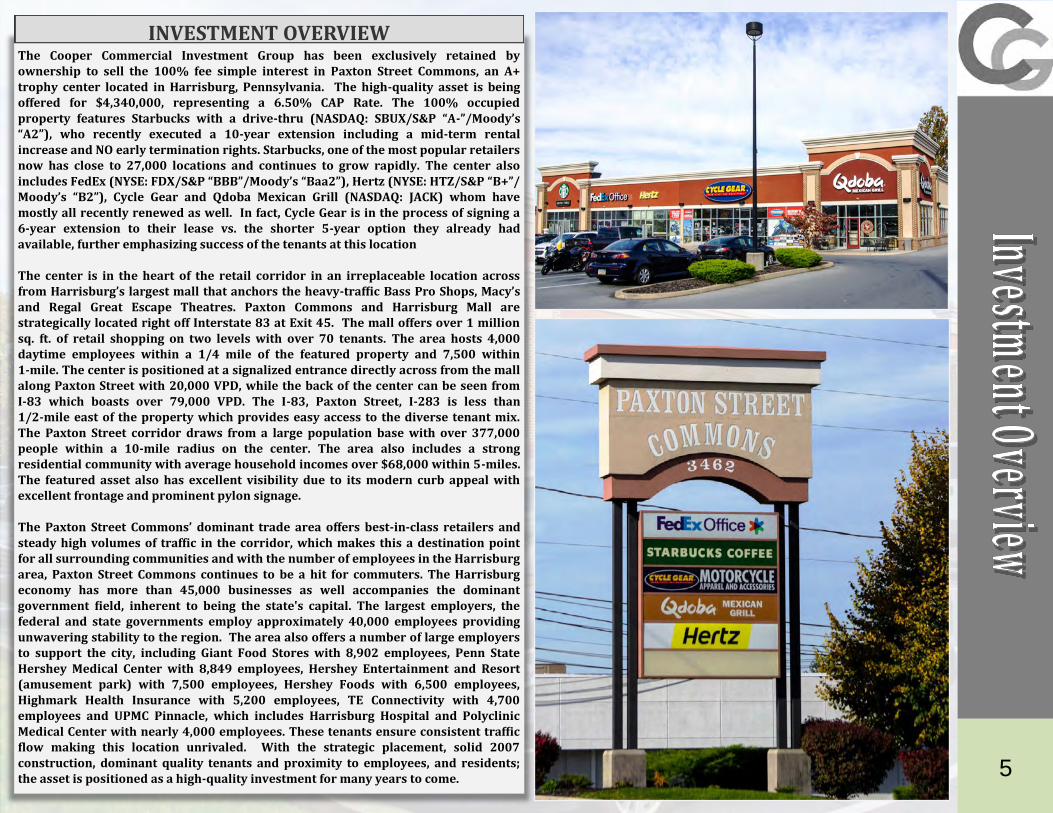
The Cooper Commercial Investment Group has been exclusively retained by ownership to sell the 100% fee simple interest in Paxton Street Commons, an A+ trophy center located in Harrisburg, Pennsylvania. The high-quality asset is being offered for $4,340,000, representing a 6.50% CAP Rate. The 100% occupied property features Starbucks with a drive-thru (NASDAQ: SBUX/S&P “A-”/Moody’s “A2”), who recently executed a 10-year extension including a mid-term rental increase and NO early termination rights. Starbucks, one of the most popular retailers now has close to 27,000 locations and continues to grow rapidly. The center also includes FedEx (NYSE: FDX/S&P “BBB”/Moody’s “Baa2”), Hertz (NYSE: HTZ/S&P “B+”/Moody’s “B2”), Cycle Gear and Qdoba Mexican Grill (NASDAQ: JACK) whom have mostly all recently renewed as well. In fact, Cycle Gear is in the process of signing a 6-year extension to their lease vs. the shorter 5-year option they already had available, further emphasizing success of the tenants at this location The center is in the heart of the retail corridor in an irreplaceable location across from Harrisburg’s largest mall that anchors the heavy-traffic Bass Pro Shops, Macy’s and Regal Great Escape Theatres. Paxton Commons and Harrisburg Mall are strategically located right off Interstate 83 at Exit 45. The mall offers over 1 million sq. ft. of retail shopping on two levels with over 70 tenants. The area hosts 4,000 daytime employees within a 1/4 mile of the featured property and 7,500 within 1-mile. The center is positioned at a signalized entrance directly across from the mall along Paxton Street with 20,000 VPD, while the back of the center can be seen from I-83 which boasts over 79,000 VPD. The I-83, Paxton Street, I-283 is less than 1/2-mile east of the property which provides easy access to the diverse tenant mix. The Paxton Street corridor draws from a large population base with over 377,000 people within a 10-mile radius on the center. The area also includes a strong residential community with average household incomes over $68,000 within 5-miles. The featured asset also has excellent visibility due to its modern curb appeal with excellent frontage and prominent pylon signage. The Paxton Street Commons’ dominant trade area offers best-in-class retailers and steady high volumes of traffic in the corridor, which makes this a destination point for all surrounding communities and with the number of employees in the Harrisburg area, Paxton Street Commons continues to be a hit for commuters. The Harrisburg economy has more than 45,000 businesses as well accompanies the dominant government field, inherent to being the state's capital. The largest employers, the federal and state governments employ approximately 40,000 employees providing unwavering stability to the region. The area also offers a number of large employers to support the city, including Giant Food Stores with 8,902 employees, Penn State Hershey Medical Center with 8,849 employees, Hershey Entertainment and Resort (amusement park) with 7,500 employees, Hershey Foods with 6,500 employees, Highmark Health Insurance with 5,200 employees, TE Connectivity with 4,700 employees and UPMC Pinnacle, which includes Harrisburg Hospital and Polyclinic Medical Center with nearly 4,000 employees. These tenants ensure consistent traffic flow making this location unrivaled. With the strategic placement, solid 2007 construction, dominant quality tenants and proximity to employees, and residents; the asset is positioned as a high-quality investment for many years to come.
INVESTMENT OVERVIEW
6
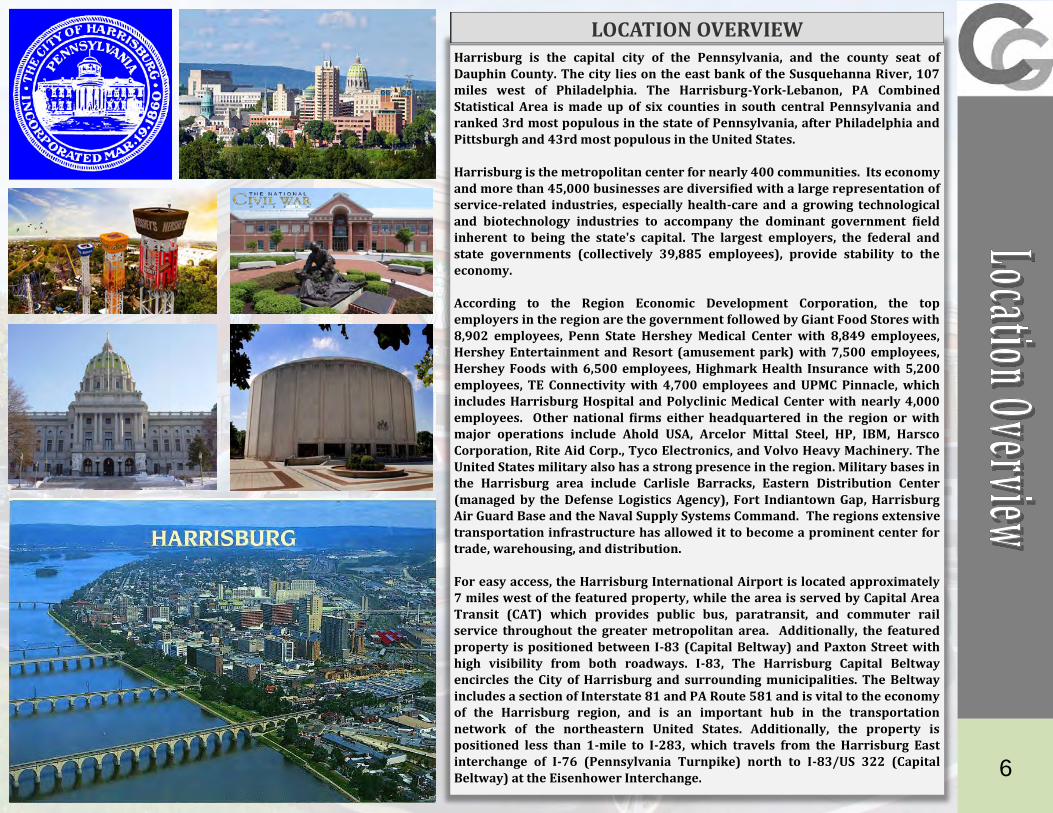
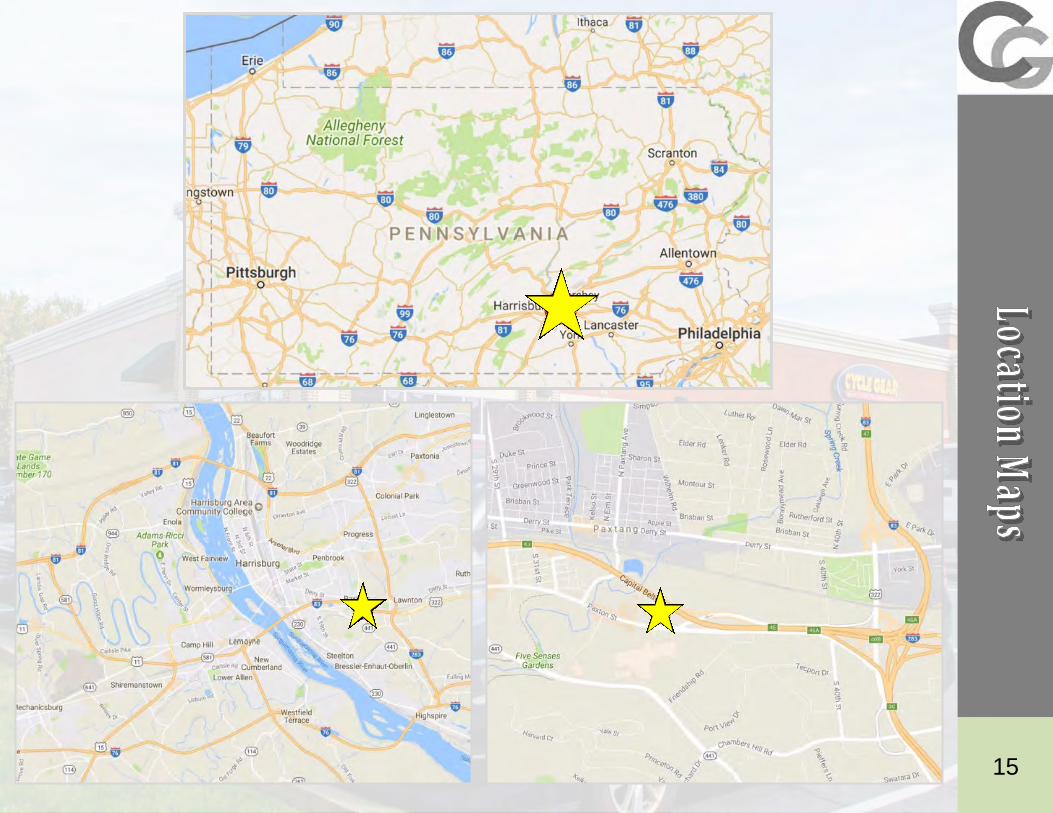
Harrisburg is the capital city of the Pennsylvania, and the county seat of Dauphin County. The city lies on the east bank of the Susquehanna River, 107 miles west of Philadelphia. The Harrisburg-York-Lebanon, PA Combined Statistical Area is made up of six counties in south central Pennsylvania and ranked 3rd most populous in the state of Pennsylvania, after Philadelphia and Pittsburgh and 43rd most populous in the United States. Harrisburg is the metropolitan center for nearly 400 communities. Its economy and more than 45,000 businesses are diversified with a large representation of service-related industries, especially health-care and a growing technological and biotechnology industries to accompany the dominant government field inherent to being the state's capital. The largest employers, the federal and state governments (collectively 39,885 employees), provide stability to the economy. According to the Region Economic Development Corporation, the top employers in the region are the government followed by Giant Food Stores with 8,902 employees, Penn State Hershey Medical Center with 8,849 employees, Hershey Entertainment and Resort (amusement park) with 7,500 employees, Hershey Foods with 6,500 employees, Highmark Health Insurance with 5,200 employees, TE Connectivity with 4,700 employees and UPMC Pinnacle, which includes Harrisburg Hospital and Polyclinic Medical Center with nearly 4,000 employees. Other national firms either headquartered in the region or with major operations include Ahold USA, Arcelor Mittal Steel, HP, IBM, Harsco Corporation, Rite Aid Corp., Tyco Electronics, and Volvo Heavy Machinery. The United States military also has a strong presence in the region. Military bases in the Harrisburg area include Carlisle Barracks, Eastern Distribution Center (managed by the Defense Logistics Agency), Fort Indiantown Gap, Harrisburg Air Guard Base and the Naval Supply Systems Command. The regions extensive transportation infrastructure has allowed it to become a prominent center for trade, warehousing, and distribution. For easy access, the Harrisburg International Airport is located approximately 7 miles west of the featured property, while the area is served by Capital Area Transit (CAT) which provides public bus, paratransit, and commuter rail service throughout the greater metropolitan area. Additionally, the featured property is positioned between I-83 (Capital Beltway) and Paxton Street with high visibility from both roadways. I-83, The Harrisburg Capital Beltway encircles the City of Harrisburg and surrounding municipalities. The Beltway includes a section of Interstate 81 and PA Route 581 and is vital to the economy of the Harrisburg region, and is an important hub in the transportation network of the northeastern United States. Additionally, the property is positioned less than 1-mile to I-283, which travels from the Harrisburg East interchange of I-76 (Pennsylvania Turnpike) north to I-83/US 322 (Capital Beltway) at the Eisenhower Interchange.
LOCATION OVERVIEW

7
8
Rental Income:
Tenant Reimbursements:
Potential Gross Income:
Vacancy (Actual %):
Effective Gross Income:
Expenses:
NOI:
$289,508
$75,179
$364,686
($0)
$364,686
$82,499
$282,187
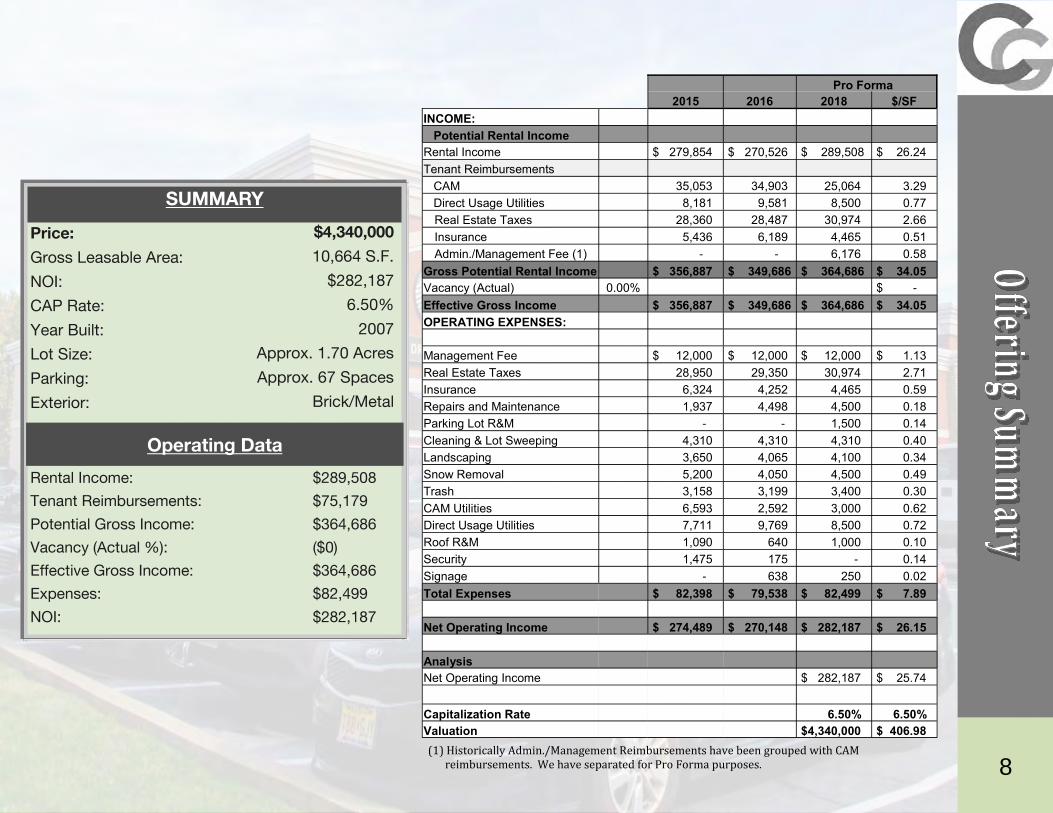
Price:
Gross Leasable Area:
NOI:
CAP Rate:
Year Built:
Lot Size:
Parking:
Exterior:
$4,340,000
10,664 S.F.
$282,187
6.50%
2007
Approx. 1.70 Acres
Approx. 67 Spaces
Brick/Metal
SUMMARY
Operating Data
Pro Forma
2016 2018 $/SF 2015
INCOME:
Potential Rental Income
Rental Income $ 270,526 $ 289,508 $ 26.24 $ 279,854
Tenant Reimbursements
CAM 34,903 25,064 3.29 35,053
Direct Usage Utilities 9,581 8,500 0.77 8,181
Real Estate Taxes 28,487 30,974 2.66 28,360
Insurance 6,189 4,465 0.51 5,436
Admin./Management Fee (1) - 6,176 0.58 -
Gross Potential Rental Income $ 349,686 $ 364,686 $ 34.05 $ 356,887
Vacancy (Actual) 0.00% $ -
Effective Gross Income $ 349,686 $ 364,686 $ 34.05 $ 356,887
OPERATING EXPENSES:
Management Fee $ 12,000 $ 12,000 $ 1.13 $ 12,000
Real Estate Taxes 29,350 30,974 2.71 28,950
Insurance 4,252 4,465 0.59 6,324
Repairs and Maintenance 4,498 4,500 0.18 1,937
Parking Lot R&M - 1,500 0.14 -
Cleaning & Lot Sweeping 4,310 4,310 0.40 4,310
Landscaping 4,065 4,100 0.34 3,650
Snow Removal 4,050 4,500 0.49 5,200
Trash 3,199 3,400 0.30 3,158
CAM Utilities 2,592 3,000 0.62 6,593
Direct Usage Utilities 9,769 8,500 0.72 7,711
Roof R&M 640 1,000 0.10 1,090
Security 175 - 0.14 1,475
Signage 638 250 0.02 -
Total Expenses $ 79,538 $ 82,499 $ 7.89 $ 82,398
Net Operating Income $ 270,148 $ 282,187 $ 26.15 $ 274,489
Analysis
Net Operating Income $ 282,187 $ 25.74
Capitalization Rate 6.50% 6.50%
Valuation $4,340,000 $ 406.98
(1) Historically Admin./Management Reimbursements have been grouped with CAM reimbursements. We have separated for Pro Forma purposes.
9
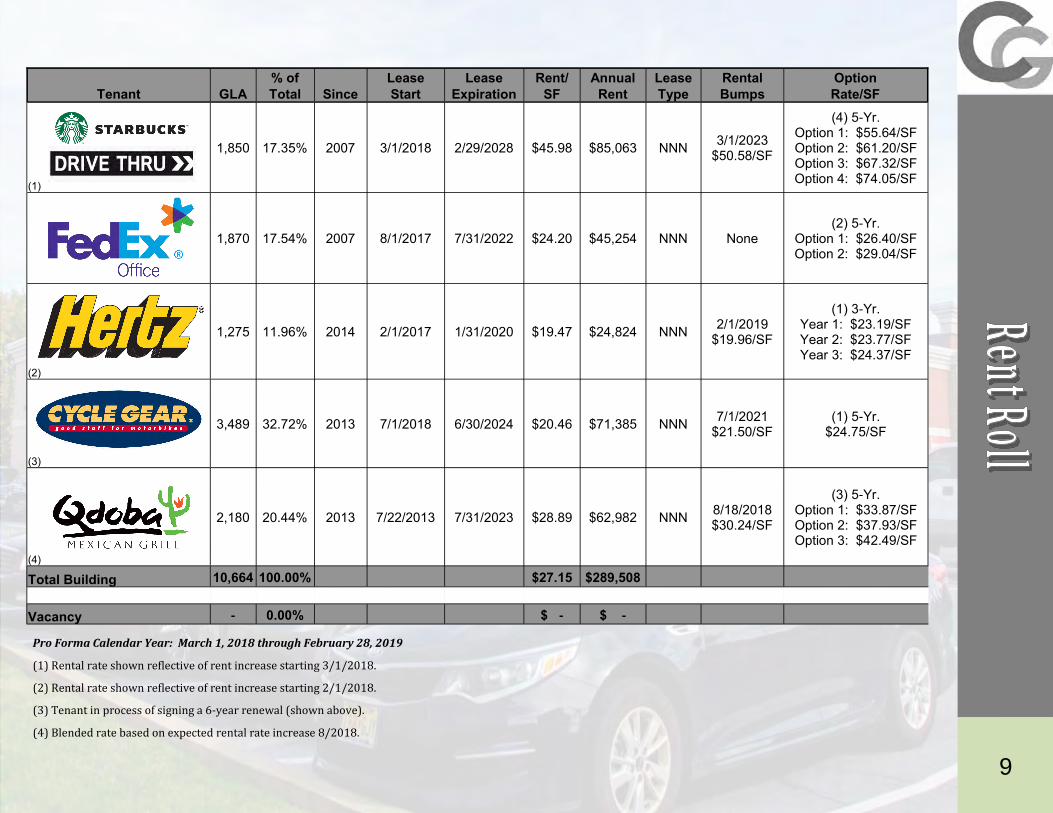
% of Lease Lease Rent/ Annual Lease Rental Option
Tenant GLA Total Since Start Expiration SF Rent Type Bumps Rate/SF
(1)
1,850 17.35% 2007 3/1/2018 2/29/2028 $45.98 $85,063 NNN 3/1/2023
$50.58/SF
(4) 5-Yr. Option 1: $55.64/SF Option 2: $61.20/SF Option 3: $67.32/SF Option 4: $74.05/SF
1,870 17.54% 2007 8/1/2017 7/31/2022 $24.20 $45,254 NNN None (2) 5-Yr.
Option 1: $26.40/SF Option 2: $29.04/SF
(2)
1,275 11.96% 2014 2/1/2017 1/31/2020 $19.47 $24,824 NNN 2/1/2019
$19.96/SF
(1) 3-Yr. Year 1: $23.19/SF Year 2: $23.77/SF Year 3: $24.37/SF
(3)
3,489 32.72% 2013 7/1/2018 6/30/2024 $20.46 $71,385 NNN 7/1/2021
$21.50/SF (1) 5-Yr.
$24.75/SF
(4)
2,180 20.44% 2013 7/22/2013 7/31/2023 $28.89 $62,982 NNN 8/18/2018 $30.24/SF
(3) 5-Yr. Option 1: $33.87/SF Option 2: $37.93/SF Option 3: $42.49/SF
Total Building 10,664 100.00% $27.15 $289,508
Vacancy - 0.00% $ - $ -
Pro Forma Calendar Year: March 1, 2018 through February 28, 2019
(1) Rental rate shown reflective of rent increase starting 3/1/2018.
(2) Rental rate shown reflective of rent increase starting 2/1/2018.
(3) Tenant in process of signing a 6-year renewal (shown above).
(4) Blended rate based on expected rental rate increase 8/2018.

10
11
14

14
15

16
3462 Paxton St 1 mi radius 3 mi radius 5 mi radius 10 mi radius
Harrisburg, PA 17111
POPULATION
2017 Estimated Population 9,191 84,384 175,334 377,022
2010 Census Population 8,629 83,860 171,161 364,437
2000 Census Population 8,171 81,948 166,234 338,739
Historical Annual Growth 2000 to 2017 0.7% 0.2% 0.3% 0.7%
2017 Median Age 36.3 35 37.1 39.5
HOUSEHOLDS
2017 Estimated Households 3,292 35,176 75,805 160,596
2022 Projected Households 3,339 36,882 79,623 167,775
2010 Census Households 3,083 34,329 72,674 151,622
2000 Census Households 2,810 33,575 69,937 138,108
Projected Annual Growth 2017 to 2022 0.3% 1.0% 1.0% 0.9%
Historical Annual Growth 2000 to 2017 1.0% 0.3% 0.5% 1.0%
RACE AND
ETHNICITY
2017 Estimated White 59.0% 48.0% 59.5% 73.8%
2017 Estimated Black or African American 26.3% 34.9% 26.4% 14.7%
2017 Estimated Asian or Pacific Islander 5.7% 4.9% 5.0% 5.4%
2017 Estimated American Indian or Native Alaskan 0.2% 0.4% 0.3% 0.2%
2017 Estimated Other Races 8.8% 11.9% 8.8% 5.9%
INCOME
2017 Estimated Average Household Income $61,737 $60,619 $68,032 $81,960
2017 Estimated Median Household Income $57,477 $50,172 $57,732 $69,178
2017 Estimated Per Capita Income $25,074 $25,713 $29,700 $35,163
EDUCATION
(AGE 25+)
2017 Estimated Elementary (Grade Level 0 to 8) 3.3% 4.1% 3.3% 2.4%
2017 Estimated Some High School (Grade Level 9 to 11) 7.5% 8.9% 7.2% 5.8%
2017 Estimated High School Graduate 35.7% 36.1% 33.1% 31.6%
2017 Estimated Some College 19.7% 19.2% 18.3% 17.0%
2017 Estimated Associates Degree Only 8.8% 8.1% 8.9% 8.6%
2017 Estimated Bachelors Degree Only 16.8% 16.1% 18.8% 21.5%
2017 Estimated Graduate Degree 8.1% 7.5% 10.4% 13.0%
BUSINESS
2017 Estimated Total Businesses 604 4,639 9,635 18,138
2017 Estimated Total Employees 8,666 89,184 161,702 290,035
2017 Estimated Employee Population per Business 14.3 19.2 16.8 16.0
2017 Estimated Residential Population per Business 15.2 18.2 18.2 20.8
17

18
Starbucks Corporation (NASDAQ: SBUX/S&P “A-”/Moody’s “A2”) operates
as a roaster, marketer, and retailer of specialty coffee worldwide. The
company operates in four segments: Americas; Europe, Middle East, and
Africa; China/Asia Pacific; and Channel Development. Its stores offer
coffee and tea beverages, packaged roasted whole bean and ground
coffees, single-serve and ready-to-drink coffee and tea products, juices, and
bottled water. The company’s stores also provide fresh food and snack
offerings; and various food products, such as pastries, and breakfast
sandwiches and lunch items, as well as serve ware, beverage-making
equipment, and accessories. In addition, it licenses its trademarks through
licensed stores, and grocery and national foodservice accounts. The
company offers its products under the Starbucks, Teavana, Tazo, Seattle’s
Best Coffee, Evolution Fresh, La Boulange, Ethos, Starbucks VIA, Seattle’s
Best Coffee, Frappuccino, Starbucks Doubleshot, Starbucks Refreshers, and
Starbucks Discoveries Iced Café Favorites brand names.
www.starbucks.com
Source: www.starbucks.com
Tenant Base Rent Schedule
Current:
Bump 2023:
Option 1:
Option 2:
Option 3:
Option 4:
Monthly
$7,088.58
$7,797.75
$8,577.83
$9,435.00
$10,378.50
$11,416.04
PSF
$45.98
$50.58
$55.64
$61.20
$67.32
$74.05
Tenant Recapture
Annual
$85,063.00
$93,573.00
$102,934.00
$113,220.00
$124,542.00
$136,992.50
Headquarter:
# of Total Locations:
Corporate:
Ticker Symbol:
S&P Credit Rating:
Moody’s Credit Rating:
GLA:
Tenant Since:
Current Term Start:
Lease Expiration:
Rental Bumps:
Options:
Exclusive Use:
Co-Tenancy:
Other Termination Clause:
Seattle, WA
26,736+
Starbucks Corporation
NASDAQ: SBUX
A-
A2
1,850
2007
03/01/2018
02/29/2028
03/01/2023
(4) 5-Yr.
Coffee, Tea, Etc.
None
None
Tenant Lease Abstract
Common Area Maintenance:
CAP on CAM:
Insurance:
Real Estate Taxes:
Admin. Fee:
Pro Rata Share
105% Over Previous Year’s
Actual CAM Expenses,
Excluding Snow Removal &
Utilities
Pro Rata Share
Pro Rata Share
10% on CAM Expenses
* Rental rate shown reflective of rental increase effective 3/1/2018.
18
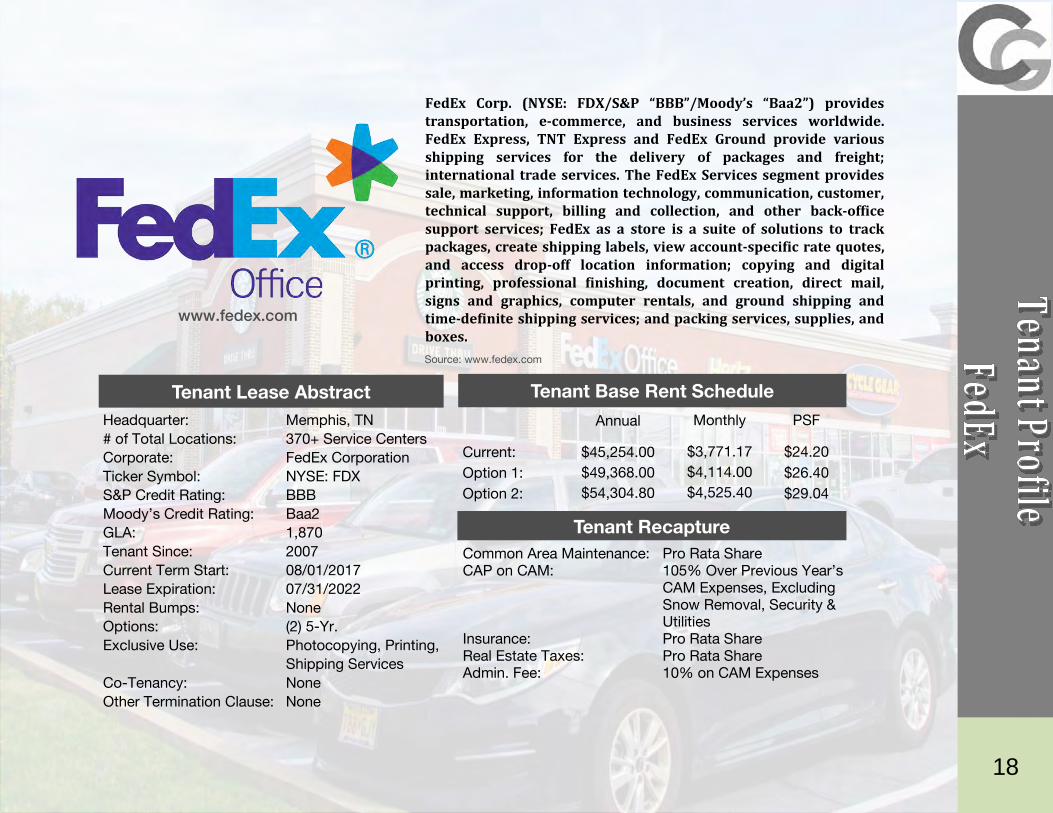
FedEx Corp. (NYSE: FDX/S&P “BBB”/Moody’s “Baa2”) provides transportation, e-commerce, and business services worldwide. FedEx Express, TNT Express and FedEx Ground provide various shipping services for the delivery of packages and freight; international trade services. The FedEx Services segment provides sale, marketing, information technology, communication, customer, technical support, billing and collection, and other back-office support services; FedEx as a store is a suite of solutions to track packages, create shipping labels, view account-specific rate quotes, and access drop-off location information; copying and digital printing, professional finishing, document creation, direct mail, signs and graphics, computer rentals, and ground shipping and time-definite shipping services; and packing services, supplies, and boxes.
www.fedex.com
Source: www.fedex.com
Tenant Base Rent Schedule
Current:
Option 1:
Option 2:
Monthly
$3,771.17
$4,114.00
$4,525.40
PSF
$24.20
$26.40
$29.04
Tenant Recapture
Annual
$45,254.00
$49,368.00
$54,304.80
Common Area Maintenance:
CAP on CAM:
Insurance:
Real Estate Taxes:
Admin. Fee:
Pro Rata Share
105% Over Previous Year’s
CAM Expenses, Excluding
Snow Removal, Security &
Utilities
Pro Rata Share
Pro Rata Share
10% on CAM Expenses
Headquarter:
# of Total Locations:
Corporate:
Ticker Symbol:
S&P Credit Rating:
Moody’s Credit Rating:
GLA:
Tenant Since:
Current Term Start:
Lease Expiration:
Rental Bumps:
Options:
Exclusive Use:
Co-Tenancy:
Other Termination Clause:
Memphis, TN
370+ Service Centers
FedEx Corporation
NYSE: FDX
BBB
Baa2
1,870
2007
08/01/2017
07/31/2022
None
(2) 5-Yr.
Photocopying, Printing,
Shipping Services
None
None
Tenant Lease Abstract

18
Hertz Corp. (NYSE: HTZ/S&P “B+”/Moody’s “B2”) is an airport general use
vehicle rental company that engages in the vehicle rental business in North
America, Europe, Latin America, Africa, Asia, Australia, the Caribbean, the
Middle East, and New Zealand. The company offers vehicle rental services
from 1,600 airport rental locations and 2,600 off airport locations in the
United States; and 1,400 airport rental locations and 4,100 off airport
rental locations internationally to business and leisure customers. The
company operates the Hertz, Dollar, and Thrifty vehicle rental brands in
approximately 9,700 corporate and franchisee locations; and sells
ancillary products and services. It also owns the vehicle leasing and fleet
management business that operates the Firefly and Hertz 24/7 car sharing
rental business in international markets; and sells vehicles through its
Hertz Car Sales. As of 2016, the company operated a rental fleet of
approximately 515,900 vehicles in the United States and 196,600 vehicles
in international operations.
www.hertz.com
Source: www.hertz.com
Tenant Base Rent Schedule
Current*:
Bump 2019:
Option 1
Year 1:
Year 2:
Year 3:
Monthly
$2,068.67
$2,120.75
$2,463.93
$2,525.56
$2,589.31
PSF
$19.47
$19.96
$23.19
$23.77
$24.37
Tenant Recapture
Annual
$24,824.00
$25,449.00
$29,567.25
$30,306.75
$31,071.75
Headquarter:
# of Total Locations:
Corporate:
Ticker Symbol:
S&P Credit Rating:
Moody’s Credit Rating:
GLA:
Tenant Since:
Current Term Start:
Lease Expiration:
Rental Bumps:
Options:
Exclusive Use:
Co-Tenancy:
Other Termination Clause:
Estero, FL
9,700+
Hertz Corporation
NYSE: HTZ
B+
B2
1,275
2014
02/01/2017
01/31/2020
02/01/2019
(1) 3-Yr.
Vehicle Leasing/Rental
None
None
Tenant Lease Abstract
Common Area Maintenance:
CAP on CAM:
Insurance:
Real Estate Taxes:
Admin. Fee:
OR
Management Fee:
Pro Rata Share
105% Over Previous Year’s
CAM Expenses, Excluding
Snow/Ice Removal
Pro Rata Share
Pro Rata Share
15% on Operating Expenses
OR
PRS of Comparable Fee
* Rental rate shown reflective of rental increase effective 2/1/2018.
18
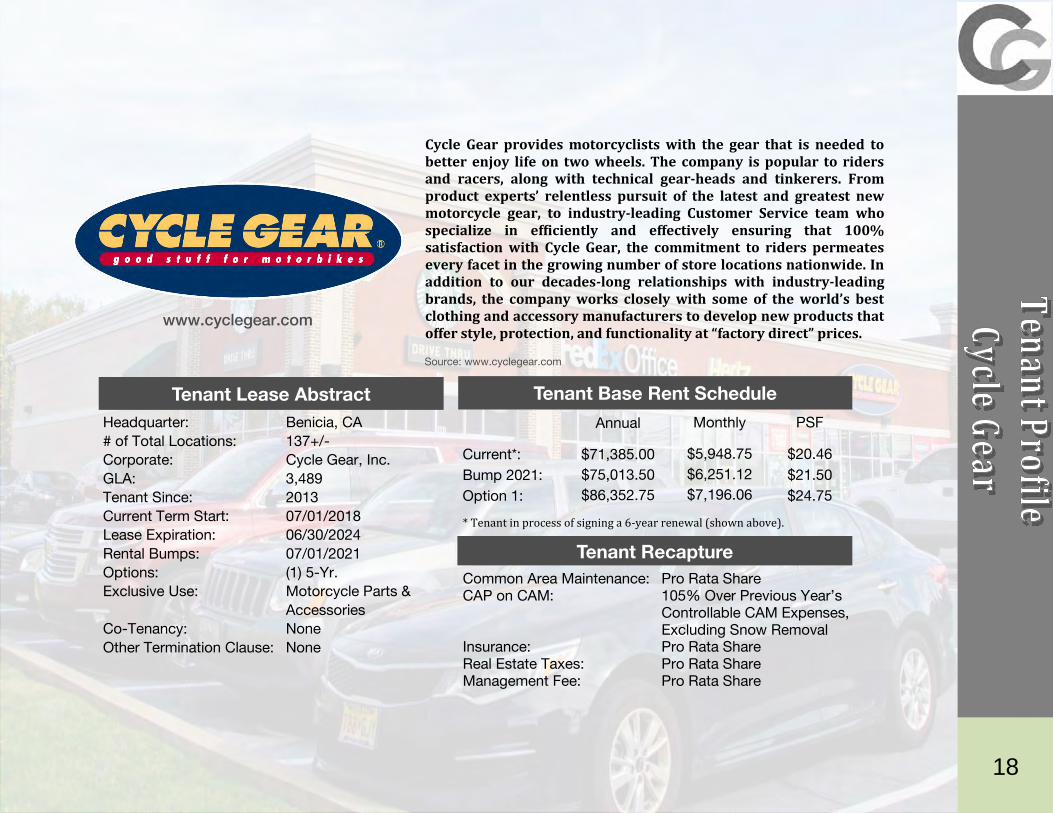
Cycle Gear provides motorcyclists with the gear that is needed to better enjoy life on two wheels. The company is popular to riders and racers, along with technical gear-heads and tinkerers. From product experts’ relentless pursuit of the latest and greatest new motorcycle gear, to industry-leading Customer Service team who specialize in efficiently and effectively ensuring that 100% satisfaction with Cycle Gear, the commitment to riders permeates every facet in the growing number of store locations nationwide. In addition to our decades-long relationships with industry-leading brands, the company works closely with some of the world’s best clothing and accessory manufacturers to develop new products that offer style, protection, and functionality at “factory direct” prices.
www.cyclegear.com
Source: www.cyclegear.com
Tenant Base Rent Schedule
Current*:
Bump 2021:
Option 1:
Monthly
$5,948.75
$6,251.12
$7,196.06
PSF
$20.46
$21.50
$24.75
Tenant Recapture
Annual
$71,385.00
$75,013.50
$86,352.75
Headquarter:
# of Total Locations:
Corporate:
GLA:
Tenant Since:
Current Term Start:
Lease Expiration:
Rental Bumps:
Options:
Exclusive Use:
Co-Tenancy:
Other Termination Clause:
Benicia, CA
137+/-
Cycle Gear, Inc.
3,489
2013
07/01/2018
06/30/2024
07/01/2021
(1) 5-Yr.
Motorcycle Parts &
Accessories
None
None
Tenant Lease Abstract
Common Area Maintenance:
CAP on CAM:
Insurance:
Real Estate Taxes:
Management Fee:
Pro Rata Share
105% Over Previous Year’s
Controllable CAM Expenses,
Excluding Snow Removal
Pro Rata Share
Pro Rata Share
Pro Rata Share
* Tenant in process of signing a 6-year renewal (shown above).

18
Qdoba Mexican Grill is a chain of fast casual restaurants in the United States and Canada serving Mexican-style cuisine. The company is a wholly owned subsidiary of Jack in the Box (NASDAQ: JACK). The company features bold and distinctive décor to create an enjoyable atmosphere to compliment the food itself. The restaurant offers flavor without compromise, the ability to add guac and queso, at no extra charge to the new creations, old classics, and the ability to create a masterpiece. The guac is hand-smashed daily, pico de gallo made fresh, savory meats and veggies flame-grilled right in front of customers each and every day.
www.qdoba.com
Source: www.qdoba.com
Tenant Base Rent Schedule
Current*:
Bump 2018:
Option 1:
Option 2:
Option 3:
Monthly
$5,248.50
$5,493.60
$6,153.05
$6,890.62
$7,719.02
PSF
$28.89
$30.24
$33.87
$37.93
$42.49
Tenant Recapture
Annual
$62,982.00
$65,923.20
$73,836.60
$82,687.40
$92,628.20
Headquarter:
# of Total Locations:
Guaranty:
Ticker Symbol:
GLA:
Tenant Since:
Current Term Start:
Lease Expiration:
Rental Bumps:
Options to Extend:
Exclusive Use:
Co-Tenancy:
Other Termination Clause:
San Diego, CA
730+/- in 47 States
Jack in the Box Inc.
NASDAQ: JACK
2,180
2013
07/22/2013
07/31/2023
08/01/2018
(3) 5-Yr.
Fast-Casual Mexican
None
None
Tenant Lease Abstract
Common Area Maintenance:
CAP on CAM:
Insurance:
Real Estate Taxes:
Admin. Fee:
Pro Rata Share
105% Over Previous Year’s
CAM Expenses, Excluding
Snow/Ice Removal, Utilities
& Admin. Fee
Pro Rata Share
Pro Rata Share
15% on CAM & Ins.
* Blended current rental rate for increase effective 8/1/2018. Pro Forma Calendar Year based on March 1, 2018 through February 28, 2019.

19
DISCLOSURE, CONFIDENTIALITY & DISCLAIMER
CONFIDENTIALITY AGREEMENT DISCLOSURE & DISCLAIMER The information within this Offering Memorandum will set forth an understanding regarding the relationship between the Recipient of this package (the “Recipient”) and The Cooper Group and the confidentiality of the investment information to be supplied to you and your organization for use in considering, evaluating and/or purchasing this property (the “Property”). The recipient acknowledges that all financial, contractual, marketing, and informational materials including but not limited to lease information, occupancy information, financial information, projections, data information and any other similar information provided by The Cooper Group which relates to the Property (collectively, the Confidential Information), whether said information was transmitted orally, in print, in writing or by electronic media is confidential in nature and is not to be copied or disseminated to any party without the prior consent of The Cooper Group. The Recipient acknowledges and agrees that the Confidential Information is of such a confidential nature that severe monetary damage could result from dissemination of that information to unauthorized individuals. The Recipient shall limit access to the Confidential Information to those individuals in the Recipient’s organization with a “need to know” and shall take all precautions reasonably necessary to protect the confidentiality of the Confidential Information. The Recipient acknowledges and agrees that the Confidential Information and any copies thereof are the property of The Cooper Group that all such information will be returned to The Cooper Group upon written request. Any offers or inquiries from Recipient in connection with this investment proposal shall be forwarded, confidential, to The Cooper Group. Other than The Cooper Group, the Recipient agrees that neither Recipient nor The Cooper Group shall be obligated to pay any procuring broker fees in connection with this investment unless a separate written Brokerage Agreement is entered into and written acknowledgement of any procuring Brokerage Agreement is received from all parties to the investment transaction. Procuring brokers must provide written introductions of potential investors and receive written acknowledgment from The Cooper Group for representation to be rec-ognized. This is a confidential Memorandum intended solely for your limited use and benefit in determining whether you desire to express further interest in the acquisition of the Property.
The Memorandum contains selected information pertaining to the property and does not purport to be a representation of the state of affairs of the Property or the owner of the Property, to be all-inclusive or to contain all or part of the information which perspective Recipients may require to evaluate the purchase of real property. All financial projections and information are provided for general reference purposes only and are based on assumptions relating to the general economy, market conditions, competition and other factors beyond the control of the owner or The Cooper Group. All references disclosed herein related to acreage, square footages and/or other measurements may be approximations and the best information available. The summaries of information included herein do not purport to be complete nor necessarily accurate descriptions of the full agreements referenced. Photos herein are the Property and respective owners and use of these images without the express written consent of the owner is prohibited. The owner and the Cooper Group expressly reserve the right, at its sole discretion, to reject any or all expressions of interest or offers to purchase the Property, and/or terminate discussions with any entity and any time with or without notice which may arise as a result of review of this Memorandum. Neither the owner or the Cooper Group, nor any of their respective directors, officers, affiliates or representatives make any representation or warranty, expressed or implied, as to the accuracy or completeness of this Memorandum or its contents; and you are to rely solely on your investigators and inspections of the property in evaluating a possible purchase of the Property. The information contained in this document has been obtained from sources to be reliable. While the Cooper Group does not doubt its accuracy, the Cooper Group has not verified it and makes no guarantee, warranty or representation about it. It is your responsibility to independently confirm the accuracy and completeness. Any projections, opinions, assumptions or estimates used are for example only and do not represent the current or future performance of the Property. The value of this transaction to you depends on tax and other factors which should be evaluated by your tax, financial and legal advisors.

Cooper Commercial Investment Group 6120 Parkland Blvd., Suite 206 Cleveland, OH 44124 www.coopergrp.com
Dan Cooper [email protected] (888) 525-5695 x12
Bob Havasi [email protected] (888) 525-5695 x10