danish
DESCRIPTION
TRANSCRIPT

Danish Capitalism and the Global Challenges -
Seminar on Danish Welfare and Economy, April 11th, 2011
Martin Jes IversenAssociate professor
Centre for Business HistoryCopenhagen Business School
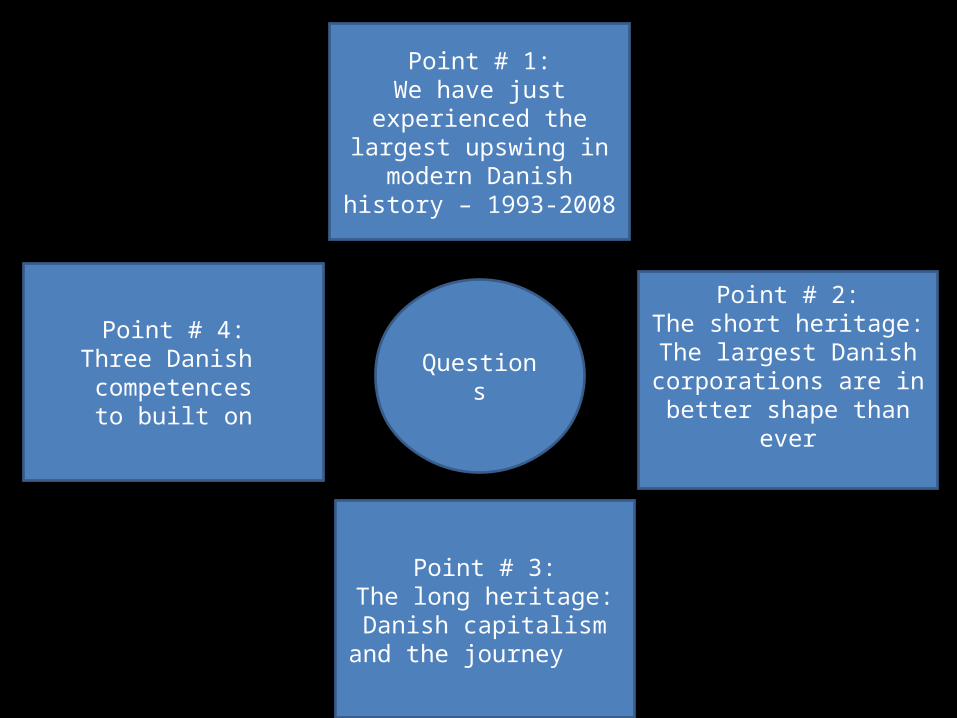
Point # 1:We have just experienced the largest upswing in modern Danish history –
1993-2008
Point # 2:The short heritage:The largest Danish
corporations are in better shape than ever
Questions
Point # 4:Three Danish competencesto built on
Point # 3:The long heritage:
Danish capitalism and the journey

Growing foreign demand =Export companies’ growth
Growing public demandProblem:
State budget deficit302 billion. DKK. / 18 % of
BNP(2009)
Growing domesticprivate demand
Problem:Private debt:
2001 239 billion DKK.2005 351 billion DKK.2008 566 billion DKK.
The Danish upswing – 1993-2008 (long)Approx. 400.000 new jobs (deep)
The three large demand factors (broad)
Public sector jobs:1993 796.0002008 838.0002010 860.000
Private sector jobs:1993 1.77 mil.2008 2.12 mil. 2010 1.94 mil.

New record balance of payment surplus: 93.6 billion DKK. in 2010 (only Maersk Line contributed with approx. 20%)
Point # 2:The short heritage:The largest Danish
corporations are in better shape than ever
Top 10 Danish Companies in 2009 (by revenue, billion DKK)
Sector: Company: 1994 2006 2009 2010 Foundation Year
Shipping A.P. Moller - Maersk 72,5 264,6 260,0 313,0 1904
Office Services ISS Holding 17,6 55,8 69,0 73,0 1901
Brewery Carlsberg 20,9 41,1 59,4 62,2 1847
Pharmaceutical Novo Nordisk 16,8 38,7 51,1 60,8 1923
Windmills Vestas Wind Systems 1,2 31,3 38,1 51,9 1898
Top 5 Total Revenue 128,95 431,54 477,61 560,97
DK GDP 1242 1631,66 1656,11 1740,8
Top 5 Companies in 2009 in % of GDP 10,4 26,4 28,8 32,2

Point # 3:The long heritage:
Danish capitalism and itshistorical roots
Creating Nordic Capitalism
Pan-Scandinavian textbook projectEditors:Susanna Fellman (Helsinki University)Martin Jes Iversen (CBS)Hans Sjögren (Stockholm School of Economics)Lars Thue (BI Oslo)


The Danish princess Margrethe in 1962
“Archeologist” metaphor:Defining layers of the past
Cases
Cases
Cases
Cases

Four phases of capitalism in Nordic region
1850s-1880s: Early liberal capitalism
1890s-1920s:Organized capitalism
1930s-1970s:Welfare capitalism
1980s-Market based capitalism
Weak states, liberal marketsSMEs, economic periphery
More active states, organized labour markets cartelization and export
Triangle of welfare states, org. labour and industries, “mixed economies”
Economic integration, strong stateemphasize on markets capitalism

Two fundamental problems with this conclusion:
These phases do not explain change
These four phases reflect changes in most West European economies

1980s-Market based capitalism
1930s-1970s:Welfare capitalism
1890s-1920s:Organized capitalism
1850s-1880s: Early liberal capitalism
Formative periods:“... internaland external pressuresacting on the established economicstructure”

1980s-Common Market
1930s-1970s:Plan economy
1890s-1920s:Cartelized economy
1850s-1880s: Bazaar economy
Ideological dimension of democratic movementLiberal Trade Acts:Norway (1839)Sweden (1848)Denmark (1857)Finland (1864)
Need for market order1) Cartels2) More active states3) Unions:LO Sweden (1898)LO Denmark (1898)LO Norway (1899)SAK Finland (1907)
Ideologically grounded response to The Great Depression1) State regulation of markets2) Social welfare policies3) National left-right compromises:Denmark (1933)4) Social Democratic dominans:Norway (1935-1965)Sweden (1936-1976)
Ideologically groundedresponse to the 1970s crises:1) Market based reforms2) Economic integration3) Opening of the economies4) Right wing governments:Norway (1981)Denmark (1982)Sweden (1991)
Important Danish industries controlled by one company or trust by 1908 The Sugar IndustryThe Bottle Glass IndustryThe Paper IndustryThe Cotton MillsThe Breweries
1982 1986 1992 1999 2008
Denmark 2,35 2,84 10,86 29,51 56,12
Finland 1,28 3,23 7,77 25,88 42,21
Norway 1,00 2,08 9,20 18,75 38,00
Sweden 5,41 11,45 18,25 41,33 66,41
Germany 6,12 7,71 8,65 19,29 39,73
FDI Stock, Outwards as % of GDP

Formative phases inScandinavian capitalism
Focus on State-company relationsin terms of changingmarket formation
The State
The Financial System
Education andTraining
The LabourMarket
The Company

Combining Economic Integration and Economic Sociology
To bridge two contrasting market perceptions:1)Integration economists: competition as the main driver for economic efficiency (Treaty of Rome)
2) Economic sociologists focuses on ”The Architecture of Markets”

Market Formation:Competition & Regulation
Plan economy Public regulation Common market
Restricted
Private regulation
Competitive
Cartel economy Bazaar economy

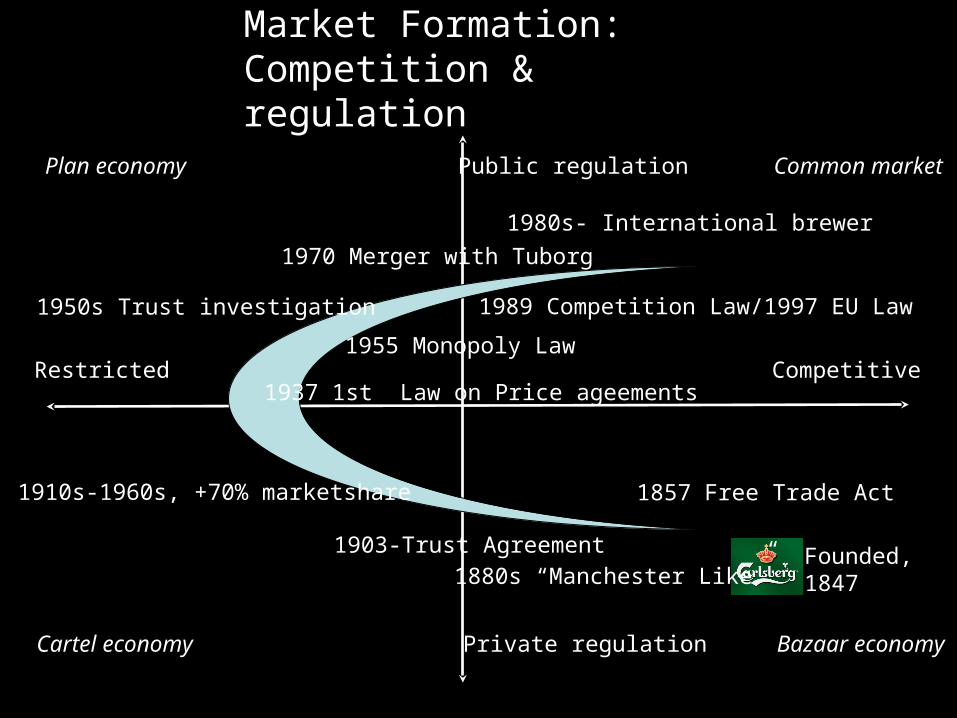
Market Formation:Competition & regulation
Plan economy Public regulation Common market
Restricted
Private regulation
Competitive
Cartel economy Bazaar economy
1850s1890s
1930s
1980s

1850s 1890s 1930s 1980s
The changing market structure, Denmark 1850-2000
CompetitionLaws
1857Free Trade ActProhibition ofthe guild systempure negative econom. integration
19121st competitionregulation proposal
19371st law againstprice agreementsincluding registrat.and publication ofprice agreements
1955Monopoly LawMonopoly Councilwhich registered allmonopolies and approved prices
1989Law on competitionbased on the control of efficient markets1997 - EU changes
1847-1890sExpanding on the Danish beer market. 1st industrial brewerLoosing market shares butalso early export
1903-1970Trust agreement with the competitor“Tuborg”. Constant + 70 % of Danishmarket = monopoly-investigationsExport breakthrough
1970-2000Sales international:1970: 24% 1980: 60%2000: 90%1988 Danish beer cartel abolished (1899-1988)
Market Formation:Competition & regulation
Plan economy Public regulation Common market
Restricted
Private regulation
Competitive
Cartel economy Bazaar economy
1857 Free Trade Act
1989 Competition Law/1997 EU Law
1937 1st Law on Price ageements
1955 Monopoly Law
1903-Trust Agreement1880s “Manchester Like”
1950s Trust investigation
1970 Merger with Tuborg
1980s- International brewer
1910s-1960s, +70% marketshare
Founded, 1847

New record balance of payment surplus: 93.6 billion DKK. in 2010 (only Maersk Line contributed with approx. 20%)
Point # 2:The short heritage:The largest Danish
corporations are in better shape than ever
Top 10 Danish Companies in 2009 (by revenue, billion DKK)
Sector: Company: 1994 2006 2009 2010 Foundation Year
Shipping A.P. Moller - Maersk 72,5 264,6 260,0 313,0 1904
Office Services ISS Holding 17,6 55,8 69,0 73,0 1901
Brewery Carlsberg 20,9 41,1 59,4 62,2 1847
Pharmaceutical Novo Nordisk 16,8 38,7 51,1 60,8 1923
Windmills Vestas Wind Systems 1,2 31,3 38,1 51,9 1898
Top 5 Total Revenue 128,95 431,54 477,61 560,97
DK GDP 1242 1631,66 1656,11 1740,8
Top 5 Companies in 2009 in % of GDP 10,4 26,4 28,8 32,2

Point # 4:Three Danish competences
to built on:1)”Hidden champions”2)New private jobs
3)From industrial pol. to Innovation policy
1) ”Hidden Champions” in Denmark:Cases: From A.P: Møller-Mærsk til Logstor RørHow can the private succes be transformedto new Danish privatejobs?
2) New private jobs Schlüters recipe in 1982: Focus on private growthHow?! = From public services to private servicesInnovation policy
3) The frequency of innovation depends on the knowledge Level in the society-

The Creative Response in Economic History (1947):
”the doing of new thingsor the doing of things that are already been done in a new way (innovation)”
”… it can always be understoodex post but it can practicallynever be understood ex ante ...cannot be predicted”
The frequency of innovationdepends on:a)the quality of personnelavailable in societyb)the relative quality comparedto others at the same timec)Individual decisions, actions,and patterns of behaviour
The quality of our innovation depends on our educational competencies
Schumpeter,innovation &education

Questions