dar es salaam, january 2010 - ircwash.org point mapping: the experience of snv tanzania i january...
TRANSCRIPT
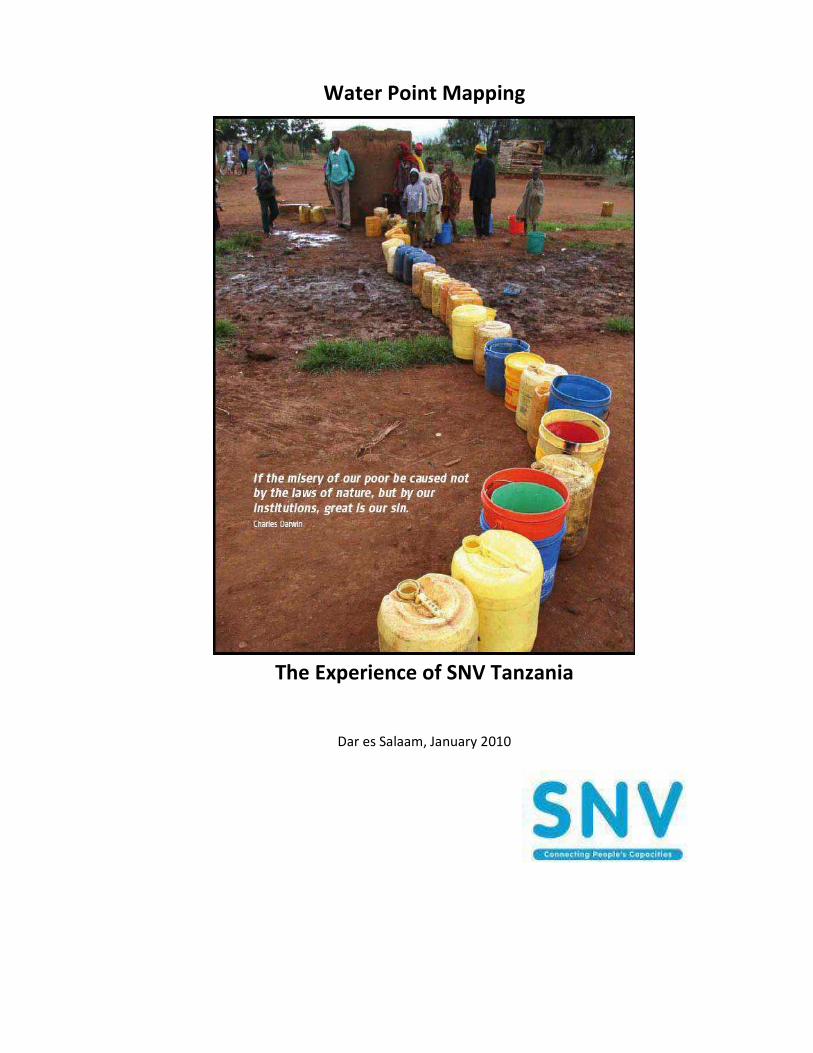
Water Point Mapping
The Experience of SNV Tanzania
Dar es Salaam, January 2010
Water Point Mapping: The Experience of SNV Tanzania i
January 2010
Water Point Mapping
The Experience of SNV Tanzania
Dar es Salaam, January 2010
Cover Photo:
Water Point Mapping: The Experience of SNV Tanzania ii
January 2010
Table of Contents
1 Introduction.................................................................................................................................... 1
2 Demonstration of Data Analysis and Presentation .......................................................... 2
3 Findings from the Validation and Inquiry Process ........................................................... 9
4 Conclusions ...................................................................................................................................14
Appendix 1: Glossary of Terms......................................................................................................15
Appendix 2: Interpretation of Data..............................................................................................16
Appendix 3: WPM Data Entry Form .............................................................................................17
Appendix 4: Water Point Mapping Data Sheet.........................................................................18
Water Point Mapping: The Experience of SNV Tanzania 1
January 2010
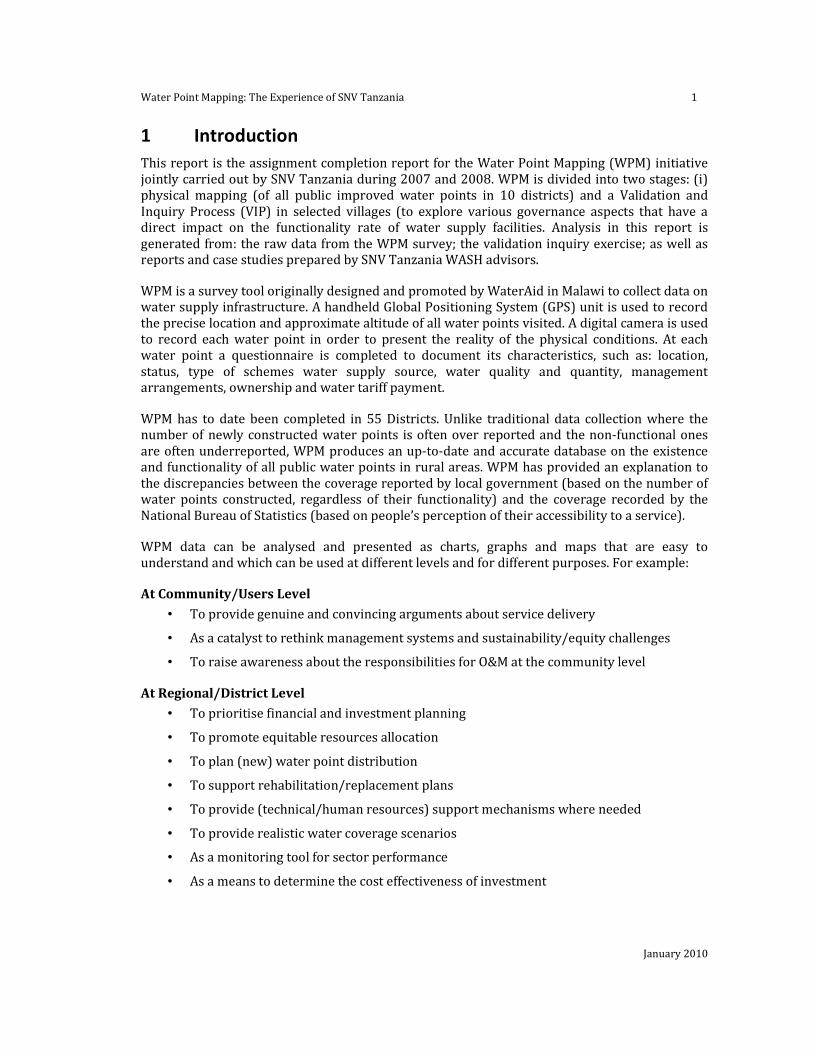
1 Introduction
This report is the assignment completion report for the Water Point Mapping (WPM) initiative
jointly carried out by SNV Tanzania during 2007 and 2008. WPM is divided into two stages: (i)
physical mapping (of all public improved water points in 10 districts) and a Validation and
Inquiry Process (VIP) in selected villages (to explore various governance aspects that have a direct impact on the functionality rate of water supply facilities. Analysis in this report is
generated from: the raw data from the WPM survey; the validation inquiry exercise; as well as reports and case studies prepared by SNV Tanzania WASH advisors.
WPM is a survey tool originally designed and promoted by WaterAid in Malawi to collect data on water supply infrastructure. A handheld Global Positioning System (GPS) unit is used to record
the precise location and approximate altitude of all water points visited. A digital camera is used
to record each water point in order to present the reality of the physical conditions. At each
water point a questionnaire is completed to document its characteristics, such as: location,
status, type of schemes water supply source, water quality and quantity, management arrangements, ownership and water tariff payment.
WPM has to date been completed in 55 Districts. Unlike traditional data collection where the number of newly constructed water points is often over reported and the non-functional ones
are often underreported, WPM produces an up-to-date and accurate database on the existence and functionality of all public water points in rural areas. WPM has provided an explanation to
the discrepancies between the coverage reported by local government (based on the number of water points constructed, regardless of their functionality) and the coverage recorded by the
National Bureau of Statistics (based on people’s perception of their accessibility to a service).
WPM data can be analysed and presented as charts, graphs and maps that are easy to
understand and which can be used at different levels and for different purposes. For example:
At Community/Users Level
• To provide genuine and convincing arguments about service delivery
• As a catalyst to rethink management systems and sustainability/equity challenges
• To raise awareness about the responsibilities for O&M at the community level
At Regional/District Level
• To prioritise financial and investment planning
• To promote equitable resources allocation
• To plan (new) water point distribution
• To support rehabilitation/replacement plans
• To provide (technical/human resources) support mechanisms where needed
• To provide realistic water coverage scenarios
• As a monitoring tool for sector performance
• As a means to determine the cost effectiveness of investment
Water Point Mapping: The Experience of SNV Tanzania 2
January 2010
At National Level
• To influence/adjust national policies and strategies
• As a realistic insight into sector performance
• As an opportunity to get governance issues on the table
• As an input for equitable resource allocation and informed decision-making
• To prioritise financial and investment planning
• To support national monitoring
• To track MKUKUTA/MDG achievements
• As a means to set sector priorities and targets
• As indicators for sector performance monitoring
Some limitations of Water Point Mapping would include:
• Water quality data collected by WPM is based on subjective judgement (colour,
taste, smell or visibility of TSS) and not on laboratory analysis;
• Population figures are from the Population Census of 2002 whereas most WPM was
was carried out in 2007 and 2008
• WPM only counts public water points. In areas with a high percentage of private
connections the coverage reported by WPM can be misleading.
2 Demonstration of Data Analysis and Presentation
This section demonstrates how WPM data can be analysed and utilised for different purposes.
The data collected by SNV from 10 districts (Table 1) shows that 2,620 water points (or 43%)
are for various reasons not functional.
Table 1: Water Point Status in 10 Districts
As per official criteria, one water point provides water to 250 people. Thus in the table above
655,000 (2,620 x 250) people are in practice not served due to non- functioning water points.
District Total WPs Functional WPs Non Functional WPs
Mvomero 549 318 58% 42% 231
Maswa 540 367 68% 32% 173
Longido 229 147 64% 36% 82
Muleba 502 176 35% 65% 326
Morogoro 161 27 17% 83% 134
Bukoba 568 316 56% 44% 252
Karatu 631 517 82% 18% 114
Magu 1087 482 44% 58% 605
Missenyi 533 221 41% 59% 312
Mwanga 1,309 918 70% 30% 391
Total 6,109 3,489 57% 43% 2,620
Water Point Mapping: The Experience of SNV Tanzania 3
January 2010
In addition to the overview of actual functionality information, the analysis of the data collected
also highlights comparison or correlation between:
• Functionality – Ownership / Management
• Functionality – Year of construction
• Functionality – Type of water point or extraction method
• Functionality – Mode of payment
• Coverage – Functionality vs. Non functionality
• Distribution of water points between Districts or Wards
The analysis can be illustrated in the form of diagram, chart or map that allow highly visualised and easy to compare and contrast as shown in the following examples.
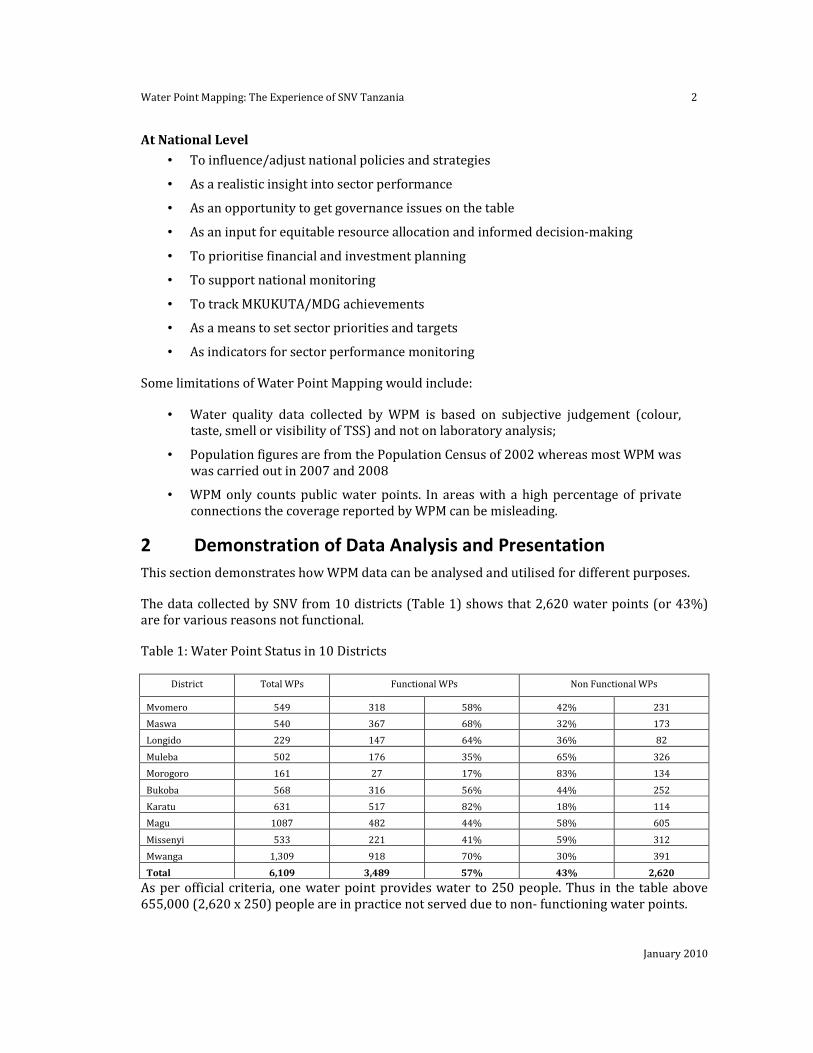
Figure 1: Functionality vs. Year of Construction
Mvomero: Year of Construction vs. Functionality
0
5
10
15
20
25
30
35
1961
1968
1970
1975
1978
1980
1982
1984
1986
1991
1993
1995
1997
1999
2002
2004
2006
Not known
Years of construction
No. of water point
Function
Need Repair
Not Function
Observations:
1. Only a few water schemes were constructed during the period of 1986-1995
2. Most water schemes constructed prior to 2005 are not functional
3. The number of water schemes constructed prior to 1988 (already working beyond their
design life of 20 years) and the number of non functional water points constructed after 1988, suggests that there is an urgent need for a rehabilitation/replacement plan.
Water Point Mapping: The Experience of SNV Tanzania 4
January 2010
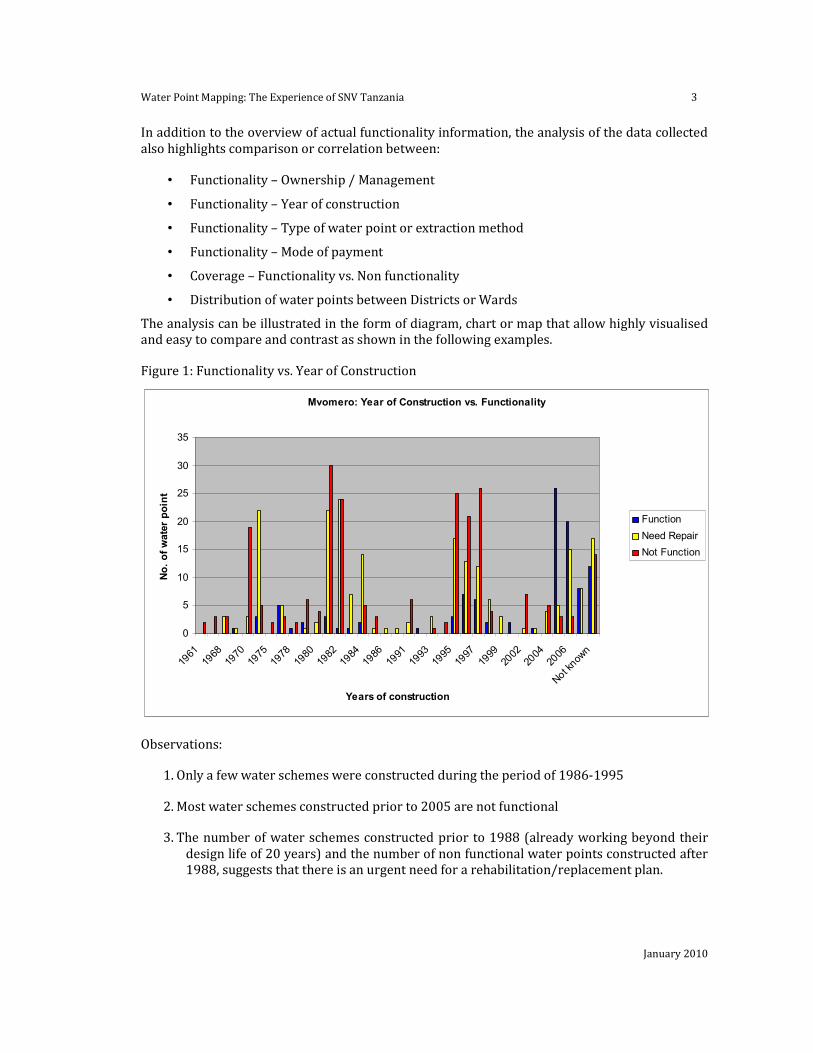
Figure 2: Functionality vs. Ownership and Management Models
Mvomero District : Manangement and Ownership vs. Functionality
0
20
40
60
80
100
120
140
160
180
Parastatal
Private
Water
Board
Parastatal
Private
Water
Board
Management Ownership
Functionality
Number of water point
Function
Need Repair
Not Function
Observations:
1. Ownership and management by government shows the highest non-functionality rates
while private ownership/management show higher functionality.
2. There is very private investment (=ownership) in water services and very few local
private companies have been hired to manage service provision.
3. Additional inquiry should be carried out to capture ‘the success story’ of the water boards
ownership and management structure
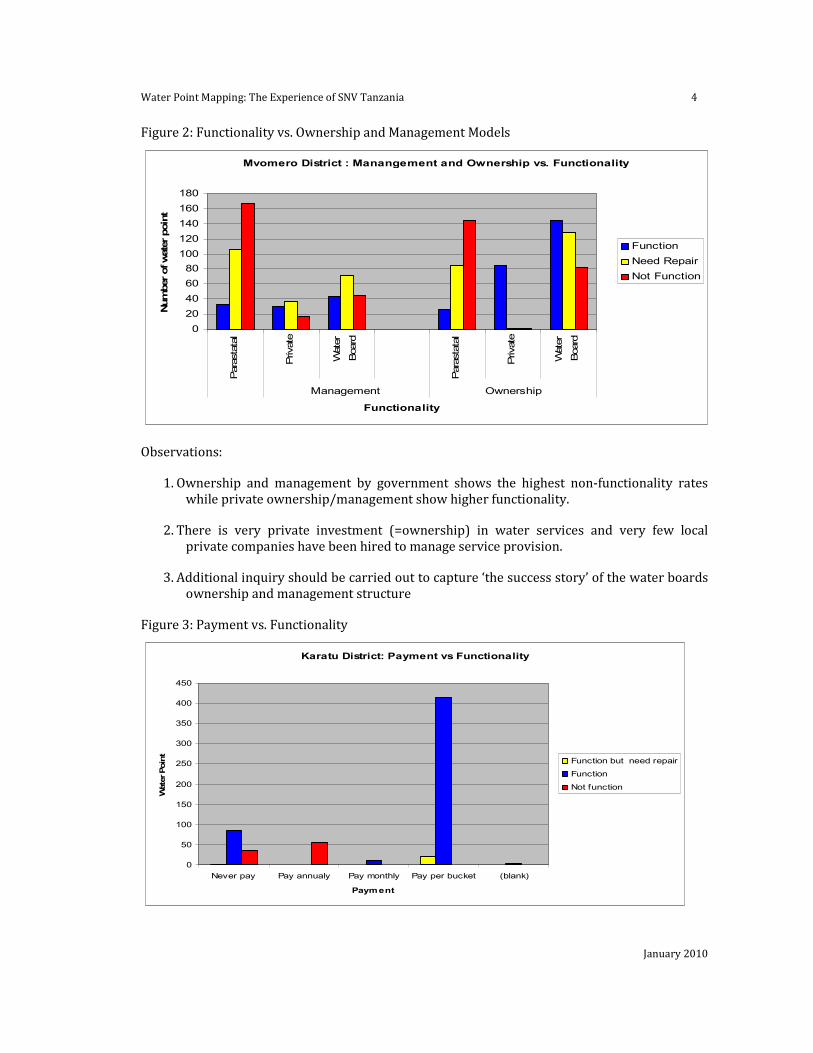
Figure 3: Payment vs. Functionality
Karatu District: Payment vs Functionality
0
50
100
150
200
250
300
350
400
450
Never pay Pay annualy Pay monthly Pay per bucket (blank)
Payment
Water Point
Function but need repair
Function
Not function
Water Point Mapping: The Experience of SNV Tanzania 5
January 2010
Figure 3 demonstrates that 100% of schemes where water users pay monthly or per bucket are
functional while only 60% of schemes are functioning where people never pay (of which almost half were newly built or less than 10 years old). On the other hand none of the schemes that
collect money annually are working.
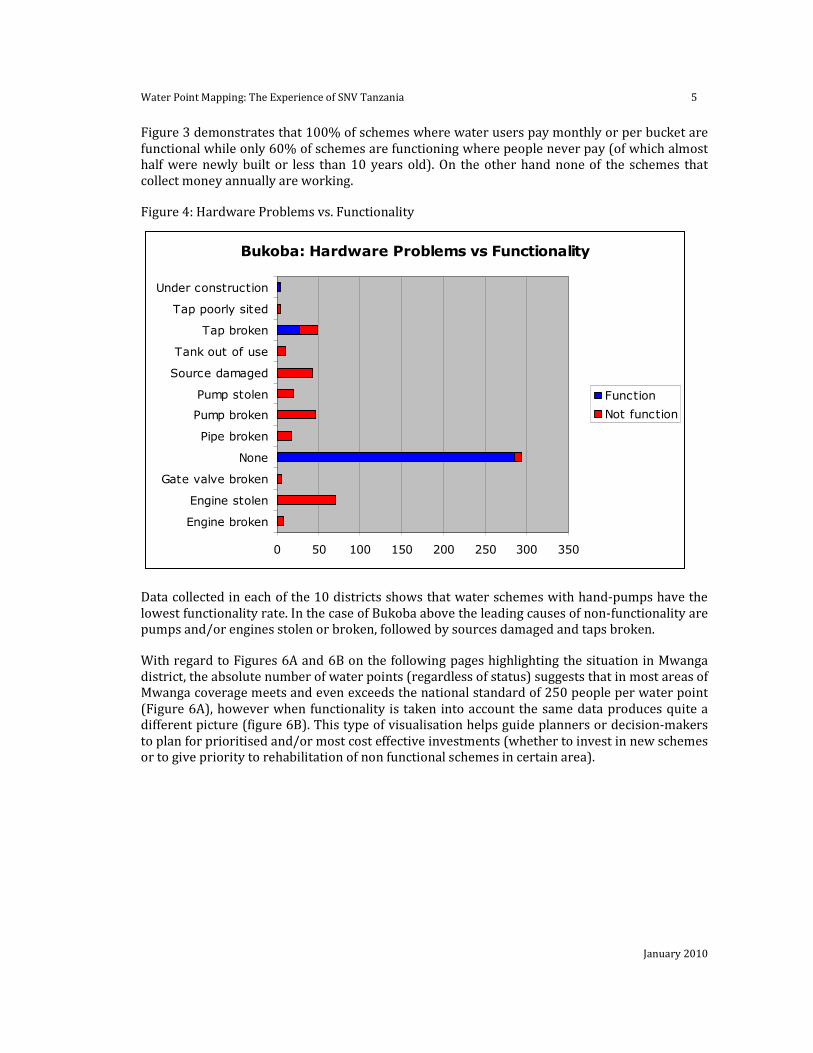
Figure 4: Hardware Problems vs. Functionality
Bukoba: Hardware Problems vs Functionality
0 50 100 150 200 250 300 350
Engine broken
Engine stolen
Gate valve broken
None
Pipe broken
Pump broken
Pump stolen
Source damaged
Tank out of use
Tap broken
Tap poorly sited
Under construction
Function
Not function
Data collected in each of the 10 districts shows that water schemes with hand-pumps have the
lowest functionality rate. In the case of Bukoba above the leading causes of non-functionality are pumps and/or engines stolen or broken, followed by sources damaged and taps broken.
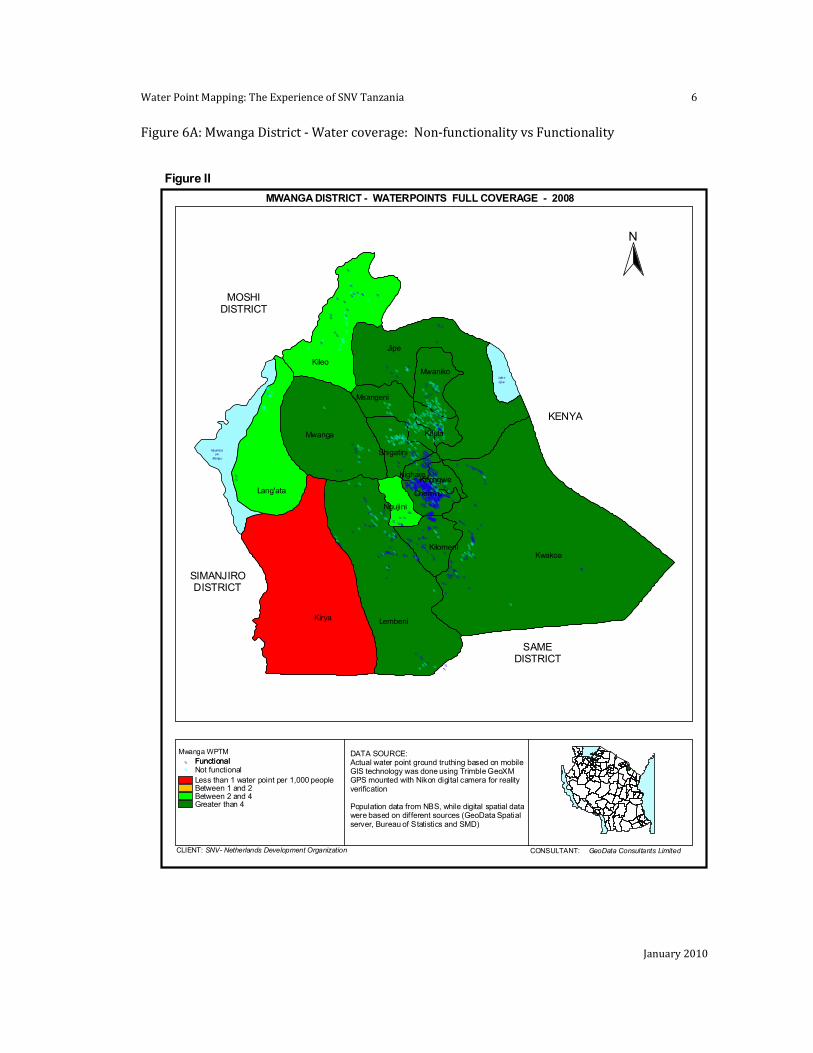
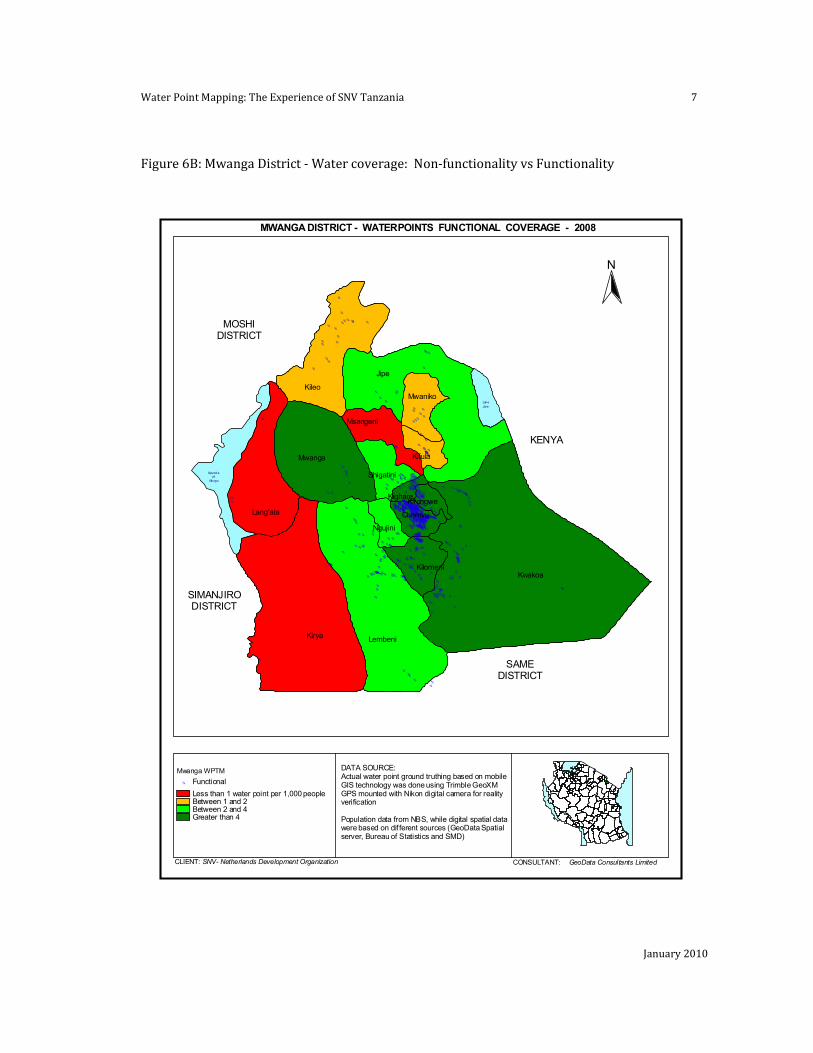
With regard to Figures 6A and 6B on the following pages highlighting the situation in Mwanga
district, the absolute number of water points (regardless of status) suggests that in most areas of Mwanga coverage meets and even exceeds the national standard of 250 people per water point
(Figure 6A), however when functionality is taken into account the same data produces quite a different picture (figure 6B). This type of visualisation helps guide planners or decision-makers
to plan for prioritised and/or most cost effective investments (whether to invest in new schemes or to give priority to rehabilitation of non functional schemes in certain area).
Water Point Mapping: The Experience of SNV Tanzania 6
January 2010
Figure 6A: Mwanga District - Water coverage: Non-functionality vs Functionality
Mwanga WPTM
Less than 1 water point per 1,000 peopleBetween 1 and 2 Between 2 and 4Greater than 4
FunctionalDATA SOURCE:Actual water point ground truthing based on mobileGIS technology was done using Trimble GeoXM GPS mounted with Nikon digital camera for realityverification
Population data from NBS, while digital spatial datawere based on different sources (GeoData Spatialserver, Bureau of Statistics and SMD)
CLIENT: CONSULTANT:SNV- Netherlands Development Organization GeoData Consultants Limited
KILOSADISTRICT
MWANGA DISTRICT - WATERPOINTS FULL COVERAGE - 2008
N
%%%%%
%%%%%%%%
%%
%
%%%%
%%%%%%%%%%%%%
%%%%%%
%%%%
%%%%%
%%%%%%%
%
%%%%%%%%
%%
%%
%%%%
%%%%%%%%%%%%%%%%%%%%%
%%%%%%%%%%%%%%%%%%%%%%%%%%%%%%%%%%%%%%%%%%%%%%%%%%%%%%%%%%%%%%%%%%%%%%
%%%%%%%%%%%%%%%%%%%%%%%%%%
%%%%%%%
%%%%%%%%%%%%%%%%%%%%%%%%%%%%%%%%%
%%%%%%%%%%%%%%%%%%%%% %%%%%%%
%
%%%%%%%%%%%%%%%%%%%%%%%%%%%%%%%%%%%%%%%%%%%%%%%%%%%%%%%%%%%%%%%%%%%%%%%%%%%%%%%%%%%%%%%%%%%%%%%%%%%%%%%%%%%%%
%%%%%%%%%%%%%%%%%%%%%%%%%%%%%%%%
%%%%%%%%%%%%%%%%%%%%%%%%%%
%%%%%%%%%%% %
%%%%%%
%%%%%%%%%%%%%%%%%%%%%%%%%%%%%%%%%%%%%%%%%%%%%%%%%%%%%%%%%%%%%%%%%%%%%%%%%%%%%%%%%%%%%%%%%%%%%%%%%%%%%%%%%%%%%%%%%%%%%%%%
%%%%%%%%%%%%%%%%%%%%%%%%%%%%%%%%%%%%%%%%
%%%%%%%%%%%%%%%% %%%%%%%%%%%%%%%%%%%%%
%%%%%%%%%%%%%%%%%% %%%%%%%%%%%%%%%%%%%%%%%%%%%%%%%%%%%%%%%%%%%%%%%%%%%%
%%%%%%%%%
%%%%%%%%%%%%%%%%%%%%%%%%%%
%
%
%%% %%%%%%%%
%%%%
%%
%%
%%
%%
%%%%%
% %%
%%
%%%%%%%%%%%
%%%%
%%%%%%%
%
%%
%
%%%%%%
%
%%%
%%
%%%%%%%%%%%%%%%%%%%%%%%%%%%%%%%%%%%%%%%%%%%%
%%%%% %%%%%%%
%%
%%%%
%
%%
%%%%%
%%
%%%%
% %
%%%
%
%
%%
%%%%%%%%%%%
%%%%
%%%%
%%%%%
%%%%%%%%%%%%%%%%%%%
%%%%%%%%
%%%%%%
%%%%%
%%%%%
%%%%%
%%%%%%%%%%%
%
%%%
%%
%%% %%%
%%%% %%
%%%%%%%%
%%
%
%%
%%
%%%%%%%%%
%%%%%%%%%
%%%%%%%%%%%
%%%%%%%%
%%%
%
%
%%%
%
%%
%%
%%%
%%%
%%
%
%% %%%%%
%
%%
%%%
%
%
%
%
%
%
%
%
%%%%%% %%%%
% %
%
%%%%
%
%%%%%
%%%%
% %%%%%%%%
%%%%%%%%%%%%%%%
%%%%
%%%
%
%%
%%
% %%%%%%%%%%%%%%%%
%%
%
%%
%%%%%%
%
%
%%%
%%%
%
%
%%%%%%
%
%%
%
%%
%
%
%%%%%%
%%
%%%
%
%
%%%
%
%
%%
%% %%
%%%
%
%%
%%%%%%%%%% %
%%%
%%%%%%%
%%
%
%
%%%%%
%%%
%%%%%%
%%%
%%
%%%%%
%%%%
%%%%%%%%%%%%
Kwakoa
Kirya
Jipe
Lembeni
Kileo
Mwanga
Lang'ata
Kilomeni
Mwaniko
Msangeni
Shigatini
Kifula
Ngujini
Chomvu
KirongweKighare
Nyumba ya
Mungu
Lak e
Jipe
SIMANJIRODISTRICT
MOSHIDISTRICT
KENYA
SAMEDISTRICT
Figure II
FunctionalNot functional
%
%
Water Point Mapping: The Experience of SNV Tanzania 7
January 2010
Figure 6B: Mwanga District - Water coverage: Non-functionality vs Functionality
Mwanga WPTM
Less than 1 water point per 1,000 peopleBetween 1 and 2 Between 2 and 4Greater than 4
Functional
DATA SOURCE:Actual water point ground truthing based on mobileGIS technology was done using Trimble GeoXM GPS mounted with Nikon digital camera for realityverification
Population data from NBS, while digital spatial datawere based on dif ferent sources (GeoData Spatialserver, Bureau of Statistics and SMD)
CLIENT: CONSULTANT:SNV- Netherlands Development Organization GeoData Consultants Limited
KILOSADISTRICT
MWANGA DISTRICT - WATERPOINTS FUNCTIONAL COVERAGE - 2008
N
%%
%%%
%%%
%
%
%%
%%
%%%%
%%%%%%%%%%%%%%%%%%%%
%%%%%%%%%%%%%%%%%%%%%%%%%%%%%%%%%%%%%%%%%%%%%%%%%%%%%%%%%%%%%%%%%%%%%%%%%%%%%%%%%%%%%%%%
%%%%%%%
%%%%%%%%%%%%%%%%%%%%%%%%%
%%%%%%%%%%%%%%%%%%%%% %%%%%%%
%
%%%%%%%%%%%%%%%%%%%%%%%%%%%%%%%%%%%%%%%%%%%%%%%%%%%%%%%%%%%%%%
%%%%%%%%%%%%%%%%%%%%%%%%%%%%%%%%%%%%%%%%
%%%%%%%%%%%%%%%%%%%%%%%%%%%%%%%%
%%%%%%%%%%%%%%%%%%%%%%%%%%
%%%%%%%%%% %
%%%%%%
%%%%%%%%%%%%%%%%%%%%%%%%%%%%%%%%%%%%%%%%%%%%%%%%%%%%%%%%%%%%%%%%%%%%%%%%%%%%%%%%%%%%%%%%%%%%%%%%%%%%%%%%%%%%%%%%
%%%%%%%%%%%%%%%%%%%%%%%%%%%%%%%%%%%%%%%%
%%%%%%%%%%%%%% %%%%%%%%%%%%%%%%%%%%
%%%%%%%%%%%%%%%%%% %%%%%%%%%%%%%%%%%%%%%%%%%%%%%%%%%%%%%%%%%%%%%%%%%%
%%%%%%%%%
%%%%%%%%%%%%%%%%%%%%%%%%
%
%
%% %%%%%
%%%
%%%
%%
%
%
%%
%%
%
%%%
%%
%%%%%%%%%%%%%%%%%%%%%%%%%%%%%%%%%%%%%%%%%
%%%
%%%%% %%
%%%
%%%%
%
%%
%%%%%
%%
%%%%
% %
%%%
%
%% %%%%%%
%%%%%
%%%%
%%%
%%%%%%%%%%%
%%%%%%%%
%%%%%%
%%%%%%
%
%%%
% %%
%
%%%%%
%
%%%
%%%%%%%%%%%%%%%%
%%%%%%%%%%
%%%%%
%%
%
%
%%
%%
%
%%%
%
%%
%%
%
%
%
%
%
%
%
%
%%%%%% %%%
% %
%
%%%%
%
%%%%%
%%% %
%
%%%%%%%%%%
%%%%
%%%
%
%%
%%
% %%%%%%%%%%%%%%
%%
%
%
%%%
%
%
%%
%% %
%
%
%
%%
%%%%
%%%%%%%%%%%%
Kwakoa
Kirya
Jipe
Lembeni
Kileo
Mwanga
Lang'ata
Kilomeni
Mwaniko
Msangeni
Shigatini
Kifula
Ngujini
Chomvu
KirongweKighare
Nyumba ya
Mungu
Lake
Jipe
SIMANJIRODISTRICT
MOSHIDISTRICT
KENYA
SAMEDISTRICT
Figure II
%
Water Point Mapping: The Experience of SNV Tanzania 8
January 2010
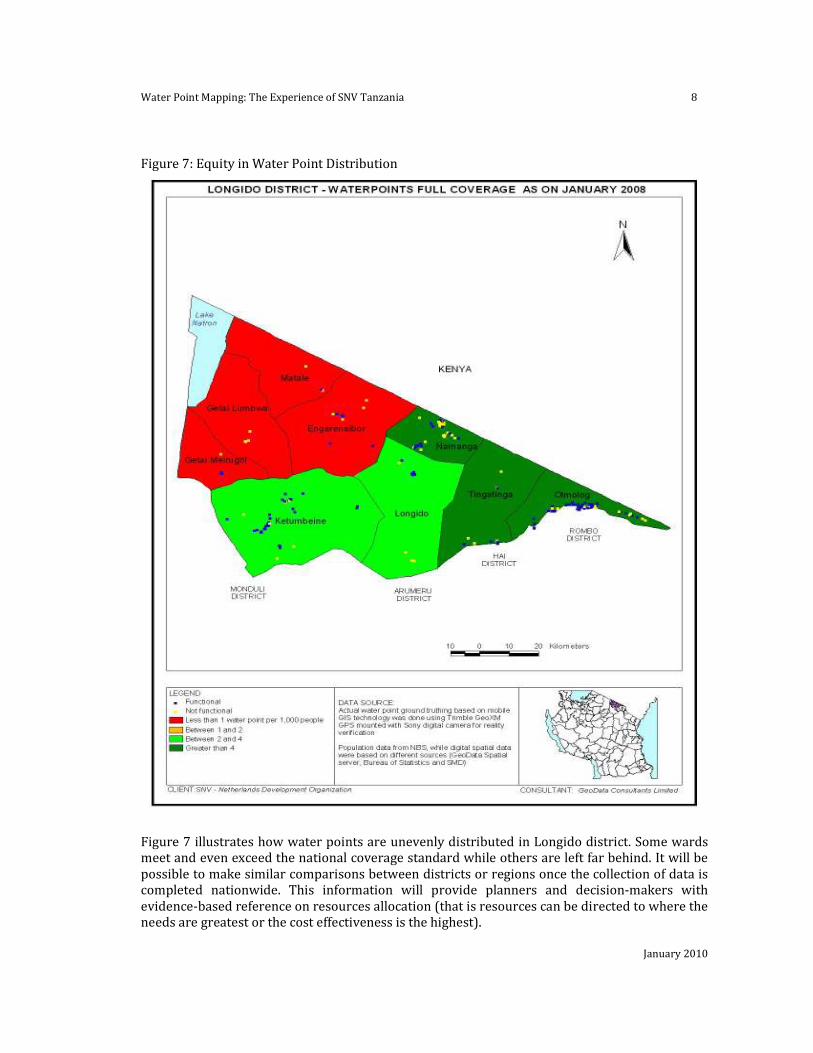
Figure 7: Equity in Water Point Distribution
Figure 7 illustrates how water points are unevenly distributed in Longido district. Some wards meet and even exceed the national coverage standard while others are left far behind. It will be
possible to make similar comparisons between districts or regions once the collection of data is completed nationwide. This information will provide planners and decision-makers with
evidence-based reference on resources allocation (that is resources can be directed to where the needs are greatest or the cost effectiveness is the highest).

Water Point Mapping: The Experience of SNV Tanzania 9
January 2010
3 Findings from the Validation and Inquiry Process
The VIP was carried out by SNV in selected villages after the physical mapping in each district
was completed. The VIP uses participatory techniques (focus group discussions, interviewing
key informants, stakeholders meetings and analysis) and positive inquiry in an attempt to
acquire an in-depth understanding of the reasons behind success stories; the underlying causes of non-functionality and low coverage in some districts.
Data collected from WPM in 10 districts showed that 43% of water points are not functioning and some water points are no longer functioning less than two years after construction. The
causes of non-functionality identified during in-depth inquiries with different target groups, are:
Ownership and Participation of Water Users
Although the National Water Policy (NAWAPO 2002) clearly indicates that “communities take
the lead in developing their water supply facilities and be fully responsible for the O&M of their
schemes”, findings from the VIP exercise however showed that communities had very little
knowledge about this change and the majority of people interviewed still strongly believed that
water schemes belonged to the government and it was the government’s responsibility to
provide water services to its citizens. People often associated names of the water points with the
names of the funding agencies and did not perceive that the schemes were under their
ownership. Water at public water points is generally free for all and is often used wastefully and
irresponsibly, there is no rules or regulations that impose fines or sanction on wrong-doing, as a
result, there is high incidence of water pumps being stolen or water points being vandalised.
In most villages visited, communities were not fully involved in and/or informed of the planning
process of the water point development. Water points are often constructed and handed over to
the community either by the government or donor organisations without a clear plan or
arrangement of how the water points would be managed or maintained. Many water users do not understand their roles and responsibilities and that of other key stakeholders (for example
district water engineers and village water committee members) in water services delivery.
When a water point breaks down, communities do not know what to do or where to seek
support and these water points are often subsequently abandoned.
Although the burden of fetching water falls on women and children, decision-making at village
meetings is taken by men who attend the meetings and more often than not, investment for
water point development or rehabilitation is not a priority. At Kilago ward in a group discussion
around a non-functional water point, one man pointed out “I did not know the water point is not
functioning due to such a small problem because I never fetch water, that’s women’s business”.
Financial Issues
Findings from the VIP survey showed that water users’ willingness to pay for water services
depends on various factors, including:
• Habitual Reliance on Government: contrary to the national policy of 2002, that clearly
states the Government is a regulator/facilitator and no longer the service provider, the
mindset of “water is free” or “the government is responsible for the provision of water
services” still exist in many villages and people refuse to pay for water services and are
still waiting passively for the government to come and resolve their problems. Politicians
often worsened the situation with promises to provide free water for all.
Water Point Mapping: The Experience of SNV Tanzania 10
January 2010
• Unwillingness to pay for water services if alternative water sources (from river, dam or
streams) are available even though they are unprotected or unsafe for drinking. People
do not see a link between safe water and health. The village chairman in Dakama ward
(Mawsa District) was adamant that the water was safe if it looked clean and he explained “you see what enters into our body through the mouth; the stomach has a mechanism to
process it. All the good stuff will be retained and all dirt will be ejected through the
normal channel. So there is no problem. This is how our ancestors lived and survived’’.
• Unwilling to pay for non-reliable services. Villagers complained that they had paid the
water tariff but did not get the services promised and decided to stop paying. This often
ran in a vicious circle: services deteriorated and people were less willing to pay, as the
result, there was no fund for O&M and the water service collapses.
• In some villages, where there was no service and no alternative water source; people
simply did not have any choice but to pay very expensively for (any) water.
Rational Tariff Setting
There were many different levels of water tariff at the villages/water points visited. At some the
water tariff has never been collected (in Bukoba District at 536 out of 568 water points people
never pay for water). Water is free but when water points breakdown, they are abandoned since there are no funds to repair or replace spare parts and nobody is responsible for this task. At
water points where a water tariff is applicable, there is generally no rationale for water tariff setting and water tariff and payment arrangements vary from village to village ranging from a
fixed amount per month or year per person or per household. In other cases the tariff is fixed per jerry can. In some instances, the water tariff is set just enough to cover operational costs
(fuel and minor repairs) with no excess set aside for major repairs or replacement. In others, people pay expensively and still do not get a proper service as the money collected is often used
for other purposes or simply for private gain. None of the village visited was able to show a
rough estimation of O&M costs for their water points and there is no correlation between actual O&M costs and the water tariff.
Cash Availability
In villages where the water tariff is collected irregularly (annually/when schemes fail), it was
reported that many rural households do not always have cash available in their home, the bill
collectors have to visit the same households many times for a very small amount of money.
Villages that apply pre-paid models do not experience this problem.
Transparency and Accountability
Many water users commented that although the water tariff was collected, they had no idea how
the money was spent. For example, at Tunapende water point in Kilago Ward in Kahama, the
community complained “we made contributions over several months and when we asked the
Treasurer to open a bank account, he left for town on the pretext of opening the account. When
he came back after two months he had a new bicycle and he never said anything about our
money”. The community has therefore decided not to make further contributions. Water users in many villages emphasised the need to ensure transparency and accountability of money
collected through the regular village meetings and/or financial reports to be published on the village notice board on the incomes and expenditures of water services. More specifically water
users interviewed reiterated that they would be more willing to pay if they:
Water Point Mapping: The Experience of SNV Tanzania 11
January 2010
• Understand why funds are required
• Are consulted/involved in the selection of operators and treasurers
• Are consulted/involved in setting water tariff and fund raising
• Agree on fine or sanction with defaulters or violators
• Have confidence in the people entrusted to handle money
• Are issued with receipts each time they pay
• Get regular reports on how money was collected/spent and for what purpose
• Know money is banked as soon as it is collected
• Can examine all financial records and these are kept open to public inspection
Family and Social Pressure
An issue raised by bill collectors was that due to social/family pressure, they cannot collect
money from their own relatives and cannot disconnect them from the service either. There was
a suggestion that the bill collectors should come from outside the village to avoid this problem.
Access to Banking Services
In many villages, there is expressed demand for the safe-keeping of the money collected. Surveys in Maswa and Kahama districts, especially from rural/remote areas revealed that the
community do not have easy access to a bank and it is too costly to operate a bank account at the district or regional headquarters - the bank is simply too far away from the villages; the services
are not “for the poor”, the procedures are too complicated, people have to pay commission to
deposit the money in the bank (in effect reducing the amount collected from water users). Some
villages have resorted to an informal financing system called “ifogongh’o” (a traditional local
revolving fund). This system is reported to work well for the purpose, but it is not formalised/recognised as a financing institution.
Investment Priority
Currently, resource allocation from central government to local government has not been
designed to reward good performers in maintaining high rates of functionality. At district level,
there is a general tendency (as has been observed in all 10 districts) to invest mainly (if not
only) on construction of new water points and little attention is paid to rehabilitation or
repairing of non-functioning water points.
Technical Issues
Reported technical reasons behind non-functional water points include:
• No concept of routine and preventive maintenance: during visits to non-functional water points, SNV advisors helped fix problems on the spot at over 500 water points that only
required minor repairs such as fixing taps/valves or clearing the intake that had been blocked by dead leaves/garbage

Water Point Mapping: The Experience of SNV Tanzania 12
January 2010
• Top down/supply driven planning resulting in technologies/services that are often too
complicated or not suitable to local context or what people want and/or can afford.
• Inappropriate or disproportionate distribution of water points: some areas have more
water points than needed, therefore if a water point breaks down, people do not need to
repair it, they just move to use another one. Meanwhile in some other areas, water points
are located so far away from residential areas that people never get there to fetch water -
these water points are often recorded as functional but have never been used.
• Most people assigned to be responsible for O&M do not have the right skills or technical
expertise or incentives to perform well. Qualified/trained staff tend to look for jobs elsewhere. Villages with high functionality usually have strong/active leadership.
• Spare-parts for hand-pumps: analysis indicates that water points with hand pumps
showed the lowest functionality rate however most hand-pump spare-parts are not
available locally and even if they are they are very expensive.
• With fast population growth and changing lifestyles that place greater demands on water
consumption, many boreholes become dry due to overexploitation
• It was reported that although funding was channelled from central government to local
government for construction of deep boreholes, some LGAs opted for shallow wells so
‘that they can make money’ (the average cost for a shallow well is approximately TZS 2
to 4 million while it costs about TZS 14 to 20 million for a deep borehole). On the other
hand many LGAs reasoned that funding from central government often arrived late and
under pressure to spend money quickly, most water schemes are constructed during the
rainy season (October- December) when the water table is high and there was no need
for deep boreholes: “we do not see any value from deep wells – when we most need
water in the dry season, they are equally dry so why should we invest our energy on
them”, quipped one villager in Isagaha ward, Kahama.
• Some schemes and water points are financed by private sources (including politicians in
their run-up for elections). These schemes do not follow any technical design or standard
and often break down soon after being constructed.
The case study of Lalago on the following page is a good example of how investments can be
wasted if the correct technology is not taken into consideration in the design of a water scheme.
Management Issues
Data collected from the 10 districts indicated that Village Water Committee are still by far the most popular management model for operating rural water schemes and/or water points. The
same data also showed however a strong correlation between various management models and the functionality of water points - water points owned and managed by private operators tend to
have much higher functionality rates than those owned and operated by VWCs.
Under time constraints and the limited scope of the VIP exercise, this correlation was however
not fully investigated and deserves to be explored further.
Water Point Mapping: The Experience of SNV Tanzania 13
January 2010
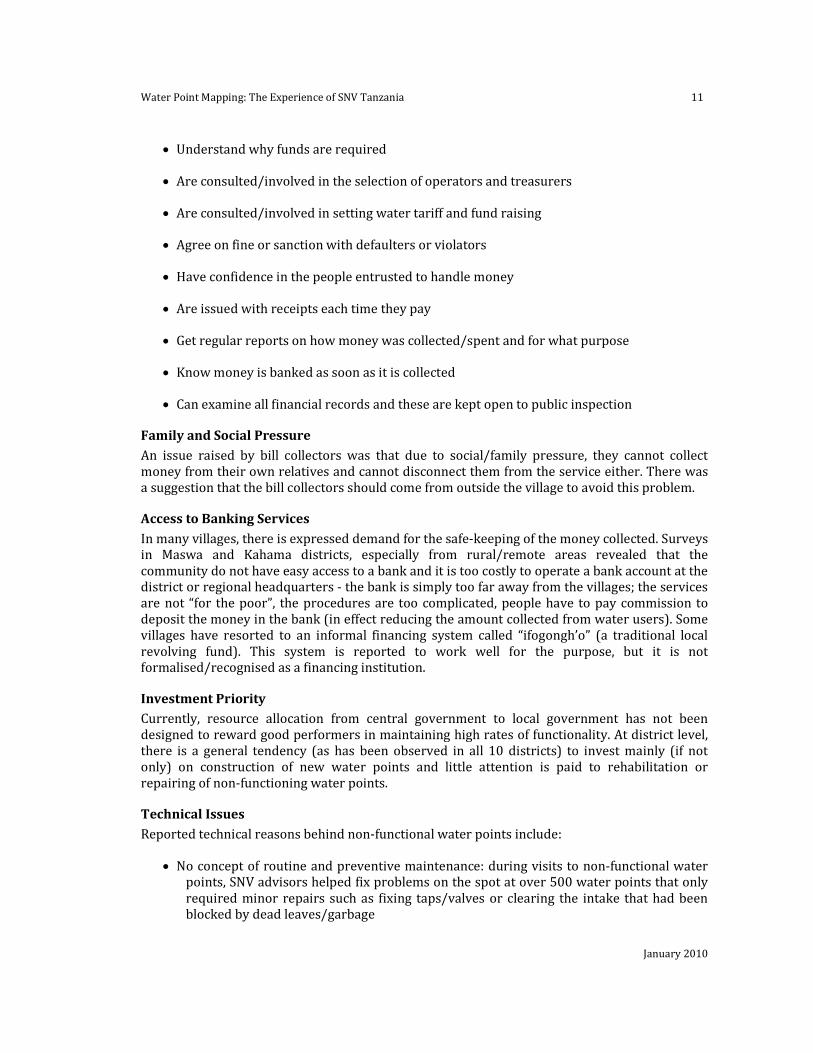
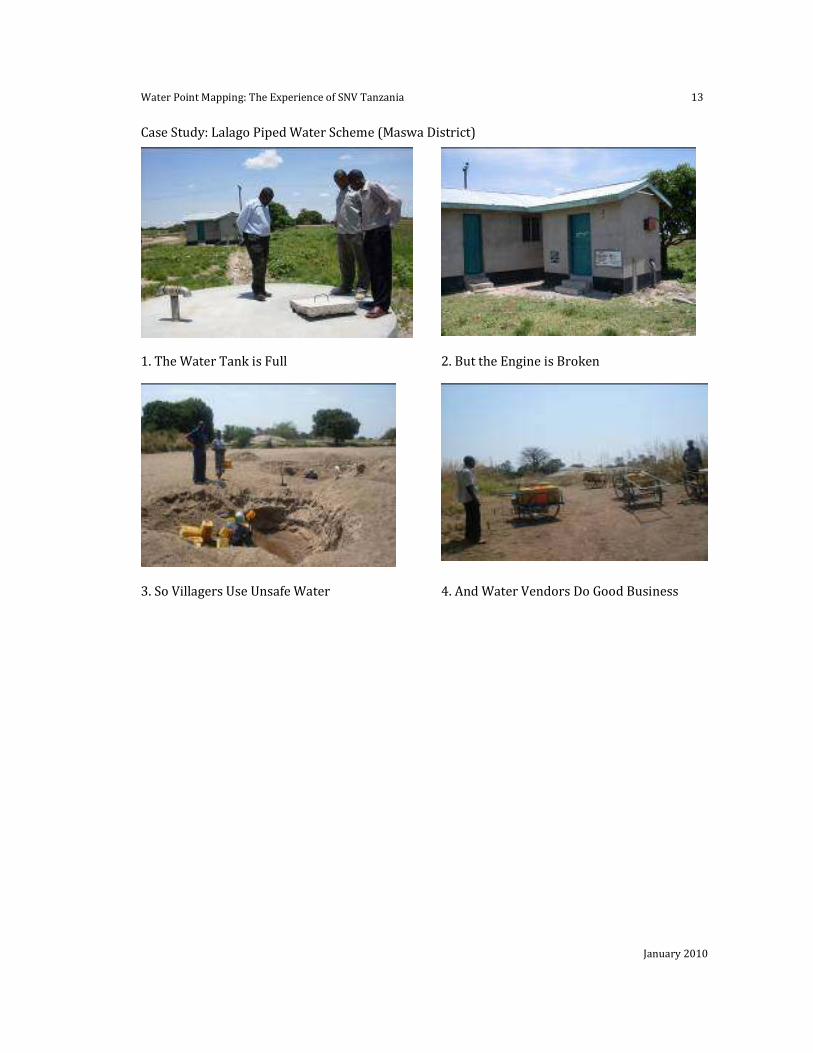
Case Study: Lalago Piped Water Scheme (Maswa District)
1. The Water Tank is Full 2. But the Engine is Broken
3. So Villagers Use Unsafe Water 4. And Water Vendors Do Good Business
Water Point Mapping: The Experience of SNV Tanzania 14
January 2010
4 Conclusions
WPM is a useful survey tool to collect accurate data on the existence and functionality of water
points. The information obtained from WPM can be analysed and utilised at different levels for
different purposes. WPM has a huge potential as an effective planning, monitoring and
management tool that can facilitate evidence-based planning and decision-making processes.
However this potential can only be realised if mechanisms are in place to collect and regularly
update the data and if there is willingness from the Government to use WPM as a tool for more
transparent and equitable resource allocation.
Data collected from WPM and evidence from the VIP showed that the main underlying cause of
water point non functionality in the 10 districts where SNV worked is anchored in the fact that most rural water supply projects are still top down/supply-driven with little or no consultation
or involvement of the water users in their planning, design and implementation. As a result, there is no sense of ownership amongst the community; the services provided do not reflect
what people want or are willing to pay for. The vast majority of the community is not aware of the changing role of government, water users and other key stakeholders. The community has
not been formally recognised as the owner and managers of water supply schemes and services. Water services are still largely treated as a public good with no economic value; there is no
rational to water tariff setting to ensure cost recovery. People in charge of rural water supply
infrastructure management do not have the right skills/expertise or incentive to perform well. Finally there is no accountability system where people can track funding allocated by central
government and/or the funding contributed by water users for rural water supply services.
Although it has been already seven years since the National Water Policy came into effect, there
is still an enormous gap between policy and implementation. Unless the underlying causes of non-functionality are addressed and the key principles of the national water policy are strongly
adhered to, the number of schemes that fail/become non-functional will soon exceed the number of new schemes being constructed and the sustainability of rural water supply services
in Tanzania will be seriously threatened. Indeed there are already indications that coverage is
actually going backwards in spite of billions of investment in the rural water sector.
To contribute to the improvement of the sustainability of rural water supply services in general
and to improve the water point functionality in particular, SNV Tanzania will follow-up the WPM
exercise through the following activities:
• Working with LGAs to support the process of legally registering COWSOs to become legal entities to own and manage rural water supply schemes.
• Carrying out a comprehensive and in-depth study on various rural water supply schemes management models to explore what works, what does not work and why and subsequently
develop a framework that propose various management models for different types of water
schemes that overcome the problems/short-comings of the previous models.
Water Point Mapping: The Experience of SNV Tanzania 15
January 2010
Appendix 1: Glossary of Terms
Term Description
Water Point The point at which water is intended to emerge from a public improved water supply, such as a tap
Functional A WP is functional if it yields water for at least six months of the year and is being used by people as a
water source on a day to day basis
Non Functionality A WP is non-functional if it does not yield water for more than six months of the year for any reason
whether due to a hardware problem, to the source being dry, to water quality for (for example too salty
or too much fluoride), or due to management (WP closed because it is not economic to place tariff
collector at WP due to under use). Non-functional also includes those WPs that are under construction
but not yet operational. Functionality therefore should be imminent, and this must be reflected in
planning decisions
Functionality Rate
The percentage of water points that are functioning. Calculation = (No of functioning water points/Total
no. of water points)*100%
Water Point Coverage
The number of water points par 1000 people. Calculation: (No of water points/Population)*1000
Equity in Distribution
This indicator captures the difference in WP coverage between areas. It is an expression of the average
deviation from the mean WP coverage of the area being considered. The greater the average deviation,
the greater the inequity in distribution of water points. Zero represents perfect equity, meaning that all
areas have the same lever of service.
Calculation:
1. Calculate the water point density for each of the area under consideration
2. Calculate the average water point density for these areas.
3. Calculate the difference between the average density and the density for each area.
4. Make sure all results from three are positive numbers
5. Calculate the average of the deviations from the mean. This gives the equity in distribution figure
Full Coverage According to the Tanzania National Water Policy, full coverage equates to 1 WP per 250 people. This
equates to WP coverage of 4 WP per1000 people
Water Point Mapping: The Experience of SNV Tanzania 16
January 2010
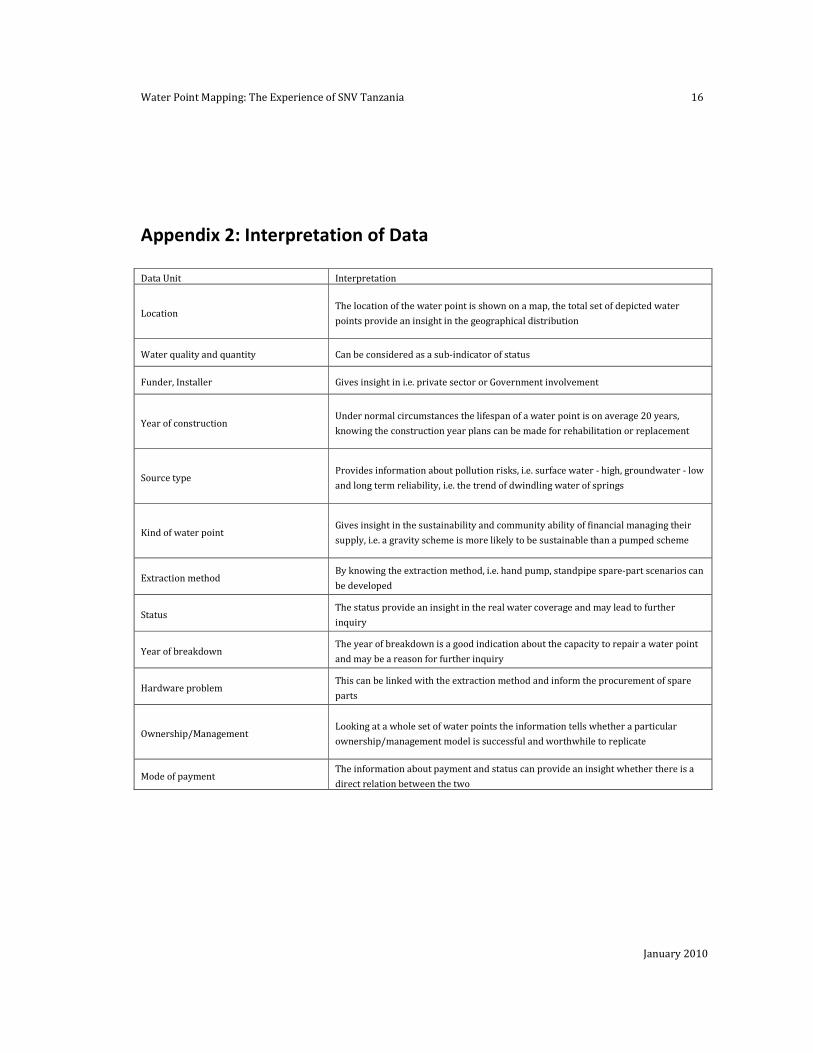
Appendix 2: Interpretation of Data
Data Unit Interpretation
Location The location of the water point is shown on a map, the total set of depicted water
points provide an insight in the geographical distribution
Water quality and quantity Can be considered as a sub-indicator of status
Funder, Installer Gives insight in i.e. private sector or Government involvement
Year of construction Under normal circumstances the lifespan of a water point is on average 20 years,
knowing the construction year plans can be made for rehabilitation or replacement
Source type Provides information about pollution risks, i.e. surface water - high, groundwater - low
and long term reliability, i.e. the trend of dwindling water of springs
Kind of water point Gives insight in the sustainability and community ability of financial managing their
supply, i.e. a gravity scheme is more likely to be sustainable than a pumped scheme
Extraction method By knowing the extraction method, i.e. hand pump, standpipe spare-part scenarios can
be developed
Status The status provide an insight in the real water coverage and may lead to further
inquiry
Year of breakdown The year of breakdown is a good indication about the capacity to repair a water point
and may be a reason for further inquiry
Hardware problem This can be linked with the extraction method and inform the procurement of spare
parts
Ownership/Management Looking at a whole set of water points the information tells whether a particular
ownership/management model is successful and worthwhile to replicate
Mode of payment The information about payment and status can provide an insight whether there is a
direct relation between the two
Water Point Mapping: The Experience of SNV Tanzania 17
January 2010
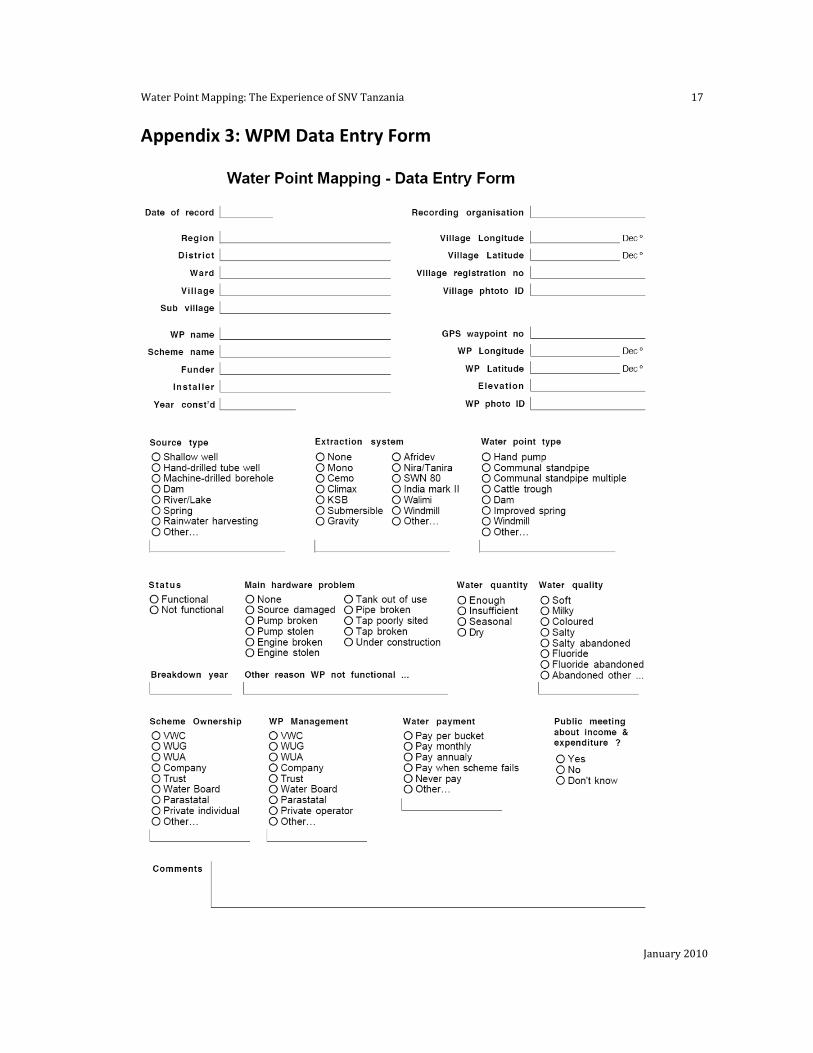
Appendix 3: WPM Data Entry Form
Water Point Mapping: The Experience of SNV Tanzania 18
January 2010
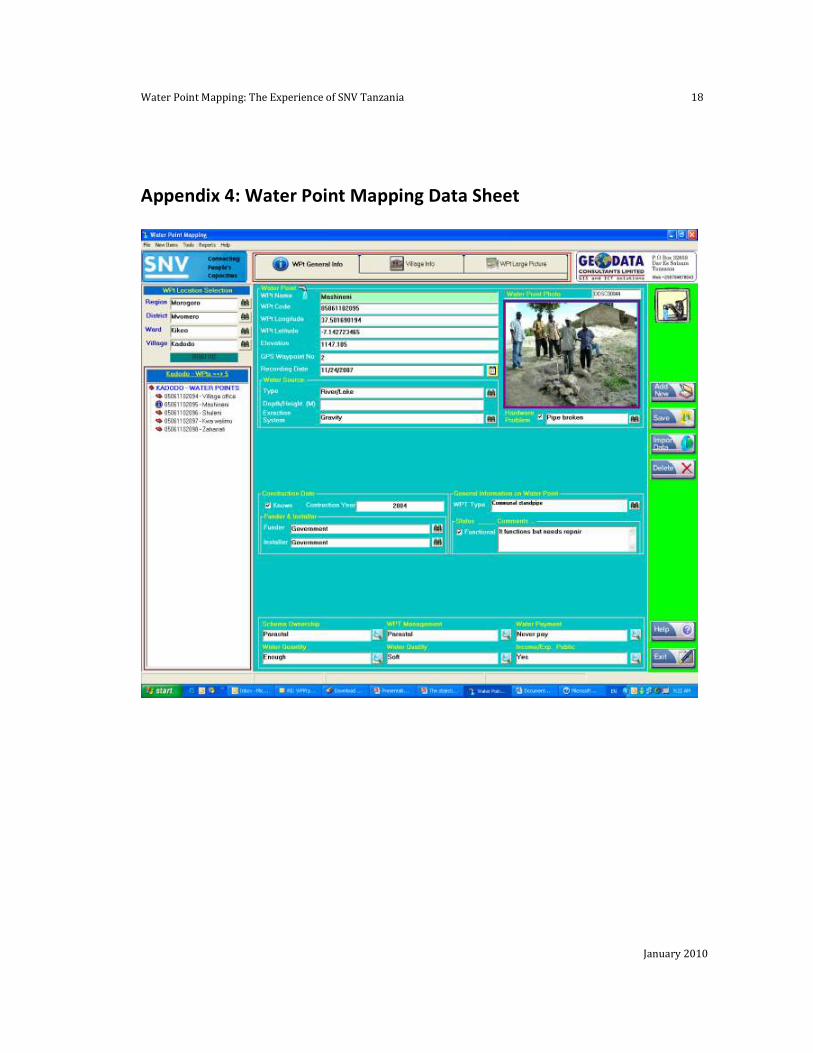
Appendix 4: Water Point Mapping Data Sheet