darling ingredients inc. - filecache.investorroom.com 9 2012.pdf · darling international inc. and...
TRANSCRIPT
DARLING INGREDIENTS INC.
FORM 10-Q(Quarterly Report)
Filed 08/09/12 for the Period Ending 06/30/12
Address 251 O CONNOR RIDGE BLVDSTE 300IRVING, TX 75038
Telephone 9727170300CIK 0000916540
Symbol DARSIC Code 2070 - Fats And Oils
Industry Food ProcessingSector Consumer Non-Cyclicals
Fiscal Year 05/07
http://www.edgar-online.com© Copyright 2016, EDGAR Online, Inc. All Rights Reserved.
Distribution and use of this document restricted under EDGAR Online, Inc. Terms of Use.
UNITED STATES SECURITIES AND EXCHANGE COMMISSION
Washington, DC 20549
FORM 10-Q
Commission File Number 001-13323
DARLING INTERNATIONAL INC. (Exact name of registrant as specified in its charter)
Registrant's telephone number, including area code: (972) 717-0300
Indicate by check mark whether the Registrant (1) has filed all reports required to be filed by Section 13 or 15(d) of the Securities Exchange Act of 1934 during the preceding 12 months (or for such shorter period that the Registrant was required to file such reports), and (2) has been subject to such filing requirements for the past 90 days. Yes X No ____ Indicate by check mark whether the Registrant has submitted electronically and posted on its corporate Web site, if any, every Interactive Data File required to be submitted and posted pursuant to Rule 405 of Regulation S-T (§232.405 of this chapter) during the preceding 12 months (or for such shorter period that the Registrant was required to submit and post such files). Yes X No ___
Indicate by check mark whether the Registrant is a large accelerated filer, an accelerated filer, a non-accelerated filer, or a smaller reporting company. See the definitions of “large accelerated filer,” “accelerated filer” and “smaller reporting company” in Rule 12b-2 of the Exchange Act.
Indicate by check mark whether the Registrant is a shell company (as defined in Rule 12b-2 of the Exchange Act). Yes No X
There were 117,618,937 shares of common stock, $0.01 par value, outstanding at August 2, 2012.
1
(Mark One)
/X/ QUARTERLY REPORT PURSUANT TO SECTION 13 or 15(d) OF THE
SECURITIES EXCHANGE ACT OF 1934
For the quarterly period ended June 30, 2012 OR
/ / TRANSITION REPORT PURSUANT TO SECTION 13 or 15(d) OF THE
SECURITIES EXCHANGE ACT OF 1934
For the transition period from _______ to _______
Delaware 36-2495346 (State or other jurisdiction (I.R.S. Employer
of incorporation or organization) Identification Number)
251 O'Connor Ridge Blvd., Suite 300
Irving, Texas 75038
(Address of principal executive offices) (Zip Code)
Large accelerated filer X Accelerated filer Non-accelerated filer Smaller reporting company
(Do not check if a smaller reporting company)
DARLING INTERNATIONAL INC. AND SUBSIDIARIES FORM 10-Q FOR THE QUARTERLY PERIOD ENDED JUNE 30, 2012
TABLE OF CONTENTS
2
Page No.
PART I: FINANCIAL INFORMATION
Item 1. FINANCIAL STATEMENTS
Consolidated Balance Sheets 3
June 30, 2012 (unaudited) and December 31, 2011
Consolidated Statements of Operations (unaudited) 4
Three and Six Months Ended June 30, 2012 and July 2, 2011
Consolidated Statements of Comprehensive Income (unaudited) 5
Three and Six Months Ended June 30, 2012 and July 2, 2011
Consolidated Statements of Cash Flows (unaudited) 6
Six Months Ended June 30, 2012 and July 2, 2011
Notes to Consolidated Financial Statements (unaudited) 7
Item 2. MANAGEMENT’S DISCUSSION AND ANALYSIS OF FINANCIAL CONDITION AND RESULTS OF OPERATIONS 28
Item 3. QUANTITATIVE AND QUALITATIVE DISCLOSURES ABOUT MARKET RISK 46
Item 4. CONTROLS AND PROCEDURES 46
PART II: OTHER INFORMATION
Item 6. EXHIBITS 48
Signatures 49
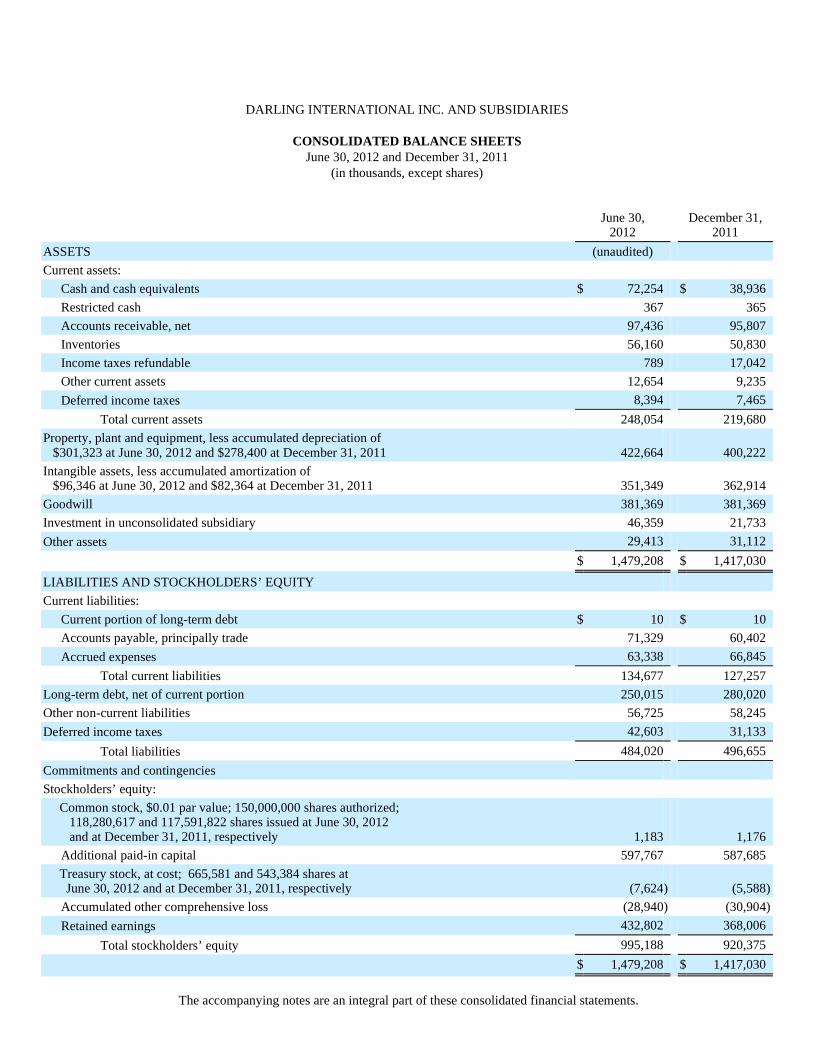
DARLING INTERNATIONAL INC. AND SUBSIDIARIES
CONSOLIDATED BALANCE SHEETS June 30, 2012 and December 31, 2011
(in thousands, except shares)
The accompanying notes are an integral part of these consolidated financial statements.
June 30,
2012 December 31,
2011
ASSETS (unaudited)
Current assets:
Cash and cash equivalents $ 72,254 $ 38,936 Restricted cash 367 365 Accounts receivable, net 97,436 95,807 Inventories 56,160 50,830 Income taxes refundable 789 17,042 Other current assets 12,654 9,235 Deferred income taxes 8,394 7,465
Total current assets 248,054 219,680 Property, plant and equipment, less accumulated depreciation of $301,323 at June 30, 2012 and $278,400 at December 31, 2011 422,664 400,222 Intangible assets, less accumulated amortization of $96,346 at June 30, 2012 and $82,364 at December 31, 2011 351,349 362,914 Goodwill 381,369 381,369 Investment in unconsolidated subsidiary 46,359 21,733 Other assets 29,413 31,112
$ 1,479,208 $ 1,417,030
LIABILITIES AND STOCKHOLDERS’ EQUITY Current liabilities:
Current portion of long-term debt $ 10 $ 10 Accounts payable, principally trade 71,329 60,402 Accrued expenses 63,338 66,845
Total current liabilities 134,677 127,257 Long-term debt, net of current portion 250,015 280,020 Other non-current liabilities 56,725 58,245 Deferred income taxes 42,603 31,133
Total liabilities 484,020 496,655 Commitments and contingencies Stockholders’ equity: Common stock, $0.01 par value; 150,000,000 shares authorized; 118,280,617 and 117,591,822 shares issued at June 30, 2012 and at December 31, 2011, respectively 1,183 1,176
Additional paid-in capital 597,767 587,685 Treasury stock, at cost; 665,581 and 543,384 shares at June 30, 2012 and at December 31, 2011, respectively (7,624 ) (5,588 )
Accumulated other comprehensive loss (28,940 ) (30,904 )
Retained earnings 432,802 368,006 Total stockholders’ equity 995,188 920,375
$ 1,479,208 $ 1,417,030

3
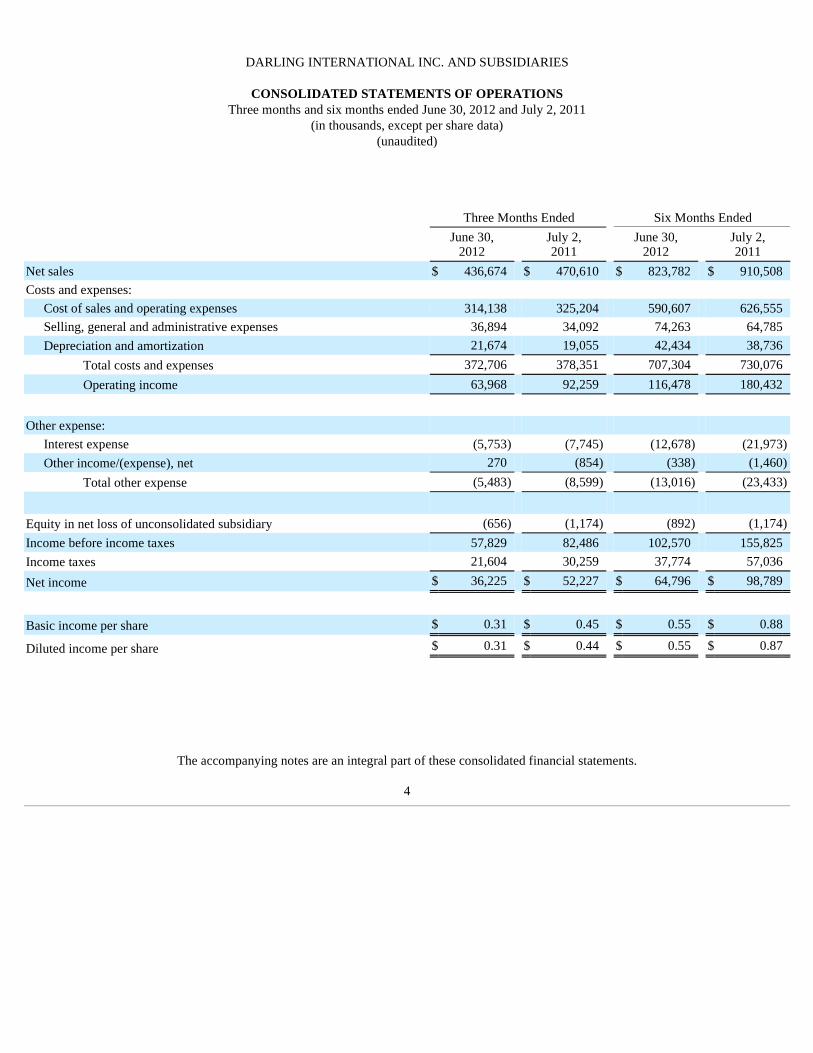
DARLING INTERNATIONAL INC. AND SUBSIDIARIES
CONSOLIDATED STATEMENTS OF OPERATIONS Three months and six months ended June 30, 2012 and July 2, 2011
(in thousands, except per share data) (unaudited)
The accompanying notes are an integral part of these consolidated financial statements.
4
Three Months Ended Six Months Ended
June 30,
2012 July 2, 2011
June 30, 2012
July 2, 2011
Net sales $ 436,674 $ 470,610 $ 823,782 $ 910,508 Costs and expenses:
Cost of sales and operating expenses 314,138 325,204 590,607 626,555 Selling, general and administrative expenses 36,894 34,092 74,263 64,785 Depreciation and amortization 21,674 19,055 42,434 38,736
Total costs and expenses 372,706 378,351 707,304 730,076 Operating income 63,968 92,259 116,478 180,432
Other expense:
Interest expense (5,753 ) (7,745 ) (12,678 ) (21,973 )
Other income/(expense), net 270 (854 ) (338 ) (1,460 )
Total other expense (5,483 ) (8,599 ) (13,016 ) (23,433 )
Equity in net loss of unconsolidated subsidiary (656 ) (1,174 ) (892 ) (1,174 )
Income before income taxes 57,829 82,486 102,570 155,825 Income taxes 21,604 30,259 37,774 57,036
Net income $ 36,225 $ 52,227 $ 64,796 $ 98,789
Basic income per share $ 0.31 $ 0.45 $ 0.55 $ 0.88
Diluted income per share $ 0.31 $ 0.44 $ 0.55 $ 0.87
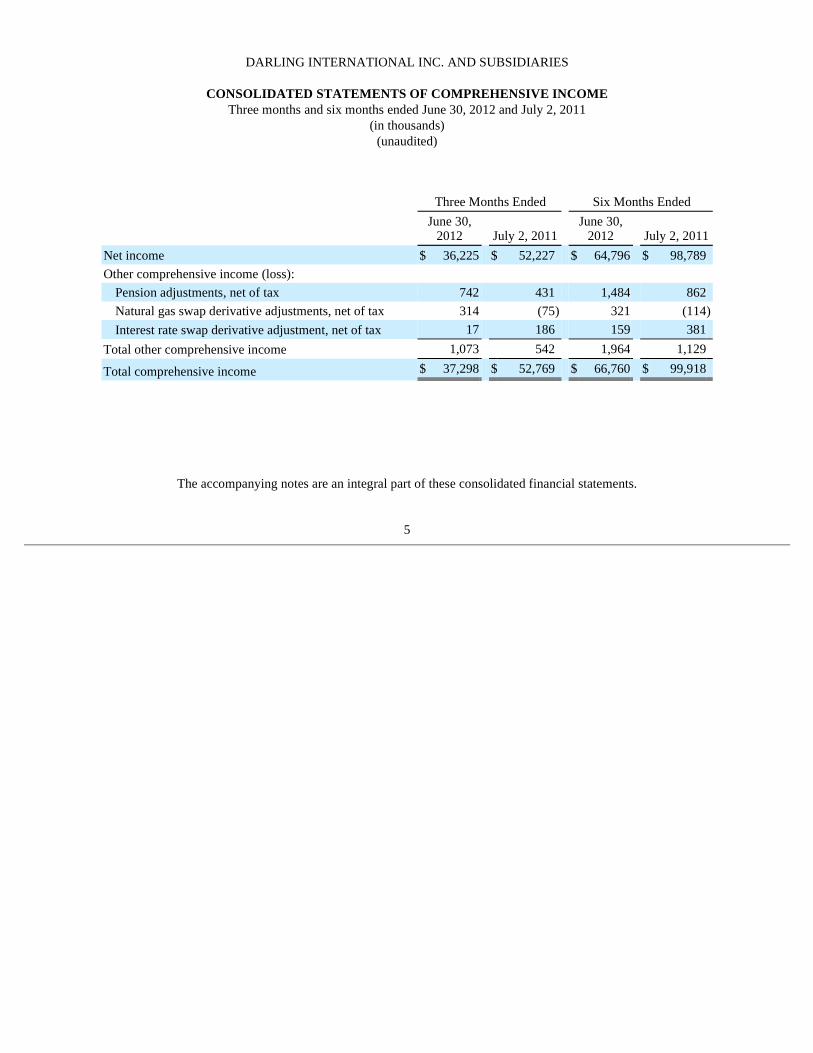
DARLING INTERNATIONAL INC. AND SUBSIDIARIES
CONSOLIDATED STATEMENTS OF COMPREHENSIVE INCOME Three months and six months ended June 30, 2012 and July 2, 2011
(in thousands) (unaudited)
The accompanying notes are an integral part of these consolidated financial statements.
5
Three Months Ended Six Months Ended
June 30,
2012 July 2, 2011 June 30,
2012 July 2, 2011
Net income $ 36,225 $ 52,227 $ 64,796 $ 98,789 Other comprehensive income (loss):
Pension adjustments, net of tax 742 431 1,484 862 Natural gas swap derivative adjustments, net of tax 314 (75 ) 321 (114 )
Interest rate swap derivative adjustment, net of tax 17 186 159 381 Total other comprehensive income 1,073 542 1,964 1,129
Total comprehensive income $ 37,298 $ 52,769 $ 66,760 $ 99,918

DARLING INTERNATIONAL INC. AND SUBSIDIARIES
CONSOLIDATED STATEMENTS OF CASH FLOWS Six months ended June 30, 2012 and July 2, 2011
(in thousands) (unaudited)
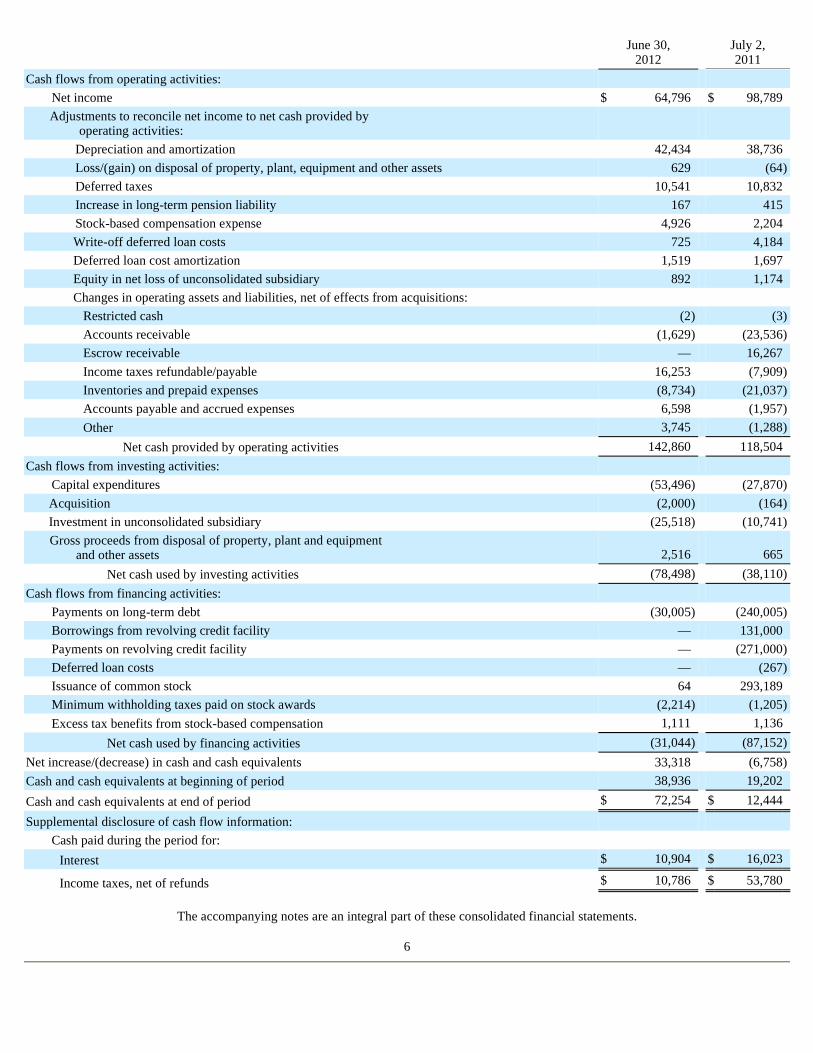
The accompanying notes are an integral part of these consolidated financial statements.
6
June 30,
2012 July 2, 2011
Cash flows from operating activities:
Net income $ 64,796 $ 98,789 Adjustments to reconcile net income to net cash provided by operating activities:
Depreciation and amortization 42,434 38,736 Loss/(gain) on disposal of property, plant, equipment and other assets 629 (64 )
Deferred taxes 10,541 10,832 Increase in long-term pension liability 167 415 Stock-based compensation expense 4,926 2,204 Write-off deferred loan costs 725 4,184 Deferred loan cost amortization 1,519 1,697 Equity in net loss of unconsolidated subsidiary 892 1,174 Changes in operating assets and liabilities, net of effects from acquisitions:
Restricted cash (2 ) (3 )
Accounts receivable (1,629 ) (23,536 )
Escrow receivable — 16,267 Income taxes refundable/payable 16,253 (7,909 )
Inventories and prepaid expenses (8,734 ) (21,037 )
Accounts payable and accrued expenses 6,598 (1,957 )
Other 3,745 (1,288 )
Net cash provided by operating activities 142,860 118,504 Cash flows from investing activities:
Capital expenditures (53,496 ) (27,870 )
Acquisition (2,000 ) (164 )
Investment in unconsolidated subsidiary (25,518 ) (10,741 )
Gross proceeds from disposal of property, plant and equipment and other assets 2,516 665
Net cash used by investing activities (78,498 ) (38,110 )
Cash flows from financing activities:
Payments on long-term debt (30,005 ) (240,005 )
Borrowings from revolving credit facility — 131,000 Payments on revolving credit facility — (271,000 )
Deferred loan costs — (267 )
Issuance of common stock 64 293,189 Minimum withholding taxes paid on stock awards (2,214 ) (1,205 )
Excess tax benefits from stock-based compensation 1,111 1,136 Net cash used by financing activities (31,044 ) (87,152 )
Net increase/(decrease) in cash and cash equivalents 33,318 (6,758 )
Cash and cash equivalents at beginning of period 38,936 19,202
Cash and cash equivalents at end of period $ 72,254 $ 12,444
Supplemental disclosure of cash flow information:
Cash paid during the period for:
Interest $ 10,904 $ 16,023
Income taxes, net of refunds $ 10,786 $ 53,780
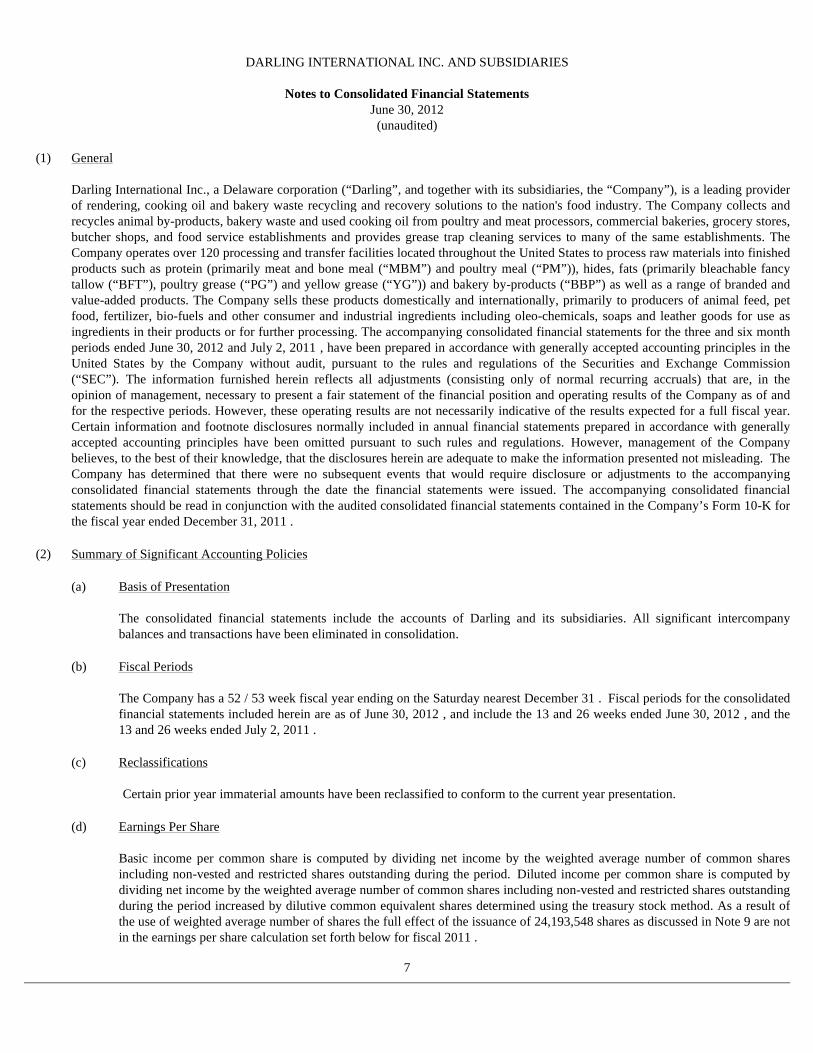
DARLING INTERNATIONAL INC. AND SUBSIDIARIES
Notes to Consolidated Financial Statements June 30, 2012 (unaudited)
Darling International Inc., a Delaware corporation (“Darling”, and together with its subsidiaries, the “Company”), is a leading provider of rendering, cooking oil and bakery waste recycling and recovery solutions to the nation's food industry. The Company collects and recycles animal by-products, bakery waste and used cooking oil from poultry and meat processors, commercial bakeries, grocery stores, butcher shops, and food service establishments and provides grease trap cleaning services to many of the same establishments. The Company operates over 120 processing and transfer facilities located throughout the United States to process raw materials into finished products such as protein (primarily meat and bone meal (“MBM”) and poultry meal (“PM”)), hides, fats (primarily bleachable fancy tallow (“BFT”), poultry grease (“PG”) and yellow grease (“YG”)) and bakery by-products (“BBP”) as well as a range of branded and value-added products. The Company sells these products domestically and internationally, primarily to producers of animal feed, pet food, fertilizer, bio-fuels and other consumer and industrial ingredients including oleo-chemicals, soaps and leather goods for use as ingredients in their products or for further processing. The accompanying consolidated financial statements for the three and six month periods ended June 30, 2012 and July 2, 2011 , have been prepared in accordance with generally accepted accounting principles in the United States by the Company without audit, pursuant to the rules and regulations of the Securities and Exchange Commission (“SEC”). The information furnished herein reflects all adjustments (consisting only of normal recurring accruals) that are, in the opinion of management, necessary to present a fair statement of the financial position and operating results of the Company as of and for the respective periods. However, these operating results are not necessarily indicative of the results expected for a full fiscal year. Certain information and footnote disclosures normally included in annual financial statements prepared in accordance with generally accepted accounting principles have been omitted pursuant to such rules and regulations. However, management of the Company believes, to the best of their knowledge, that the disclosures herein are adequate to make the information presented not misleading. The Company has determined that there were no subsequent events that would require disclosure or adjustments to the accompanying consolidated financial statements through the date the financial statements were issued. The accompanying consolidated financial statements should be read in conjunction with the audited consolidated financial statements contained in the Company’s Form 10-K for the fiscal year ended December 31, 2011 .
The consolidated financial statements include the accounts of Darling and its subsidiaries. All significant intercompany balances and transactions have been eliminated in consolidation.
The Company has a 52 / 53 week fiscal year ending on the Saturday nearest December 31 . Fiscal periods for the consolidated financial statements included herein are as of June 30, 2012 , and include the 13 and 26 weeks ended June 30, 2012 , and the 13 and 26 weeks ended July 2, 2011 .
Certain prior year immaterial amounts have been reclassified to conform to the current year presentation.
Basic income per common share is computed by dividing net income by the weighted average number of common shares including non-vested and restricted shares outstanding during the period. Diluted income per common share is computed by dividing net income by the weighted average number of common shares including non-vested and restricted shares outstanding during the period increased by dilutive common equivalent shares determined using the treasury stock method. As a result of the use of weighted average number of shares the full effect of the issuance of 24,193,548 shares as discussed in Note 9 are not in the earnings per share calculation set forth below for fiscal 2011 .
7
(1) General
(2) Summary of Significant Accounting Policies
(a) Basis of Presentation
(b) Fiscal Periods
(c) Reclassifications
(d) Earnings Per Share
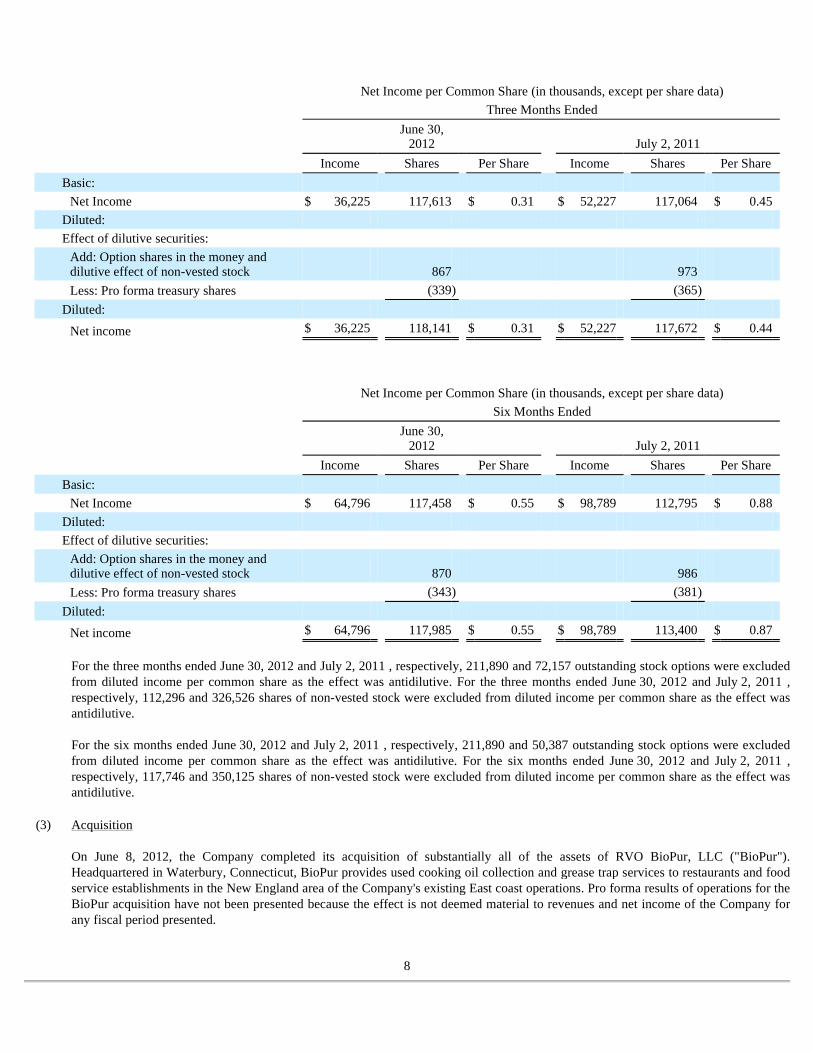
For the three months ended June 30, 2012 and July 2, 2011 , respectively, 211,890 and 72,157 outstanding stock options were excluded from diluted income per common share as the effect was antidilutive. For the three months ended June 30, 2012 and July 2, 2011 , respectively, 112,296 and 326,526 shares of non-vested stock were excluded from diluted income per common share as the effect was antidilutive. For the six months ended June 30, 2012 and July 2, 2011 , respectively, 211,890 and 50,387 outstanding stock options were excluded from diluted income per common share as the effect was antidilutive. For the six months ended June 30, 2012 and July 2, 2011 , respectively, 117,746 and 350,125 shares of non-vested stock were excluded from diluted income per common share as the effect was antidilutive.
On June 8, 2012, the Company completed its acquisition of substantially all of the assets of RVO BioPur, LLC ("BioPur"). Headquartered in Waterbury, Connecticut, BioPur provides used cooking oil collection and grease trap services to restaurants and food service establishments in the New England area of the Company's existing East coast operations. Pro forma results of operations for the BioPur acquisition have not been presented because the effect is not deemed material to revenues and net income of the Company for any fiscal period presented.
8
Net Income per Common Share (in thousands, except per share data)
Three Months Ended
June 30,
2012 July 2, 2011
Income Shares Per Share Income Shares Per Share
Basic:
Net Income $ 36,225 117,613 $ 0.31 $ 52,227 117,064 $ 0.45 Diluted: Effect of dilutive securities:
Add: Option shares in the money and dilutive effect of non-vested stock 867 973 Less: Pro forma treasury shares (339 ) (365 )
Diluted:
Net income $ 36,225 118,141 $ 0.31 $ 52,227 117,672 $ 0.44
Net Income per Common Share (in thousands, except per share data)
Six Months Ended
June 30,
2012 July 2, 2011
Income Shares Per Share Income Shares Per Share
Basic:
Net Income $ 64,796 117,458 $ 0.55 $ 98,789 112,795 $ 0.88 Diluted: Effect of dilutive securities:
Add: Option shares in the money and dilutive effect of non-vested stock 870 986 Less: Pro forma treasury shares (343 ) (381 )
Diluted:
Net income $ 64,796 117,985 $ 0.55 $ 98,789 113,400 $ 0.87
(3) Acquisition
The Company announced on January 21, 2011 that a wholly-owned subsidiary of Darling entered into a limited liability company agreement with a wholly-owned subsidiary of Valero Energy Corporation (“Valero”) to form Diamond Green Diesel Holdings LLC (the “Joint Venture”). The Joint Venture is owned 50% / 50% with Valero and was formed to design, engineer, construct and operate a renewable diesel plant (the “Facility”), which will be capable of producing approximately 9,300 barrels per day of renewable diesel fuel and certain other co-products, to be located adjacent to Valero's refinery in Norco, Louisiana. The Joint Venture is in the process of constructing the Facility under an engineering, procurement and construction contract that is intended to fix the Company's maximum economic exposure for the cost of the Facility.
On May 31, 2011 , the Joint Venture and Diamond Green Diesel LLC, a wholly-owned subsidiary of the Joint Venture (“Opco”), entered into (i) a facility agreement (the “Facility Agreement”) with Diamond Alternative Energy, LLC, a wholly-owned subsidiary of Valero (the “Lender”), and (ii) a loan agreement (the “Loan Agreement”) with the Lender, which will provide the Joint Venture with a 14 year multiple advance term loan facility of approximately $ 221,300,000 (the “JV Loan”) to support the design, engineering and construction of the Facility, which is now under construction. The Facility Agreement and the Loan Agreement prohibit the Lender from assigning all or any portion of the Facility Agreement or the Loan Agreement to unaffiliated third parties. Opco has also pledged substantially all of its assets to the Lender, and the Joint Venture has pledged all of Opco's equity interests to the Lender, until the JV Loan has been paid in full and the JV Loan has terminated in accordance with its terms.
Pursuant to sponsor support agreements executed in connection with the Facility Agreement and the Loan Agreement, each of the Company and Valero are committed to contributing approximately $ 93.2 million of the estimated aggregate costs of approximately $ 407.7 million for the completion of the Facility. The Company is also required to pay for 50% of any cost overruns incurred in connection with the construction of the Facility, including relating to any project scope changes and working capital funding. As of the date of this report, it is anticipated that the project will incur an additional $ 8.1 million in costs related to project scope changes, of which the Company will be responsible for 50% . As of June 30, 2012 under the equity method of accounting, the Company has an investment in the Joint Venture of approximately $ 46.4 million on the consolidated balance sheet and has recorded approximately $ 0.9 million and 1.2 million in losses in the unconsolidated subsidiary for the six months ended June 30, 2012 and July 2, 2011 , respectively.
The Company is a party to several lawsuits, claims and loss contingencies arising in the ordinary course of its business, including assertions by certain regulatory and governmental agencies related to permitting requirements and air, wastewater and storm water discharges from the Company’s processing facilities. The Company’s workers compensation, auto and general liability policies contain significant deductibles or self-insured retentions. The Company estimates and accrues its expected ultimate claim costs related to accidents occurring during each fiscal year and carries this accrual as a reserve until these claims are paid by the Company. As a result of the matters discussed above, the Company has established loss reserves for insurance, environmental and litigation matters. At June 30, 2012 and December 31, 2011 , the reserves for insurance, environmental and litigation contingencies reflected on the balance sheet in accrued expenses and other non-current liabilities were approximately $ 39.9 million and $ 38.0 million , respectively. The Company has insurance recovery receivables of approximately $ 9.6 million as of June 30, 2012 and December 31, 2011 , related to these liabilities. The Company's management believes these reserves for contingencies are reasonable and sufficient based upon present governmental regulations and information currently available to management; however, there can be no assurance that final costs related to these matters will not exceed current estimates. The Company believes that the likelihood is remote that any additional liability from these lawsuits and claims that may not be covered by insurance would have a material effect on the financial statements. Lower Passaic River Area . The Company has been named as a third party defendant in a lawsuit pending in the Superior Court of New Jersey, Essex County, styled New Jersey Department of Environmental Protection, The Commissioner of the New Jersey Department of Environmental Protection Agency and the Administrator of the New Jersey Spill Compensation Fund, as Plaintiffs, vs. Occidental Chemical Corporation, Tierra Solutions, Inc., Maxus Energy Corporation, Repsol YPF, S.A., YPF, S.A., YPF Holdings, Inc., and CLH Holdings, as Defendants (Docket No. L-009868-05) (the “Tierra/Maxus Litigation”). In the Tierra/Maxus Litigation, which was filed on December 13, 2005 , the plaintiffs seek to recover from the defendants past and future cleanup and removal costs, as well as unspecified economic damages, punitive damages, penalties and a variety of other forms of relief, purportedly arising from the alleged discharges into the Passaic River of a particular type of dioxin and other unspecified hazardous substances. The damages
9
(4) Investment in Unconsolidated Subsidiary
(5) Contingencies
being sought by the plaintiffs from the defendants are likely to be substantial. On February 4, 2009 , two of the defendants, Tierra Solutions, Inc. (“Tierra”) and Maxus Energy Corporation (“Maxus”), filed a third party complaint against over 300 entities, including the Company, seeking to recover all or a proportionate share of cleanup and removal costs, damages or other loss or harm, if any, for which Tierra or Maxus may be held liable in the Tierra/Maxus Litigation. Tierra and Maxus allege that Standard Tallow Company, an entity that the Company acquired in 1996 , contributed to the discharge of the hazardous substances that are the subject of this case while operating a former plant site located in Newark, New Jersey. The Company is investigating these allegations, has entered into a joint defense agreement with many of the other third-party defendants and intends to defend itself vigorously. The court has issued a trial plan that contemplates a liability trial for third-party defendants (including the Company) in April 2013, with additional proceedings if necessary to allocate costs between third-party defendants in January 2014. Additionally, in December 2009 , the Company, along with numerous other entities, received notice from the United States Environmental Protection Agency (EPA) that the Company (as successor-in-interest to Standard Tallow Company) is considered a potentially responsible party with respect to alleged contamination in the lower Passaic River area which is part of the Diamond Alkali Superfund Site located in Newark, New Jersey. In the letter, EPA requested that the Company join a group of other parties in funding a remedial investigation and feasibility study at the site. As of the date of this report, the Company has not agreed to participate in the funding group. The Company's ultimate liability for investigatory costs, remedial costs and/or natural resource damages in connection with the lower Passaic River area cannot be determined at this time; however, as of the date of this report, there is nothing that leads the Company to believe that these matters will have a material effect on the Company's financial position or results of operation. Fresno Facility Permit Issue. The Company has been named as a defendant and a real party in interest in a lawsuit filed on April 9, 2012 in the Superior Court of the State of California, Fresno County, styled Concerned Citizens of West Fresno vs. The City of Fresno and Darling International Inc. In the complaint, the plaintiff alleges that the City of Fresno has failed to enforce its own zoning ordinances and engaged in a number of discriminatory practices against the citizens of West Fresno. In addition, the complaint alleges that the Company's Fresno facility is operating without a proper use permit. Rendering operations have been conducted on the site since 1955, and the Company believes that it possesses all of the required federal, state and local permits to continue to operate the facility in the manner currently conducted and intends to defend itself vigorously in this matter. While management cannot predict the ultimate outcome of this matter, management does not believe the outcome will have a material effect on the Company's financial condition or results of operations.
The Company sells its products domestically and internationally and operates within two industry segments: Rendering and Bakery. The measure of segment profit (loss) includes all revenues, operating expenses (excluding certain amortization of intangibles), and selling, general and administrative expenses incurred at all operating locations and excludes general corporate expenses. Included in corporate activities are general corporate expenses and the amortization of intangibles. Assets of corporate activities include cash, unallocated prepaid expenses, deferred taxes, prepaid pension, and miscellaneous other assets.
Rendering Rendering operations process poultry, animal by-products and used cooking oil into fats (primarily BFT, PG and YG), protein (primarily MBM and PM (feed grade and pet food)) and hides. Fat was approximately $ 226.1 million and $ 245.5 million of net sales for the three months ended June 30, 2012 and July 2, 2011 , respectively and approximately $ 420.1 million and $ 481.7 million of net sales for the six months ended June 30, 2012 and July 2, 2011 , respectively. Protein was approximately $ 121.3 million and $ 120.4 million of net sales for the three months ended June 30, 2012 and July 2, 2011 , respectively and $ 224.8 million and $ 230.5 million of net sales for the six months ended June 30, 2012 and July 2, 2011 , respectively. Rendering operations also provides grease trap servicing. Included in the Rendering Segment is the National Service Center (“NSC”). The NSC schedules services such as fat and bone and used cooking oil collection and trap cleaning for contracted customers using the Company's resources or third party providers. Bakery Bakery products are collected from large commercial bakeries that produce a variety of products, including cookies, crackers, cereal, bread, dough, potato chips, pretzels, sweet goods and biscuits, among others. The Company processes the raw materials into BBP, including Cookie Meal®, an animal feed ingredient primarily used in poultry rations.
10
(6) Business Segments
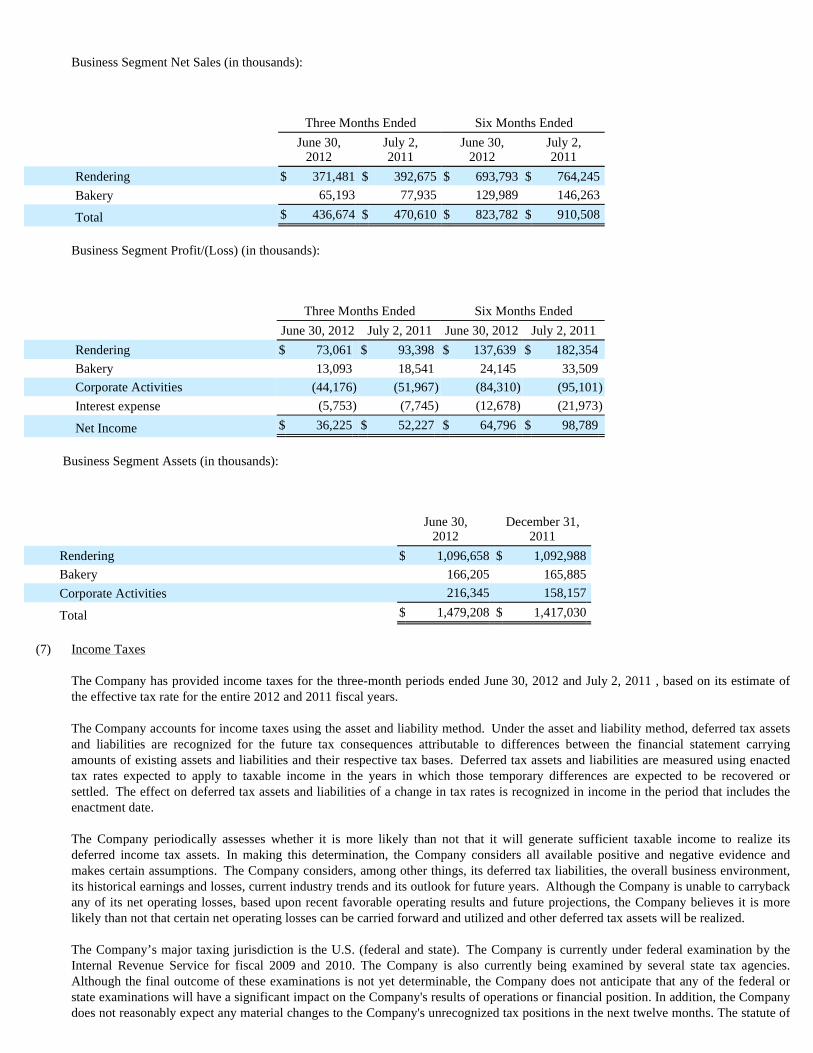
Business Segment Net Sales (in thousands):
Business Segment Profit/(Loss) (in thousands):
Business Segment Assets (in thousands):
The Company has provided income taxes for the three-month periods ended June 30, 2012 and July 2, 2011 , based on its estimate of the effective tax rate for the entire 2012 and 2011 fiscal years.
The Company accounts for income taxes using the asset and liability method. Under the asset and liability method, deferred tax assets and liabilities are recognized for the future tax consequences attributable to differences between the financial statement carrying amounts of existing assets and liabilities and their respective tax bases. Deferred tax assets and liabilities are measured using enacted tax rates expected to apply to taxable income in the years in which those temporary differences are expected to be recovered or settled. The effect on deferred tax assets and liabilities of a change in tax rates is recognized in income in the period that includes the enactment date.
The Company periodically assesses whether it is more likely than not that it will generate sufficient taxable income to realize its deferred income tax assets. In making this determination, the Company considers all available positive and negative evidence and makes certain assumptions. The Company considers, among other things, its deferred tax liabilities, the overall business environment, its historical earnings and losses, current industry trends and its outlook for future years. Although the Company is unable to carryback any of its net operating losses, based upon recent favorable operating results and future projections, the Company believes it is more likely than not that certain net operating losses can be carried forward and utilized and other deferred tax assets will be realized.
The Company’s major taxing jurisdiction is the U.S. (federal and state). The Company is currently under federal examination by the Internal Revenue Service for fiscal 2009 and 2010. The Company is also currently being examined by several state tax agencies. Although the final outcome of these examinations is not yet determinable, the Company does not anticipate that any of the federal or state examinations will have a significant impact on the Company's results of operations or financial position. In addition, the Company does not reasonably expect any material changes to the Company's unrecognized tax positions in the next twelve months. The statute of
Three Months Ended Six Months Ended
June 30,
2012 July 2, 2011
June 30, 2012
July 2, 2011
Rendering $ 371,481 $ 392,675 $ 693,793 $ 764,245 Bakery 65,193 77,935 129,989 146,263
Total $ 436,674 $ 470,610 $ 823,782 $ 910,508
Three Months Ended Six Months Ended
June 30, 2012 July 2, 2011 June 30, 2012 July 2, 2011
Rendering $ 73,061 $ 93,398 $ 137,639 $ 182,354 Bakery 13,093 18,541 24,145 33,509 Corporate Activities (44,176 ) (51,967 ) (84,310 ) (95,101 )
Interest expense (5,753 ) (7,745 ) (12,678 ) (21,973 )
Net Income $ 36,225 $ 52,227 $ 64,796 $ 98,789
June 30,
2012 December 31,
2011
Rendering $ 1,096,658 $ 1,092,988 Bakery 166,205 165,885 Corporate Activities 216,345 158,157
Total $ 1,479,208 $ 1,417,030
(7) Income Taxes

limitations for the Company's federal and material state returns remains open for examination for tax years 2007 to 2011.
11
Credit Facilities
Senior Secured Credit Facilities. On December 17, 2010 , the Company entered into a credit agreement (the “Credit Agreement”) consisting of a five-year senior secured revolving loan facility and a six-year senior secured term loan facility. On March 25, 2011 , the Company amended its Credit Agreement to increase the aggregate available principal amount under the revolving loan facility from $ 325.0 million to $ 415.0 million (approximately $ 75.0 million of which will be available for a letter of credit sub-facility and $ 15.0 million of which will be available for a swingline sub-facility) and to add additional stepdowns to the pricing grid providing lower spread margins to the applicable base or Libor rate under the Credit Agreement based on defined leverage ratio levels. As of June 30, 2012 , the Company had availability of $ 389.7 million under the revolving loan facility, taking into account no outstanding borrowings and letters of credit issued of $ 25.3 million . As of June 30, 2012 , the Company had repaid all of the original $ 300.0 million term loan issued under the Credit Agreement, including $ 30.0 million repaid in the first quarter of fiscal 2012. The amounts that have been repaid on the term loan may not be reborrowed. As a result of the term loan payments, the Company incurred a write-off of a portion of the senior term loan facilities deferred loan costs of approximately $ 0.7 million and $ 4.2 million in the six month periods ending June 30, 2012 and July 2, 2011 , respectively,which is included in interest expense. The revolving credit facility has a five-year term ending December 17, 2015 . The Company used the original proceeds of the term loan facility and a portion of the revolving loan facility to pay a portion of the consideration of its prior year acquisitions, to pay related fees and expenses and to provide for working capital needs and general corporate purposes. The Credit Agreement allows for borrowings at per annum rates based on the following loan types. With respect to any revolving facility loan, i) an alternate base rate means a rate per annum equal to the greatest of (a) the prime rate (b) the federal funds effective rate (as defined in the Credit Agreement) plus ½ to 1% and (c) the adjusted London Inter-Bank Offer Rate (“LIBOR”) for a month interest period plus 1% , plus in each case, a margin determined by reference to a pricing grid under the Credit Agreement and adjusted according to the Company's adjusted leverage ratio, and, ii) Eurodollar rate loans bear interest at a rate per annum based on the then applicable LIBOR multiplied by the statutory reserve rate plus a margin determined by reference to a pricing grid and adjusted according to the Company's adjusted leverage ratio. With respect to an alternate base rate loan that is a term loan, at no time will the alternate base rate be less than 2.50% per annum, plus the term loan alternate base rate margin of 2.50% . With respect to a LIBOR loan that is a term loan, at no time will the LIBOR rate applicable to the term loans (before giving effect to any adjustment for reserve requirements) be less than 1.50% per annum, plus the term loan LIBOR margin of 3.50% . The Credit Agreement contains various customary representations and warranties by the Company, which include customary use of materiality, material adverse effect and knowledge qualifiers. The Credit Agreement also contains (a) certain affirmative covenants that impose certain reporting and/or performance obligations on the Company, (b) certain negative covenants that generally prohibit, subject to various exceptions, the Company from taking certain actions, including, without limitation, incurring indebtedness, making investments, incurring liens, paying dividends, and engaging in mergers and consolidations, sale leasebacks and sales of assets, (c) financial covenants such as maximum total leverage ratio and a minimum fixed charge coverage ratio and (d) customary events of default (including a change of control). Obligations under the Credit Agreement may be declared due and payable upon the occurrence of such customary events of default. Senior Notes. On December 17, 2010 , Darling issued $ 250.0 million aggregate principal amount of its 8.5% Senior Notes due 2018 (the “Restricted Notes”) under an indenture with U.S. Bank National Association, as trustee. Darling used the net proceeds from the sale of the Restricted Notes to finance in part the cash portion of the purchase price paid in connection with Darling's acquisition of Griffin Industries, Inc. The Company will pay 8.5% annual cash interest on the Restricted Notes on June 15 and December 15 of each year, commencing June 15, 2011 . Other than for extraordinary events such as change of control and defined assets sales, the Company is not required to make any mandatory redemption or sinking fund payments on the Restricted Notes. The original holders of the Restricted Notes were given the benefit of registration rights pursuant to a registration rights agreement (the “Notes Registration Rights Agreement”) with the representative of the initial purchasers. In accordance with the terms of the Notes Registration Rights Agreement, on June 15, 2011 , the Company filed a registration statement on Form S-4 to offer to exchange all outstanding Restricted Notes for $ 250.0 million 8.5% Senior Notes due 2018 (the “Exchange Notes” and collectively with the Restricted Notes, the “Notes”). The exchange offer was made effective June 27, 2011 and expired July 27, 2011 with the Company offering to exchange all outstanding Restricted Notes that were validly tendered and not withdrawn prior to the expiration or termination of the exchange offer for an equal principal
12
(8) Debt
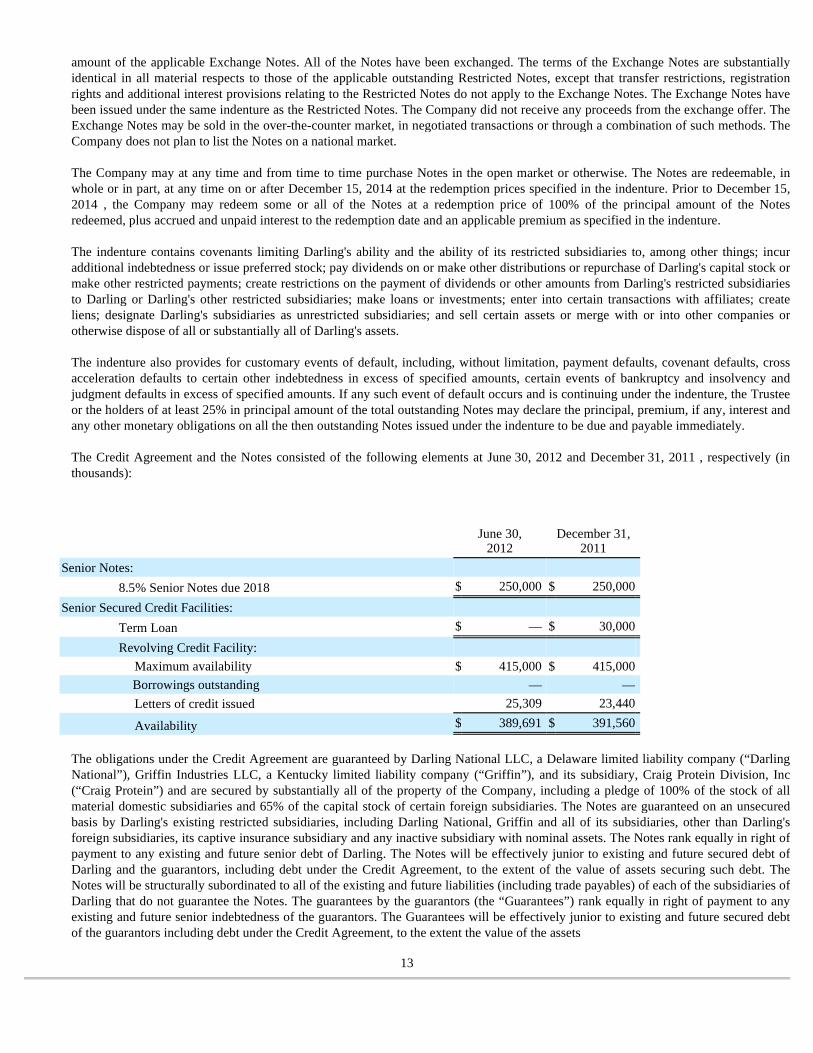
amount of the applicable Exchange Notes. All of the Notes have been exchanged. The terms of the Exchange Notes are substantially identical in all material respects to those of the applicable outstanding Restricted Notes, except that transfer restrictions, registration rights and additional interest provisions relating to the Restricted Notes do not apply to the Exchange Notes. The Exchange Notes have been issued under the same indenture as the Restricted Notes. The Company did not receive any proceeds from the exchange offer. The Exchange Notes may be sold in the over-the-counter market, in negotiated transactions or through a combination of such methods. The Company does not plan to list the Notes on a national market. The Company may at any time and from time to time purchase Notes in the open market or otherwise. The Notes are redeemable, in whole or in part, at any time on or after December 15, 2014 at the redemption prices specified in the indenture. Prior to December 15, 2014 , the Company may redeem some or all of the Notes at a redemption price of 100% of the principal amount of the Notes redeemed, plus accrued and unpaid interest to the redemption date and an applicable premium as specified in the indenture. The indenture contains covenants limiting Darling's ability and the ability of its restricted subsidiaries to, among other things; incur additional indebtedness or issue preferred stock; pay dividends on or make other distributions or repurchase of Darling's capital stock or make other restricted payments; create restrictions on the payment of dividends or other amounts from Darling's restricted subsidiaries to Darling or Darling's other restricted subsidiaries; make loans or investments; enter into certain transactions with affiliates; create liens; designate Darling's subsidiaries as unrestricted subsidiaries; and sell certain assets or merge with or into other companies or otherwise dispose of all or substantially all of Darling's assets. The indenture also provides for customary events of default, including, without limitation, payment defaults, covenant defaults, cross acceleration defaults to certain other indebtedness in excess of specified amounts, certain events of bankruptcy and insolvency and judgment defaults in excess of specified amounts. If any such event of default occurs and is continuing under the indenture, the Trustee or the holders of at least 25% in principal amount of the total outstanding Notes may declare the principal, premium, if any, interest and any other monetary obligations on all the then outstanding Notes issued under the indenture to be due and payable immediately. The Credit Agreement and the Notes consisted of the following elements at June 30, 2012 and December 31, 2011 , respectively (in thousands):
The obligations under the Credit Agreement are guaranteed by Darling National LLC, a Delaware limited liability company (“Darling National”), Griffin Industries LLC, a Kentucky limited liability company (“Griffin”), and its subsidiary, Craig Protein Division, Inc (“Craig Protein”) and are secured by substantially all of the property of the Company, including a pledge of 100% of the stock of all material domestic subsidiaries and 65% of the capital stock of certain foreign subsidiaries. The Notes are guaranteed on an unsecured basis by Darling's existing restricted subsidiaries, including Darling National, Griffin and all of its subsidiaries, other than Darling's foreign subsidiaries, its captive insurance subsidiary and any inactive subsidiary with nominal assets. The Notes rank equally in right of payment to any existing and future senior debt of Darling. The Notes will be effectively junior to existing and future secured debt of Darling and the guarantors, including debt under the Credit Agreement, to the extent of the value of assets securing such debt. The Notes will be structurally subordinated to all of the existing and future liabilities (including trade payables) of each of the subsidiaries of Darling that do not guarantee the Notes. The guarantees by the guarantors (the “Guarantees”) rank equally in right of payment to any existing and future senior indebtedness of the guarantors. The Guarantees will be effectively junior to existing and future secured debt of the guarantors including debt under the Credit Agreement, to the extent the value of the assets
13
June 30,
2012 December 31,
2011
Senior Notes:
8.5% Senior Notes due 2018 $ 250,000 $ 250,000
Senior Secured Credit Facilities:
Term Loan $ — $ 30,000
Revolving Credit Facility: Maximum availability $ 415,000 $ 415,000 Borrowings outstanding — — Letters of credit issued 25,309 23,440
Availability $ 389,691 $ 391,560
securing such debt. The Guarantees will be structurally subordinated to all of the existing and future liabilities (including trade payables) of each of the subsidiaries of each guarantor that do not guarantee the Notes. As of June 30, 2012 , the Company believes it is in compliance with all of the financial covenants, as well as all of the other covenants contained in the Credit Agreement and the Notes Indenture.
On January 27, 2011 , the Company entered into an underwritten public offering for 24,193,548 shares of its common stock, at a price to the public of $ 12.70 per share, pursuant to an effective shelf registration statement. The offering closed on February 2, 2011 . In addition, certain former stockholders of Griffin Industries, Inc. (pursuant to such stockholders' contractual registration rights) granted the underwriters a 30-day option, which the underwriters subsequently exercised in full, to purchase from them up to an additional 3,629,032 shares of Darling common stock to cover over-allotments. The Company used the net proceeds of approximately $ 292.7 million from the offering to repay all of its then outstanding revolver balance and a portion of its term loan facility under the Company's Credit Agreement. Darling did not receive any proceeds from the sale of shares by the former stockholders of Griffin Industries, Inc.
The Company’s operations are exposed to market risks relating to commodity prices that affect the Company’s cost of raw materials, finished product prices and energy costs and the risk of changes in interest rates. The Company makes limited use of derivative instruments to manage cash flow risks related to interest expense, natural gas usage, diesel fuel usage and inventory. The Company does not use derivative instruments for trading purposes. Interest rate swaps are entered into with the intent of managing overall borrowing costs by reducing the potential impact of increases in interest rates on floating-rate long-term debt. Natural gas swaps and options are entered into with the intent of managing the overall cost of natural gas usage by reducing the potential impact of seasonal weather demands on natural gas that increases natural gas prices. Heating oil swaps and options are entered into with the intent of managing the overall cost of diesel fuel usage by reducing the potential impact of seasonal weather demands on diesel fuel that increases diesel fuel prices. Inventory swaps and options are entered into with the intent of managing seasonally high concentrations of MBM, PM, BFT, PG, YG and BBP inventories by reducing the potential impact of decreasing prices. At June 30, 2012 , the Company had natural gas swaps outstanding that qualified and were designated for hedge accounting as well as heating oil swaps and heating oil and corn options that did not qualify and were not designated for hedge accounting. Entities are required to report all derivative instruments in the statement of financial position at fair value. The accounting for changes in the fair value (i.e., gains or losses) of a derivative instrument depends on whether it has been designated and qualifies as part of a hedging relationship and, if so, on the reason for holding the instrument. If certain conditions are met, entities may elect to designate a derivative instrument as a hedge of exposures to changes in fair value, cash flows or foreign currencies. If the hedged exposure is a cash flow exposure, the effective portion of the gain or loss on the derivative instrument is reported initially as a component of other comprehensive income (outside of earnings) and is subsequently reclassified into earnings when the forecasted transaction affects earnings. Any amounts excluded from the assessment of hedge effectiveness as well as the ineffective portion of the gain or loss are reported in earnings immediately. If the derivative instrument is not designated as a hedge, the gain or loss is recognized in earnings in the period of change. Cash Flow Hedges On May 19, 2006 , the Company entered into two interest rate swap agreements that were considered cash flow hedges according to FASB authoritative guidance. In December 2010 , as a result of the Merger and entry into a new Credit Agreement the term loan that specifically related to these interest swap transactions was repaid. As such, the Company discontinued the interest rate swaps and paid approximately $ 2.0 million representing the fair value of these two interest swap transactions at the discontinuance date with the effective portion recorded in accumulated other comprehensive loss to be reclassified to income over the remaining original term of the interest swaps which ended April 7, 2012 .
14
(9) Stockholders' Equity
(10) Derivatives
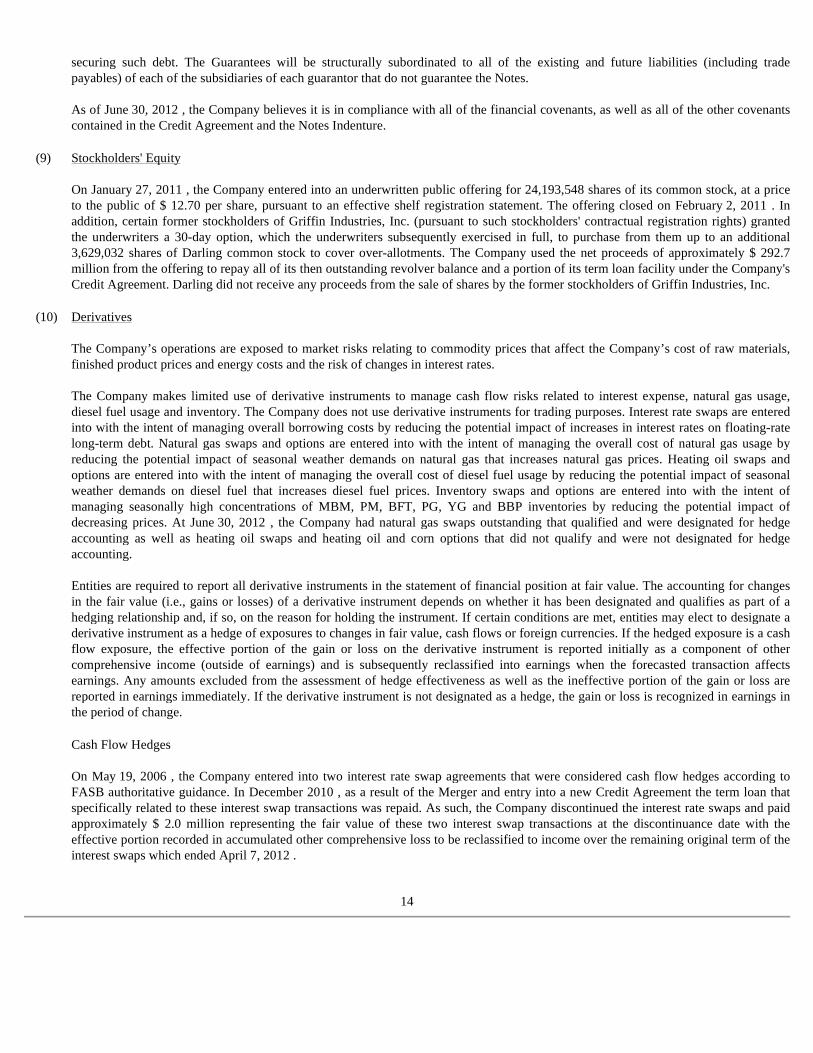
In fiscal 2011 and the first six month of fiscal 2012 , the Company entered into natural gas swap contracts that are considered cash flow hedges. Under the terms of the natural gas swap contracts the Company fixed the expected purchase cost of a portion of its plants expected natural gas usage into the third quarter of fiscal 2012 . As of June 30, 2012 , some of the contracts have expired and settled according to the contracts while the remaining contract positions and activity are disclosed below. The Company estimates the amount that will be reclassified from accumulated other comprehensive loss at June 30, 2012 into earnings over the next 12 months will be approximately $ 0.1 million . As of June 30, 2012 , approximately $ 0.3 million of losses have been reclassified into earnings as a result of the discontinuance of cash flow hedges. The following table presents the fair value of the Company’s derivative instruments under FASB authoritative guidance as of June 30, 2012 and December 31, 2011 (in thousands):
The effect of the Company’s derivative instruments on the consolidated financial statements as of and for the three months ended June 30, 2012 and July 2, 2011 is as follows (in thousands):
Derivatives not Designated as
Hedges
Balance Sheet Asset Derivatives Fair Value
Location June 30, 2012 December 31, 2011
Heating oil swaps and options Other current assets $ 42 $ 6
Total asset derivatives not designated as hedges $ 42 $ 6
Total asset derivatives $ 42 $ 6
Derivatives Designated Balance Sheet Liability Derivatives Fair Value
as Hedges Location June 30, 2012 December 31, 2011
Natural gas swaps Accrued expenses $ 141 $ 669
Total liability derivatives designated as hedges $ 141 $ 669
Derivatives not Designated as
Hedges Natural gas swaps Accrued expenses $ — $ 143 Heating oil swaps and options Accrued expenses 156 24 Corn options Accrued expenses 85 —
Total liability derivatives not designated as hedges $ 241 $ 167
Total liability derivatives $ 382 $ 836
Derivatives Designated as
Cash Flow Hedges
Gain or (Loss)
Recognized in OCI on Derivatives
(Effective Portion) (a)
Gain or (Loss) Reclassified From Accumulated OCI
into Income (Effective Portion) (b)
Gain or (Loss) Recognized in Income
on Derivatives (Ineffective Portion and Amount Excluded from
Effectiveness Testing) (c)
2012 2011 2012 2011 2012 2011
Interest rate swaps $ — $ — $ (28 ) $ (303 ) $ — $ — Natural gas swaps 217 (18 ) (295 ) 105 — (9 )
Total $ 217 $ (18 ) $ (323 ) $ (198 ) $ — $ (9 )

15
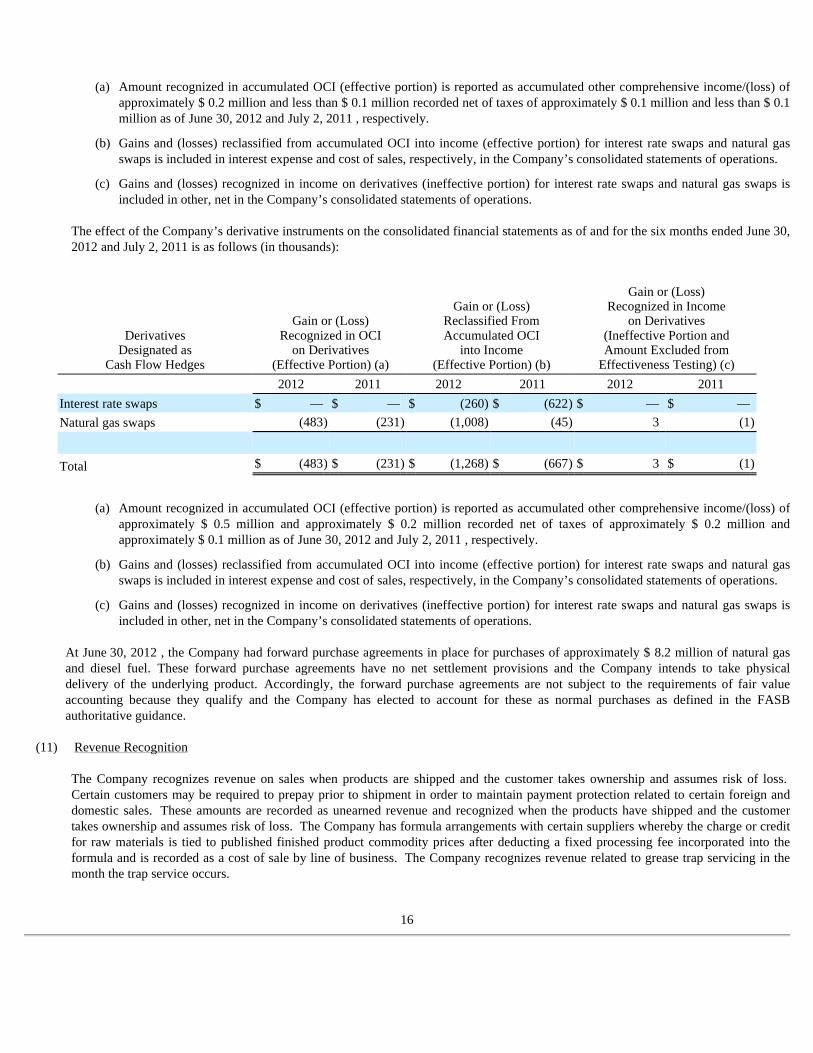
The effect of the Company’s derivative instruments on the consolidated financial statements as of and for the six months ended June 30, 2012 and July 2, 2011 is as follows (in thousands):
At June 30, 2012 , the Company had forward purchase agreements in place for purchases of approximately $ 8.2 million of natural gas and diesel fuel. These forward purchase agreements have no net settlement provisions and the Company intends to take physical delivery of the underlying product. Accordingly, the forward purchase agreements are not subject to the requirements of fair value accounting because they qualify and the Company has elected to account for these as normal purchases as defined in the FASB authoritative guidance.
(11) Revenue Recognition The Company recognizes revenue on sales when products are shipped and the customer takes ownership and assumes risk of loss. Certain customers may be required to prepay prior to shipment in order to maintain payment protection related to certain foreign and domestic sales. These amounts are recorded as unearned revenue and recognized when the products have shipped and the customer takes ownership and assumes risk of loss. The Company has formula arrangements with certain suppliers whereby the charge or credit for raw materials is tied to published finished product commodity prices after deducting a fixed processing fee incorporated into the formula and is recorded as a cost of sale by line of business. The Company recognizes revenue related to grease trap servicing in the month the trap service occurs.
16
(a) Amount recognized in accumulated OCI (effective portion) is reported as accumulated other comprehensive income/(loss) of approximately $ 0.2 million and less than $ 0.1 million recorded net of taxes of approximately $ 0.1 million and less than $ 0.1 million as of June 30, 2012 and July 2, 2011 , respectively.
(b) Gains and (losses) reclassified from accumulated OCI into income (effective portion) for interest rate swaps and natural gas swaps is included in interest expense and cost of sales, respectively, in the Company’s consolidated statements of operations.
(c) Gains and (losses) recognized in income on derivatives (ineffective portion) for interest rate swaps and natural gas swaps is included in other, net in the Company’s consolidated statements of operations.
Derivatives Designated as
Cash Flow Hedges
Gain or (Loss)
Recognized in OCI on Derivatives
(Effective Portion) (a)
Gain or (Loss) Reclassified From Accumulated OCI
into Income (Effective Portion) (b)
Gain or (Loss) Recognized in Income
on Derivatives (Ineffective Portion and Amount Excluded from
Effectiveness Testing) (c)
2012 2011 2012 2011 2012 2011
Interest rate swaps $ — $ — $ (260 ) $ (622 ) $ — $ — Natural gas swaps (483 ) (231 ) (1,008 ) (45 ) 3 (1 )
Total $ (483 ) $ (231 ) $ (1,268 ) $ (667 ) $ 3 $ (1 )
(a) Amount recognized in accumulated OCI (effective portion) is reported as accumulated other comprehensive income/(loss) of approximately $ 0.5 million and approximately $ 0.2 million recorded net of taxes of approximately $ 0.2 million and approximately $ 0.1 million as of June 30, 2012 and July 2, 2011 , respectively.
(b) Gains and (losses) reclassified from accumulated OCI into income (effective portion) for interest rate swaps and natural gas swaps is included in interest expense and cost of sales, respectively, in the Company’s consolidated statements of operations.
(c) Gains and (losses) recognized in income on derivatives (ineffective portion) for interest rate swaps and natural gas swaps is included in other, net in the Company’s consolidated statements of operations.
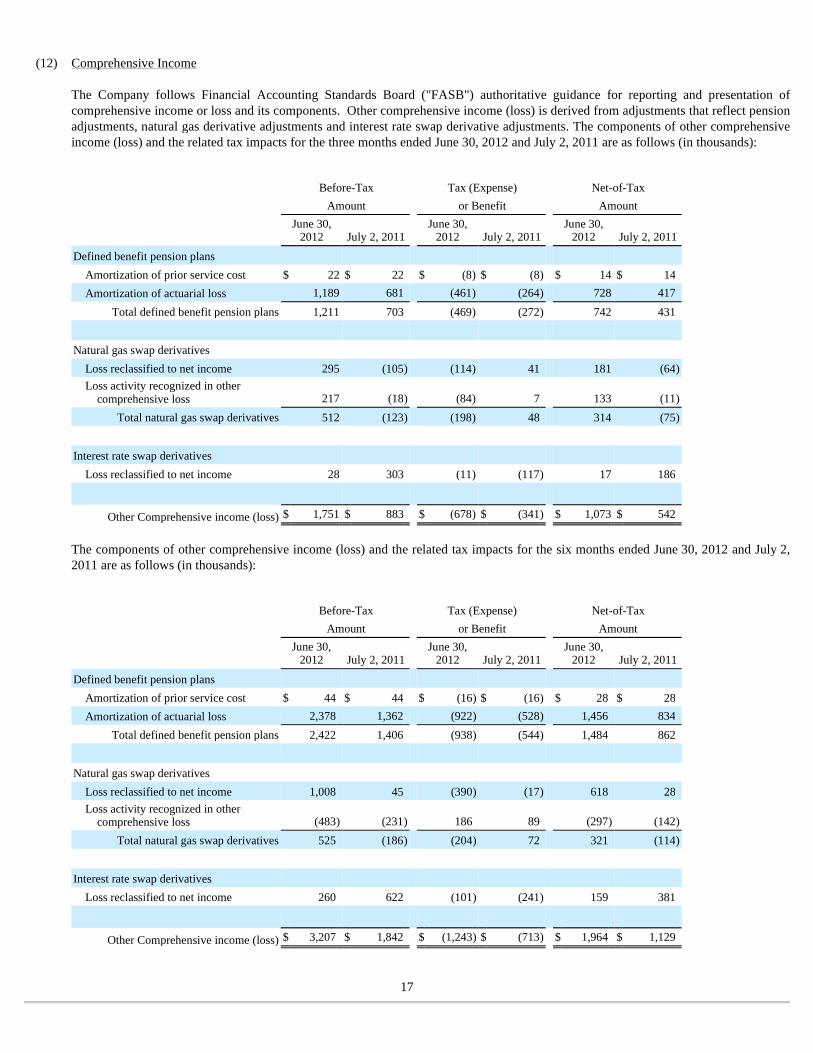
The Company follows Financial Accounting Standards Board ("FASB") authoritative guidance for reporting and presentation of comprehensive income or loss and its components. Other comprehensive income (loss) is derived from adjustments that reflect pension adjustments, natural gas derivative adjustments and interest rate swap derivative adjustments. The components of other comprehensive income (loss) and the related tax impacts for the three months ended June 30, 2012 and July 2, 2011 are as follows (in thousands):
The components of other comprehensive income (loss) and the related tax impacts for the six months ended June 30, 2012 and July 2, 2011 are as follows (in thousands):
17
(12) Comprehensive Income
Before-Tax Tax (Expense) Net-of-Tax
Amount or Benefit Amount
June 30,
2012 July 2, 2011 June 30,
2012 July 2, 2011 June 30,
2012 July 2, 2011
Defined benefit pension plans
Amortization of prior service cost $ 22 $ 22 $ (8 ) $ (8 ) $ 14 $ 14 Amortization of actuarial loss 1,189 681 (461 ) (264 ) 728 417
Total defined benefit pension plans 1,211 703 (469 ) (272 ) 742 431
Natural gas swap derivatives
Loss reclassified to net income 295 (105 ) (114 ) 41 181 (64 )
Loss activity recognized in other comprehensive loss 217 (18 ) (84 ) 7 133 (11 )
Total natural gas swap derivatives 512 (123 ) (198 ) 48 314 (75 )
Interest rate swap derivatives
Loss reclassified to net income 28 303 (11 ) (117 ) 17 186
Other Comprehensive income (loss) $ 1,751 $ 883 $ (678 ) $ (341 ) $ 1,073 $ 542
Before-Tax Tax (Expense) Net-of-Tax
Amount or Benefit Amount
June 30,
2012 July 2, 2011 June 30,
2012 July 2, 2011 June 30,
2012 July 2, 2011
Defined benefit pension plans
Amortization of prior service cost $ 44 $ 44 $ (16 ) $ (16 ) $ 28 $ 28 Amortization of actuarial loss 2,378 1,362 (922 ) (528 ) 1,456 834
Total defined benefit pension plans 2,422 1,406 (938 ) (544 ) 1,484 862
Natural gas swap derivatives
Loss reclassified to net income 1,008 45 (390 ) (17 ) 618 28 Loss activity recognized in other
comprehensive loss (483 ) (231 ) 186 89 (297 ) (142 )
Total natural gas swap derivatives 525 (186 ) (204 ) 72 321 (114 )
Interest rate swap derivatives
Loss reclassified to net income 260 622 (101 ) (241 ) 159 381
Other Comprehensive income (loss) $ 3,207 $ 1,842 $ (1,243 ) $ (713 ) $ 1,964 $ 1,129
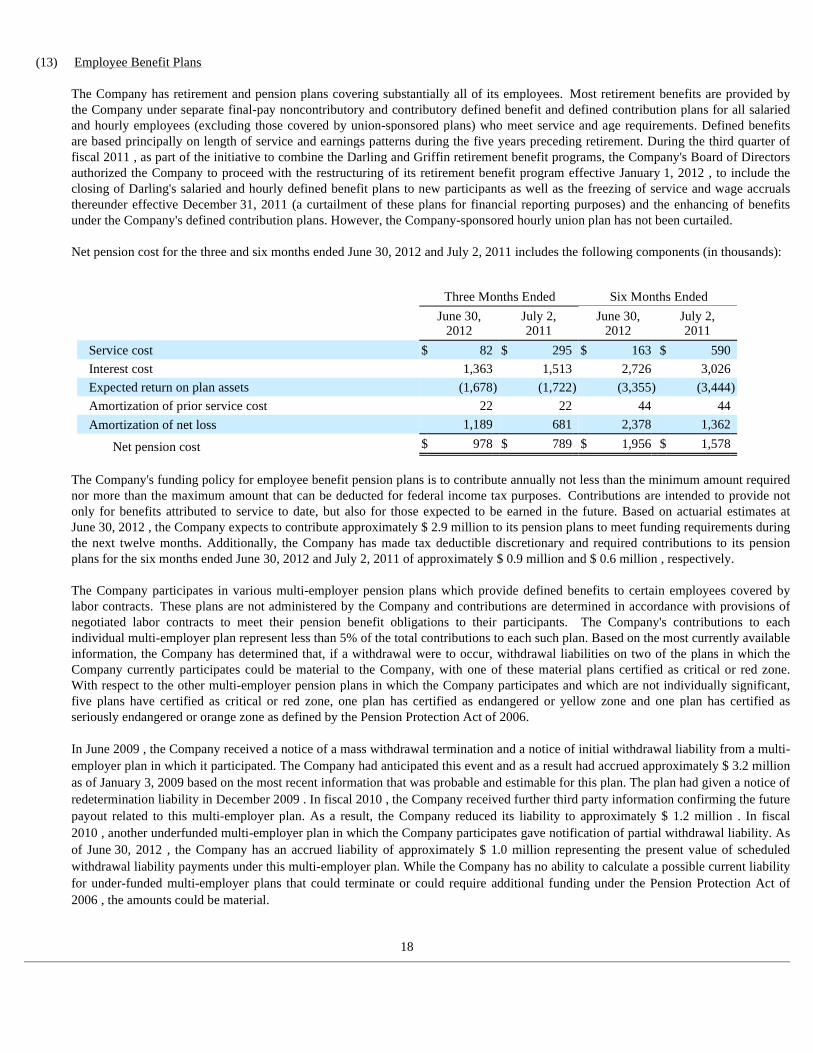
(13) Employee Benefit Plans The Company has retirement and pension plans covering substantially all of its employees. Most retirement benefits are provided by the Company under separate final-pay noncontributory and contributory defined benefit and defined contribution plans for all salaried and hourly employees (excluding those covered by union-sponsored plans) who meet service and age requirements. Defined benefits are based principally on length of service and earnings patterns during the five years preceding retirement. During the third quarter of fiscal 2011 , as part of the initiative to combine the Darling and Griffin retirement benefit programs, the Company's Board of Directors authorized the Company to proceed with the restructuring of its retirement benefit program effective January 1, 2012 , to include the closing of Darling's salaried and hourly defined benefit plans to new participants as well as the freezing of service and wage accruals thereunder effective December 31, 2011 (a curtailment of these plans for financial reporting purposes) and the enhancing of benefits under the Company's defined contribution plans. However, the Company-sponsored hourly union plan has not been curtailed. Net pension cost for the three and six months ended June 30, 2012 and July 2, 2011 includes the following components (in thousands):
The Company's funding policy for employee benefit pension plans is to contribute annually not less than the minimum amount required nor more than the maximum amount that can be deducted for federal income tax purposes. Contributions are intended to provide not only for benefits attributed to service to date, but also for those expected to be earned in the future. Based on actuarial estimates at June 30, 2012 , the Company expects to contribute approximately $ 2.9 million to its pension plans to meet funding requirements during the next twelve months. Additionally, the Company has made tax deductible discretionary and required contributions to its pension plans for the six months ended June 30, 2012 and July 2, 2011 of approximately $ 0.9 million and $ 0.6 million , respectively. The Company participates in various multi-employer pension plans which provide defined benefits to certain employees covered by labor contracts. These plans are not administered by the Company and contributions are determined in accordance with provisions of negotiated labor contracts to meet their pension benefit obligations to their participants. The Company's contributions to each individual multi-employer plan represent less than 5% of the total contributions to each such plan. Based on the most currently available information, the Company has determined that, if a withdrawal were to occur, withdrawal liabilities on two of the plans in which the Company currently participates could be material to the Company, with one of these material plans certified as critical or red zone. With respect to the other multi-employer pension plans in which the Company participates and which are not individually significant, five plans have certified as critical or red zone, one plan has certified as endangered or yellow zone and one plan has certified as seriously endangered or orange zone as defined by the Pension Protection Act of 2006. In June 2009 , the Company received a notice of a mass withdrawal termination and a notice of initial withdrawal liability from a multi-employer plan in which it participated. The Company had anticipated this event and as a result had accrued approximately $ 3.2 million as of January 3, 2009 based on the most recent information that was probable and estimable for this plan. The plan had given a notice of redetermination liability in December 2009 . In fiscal 2010 , the Company received further third party information confirming the future payout related to this multi-employer plan. As a result, the Company reduced its liability to approximately $ 1.2 million . In fiscal 2010 , another underfunded multi-employer plan in which the Company participates gave notification of partial withdrawal liability. As of June 30, 2012 , the Company has an accrued liability of approximately $ 1.0 million representing the present value of scheduled withdrawal liability payments under this multi-employer plan. While the Company has no ability to calculate a possible current liability for under-funded multi-employer plans that could terminate or could require additional funding under the Pension Protection Act of 2006 , the amounts could be material.
18
Three Months Ended Six Months Ended
June 30,
2012 July 2, 2011
June 30, 2012
July 2, 2011
Service cost $ 82 $ 295 $ 163 $ 590 Interest cost 1,363 1,513 2,726 3,026 Expected return on plan assets (1,678 ) (1,722 ) (3,355 ) (3,444 )
Amortization of prior service cost 22 22 44 44 Amortization of net loss 1,189 681 2,378 1,362
Net pension cost $ 978 $ 789 $ 1,956 $ 1,578
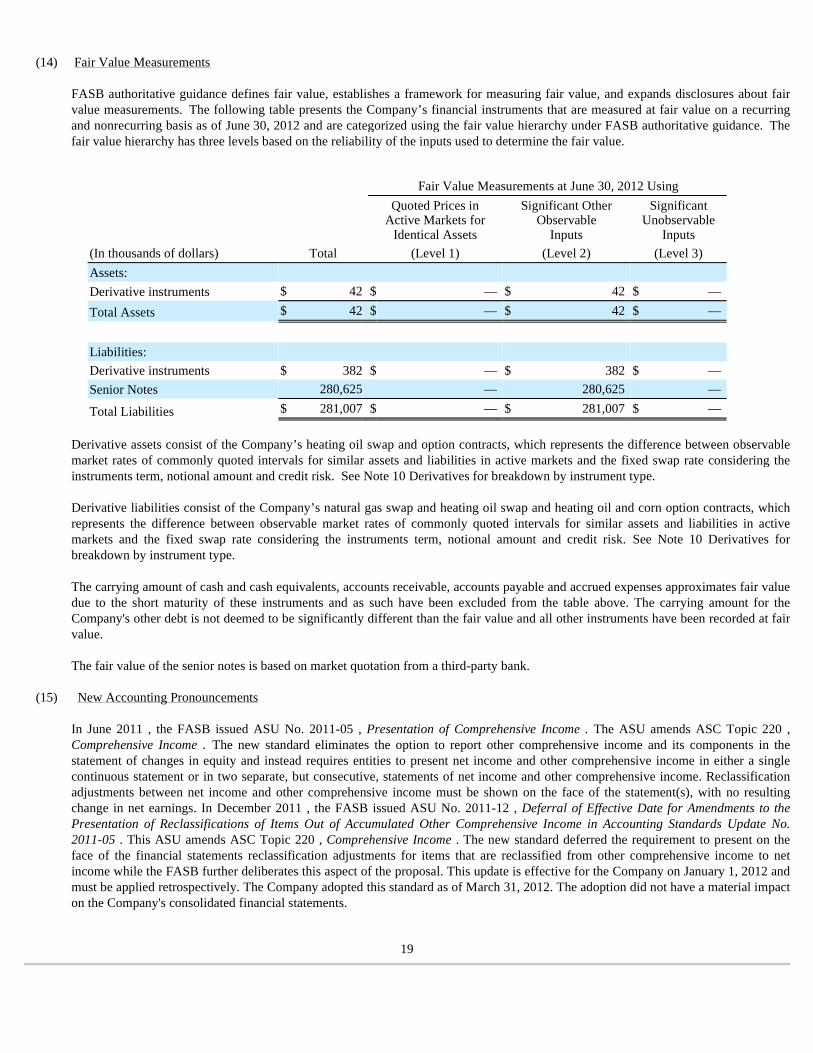
(14) Fair Value Measurements FASB authoritative guidance defines fair value, establishes a framework for measuring fair value, and expands disclosures about fair value measurements. The following table presents the Company’s financial instruments that are measured at fair value on a recurring and nonrecurring basis as of June 30, 2012 and are categorized using the fair value hierarchy under FASB authoritative guidance. The fair value hierarchy has three levels based on the reliability of the inputs used to determine the fair value.
Derivative assets consist of the Company’s heating oil swap and option contracts, which represents the difference between observable market rates of commonly quoted intervals for similar assets and liabilities in active markets and the fixed swap rate considering the instruments term, notional amount and credit risk. See Note 10 Derivatives for breakdown by instrument type. Derivative liabilities consist of the Company’s natural gas swap and heating oil swap and heating oil and corn option contracts, which represents the difference between observable market rates of commonly quoted intervals for similar assets and liabilities in active markets and the fixed swap rate considering the instruments term, notional amount and credit risk. See Note 10 Derivatives for breakdown by instrument type. The carrying amount of cash and cash equivalents, accounts receivable, accounts payable and accrued expenses approximates fair value due to the short maturity of these instruments and as such have been excluded from the table above. The carrying amount for the Company's other debt is not deemed to be significantly different than the fair value and all other instruments have been recorded at fair value. The fair value of the senior notes is based on market quotation from a third-party bank.
(15) New Accounting Pronouncements
In June 2011 , the FASB issued ASU No. 2011-05 , Presentation of Comprehensive Income . The ASU amends ASC Topic 220 , Comprehensive Income . The new standard eliminates the option to report other comprehensive income and its components in the statement of changes in equity and instead requires entities to present net income and other comprehensive income in either a single continuous statement or in two separate, but consecutive, statements of net income and other comprehensive income. Reclassification adjustments between net income and other comprehensive income must be shown on the face of the statement(s), with no resulting change in net earnings. In December 2011 , the FASB issued ASU No. 2011-12 , Deferral of Effective Date for Amendments to the Presentation of Reclassifications of Items Out of Accumulated Other Comprehensive Income in Accounting Standards Update No. 2011-05 . This ASU amends ASC Topic 220 , Comprehensive Income . The new standard deferred the requirement to present on the face of the financial statements reclassification adjustments for items that are reclassified from other comprehensive income to net income while the FASB further deliberates this aspect of the proposal. This update is effective for the Company on January 1, 2012 and must be applied retrospectively. The Company adopted this standard as of March 31, 2012. The adoption did not have a material impact on the Company's consolidated financial statements.
19
Fair Value Measurements at June 30, 2012 Using
Quoted Prices in Active Markets for
Identical Assets
Significant Other Observable
Inputs
Significant Unobservable
Inputs
(In thousands of dollars) Total (Level 1) (Level 2) (Level 3)
Assets:
Derivative instruments $ 42 $ — $ 42 $ —
Total Assets $ 42 $ — $ 42 $ —
Liabilities:
Derivative instruments $ 382 $ — $ 382 $ — Senior Notes 280,625 — 280,625 —
Total Liabilities $ 281,007 $ — $ 281,007 $ —
In September 2011 , the FASB issued ASU No. 2011-08 , Testing Goodwill for Impairment . The ASU amends ASC Topic 350 , Intangibles - Goodwill and Other . The new standard is intended to reduce the cost and complexity of the annual goodwill impairment test by providing entities an option to perform a “qualitative” assessment to determine whether further impairment testing is necessary. Specifically, an entity has the option to first assess qualitative factors to determine whether it is necessary to perform the current two-step test. If an entity believes, as a result of its qualitative assessment, that it is more-likely-than-not that the fair value of a reporting unit is less than its carrying amount, the quantitative impairment test is required. Otherwise, no further testing is required. This standard is effective for annual and interim goodwill impairment tests performed for fiscal years beginning after December 15, 2011. Early adoption is permissible. The Company adopted this standard in the first quarter of 2012 and the adoption did not have a material impact on the Company's consolidated financial statements. In July 2012 , the FASB issued ASU No. 2012-02 , Testing Indefinite-Lived Intangible Assets for Impairment . The ASU amends ASC Topic 350 , Intangibles - Goodwill and Other . The new standard is intended to reduce the cost and complexity of performing an impairment test for indefinite-lived intangible assets by providing entities an option to perform a "qualitative" assessment to determine whether further impairment testing is necessary. The new standard allows an entity to first assess qualitative factors to determine if it is more likely than not that the fair value of an indefinite-lived intangible asset is less than its carrying amount. If based on its qualitative assessment an entity concludes it is more likely than not that the fair value of an indefinite-lived intangible asset is less than its carrying amount, quantitative impairment testing is required. However, if an entity concludes otherwise, quantitative impairment testing is not required. The standards update is effective for annual and interim impairment tests performed for fiscal years beginning after September 15, 2012, with early adoption permitted. The Company is currently evaluating the impact of adopting this standard.
(16) Guarantor Financial Information The Company's Notes (see Note 8) are guaranteed on an unsecured basis by the Company's 100% directly and indirectly owned subsidiaries Darling National, Griffin and its subsidiary Craig Protein (collectively, the "Guarantors"). The Guarantors fully and unconditionally guaranteed the Notes on a joint and several basis. The following financial statements present condensed consolidating financial data for (i) Darling, the issuer of the Notes, (ii) the combined Guarantors, (iii) the combined other subsidiaries of the Company that did not guarantee the Notes (the "Non-guarantors"), and (iv) eliminations necessary to arrive at the Company's consolidated financial statements, which include condensed consolidated balance sheets as of June 30, 2012 and December 31, 2011 , and the condensed consolidating statements of operations, the condensed consolidating statements of comprehensive income and the condensed consolidating statements of cash flows for the three and six months ended June 30, 2012 and July 2, 2011 .
20
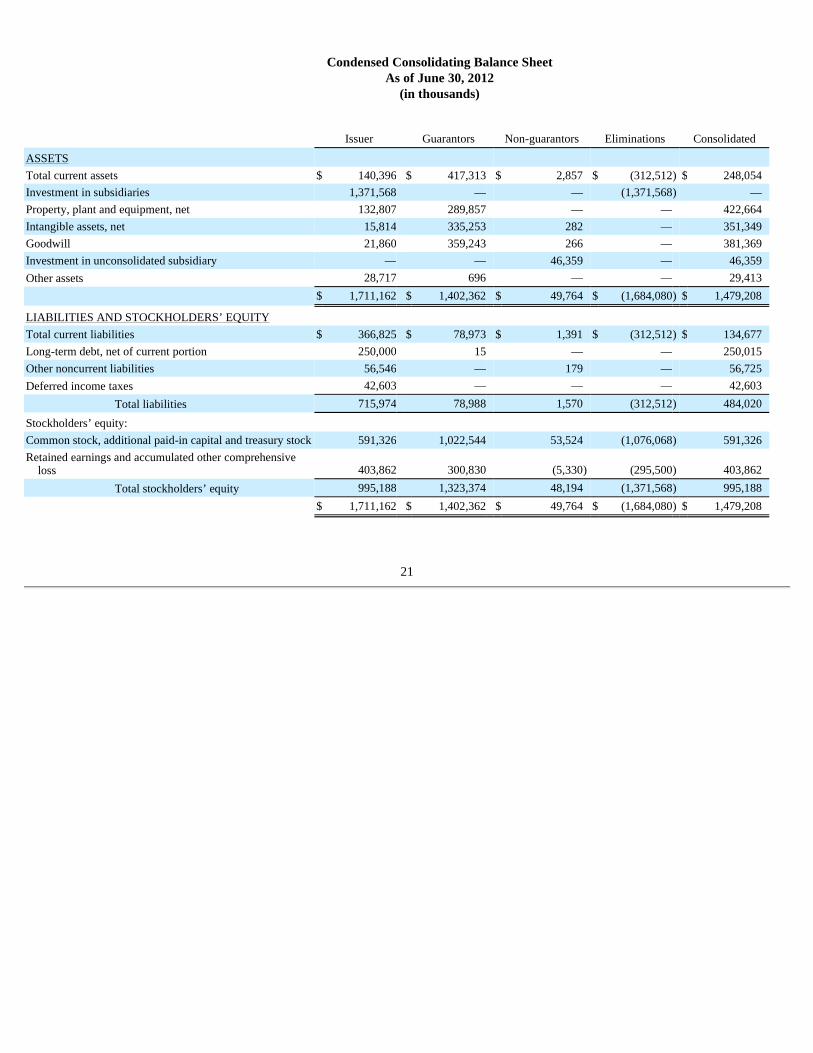
Condensed Consolidating Balance Sheet As of June 30, 2012
(in thousands)
21
Issuer Guarantors Non-guarantors Eliminations Consolidated
ASSETS Total current assets $ 140,396 $ 417,313 $ 2,857 $ (312,512 ) $ 248,054 Investment in subsidiaries 1,371,568 — — (1,371,568 ) — Property, plant and equipment, net 132,807 289,857 — — 422,664 Intangible assets, net 15,814 335,253 282 — 351,349 Goodwill 21,860 359,243 266 — 381,369 Investment in unconsolidated subsidiary — — 46,359 — 46,359 Other assets 28,717 696 — — 29,413 $ 1,711,162 $ 1,402,362 $ 49,764 $ (1,684,080 ) $ 1,479,208
LIABILITIES AND STOCKHOLDERS’ EQUITY Total current liabilities $ 366,825 $ 78,973 $ 1,391 $ (312,512 ) $ 134,677 Long-term debt, net of current portion 250,000 15 — — 250,015 Other noncurrent liabilities 56,546 — 179 — 56,725 Deferred income taxes 42,603 — — — 42,603
Total liabilities 715,974 78,988 1,570 (312,512 ) 484,020 Stockholders’ equity: Common stock, additional paid-in capital and treasury stock 591,326 1,022,544 53,524 (1,076,068 ) 591,326 Retained earnings and accumulated other comprehensive
loss 403,862 300,830 (5,330 ) (295,500 ) 403,862 Total stockholders’ equity 995,188 1,323,374 48,194 (1,371,568 ) 995,188
$ 1,711,162 $ 1,402,362 $ 49,764 $ (1,684,080 ) $ 1,479,208
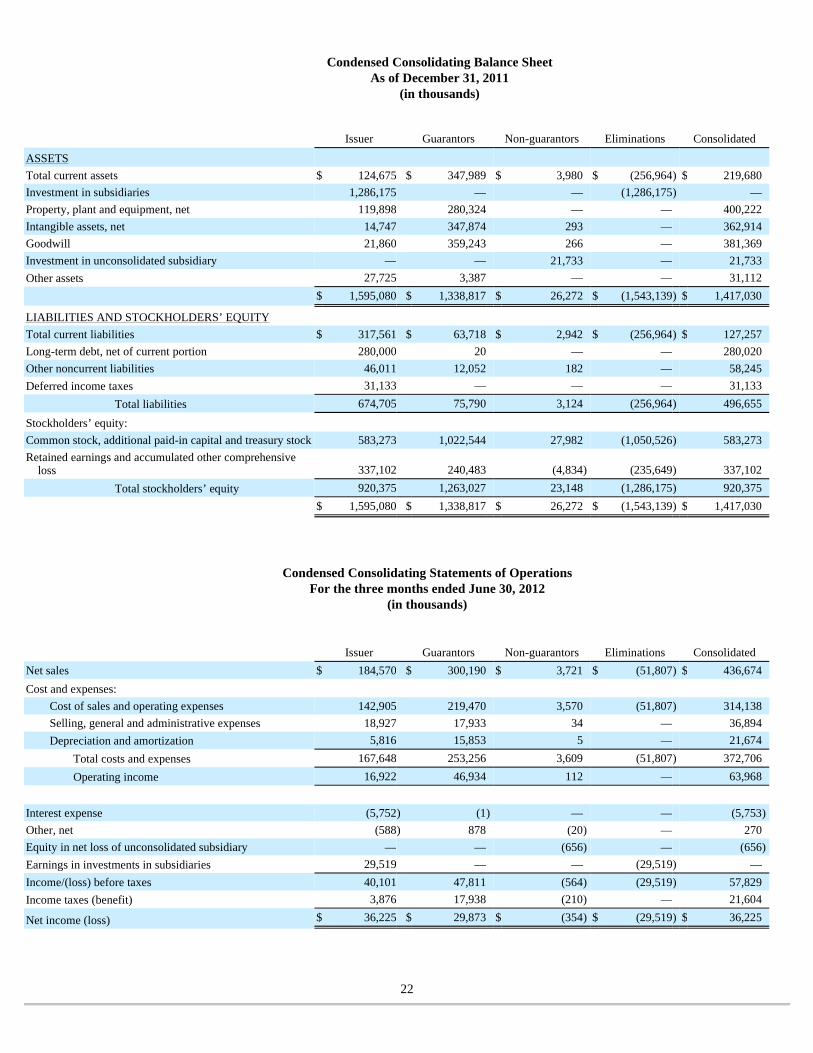
Condensed Consolidating Balance Sheet As of December 31, 2011
(in thousands)
Condensed Consolidating Statements of Operations
For the three months ended June 30, 2012 (in thousands)
22
Issuer Guarantors Non-guarantors Eliminations Consolidated
ASSETS Total current assets $ 124,675 $ 347,989 $ 3,980 $ (256,964 ) $ 219,680 Investment in subsidiaries 1,286,175 — — (1,286,175 ) — Property, plant and equipment, net 119,898 280,324 — — 400,222 Intangible assets, net 14,747 347,874 293 — 362,914 Goodwill 21,860 359,243 266 — 381,369 Investment in unconsolidated subsidiary — — 21,733 — 21,733 Other assets 27,725 3,387 — — 31,112 $ 1,595,080 $ 1,338,817 $ 26,272 $ (1,543,139 ) $ 1,417,030
LIABILITIES AND STOCKHOLDERS’ EQUITY Total current liabilities $ 317,561 $ 63,718 $ 2,942 $ (256,964 ) $ 127,257 Long-term debt, net of current portion 280,000 20 — — 280,020 Other noncurrent liabilities 46,011 12,052 182 — 58,245 Deferred income taxes 31,133 — — — 31,133
Total liabilities 674,705 75,790 3,124 (256,964 ) 496,655 Stockholders’ equity: Common stock, additional paid-in capital and treasury stock 583,273 1,022,544 27,982 (1,050,526 ) 583,273 Retained earnings and accumulated other comprehensive
loss 337,102 240,483 (4,834 ) (235,649 ) 337,102 Total stockholders’ equity 920,375 1,263,027 23,148 (1,286,175 ) 920,375
$ 1,595,080 $ 1,338,817 $ 26,272 $ (1,543,139 ) $ 1,417,030
Issuer Guarantors Non-guarantors Eliminations Consolidated
Net sales $ 184,570 $ 300,190 $ 3,721 $ (51,807 ) $ 436,674 Cost and expenses:
Cost of sales and operating expenses 142,905 219,470 3,570 (51,807 ) 314,138 Selling, general and administrative expenses 18,927 17,933 34 — 36,894 Depreciation and amortization 5,816 15,853 5 — 21,674
Total costs and expenses 167,648 253,256 3,609 (51,807 ) 372,706 Operating income 16,922 46,934 112 — 63,968
Interest expense (5,752 ) (1 ) — — (5,753 )
Other, net (588 ) 878 (20 ) — 270 Equity in net loss of unconsolidated subsidiary — — (656 ) — (656 )
Earnings in investments in subsidiaries 29,519 — — (29,519 ) — Income/(loss) before taxes 40,101 47,811 (564 ) (29,519 ) 57,829 Income taxes (benefit) 3,876 17,938 (210 ) — 21,604
Net income (loss) $ 36,225 $ 29,873 $ (354 ) $ (29,519 ) $ 36,225
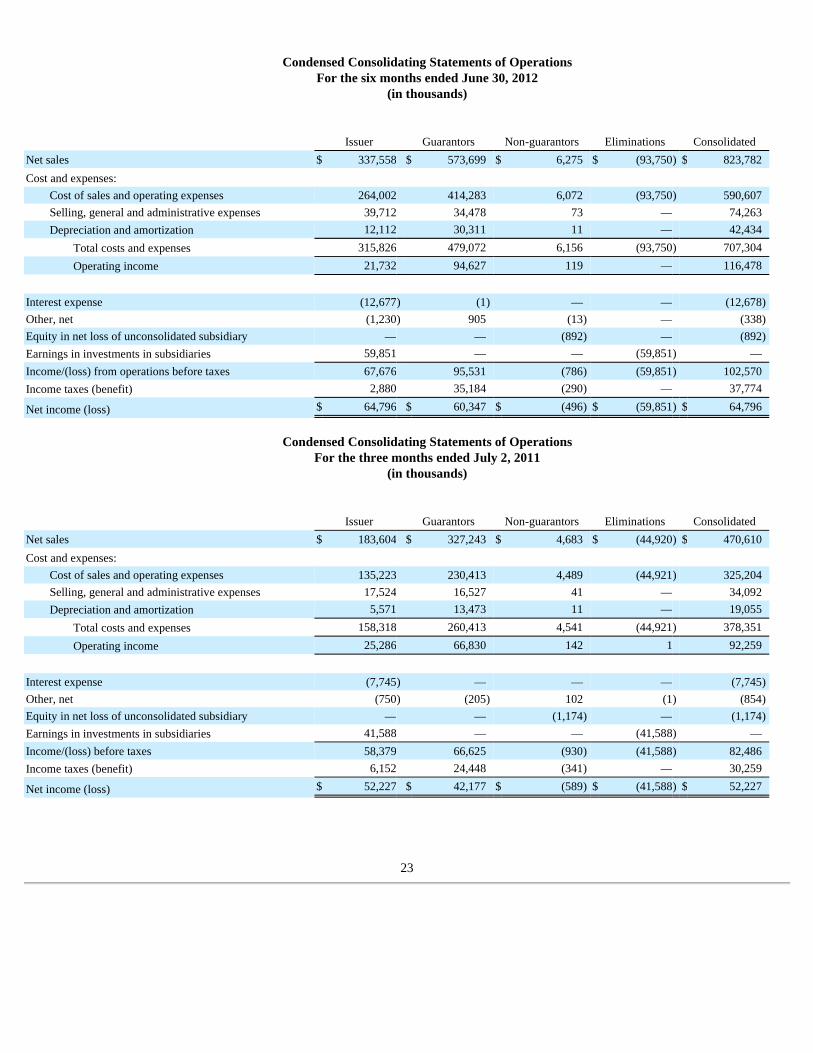
Condensed Consolidating Statements of Operations For the six months ended June 30, 2012
(in thousands)
Condensed Consolidating Statements of Operations
For the three months ended July 2, 2011 (in thousands)
23
Issuer Guarantors Non-guarantors Eliminations Consolidated
Net sales $ 337,558 $ 573,699 $ 6,275 $ (93,750 ) $ 823,782 Cost and expenses:
Cost of sales and operating expenses 264,002 414,283 6,072 (93,750 ) 590,607 Selling, general and administrative expenses 39,712 34,478 73 — 74,263 Depreciation and amortization 12,112 30,311 11 — 42,434
Total costs and expenses 315,826 479,072 6,156 (93,750 ) 707,304 Operating income 21,732 94,627 119 — 116,478
Interest expense (12,677 ) (1 ) — — (12,678 )
Other, net (1,230 ) 905 (13 ) — (338 )
Equity in net loss of unconsolidated subsidiary — — (892 ) — (892 )
Earnings in investments in subsidiaries 59,851 — — (59,851 ) — Income/(loss) from operations before taxes 67,676 95,531 (786 ) (59,851 ) 102,570 Income taxes (benefit) 2,880 35,184 (290 ) — 37,774
Net income (loss) $ 64,796 $ 60,347 $ (496 ) $ (59,851 ) $ 64,796
Issuer Guarantors Non-guarantors Eliminations Consolidated
Net sales $ 183,604 $ 327,243 $ 4,683 $ (44,920 ) $ 470,610 Cost and expenses:
Cost of sales and operating expenses 135,223 230,413 4,489 (44,921 ) 325,204 Selling, general and administrative expenses 17,524 16,527 41 — 34,092 Depreciation and amortization 5,571 13,473 11 — 19,055
Total costs and expenses 158,318 260,413 4,541 (44,921 ) 378,351 Operating income 25,286 66,830 142 1 92,259
Interest expense (7,745 ) — — — (7,745 )
Other, net (750 ) (205 ) 102 (1 ) (854 )
Equity in net loss of unconsolidated subsidiary — — (1,174 ) — (1,174 )
Earnings in investments in subsidiaries 41,588 — — (41,588 ) — Income/(loss) before taxes 58,379 66,625 (930 ) (41,588 ) 82,486 Income taxes (benefit) 6,152 24,448 (341 ) — 30,259
Net income (loss) $ 52,227 $ 42,177 $ (589 ) $ (41,588 ) $ 52,227
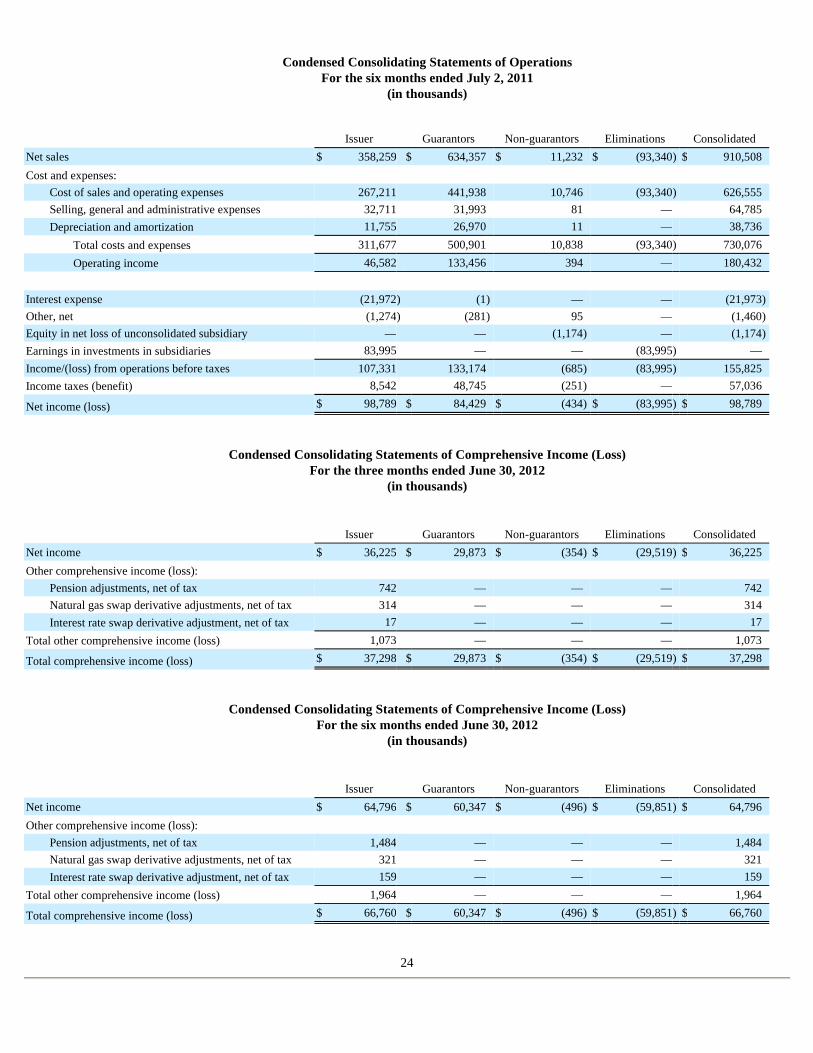
Condensed Consolidating Statements of Operations For the six months ended July 2, 2011
(in thousands)
Condensed Consolidating Statements of Comprehensive Income (Loss) For the three months ended June 30, 2012
(in thousands)
Condensed Consolidating Statements of Comprehensive Income (Loss) For the six months ended June 30, 2012
(in thousands)
24
Issuer Guarantors Non-guarantors Eliminations Consolidated
Net sales $ 358,259 $ 634,357 $ 11,232 $ (93,340 ) $ 910,508 Cost and expenses:
Cost of sales and operating expenses 267,211 441,938 10,746 (93,340 ) 626,555 Selling, general and administrative expenses 32,711 31,993 81 — 64,785 Depreciation and amortization 11,755 26,970 11 — 38,736
Total costs and expenses 311,677 500,901 10,838 (93,340 ) 730,076 Operating income 46,582 133,456 394 — 180,432
Interest expense (21,972 ) (1 ) — — (21,973 )
Other, net (1,274 ) (281 ) 95 — (1,460 )
Equity in net loss of unconsolidated subsidiary — — (1,174 ) — (1,174 )
Earnings in investments in subsidiaries 83,995 — — (83,995 ) — Income/(loss) from operations before taxes 107,331 133,174 (685 ) (83,995 ) 155,825 Income taxes (benefit) 8,542 48,745 (251 ) — 57,036
Net income (loss) $ 98,789 $ 84,429 $ (434 ) $ (83,995 ) $ 98,789
Issuer Guarantors Non-guarantors Eliminations Consolidated
Net income $ 36,225 $ 29,873 $ (354 ) $ (29,519 ) $ 36,225 Other comprehensive income (loss):
Pension adjustments, net of tax 742 — — — 742 Natural gas swap derivative adjustments, net of tax 314 — — — 314 Interest rate swap derivative adjustment, net of tax 17 — — — 17
Total other comprehensive income (loss) 1,073 — — — 1,073
Total comprehensive income (loss) $ 37,298 $ 29,873 $ (354 ) $ (29,519 ) $ 37,298
Issuer Guarantors Non-guarantors Eliminations Consolidated
Net income $ 64,796 $ 60,347 $ (496 ) $ (59,851 ) $ 64,796 Other comprehensive income (loss):
Pension adjustments, net of tax 1,484 — — — 1,484 Natural gas swap derivative adjustments, net of tax 321 — — — 321 Interest rate swap derivative adjustment, net of tax 159 — — — 159
Total other comprehensive income (loss) 1,964 — — — 1,964
Total comprehensive income (loss) $ 66,760 $ 60,347 $ (496 ) $ (59,851 ) $ 66,760
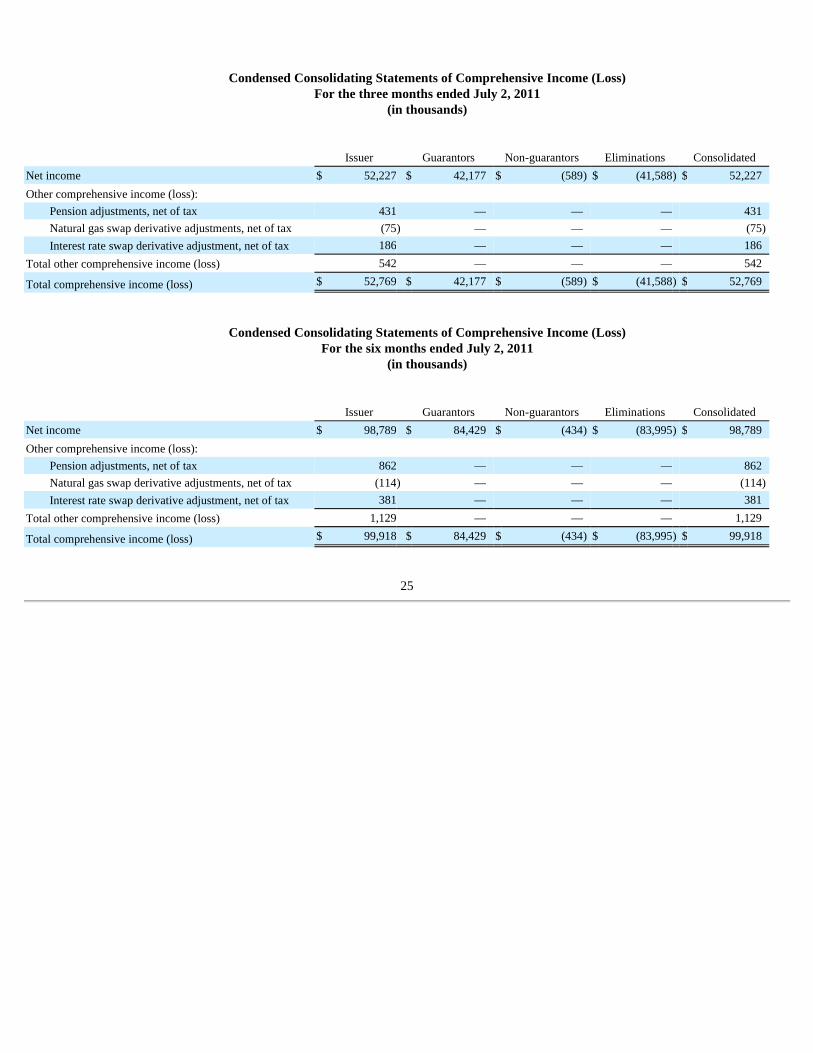
Condensed Consolidating Statements of Comprehensive Income (Loss)
For the three months ended July 2, 2011 (in thousands)
Condensed Consolidating Statements of Comprehensive Income (Loss) For the six months ended July 2, 2011
(in thousands)
25
Issuer Guarantors Non-guarantors Eliminations Consolidated
Net income $ 52,227 $ 42,177 $ (589 ) $ (41,588 ) $ 52,227 Other comprehensive income (loss):
Pension adjustments, net of tax 431 — — — 431 Natural gas swap derivative adjustments, net of tax (75 ) — — — (75 )
Interest rate swap derivative adjustment, net of tax 186 — — — 186 Total other comprehensive income (loss) 542 — — — 542
Total comprehensive income (loss) $ 52,769 $ 42,177 $ (589 ) $ (41,588 ) $ 52,769
Issuer Guarantors Non-guarantors Eliminations Consolidated
Net income $ 98,789 $ 84,429 $ (434 ) $ (83,995 ) $ 98,789 Other comprehensive income (loss):
Pension adjustments, net of tax 862 — — — 862 Natural gas swap derivative adjustments, net of tax (114 ) — — — (114 )
Interest rate swap derivative adjustment, net of tax 381 — — — 381 Total other comprehensive income (loss) 1,129 — — — 1,129
Total comprehensive income (loss) $ 99,918 $ 84,429 $ (434 ) $ (83,995 ) $ 99,918

Condensed Consolidating Statements of Cash Flows For the six months ended June 30, 2012
(in thousands)
26
Issuer Guarantors Non-guarantors Eliminations Consolidated
Cash flows from operating activities: Net income $ 64,796 $ 60,347 $ (496 ) $ (59,851 ) $ 64,796 Earnings in investments in subsidiaries (59,851 ) — — 59,851 — Other operating cash flows 108,858 (29,870 ) (924 ) — 78,064
Net cash provided by operating activities 113,803 30,477 (1,420 ) — 142,860
Cash flows from investing activities: Capital expenditures (23,682 ) (29,814 ) — — (53,496 )
Acquisitions (2,000 ) — — — (2,000 )
Investment in subsidiaries and affiliates (25,542 ) — (25,518 ) 25,542 (25,518 )
Gross proceeds from sale of property, plant and equipment and other assets 1,214 1,302 — — 2,516 Net cash used in investing activities (50,010 ) (28,512 ) (25,518 ) 25,542 (78,498 )
Cash flows from financing activities: Payments on long-term debt (30,000 ) (5 ) — — (30,005 )
Issuances of common stock 64 — — — 64 Contributions from parent — — 25,542 (25,542 ) — Minimum withholding taxes paid on stock awards (2,214 ) — — — (2,214 )
Excess tax benefits from stock-based compensation 1,111 — — — 1,111 Net cash used in financing activities (31,039 ) (5 ) 25,542 (25,542 ) (31,044 )
Net increase/(decrease) in cash and cash equivalents 32,754 1,960 (1,396 ) — 33,318 Cash and cash equivalents at beginning of year 35,207 1,773 1,956 — 38,936
Cash and cash equivalents at end of year $ 67,961 $ 3,733 $ 560 $ — $ 72,254
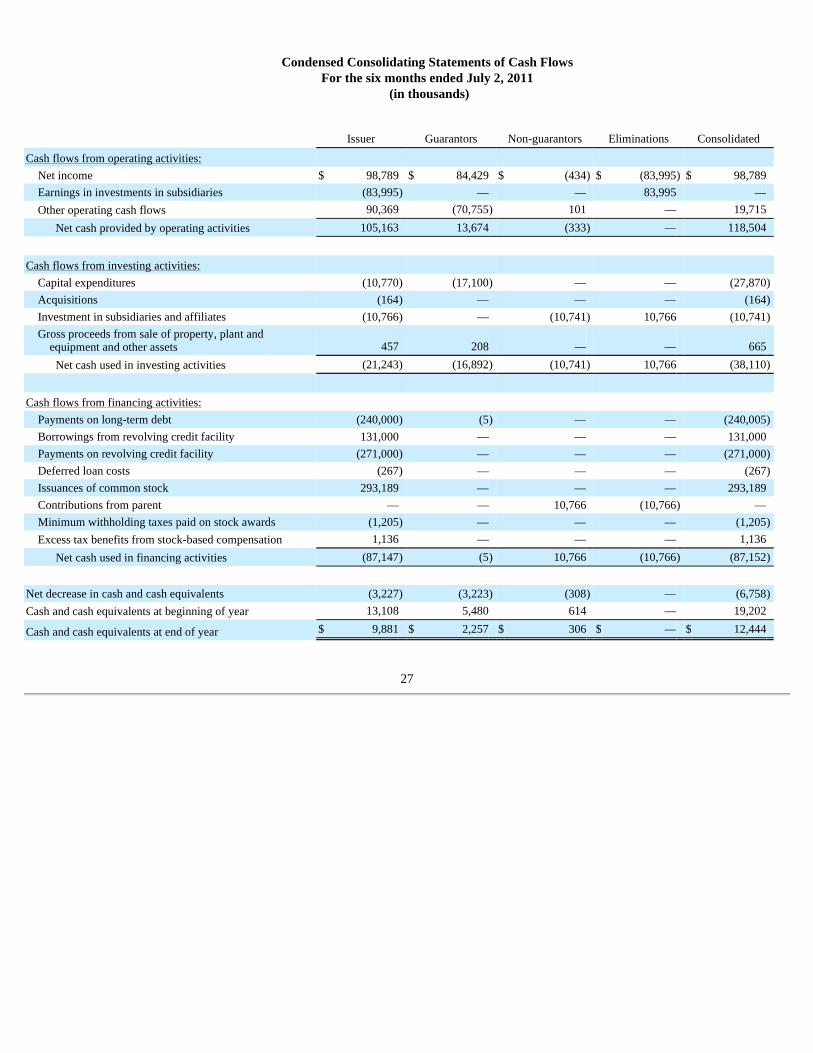
Condensed Consolidating Statements of Cash Flows For the six months ended July 2, 2011
(in thousands)
27
Issuer Guarantors Non-guarantors Eliminations Consolidated
Cash flows from operating activities: Net income $ 98,789 $ 84,429 $ (434 ) $ (83,995 ) $ 98,789 Earnings in investments in subsidiaries (83,995 ) — — 83,995 — Other operating cash flows 90,369 (70,755 ) 101 — 19,715
Net cash provided by operating activities 105,163 13,674 (333 ) — 118,504
Cash flows from investing activities: Capital expenditures (10,770 ) (17,100 ) — — (27,870 )
Acquisitions (164 ) — — — (164 )
Investment in subsidiaries and affiliates (10,766 ) — (10,741 ) 10,766 (10,741 )
Gross proceeds from sale of property, plant and equipment and other assets 457 208 — — 665 Net cash used in investing activities (21,243 ) (16,892 ) (10,741 ) 10,766 (38,110 )
Cash flows from financing activities: Payments on long-term debt (240,000 ) (5 ) — — (240,005 )
Borrowings from revolving credit facility 131,000 — — — 131,000 Payments on revolving credit facility (271,000 ) — — — (271,000 )
Deferred loan costs (267 ) — — — (267 )
Issuances of common stock 293,189 — — — 293,189 Contributions from parent — — 10,766 (10,766 ) — Minimum withholding taxes paid on stock awards (1,205 ) — — — (1,205 )
Excess tax benefits from stock-based compensation 1,136 — — — 1,136 Net cash used in financing activities (87,147 ) (5 ) 10,766 (10,766 ) (87,152 )
Net decrease in cash and cash equivalents (3,227 ) (3,223 ) (308 ) — (6,758 )
Cash and cash equivalents at beginning of year 13,108 5,480 614 — 19,202
Cash and cash equivalents at end of year $ 9,881 $ 2,257 $ 306 $ — $ 12,444
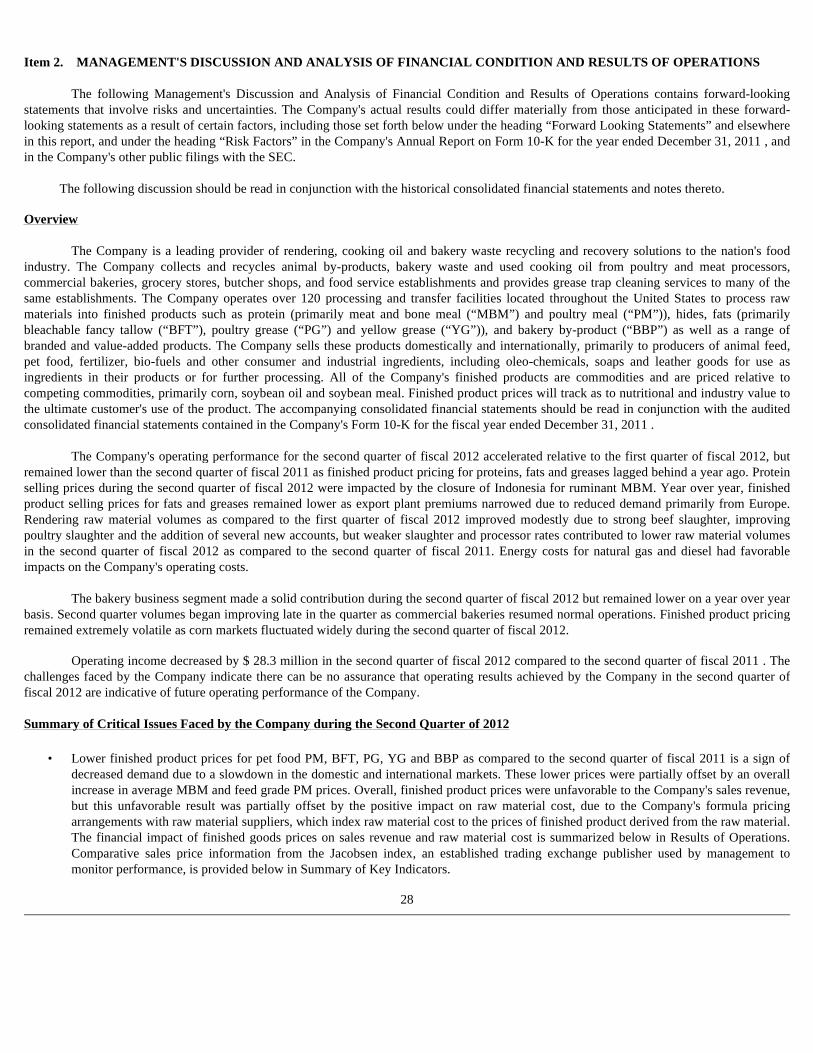
Item 2. MANAGEMENT'S DISCUSSION AND ANALYSIS OF FINANCIAL CONDITION AND RESULTS OF OPERATIONS
The following Management's Discussion and Analysis of Financial Condition and Results of Operations contains forward-looking statements that involve risks and uncertainties. The Company's actual results could differ materially from those anticipated in these forward-looking statements as a result of certain factors, including those set forth below under the heading “Forward Looking Statements” and elsewhere in this report, and under the heading “Risk Factors” in the Company's Annual Report on Form 10-K for the year ended December 31, 2011 , and in the Company's other public filings with the SEC.
The following discussion should be read in conjunction with the historical consolidated financial statements and notes thereto. Overview
The Company is a leading provider of rendering, cooking oil and bakery waste recycling and recovery solutions to the nation's food industry. The Company collects and recycles animal by-products, bakery waste and used cooking oil from poultry and meat processors, commercial bakeries, grocery stores, butcher shops, and food service establishments and provides grease trap cleaning services to many of the same establishments. The Company operates over 120 processing and transfer facilities located throughout the United States to process raw materials into finished products such as protein (primarily meat and bone meal (“MBM”) and poultry meal (“PM”)), hides, fats (primarily bleachable fancy tallow (“BFT”), poultry grease (“PG”) and yellow grease (“YG”)), and bakery by-product (“BBP”) as well as a range of branded and value-added products. The Company sells these products domestically and internationally, primarily to producers of animal feed, pet food, fertilizer, bio-fuels and other consumer and industrial ingredients, including oleo-chemicals, soaps and leather goods for use as ingredients in their products or for further processing. All of the Company's finished products are commodities and are priced relative to competing commodities, primarily corn, soybean oil and soybean meal. Finished product prices will track as to nutritional and industry value to the ultimate customer's use of the product. The accompanying consolidated financial statements should be read in conjunction with the audited consolidated financial statements contained in the Company's Form 10-K for the fiscal year ended December 31, 2011 .
The Company's operating performance for the second quarter of fiscal 2012 accelerated relative to the first quarter of fiscal 2012, but remained lower than the second quarter of fiscal 2011 as finished product pricing for proteins, fats and greases lagged behind a year ago. Protein selling prices during the second quarter of fiscal 2012 were impacted by the closure of Indonesia for ruminant MBM. Year over year, finished product selling prices for fats and greases remained lower as export plant premiums narrowed due to reduced demand primarily from Europe. Rendering raw material volumes as compared to the first quarter of fiscal 2012 improved modestly due to strong beef slaughter, improving poultry slaughter and the addition of several new accounts, but weaker slaughter and processor rates contributed to lower raw material volumes in the second quarter of fiscal 2012 as compared to the second quarter of fiscal 2011. Energy costs for natural gas and diesel had favorable impacts on the Company's operating costs.
The bakery business segment made a solid contribution during the second quarter of fiscal 2012 but remained lower on a year over year
basis. Second quarter volumes began improving late in the quarter as commercial bakeries resumed normal operations. Finished product pricing remained extremely volatile as corn markets fluctuated widely during the second quarter of fiscal 2012.
Operating income decreased by $ 28.3 million in the second quarter of fiscal 2012 compared to the second quarter of fiscal 2011 . The
challenges faced by the Company indicate there can be no assurance that operating results achieved by the Company in the second quarter of fiscal 2012 are indicative of future operating performance of the Company. Summary of Critical Issues Faced by the Company during the Second Quarter of 2012
28
• Lower finished product prices for pet food PM, BFT, PG, YG and BBP as compared to the second quarter of fiscal 2011 is a sign of decreased demand due to a slowdown in the domestic and international markets. These lower prices were partially offset by an overall increase in average MBM and feed grade PM prices. Overall, finished product prices were unfavorable to the Company's sales revenue, but this unfavorable result was partially offset by the positive impact on raw material cost, due to the Company's formula pricing arrangements with raw material suppliers, which index raw material cost to the prices of finished product derived from the raw material. The financial impact of finished goods prices on sales revenue and raw material cost is summarized below in Results of Operations. Comparative sales price information from the Jacobsen index, an established trading exchange publisher used by management to monitor performance, is provided below in Summary of Key Indicators.
Summary of Critical Issues and Known Trends Faced by the Company in 2012 and Thereafter Critical Issues and Challenges:
Worldwide Government Policies
29
• Lower raw material volumes were collected from suppliers during the second quarter of fiscal 2012 as compared to the second quarter of fiscal 2011 . Management believes the decline in raw material volume is due to weaker slaughter and processor rates resulting from a slowdown of the economy that contributed to a decline in raw material volumes collected by the Company during the quarter. The financial impact of lower raw material volumes is summarized below in Results of Operations.
• Energy prices for natural gas decreased and diesel fuel decreased during the second quarter of fiscal 2012 as compared to the second quarter of fiscal 2011 . The financial impact of energy costs is summarized below in Results of Operations.
• The continuing drought in the Midwest and other parts of the United States poses a severe threat to crops, most likely resulting in a significant decline in production for the upcoming crop year. Prices of grains and grain products have recently increased to near historical highs. While price increases of these grains and ingredients may be favorable for the selling price of the Company's finished products in the short term, the severity of these price increases could be detrimental to the future production economics of meat and poultry. A decrease in production by the meat and poultry processors as a result of these economic conditions could have a negative impact on the availability, quantity and quality of raw materials available to the Company in the future. In addition, the impact of the drought on U.S. renewable fuel policy, including the National Renewable Fuel Standard Program ("RFS2"), is unknown at this time but any adjustments to mandated quantities may adversely affect the Company's finished product prices.
• During the second quarter of fiscal 2012, Indonesia closed its markets to MBM derived from U.S. beef in response to a new, single case of BSE, and those markets remain closed as of the filing date of this Report. If the Indonesia market continues to remain closed, there could be an impact on the Company's West Coast MBM market which could have a negative impact on the Company's earnings in future periods.
• The Company collected lower raw material volumes in the first six months of fiscal 2012 as compared to the first six months of fiscal 2011 due to weaker slaughter and processor rates as a result of the slowdown of the economy. If this reduction continues or accelerates, there could be a negative impact on the Company's ability to obtain raw materials for the Company's operations.
• Finished product prices for MBM, BFT, PG, YG and BBP commodities have decreased during the first six months of fiscal 2012 as compared to the same period of fiscal 2011. No assurance can be given that this decrease in commodity prices for various proteins, fats and bakery products will not continue in the future, as commodity prices are volatile by their nature. A further decrease in commodity prices could have a significant impact on the Company’s earnings for the remainder of fiscal 2012 and into future periods.
• The Company consumes significant volumes of natural gas to operate boilers in its plants, which generate steam to heat raw material. Natural gas prices represent a significant cost of factory operation included in cost of sales. The Company also consumes significant volumes of diesel fuel to operate its fleet of tractors and trucks used to collect raw material. Diesel fuel prices represent a significant component of cost of collection expenses included in cost of sales. Lower natural gas and diesel fuel prices were incurred during the second quarter of fiscal 2012 as compared to the same period of fiscal 2011. These prices can be volatile and there can be no assurance that these prices will not increase in the near future, thereby representing an ongoing challenge to the Company’s operating results for future periods. A material increase in energy prices for natural gas and/or diesel fuel over a sustained period of time could materially adversely affect the Company’s business, financial condition and results of operations.
• Pursuant to the requirements established by the Energy Independence and Security Act of 2007, on February 3, 2010 the EPA finalized regulations for RFS2. The regulation mandates the domestic use of biomass-based diesel (biodiesel or renewable diesel) of 1.0 billion gallons in 2012. Beyond 2012 the regulation requires a minimum of 1.0 billion gallons of biomass-based diesel for each year through 2022, which amount is subject to increase by the EPA Administrator. On June 20, 2011, the EPA issued a proposed rule which would require 1.28 billion gallons for the calendar year 2013. Biomass-based diesel also qualifies to fulfill the non-specified portion of the advanced bio-fuel requirement. In order to qualify as a “renewable fuel” each type of fuel from each type of feedstock is required to
lower greenhouse gas emissions (“GHG”) by levels specified in the regulation. The EPA has determined that bio-fuels (either biodiesel or renewable diesel) produced from waste oils, fats and greases result in an 86% reduction in GHG emissions, exceeding the 50% requirement established by the regulation. Prices for the Company’s finished products may be impacted by worldwide government policies relating to renewable fuels and GHG. Programs like RFS2 and tax credits for bio-fuels both in the U.S. and abroad may positively impact the demand for the Company’s finished products. Accordingly, changes to, a failure to enforce or discontinuing of any of these programs could have a negative impact on the Company’s business and results of operations.
Other Food Safety and Regulatory Issues
30
• The Company’s exports are subject to the imposition of tariffs, quotas, trade barriers and other trade protection measures imposed by foreign countries regarding the import of the Company’s MBM, BFT and YG. General economic and political conditions as well as the closing of borders by foreign countries to the import of the Company’s products due to animal disease or other perceived health or safety issues impact the Company. As a result trade policies of both U.S and foreign countries could have a negative impact on the Company’s business and results of operations.
• The emergence of diseases such as 2009 H1N1 flu (initially known as “Swine Flu”) and highly pathogenic strains of avian influenza, including H5N1 and H7N3 (“Bird Flu”), that are in or associated with animals and have the potential to also threaten humans has created concern that such diseases could spread and cause a global pandemic. Wild migratory birds are usually responsible for spreading Bird Flu to domestic poultry. Outbreaks of the H5N1 strain continue to occur in Asia and the Middle East, but this strain has not been reported in North America. Mexican health authorities, however, are working to eradicate the H7N3 strain following a July 2012 outbreak of Bird Flu among Mexican commercial poultry farms. Whenever a highly pathogenic strain of Bird Flu occurs in poultry located in populated areas, there is potential for the virus to spread to humans; however, as of the date of this report, no cases of human illness have been linked to the Mexican H7N3 Bird Flu outbreak. Even though the Swine Flu or Bird Flu has not caused a pandemic, governments may be pressured to address these concerns and prohibit imports of animals, meat and animal by-products from countries or regions where the disease is detected. The occurrence of Swine Flu, Bird Flu or any other disease in the United States that is correctly or incorrectly linked to animals and has a negative impact on meat or poultry consumption or animal production could have a material negative impact on the volume of raw materials available to the Company or the demand for the Company's finished products.
• Effective August 1997, the FDA promulgated a rule prohibiting the use of mammalian proteins, with some exceptions, in feeds for cattle, sheep and other ruminant animals (referred to herein as the “BSE Feed Rule”) to prevent further spread of BSE, commonly referred to as “mad cow disease.” Detection of the first case of BSE in the United States in December 2003 resulted in additional U.S. government regulations, finished product export restrictions by foreign governments, market price fluctuations for the Company's finished products and reduced demand for beef and beef products by consumers. Even though the export markets for U.S. beef rebounded to record volumes in fiscal 2011 that exceeded pre-BSE levels, most export markets remain closed to MBM derived from U.S. beef. On April 24, 2012, the United States Department of Agriculture (“USDA”) confirmed the occurrence of a new, single case of BSE in a dairy cow in central California. Even though the USDA confirmed that material derived from the cow did not enter the food or feed supply and that this appears to be a single, isolated incident of "atypical" BSE which is not spread through feed and does not affect humans, Indonesia closed its markets to MBM derived from U.S. beef, and those markets remain closed as of the filing date of this Report. The Company does not expect this trade disruption to have material impact on the Company's business, financial condition or results of operations. Continued concern about BSE in the United States may result in additional regulatory and market related challenges that may affect the Company's operations or increase the Company's operating costs.
• With respect to BSE in the United States, on October 26, 2009, the FDA began enforcing new regulations intended to further reduce the risk of spreading BSE (“Enhanced BSE Rule”). These new regulations included amending the BSE Feed Rule to prohibit the use of tallow having more than 0.15% insoluble impurities in feed for cattle or other ruminant animals. In addition, the FDA implemented rules that prohibit the use of brain and spinal cord material from cattle aged 30 months and older or the carcasses of such cattle, if the brain and spinal cord are not removed, in the feed or food for all animals (“Prohibited Cattle Materials”). Tallow derived from Prohibited Cattle Materials that also contains more than 0.15% insoluble impurities cannot be fed to any animal. The Company has followed the Enhanced BSE Rule since it was first published in 2008 and has made capital expenditures and implemented new processes and procedures to be compliant with the Enhanced BSE Rule at all of the Company's operations. Based on the foregoing, while the Company acknowledges that unanticipated issues may arise as the FDA continues to implement the Enhanced BSE Rule and conducts compliance inspections, the Company does not currently anticipate

that the Enhanced BSE Rule will have a significant impact on the Company operations or financial performance. Notwithstanding the foregoing, the Company can provide no assurance that unanticipated costs and/or reductions in raw material volumes related to the Company's compliance with the Enhanced BSE Rule will not negatively impact the Company's operations and financial performance.
31
• With respect to human food, pet food and animal feed safety, the Food and Drug Administration Amendments Act of 2007 (the “FDAAA”) was signed into law on September 27, 2007 as a result of Congressional concern for pet and livestock food safety, following the discovery in March 2007 of pet and livestock food that contained adulterated imported ingredients. The FDAAA directs the Secretary of Health and Human Services and the FDA to promulgate significant new requirements for the pet food and animal feed industries. As a prerequisite to new requirements specified by the FDAAA, the FDA was directed to establish a Reportable Food Registry, which was implemented on September 8, 2009. On June 11, 2009, the FDA issued “Guidance for Industry: Questions and Answers Regarding the Reportable Food Registry as Established by the Food and Drug Administration Amendments Act of 2007: Draft Guidance.” Stakeholder comments and questions about the Reportable Food Registry that were submitted to the docket or during public meetings were incorporated into a second draft guidance (“RFR Draft Guidance”), which was published on September 8, 2009. In the RFR Draft Guidance, the FDA defined a reportable food, which the manufacturer or distributor would be required to report in the Reportable Food Registry, to include materials used as ingredients in animal feeds and pet foods, if there is reasonable probability that the use of such materials will cause serious adverse health consequences or death to humans or animals. The FDA issued a second version of its RFR Draft Guidance in May 2010 without finalizing it. On July 27, 2010, the FDA released “Compliance Policy guide Sec. 690.800, Salmonella in Animal Feed, Draft Guidance” (“Draft CPG”), which describes differing criteria to determine whether pet food and farmed animal feeds that are contaminated with salmonella will be considered to be adulterated under section 402(a)(1) of the Food Drug and Cosmetic Act. According to the Draft CPG, any finished pet food contaminated with any species of salmonella will be considered adulterated because such feeds have direct human contact. Finished animal feeds intended for pigs, poultry and other farmed animals, however, will be considered to be adulterated only if the feed is contaminated with a species of salmonella that is considered to be pathogenic for the animal species that the feed is intended for. The impact of the FDAAA and implementation of the Reportable Food Registry on the Company, if any, will not be clear until the FDA finalizes its RFR Draft Guidance and the Draft CPG, neither of which were finalized as of the date of this report. The Company believes that it has adequate procedures in place to assure that its finished products are safe to use in animal feed and pet food and the Company does not currently anticipate that the FDAAA will have a significant impact on the Company's operations or financial performance. Any pathogen, such as salmonella, that is correctly or incorrectly associated with the Company's finished products could have a negative impact on the demand for the Company's finished products.
• In addition, on January 4, 2011, President Barack Obama signed the Food Safety Modernization Act (“FSMA”) into law. As enacted, the FSMA gave the FDA new authorities, which became effective immediately. Included among these is mandatory recall authority for adulterated foods that are likely to cause serious adverse health consequences or death to humans or animals, if the responsible party fails to cease distribution and recall such adulterated foods voluntarily. The FSMA further instructed the FDA to amend existing regulations that define its administrative detention authority so that the criteria needed for detaining human or animal food are lowered. Prior to the FSMA becoming law, FDA had authority to order that an article of food be detained only if there was credible evidence or information indicating that the article of food presented a threat of serious adverse health consequences or death to humans or animals. On May 5, 2011, FDA issued an interim final rule amending its administrative detention authority and lowering both the level of proof and the degree of risk required for detaining an article of food. This interim final rule, which became effective on July 3, 2011, gives the FDA authority to detain an article of food if there is reason to believe the food is adulterated or misbranded. In addition to amending existing regulations, the FSMA requires the FDA to develop new regulations that, among other provisions, place additional registration requirements on food and feed producing firms; require registered facilities to perform hazard analysis and to implement preventive plans to control those hazards identified to be reasonably likely to occur; increase the length of time that records are required to be retained; and regulate the sanitary transportation of food. Such new food safety provisions will require new FDA rule making. The Company has followed the FSMA throughout its legislative history and implemented hazard prevention controls and other procedures that the Company believes will be needed to comply with the FSMA. Such rule-making could, among other things, require the Company to amend certain of the Company's other operational policies and procedures. While unforeseen issues and requirements may arise as the FDA promulgates the new regulations provided for by the FSMA, the Company does not anticipate that the costs of compliance with the FSMA will materially impact the Company's business or operations.
Results of Operations Three Months Ended June 30, 2012 Compared to Three Months Ended July 2, 2011 Summary of Key Factors Impacting Second Quarter 2012 Results:
Principal factors that contributed to a $ 28.3 million decrease in operating income, which are discussed in greater detail in the following section, were:
• Decrease in finished product prices, • Decrease in raw material volumes, • Increases in payroll and related benefits costs, and • A prior year purchase accounting contingency gain not in the current year.
These decreases were partially offset by:
• Decreases in energy costs, primarily natural gas and diesel fuel.
Summary of Key Indicators of 2012 Performance:
Principal indicators which management routinely monitors and compares to previous periods as an indicator of problems or improvements in operating results include:
These indicators and their importance are discussed below in greater detail.
Finished Product Commodity Prices. Prices for finished product commodities that the Company produces are reported each business day on the Jacobsen index, an established trading exchange price publisher. The Jacobsen index reports industry sales from the prior day's activity by product. The Jacobsen index includes reported prices for MBM, PM (both feed grade and pet food), BFT, PG and YG, which are end products of the Company's Rendering Segment. During the first quarter of fiscal 2012 , the Jacobsen index stopped reporting BBP, which is the end product of the Company's Bakery Segment. As a result, the Company is reporting prices for corn, which is a substitute commodity for BBP. The Company regularly monitors Jacobsen index reports on MBM, PM, BFT, PG, YG and corn because they provide a daily indication of the Company's revenue performance against business plan benchmarks. Although the Jacobsen index provides one useful metric of performance, the Company's finished products are commodities that compete with other commodities such as corn, soybean oil, palm oil complex, soybean meal and heating oil on nutritional and functional values and therefore actual pricing for the Company's finished products, as well as competing products, can be quite volatile. In addition, the Jacobsen index does not provide forward or future period pricing. The Jacobsen prices quoted below are for delivery of the finished product at a specified location. Although the Company's prices generally move in concert with reported Jacobsen prices, the Company's actual sales prices for its finished products may vary significantly from the Jacobsen index because of delivery timing differences and because the Company's finished products are delivered to multiple locations in different geographic regions which utilize different price indexes. In addition, certain of the Company's premium branded finished products may also sell at prices that may be higher than the closest product on the related Jacobsen index. During the second quarter of fiscal 2012 , the Company's actual sales prices by product trended with the disclosed Jacobsen prices. Average Jacobsen prices (at the specified delivery point) for the second quarter of fiscal 2012 , compared to average Jacobsen prices for the second quarter of fiscal 2011 follow:
32
• Finished product commodity prices, • Raw material volume, • Production volume and related yield of finished product, • Energy prices for natural gas quoted on the NYMEX index and diesel fuel, • Collection fees and collection operating expense, and • Factory operating expenses.
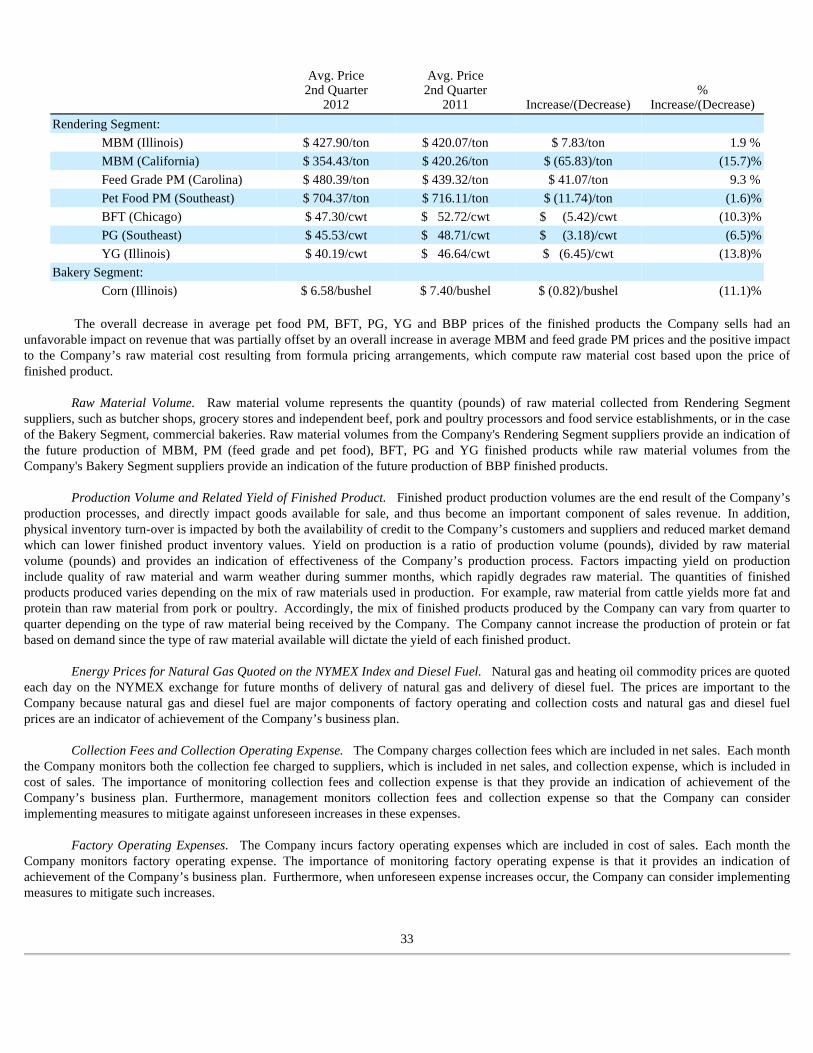
The overall decrease in average pet food PM, BFT, PG, YG and BBP prices of the finished products the Company sells had an
unfavorable impact on revenue that was partially offset by an overall increase in average MBM and feed grade PM prices and the positive impact to the Company’s raw material cost resulting from formula pricing arrangements, which compute raw material cost based upon the price of finished product.
Raw Material Volume. Raw material volume represents the quantity (pounds) of raw material collected from Rendering Segment suppliers, such as butcher shops, grocery stores and independent beef, pork and poultry processors and food service establishments, or in the case of the Bakery Segment, commercial bakeries. Raw material volumes from the Company's Rendering Segment suppliers provide an indication of the future production of MBM, PM (feed grade and pet food), BFT, PG and YG finished products while raw material volumes from the Company's Bakery Segment suppliers provide an indication of the future production of BBP finished products.
Production Volume and Related Yield of Finished Product. Finished product production volumes are the end result of the Company’s production processes, and directly impact goods available for sale, and thus become an important component of sales revenue. In addition, physical inventory turn-over is impacted by both the availability of credit to the Company’s customers and suppliers and reduced market demand which can lower finished product inventory values. Yield on production is a ratio of production volume (pounds), divided by raw material volume (pounds) and provides an indication of effectiveness of the Company’s production process. Factors impacting yield on production include quality of raw material and warm weather during summer months, which rapidly degrades raw material. The quantities of finished products produced varies depending on the mix of raw materials used in production. For example, raw material from cattle yields more fat and protein than raw material from pork or poultry. Accordingly, the mix of finished products produced by the Company can vary from quarter to quarter depending on the type of raw material being received by the Company. The Company cannot increase the production of protein or fat based on demand since the type of raw material available will dictate the yield of each finished product.
Energy Prices for Natural Gas Quoted on the NYMEX Index and Diesel Fuel. Natural gas and heating oil commodity prices are quoted each day on the NYMEX exchange for future months of delivery of natural gas and delivery of diesel fuel. The prices are important to the Company because natural gas and diesel fuel are major components of factory operating and collection costs and natural gas and diesel fuel prices are an indicator of achievement of the Company’s business plan.
Collection Fees and Collection Operating Expense. The Company charges collection fees which are included in net sales. Each month the Company monitors both the collection fee charged to suppliers, which is included in net sales, and collection expense, which is included in cost of sales. The importance of monitoring collection fees and collection expense is that they provide an indication of achievement of the Company’s business plan. Furthermore, management monitors collection fees and collection expense so that the Company can consider implementing measures to mitigate against unforeseen increases in these expenses.
Factory Operating Expenses. The Company incurs factory operating expenses which are included in cost of sales. Each month the Company monitors factory operating expense. The importance of monitoring factory operating expense is that it provides an indication of achievement of the Company’s business plan. Furthermore, when unforeseen expense increases occur, the Company can consider implementing measures to mitigate such increases.
33
Avg. Price 2nd Quarter
2012
Avg. Price 2nd Quarter
2011
Increase/(Decrease) %
Increase/(Decrease)
Rendering Segment:
MBM (Illinois) $ 427.90/ton $ 420.07/ton $ 7.83/ton 1.9 %
MBM (California) $ 354.43/ton $ 420.26/ton $ (65.83)/ton (15.7 )%
Feed Grade PM (Carolina) $ 480.39/ton $ 439.32/ton $ 41.07/ton 9.3 %
Pet Food PM (Southeast) $ 704.37/ton $ 716.11/ton $ (11.74)/ton (1.6 )%
BFT (Chicago) $ 47.30/cwt $ 52.72/cwt $ (5.42)/cwt (10.3 )%
PG (Southeast) $ 45.53/cwt $ 48.71/cwt $ (3.18)/cwt (6.5 )%
YG (Illinois) $ 40.19/cwt $ 46.64/cwt $ (6.45)/cwt (13.8 )%
Bakery Segment:
Corn (Illinois) $ 6.58/bushel $ 7.40/bushel $ (0.82)/bushel (11.1 )%
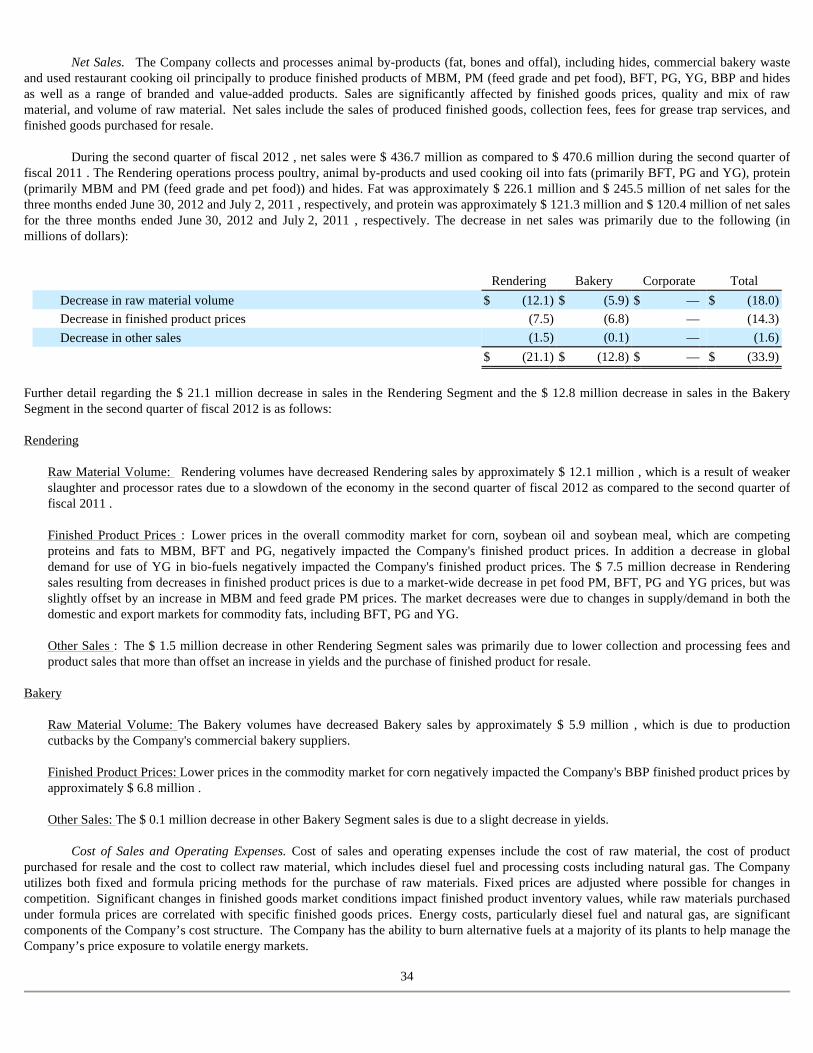
Net Sales. The Company collects and processes animal by-products (fat, bones and offal), including hides, commercial bakery waste and used restaurant cooking oil principally to produce finished products of MBM, PM (feed grade and pet food), BFT, PG, YG, BBP and hides as well as a range of branded and value-added products. Sales are significantly affected by finished goods prices, quality and mix of raw material, and volume of raw material. Net sales include the sales of produced finished goods, collection fees, fees for grease trap services, and finished goods purchased for resale.
During the second quarter of fiscal 2012 , net sales were $ 436.7 million as compared to $ 470.6 million during the second quarter of fiscal 2011 . The Rendering operations process poultry, animal by-products and used cooking oil into fats (primarily BFT, PG and YG), protein (primarily MBM and PM (feed grade and pet food)) and hides. Fat was approximately $ 226.1 million and $ 245.5 million of net sales for the three months ended June 30, 2012 and July 2, 2011 , respectively, and protein was approximately $ 121.3 million and $ 120.4 million of net sales for the three months ended June 30, 2012 and July 2, 2011 , respectively. The decrease in net sales was primarily due to the following (in millions of dollars):
Further detail regarding the $ 21.1 million decrease in sales in the Rendering Segment and the $ 12.8 million decrease in sales in the Bakery Segment in the second quarter of fiscal 2012 is as follows: Rendering
Raw Material Volume: Rendering volumes have decreased Rendering sales by approximately $ 12.1 million , which is a result of weaker slaughter and processor rates due to a slowdown of the economy in the second quarter of fiscal 2012 as compared to the second quarter of fiscal 2011 . Finished Product Prices : Lower prices in the overall commodity market for corn, soybean oil and soybean meal, which are competing proteins and fats to MBM, BFT and PG, negatively impacted the Company's finished product prices. In addition a decrease in global demand for use of YG in bio-fuels negatively impacted the Company's finished product prices. The $ 7.5 million decrease in Rendering sales resulting from decreases in finished product prices is due to a market-wide decrease in pet food PM, BFT, PG and YG prices, but was slightly offset by an increase in MBM and feed grade PM prices. The market decreases were due to changes in supply/demand in both the domestic and export markets for commodity fats, including BFT, PG and YG. Other Sales : The $ 1.5 million decrease in other Rendering Segment sales was primarily due to lower collection and processing fees and product sales that more than offset an increase in yields and the purchase of finished product for resale.
Bakery Raw Material Volume: The Bakery volumes have decreased Bakery sales by approximately $ 5.9 million , which is due to production cutbacks by the Company's commercial bakery suppliers. Finished Product Prices: Lower prices in the commodity market for corn negatively impacted the Company's BBP finished product prices by approximately $ 6.8 million . Other Sales: The $ 0.1 million decrease in other Bakery Segment sales is due to a slight decrease in yields.
Cost of Sales and Operating Expenses. Cost of sales and operating expenses include the cost of raw material, the cost of product purchased for resale and the cost to collect raw material, which includes diesel fuel and processing costs including natural gas. The Company utilizes both fixed and formula pricing methods for the purchase of raw materials. Fixed prices are adjusted where possible for changes in competition. Significant changes in finished goods market conditions impact finished product inventory values, while raw materials purchased under formula prices are correlated with specific finished goods prices. Energy costs, particularly diesel fuel and natural gas, are significant components of the Company’s cost structure. The Company has the ability to burn alternative fuels at a majority of its plants to help manage the Company’s price exposure to volatile energy markets.
34
Rendering Bakery Corporate Total
Decrease in raw material volume $ (12.1 ) $ (5.9 ) $ — $ (18.0 )
Decrease in finished product prices (7.5 ) (6.8 ) — (14.3 )
Decrease in other sales (1.5 ) (0.1 ) — (1.6 )
$ (21.1 ) $ (12.8 ) $ — $ (33.9 )
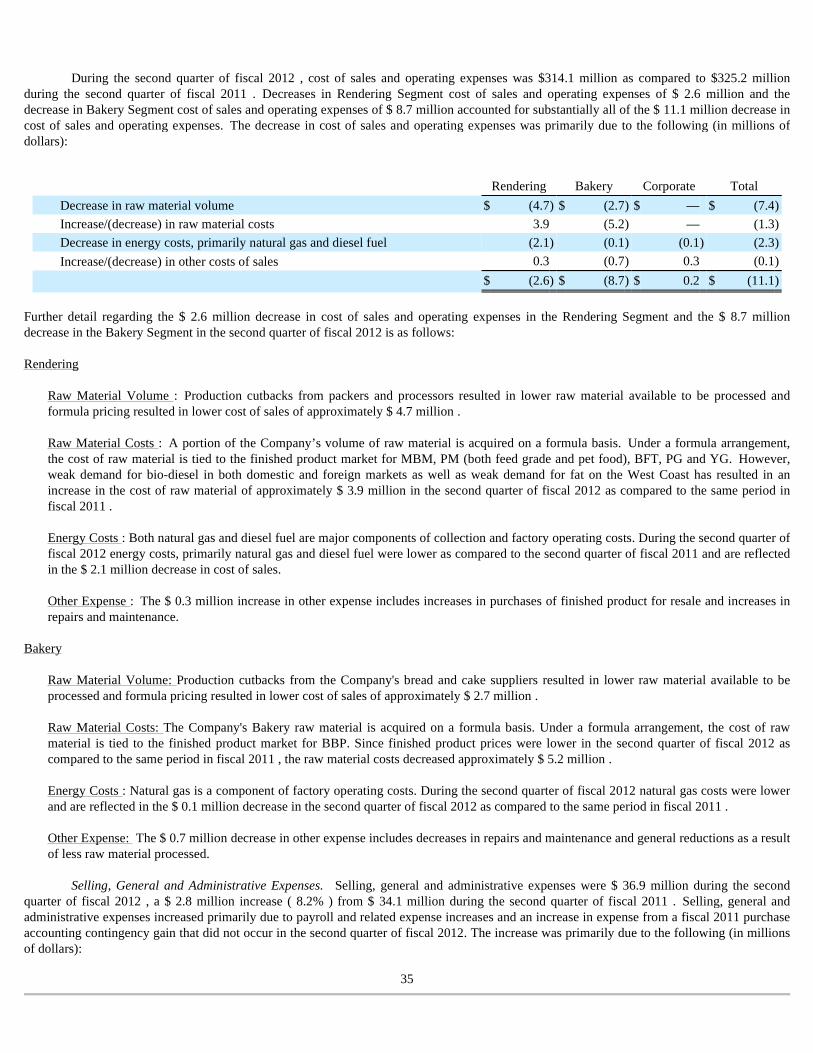
During the second quarter of fiscal 2012 , cost of sales and operating expenses was $314.1 million as compared to $325.2 million during the second quarter of fiscal 2011 . Decreases in Rendering Segment cost of sales and operating expenses of $ 2.6 million and the decrease in Bakery Segment cost of sales and operating expenses of $ 8.7 million accounted for substantially all of the $ 11.1 million decrease in cost of sales and operating expenses. The decrease in cost of sales and operating expenses was primarily due to the following (in millions of dollars):
Further detail regarding the $ 2.6 million decrease in cost of sales and operating expenses in the Rendering Segment and the $ 8.7 million decrease in the Bakery Segment in the second quarter of fiscal 2012 is as follows: Rendering
Raw Material Volume : Production cutbacks from packers and processors resulted in lower raw material available to be processed and formula pricing resulted in lower cost of sales of approximately $ 4.7 million . Raw Material Costs : A portion of the Company’s volume of raw material is acquired on a formula basis. Under a formula arrangement, the cost of raw material is tied to the finished product market for MBM, PM (both feed grade and pet food), BFT, PG and YG. However, weak demand for bio-diesel in both domestic and foreign markets as well as weak demand for fat on the West Coast has resulted in an increase in the cost of raw material of approximately $ 3.9 million in the second quarter of fiscal 2012 as compared to the same period in fiscal 2011 . Energy Costs : Both natural gas and diesel fuel are major components of collection and factory operating costs. During the second quarter of fiscal 2012 energy costs, primarily natural gas and diesel fuel were lower as compared to the second quarter of fiscal 2011 and are reflected in the $ 2.1 million decrease in cost of sales. Other Expense : The $ 0.3 million increase in other expense includes increases in purchases of finished product for resale and increases in repairs and maintenance.
Bakery Raw Material Volume: Production cutbacks from the Company's bread and cake suppliers resulted in lower raw material available to be processed and formula pricing resulted in lower cost of sales of approximately $ 2.7 million . Raw Material Costs: The Company's Bakery raw material is acquired on a formula basis. Under a formula arrangement, the cost of raw material is tied to the finished product market for BBP. Since finished product prices were lower in the second quarter of fiscal 2012 as compared to the same period in fiscal 2011 , the raw material costs decreased approximately $ 5.2 million . Energy Costs : Natural gas is a component of factory operating costs. During the second quarter of fiscal 2012 natural gas costs were lower and are reflected in the $ 0.1 million decrease in the second quarter of fiscal 2012 as compared to the same period in fiscal 2011 . Other Expense: The $ 0.7 million decrease in other expense includes decreases in repairs and maintenance and general reductions as a result of less raw material processed.
Selling, General and Administrative Expenses. Selling, general and administrative expenses were $ 36.9 million during the second
quarter of fiscal 2012 , a $ 2.8 million increase ( 8.2% ) from $ 34.1 million during the second quarter of fiscal 2011 . Selling, general and administrative expenses increased primarily due to payroll and related expense increases and an increase in expense from a fiscal 2011 purchase accounting contingency gain that did not occur in the second quarter of fiscal 2012. The increase was primarily due to the following (in millions of dollars):
35
Rendering Bakery Corporate Total
Decrease in raw material volume $ (4.7 ) $ (2.7 ) $ — $ (7.4 )
Increase/(decrease) in raw material costs 3.9 (5.2 ) — (1.3 )
Decrease in energy costs, primarily natural gas and diesel fuel (2.1 ) (0.1 ) (0.1 ) (2.3 )
Increase/(decrease) in other costs of sales 0.3 (0.7 ) 0.3 (0.1 )
$ (2.6 ) $ (8.7 ) $ 0.2 $ (11.1 )
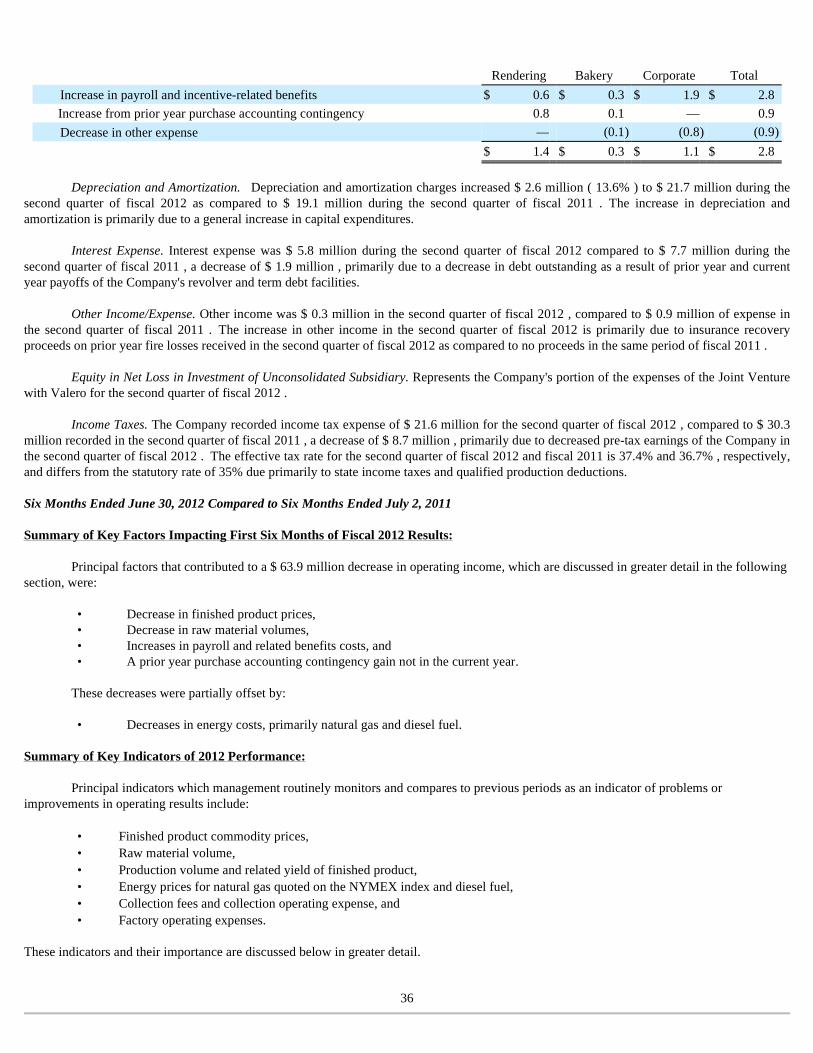
Depreciation and Amortization. Depreciation and amortization charges increased $ 2.6 million ( 13.6% ) to $ 21.7 million during the
second quarter of fiscal 2012 as compared to $ 19.1 million during the second quarter of fiscal 2011 . The increase in depreciation and amortization is primarily due to a general increase in capital expenditures.
Interest Expense. Interest expense was $ 5.8 million during the second quarter of fiscal 2012 compared to $ 7.7 million during the second quarter of fiscal 2011 , a decrease of $ 1.9 million , primarily due to a decrease in debt outstanding as a result of prior year and current year payoffs of the Company's revolver and term debt facilities.
Other Income/Expense. Other income was $ 0.3 million in the second quarter of fiscal 2012 , compared to $ 0.9 million of expense in the second quarter of fiscal 2011 . The increase in other income in the second quarter of fiscal 2012 is primarily due to insurance recovery proceeds on prior year fire losses received in the second quarter of fiscal 2012 as compared to no proceeds in the same period of fiscal 2011 .
Equity in Net Loss in Investment of Unconsolidated Subsidiary. Represents the Company's portion of the expenses of the Joint Venture with Valero for the second quarter of fiscal 2012 .
Income Taxes. The Company recorded income tax expense of $ 21.6 million for the second quarter of fiscal 2012 , compared to $ 30.3 million recorded in the second quarter of fiscal 2011 , a decrease of $ 8.7 million , primarily due to decreased pre-tax earnings of the Company in the second quarter of fiscal 2012 . The effective tax rate for the second quarter of fiscal 2012 and fiscal 2011 is 37.4% and 36.7% , respectively, and differs from the statutory rate of 35% due primarily to state income taxes and qualified production deductions.
Six Months Ended June 30, 2012 Compared to Six Months Ended July 2, 2011 Summary of Key Factors Impacting First Six Months of Fiscal 2012 Results:
Principal factors that contributed to a $ 63.9 million decrease in operating income, which are discussed in greater detail in the following section, were:
• Decrease in finished product prices, • Decrease in raw material volumes, • Increases in payroll and related benefits costs, and • A prior year purchase accounting contingency gain not in the current year.
These decreases were partially offset by:
• Decreases in energy costs, primarily natural gas and diesel fuel.
Summary of Key Indicators of 2012 Performance:
Principal indicators which management routinely monitors and compares to previous periods as an indicator of problems or improvements in operating results include:
These indicators and their importance are discussed below in greater detail.
36
Rendering Bakery Corporate Total
Increase in payroll and incentive-related benefits $ 0.6 $ 0.3 $ 1.9 $ 2.8 Increase from prior year purchase accounting contingency 0.8 0.1 — 0.9 Decrease in other expense — (0.1 ) (0.8 ) (0.9 )
$ 1.4 $ 0.3 $ 1.1 $ 2.8
• Finished product commodity prices, • Raw material volume, • Production volume and related yield of finished product, • Energy prices for natural gas quoted on the NYMEX index and diesel fuel, • Collection fees and collection operating expense, and • Factory operating expenses.
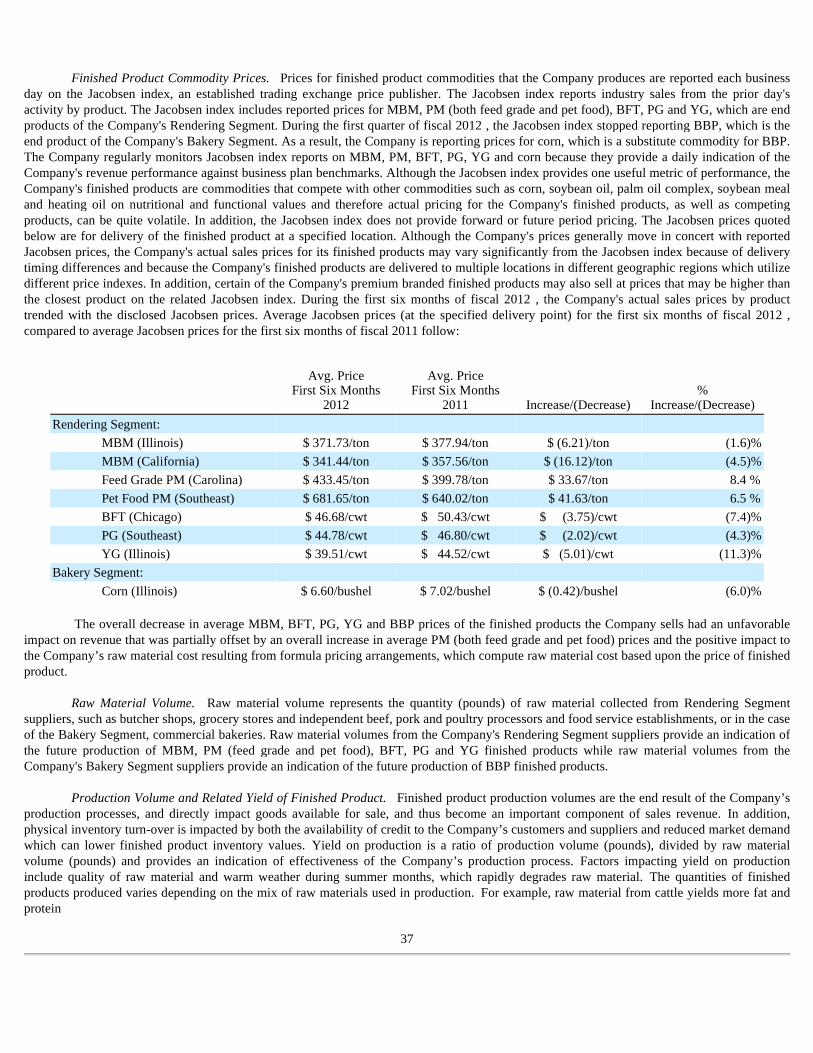
Finished Product Commodity Prices. Prices for finished product commodities that the Company produces are reported each business
day on the Jacobsen index, an established trading exchange price publisher. The Jacobsen index reports industry sales from the prior day's activity by product. The Jacobsen index includes reported prices for MBM, PM (both feed grade and pet food), BFT, PG and YG, which are end products of the Company's Rendering Segment. During the first quarter of fiscal 2012 , the Jacobsen index stopped reporting BBP, which is the end product of the Company's Bakery Segment. As a result, the Company is reporting prices for corn, which is a substitute commodity for BBP. The Company regularly monitors Jacobsen index reports on MBM, PM, BFT, PG, YG and corn because they provide a daily indication of the Company's revenue performance against business plan benchmarks. Although the Jacobsen index provides one useful metric of performance, the Company's finished products are commodities that compete with other commodities such as corn, soybean oil, palm oil complex, soybean meal and heating oil on nutritional and functional values and therefore actual pricing for the Company's finished products, as well as competing products, can be quite volatile. In addition, the Jacobsen index does not provide forward or future period pricing. The Jacobsen prices quoted below are for delivery of the finished product at a specified location. Although the Company's prices generally move in concert with reported Jacobsen prices, the Company's actual sales prices for its finished products may vary significantly from the Jacobsen index because of delivery timing differences and because the Company's finished products are delivered to multiple locations in different geographic regions which utilize different price indexes. In addition, certain of the Company's premium branded finished products may also sell at prices that may be higher than the closest product on the related Jacobsen index. During the first six months of fiscal 2012 , the Company's actual sales prices by product trended with the disclosed Jacobsen prices. Average Jacobsen prices (at the specified delivery point) for the first six months of fiscal 2012 , compared to average Jacobsen prices for the first six months of fiscal 2011 follow:
The overall decrease in average MBM, BFT, PG, YG and BBP prices of the finished products the Company sells had an unfavorable
impact on revenue that was partially offset by an overall increase in average PM (both feed grade and pet food) prices and the positive impact to the Company’s raw material cost resulting from formula pricing arrangements, which compute raw material cost based upon the price of finished product.
Raw Material Volume. Raw material volume represents the quantity (pounds) of raw material collected from Rendering Segment suppliers, such as butcher shops, grocery stores and independent beef, pork and poultry processors and food service establishments, or in the case of the Bakery Segment, commercial bakeries. Raw material volumes from the Company's Rendering Segment suppliers provide an indication of the future production of MBM, PM (feed grade and pet food), BFT, PG and YG finished products while raw material volumes from the Company's Bakery Segment suppliers provide an indication of the future production of BBP finished products.
Production Volume and Related Yield of Finished Product. Finished product production volumes are the end result of the Company’s production processes, and directly impact goods available for sale, and thus become an important component of sales revenue. In addition, physical inventory turn-over is impacted by both the availability of credit to the Company’s customers and suppliers and reduced market demand which can lower finished product inventory values. Yield on production is a ratio of production volume (pounds), divided by raw material volume (pounds) and provides an indication of effectiveness of the Company’s production process. Factors impacting yield on production include quality of raw material and warm weather during summer months, which rapidly degrades raw material. The quantities of finished products produced varies depending on the mix of raw materials used in production. For example, raw material from cattle yields more fat and protein
37
Avg. Price First Six Months
2012
Avg. Price First Six Months
2011
Increase/(Decrease) %
Increase/(Decrease)
Rendering Segment:
MBM (Illinois) $ 371.73/ton $ 377.94/ton $ (6.21)/ton (1.6 )%
MBM (California) $ 341.44/ton $ 357.56/ton $ (16.12)/ton (4.5 )%
Feed Grade PM (Carolina) $ 433.45/ton $ 399.78/ton $ 33.67/ton 8.4 %
Pet Food PM (Southeast) $ 681.65/ton $ 640.02/ton $ 41.63/ton 6.5 %
BFT (Chicago) $ 46.68/cwt $ 50.43/cwt $ (3.75)/cwt (7.4 )%
PG (Southeast) $ 44.78/cwt $ 46.80/cwt $ (2.02)/cwt (4.3 )%
YG (Illinois) $ 39.51/cwt $ 44.52/cwt $ (5.01)/cwt (11.3 )%
Bakery Segment:
Corn (Illinois) $ 6.60/bushel $ 7.02/bushel $ (0.42)/bushel (6.0 )%
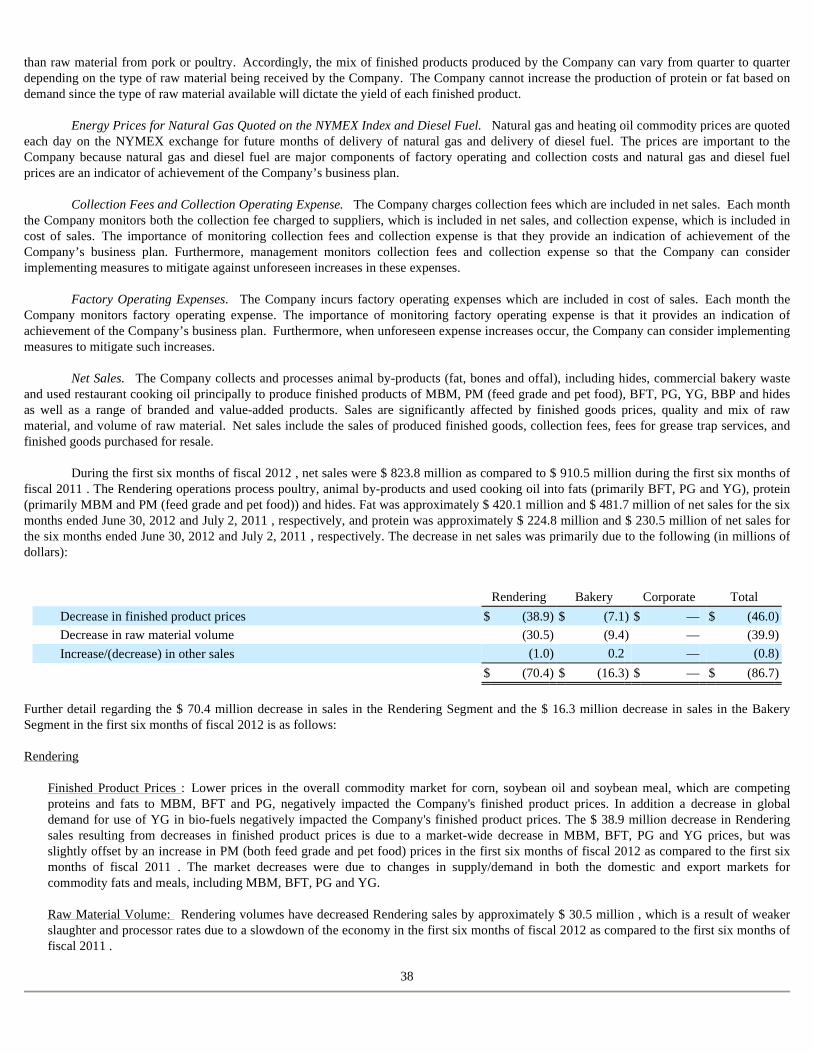
than raw material from pork or poultry. Accordingly, the mix of finished products produced by the Company can vary from quarter to quarter depending on the type of raw material being received by the Company. The Company cannot increase the production of protein or fat based on demand since the type of raw material available will dictate the yield of each finished product.
Energy Prices for Natural Gas Quoted on the NYMEX Index and Diesel Fuel. Natural gas and heating oil commodity prices are quoted each day on the NYMEX exchange for future months of delivery of natural gas and delivery of diesel fuel. The prices are important to the Company because natural gas and diesel fuel are major components of factory operating and collection costs and natural gas and diesel fuel prices are an indicator of achievement of the Company’s business plan.
Collection Fees and Collection Operating Expense. The Company charges collection fees which are included in net sales. Each month the Company monitors both the collection fee charged to suppliers, which is included in net sales, and collection expense, which is included in cost of sales. The importance of monitoring collection fees and collection expense is that they provide an indication of achievement of the Company’s business plan. Furthermore, management monitors collection fees and collection expense so that the Company can consider implementing measures to mitigate against unforeseen increases in these expenses.
Factory Operating Expenses. The Company incurs factory operating expenses which are included in cost of sales. Each month the Company monitors factory operating expense. The importance of monitoring factory operating expense is that it provides an indication of achievement of the Company’s business plan. Furthermore, when unforeseen expense increases occur, the Company can consider implementing measures to mitigate such increases.
Net Sales. The Company collects and processes animal by-products (fat, bones and offal), including hides, commercial bakery waste and used restaurant cooking oil principally to produce finished products of MBM, PM (feed grade and pet food), BFT, PG, YG, BBP and hides as well as a range of branded and value-added products. Sales are significantly affected by finished goods prices, quality and mix of raw material, and volume of raw material. Net sales include the sales of produced finished goods, collection fees, fees for grease trap services, and finished goods purchased for resale.
During the first six months of fiscal 2012 , net sales were $ 823.8 million as compared to $ 910.5 million during the first six months of fiscal 2011 . The Rendering operations process poultry, animal by-products and used cooking oil into fats (primarily BFT, PG and YG), protein (primarily MBM and PM (feed grade and pet food)) and hides. Fat was approximately $ 420.1 million and $ 481.7 million of net sales for the six months ended June 30, 2012 and July 2, 2011 , respectively, and protein was approximately $ 224.8 million and $ 230.5 million of net sales for the six months ended June 30, 2012 and July 2, 2011 , respectively. The decrease in net sales was primarily due to the following (in millions of dollars):
Further detail regarding the $ 70.4 million decrease in sales in the Rendering Segment and the $ 16.3 million decrease in sales in the Bakery Segment in the first six months of fiscal 2012 is as follows: Rendering
Finished Product Prices : Lower prices in the overall commodity market for corn, soybean oil and soybean meal, which are competing proteins and fats to MBM, BFT and PG, negatively impacted the Company's finished product prices. In addition a decrease in global demand for use of YG in bio-fuels negatively impacted the Company's finished product prices. The $ 38.9 million decrease in Rendering sales resulting from decreases in finished product prices is due to a market-wide decrease in MBM, BFT, PG and YG prices, but was slightly offset by an increase in PM (both feed grade and pet food) prices in the first six months of fiscal 2012 as compared to the first six months of fiscal 2011 . The market decreases were due to changes in supply/demand in both the domestic and export markets for commodity fats and meals, including MBM, BFT, PG and YG. Raw Material Volume: Rendering volumes have decreased Rendering sales by approximately $ 30.5 million , which is a result of weaker slaughter and processor rates due to a slowdown of the economy in the first six months of fiscal 2012 as compared to the first six months of fiscal 2011 .
38
Rendering Bakery Corporate Total
Decrease in finished product prices $ (38.9 ) $ (7.1 ) $ — $ (46.0 )
Decrease in raw material volume (30.5 ) (9.4 ) — (39.9 )
Increase/(decrease) in other sales (1.0 ) 0.2 — (0.8 )
$ (70.4 ) $ (16.3 ) $ — $ (86.7 )
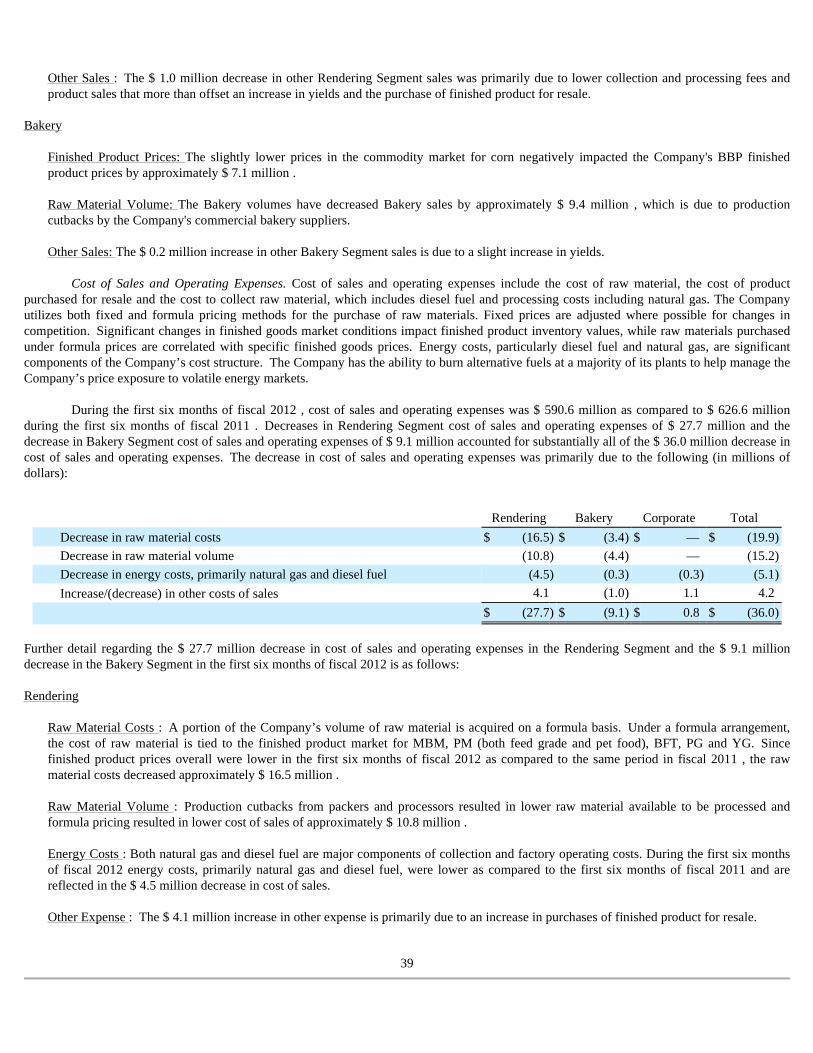
Other Sales : The $ 1.0 million decrease in other Rendering Segment sales was primarily due to lower collection and processing fees and product sales that more than offset an increase in yields and the purchase of finished product for resale.
Bakery Finished Product Prices: The slightly lower prices in the commodity market for corn negatively impacted the Company's BBP finished product prices by approximately $ 7.1 million . Raw Material Volume: The Bakery volumes have decreased Bakery sales by approximately $ 9.4 million , which is due to production cutbacks by the Company's commercial bakery suppliers. Other Sales: The $ 0.2 million increase in other Bakery Segment sales is due to a slight increase in yields.
Cost of Sales and Operating Expenses. Cost of sales and operating expenses include the cost of raw material, the cost of product purchased for resale and the cost to collect raw material, which includes diesel fuel and processing costs including natural gas. The Company utilizes both fixed and formula pricing methods for the purchase of raw materials. Fixed prices are adjusted where possible for changes in competition. Significant changes in finished goods market conditions impact finished product inventory values, while raw materials purchased under formula prices are correlated with specific finished goods prices. Energy costs, particularly diesel fuel and natural gas, are significant components of the Company’s cost structure. The Company has the ability to burn alternative fuels at a majority of its plants to help manage the Company’s price exposure to volatile energy markets.
During the first six months of fiscal 2012 , cost of sales and operating expenses was $ 590.6 million as compared to $ 626.6 million during the first six months of fiscal 2011 . Decreases in Rendering Segment cost of sales and operating expenses of $ 27.7 million and the decrease in Bakery Segment cost of sales and operating expenses of $ 9.1 million accounted for substantially all of the $ 36.0 million decrease in cost of sales and operating expenses. The decrease in cost of sales and operating expenses was primarily due to the following (in millions of dollars):
Further detail regarding the $ 27.7 million decrease in cost of sales and operating expenses in the Rendering Segment and the $ 9.1 million decrease in the Bakery Segment in the first six months of fiscal 2012 is as follows: Rendering
Raw Material Costs : A portion of the Company’s volume of raw material is acquired on a formula basis. Under a formula arrangement, the cost of raw material is tied to the finished product market for MBM, PM (both feed grade and pet food), BFT, PG and YG. Since finished product prices overall were lower in the first six months of fiscal 2012 as compared to the same period in fiscal 2011 , the raw material costs decreased approximately $ 16.5 million . Raw Material Volume : Production cutbacks from packers and processors resulted in lower raw material available to be processed and formula pricing resulted in lower cost of sales of approximately $ 10.8 million . Energy Costs : Both natural gas and diesel fuel are major components of collection and factory operating costs. During the first six months of fiscal 2012 energy costs, primarily natural gas and diesel fuel, were lower as compared to the first six months of fiscal 2011 and are reflected in the $ 4.5 million decrease in cost of sales. Other Expense : The $ 4.1 million increase in other expense is primarily due to an increase in purchases of finished product for resale.
39
Rendering Bakery Corporate Total
Decrease in raw material costs $ (16.5 ) $ (3.4 ) $ — $ (19.9 )
Decrease in raw material volume (10.8 ) (4.4 ) — (15.2 )
Decrease in energy costs, primarily natural gas and diesel fuel (4.5 ) (0.3 ) (0.3 ) (5.1 )
Increase/(decrease) in other costs of sales 4.1 (1.0 ) 1.1 4.2
$ (27.7 ) $ (9.1 ) $ 0.8 $ (36.0 )
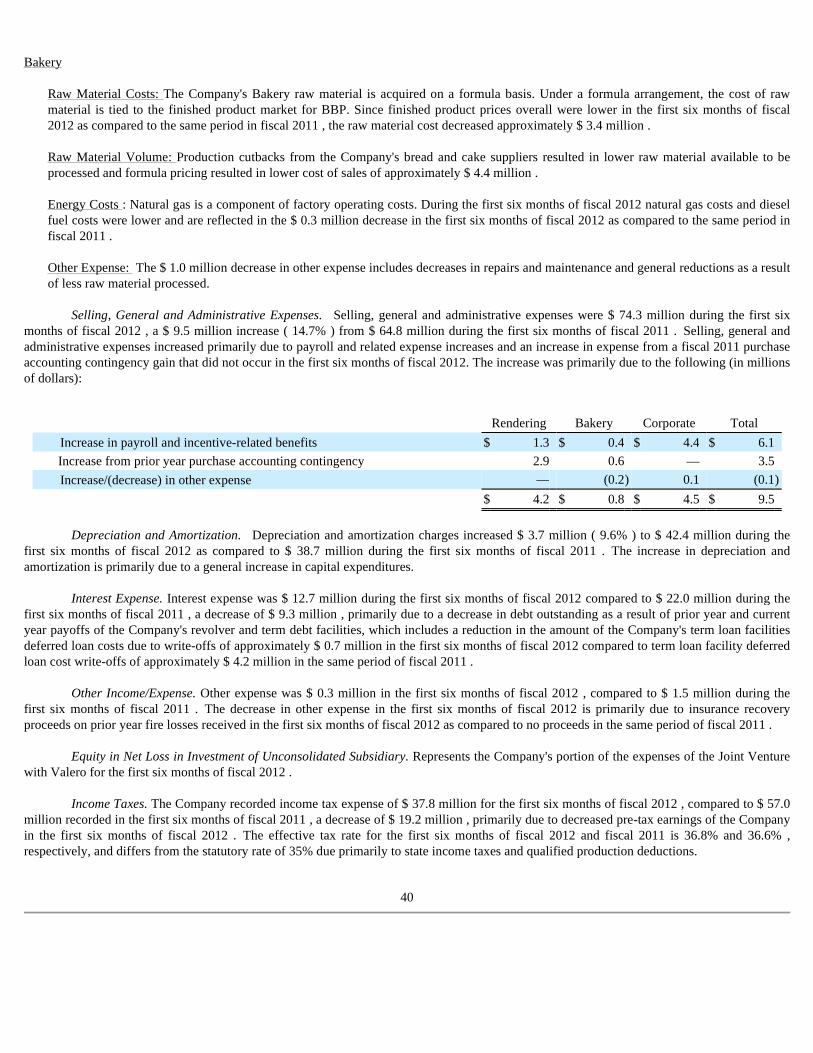
Bakery
Raw Material Costs: The Company's Bakery raw material is acquired on a formula basis. Under a formula arrangement, the cost of raw material is tied to the finished product market for BBP. Since finished product prices overall were lower in the first six months of fiscal 2012 as compared to the same period in fiscal 2011 , the raw material cost decreased approximately $ 3.4 million . Raw Material Volume: Production cutbacks from the Company's bread and cake suppliers resulted in lower raw material available to be processed and formula pricing resulted in lower cost of sales of approximately $ 4.4 million . Energy Costs : Natural gas is a component of factory operating costs. During the first six months of fiscal 2012 natural gas costs and diesel fuel costs were lower and are reflected in the $ 0.3 million decrease in the first six months of fiscal 2012 as compared to the same period in fiscal 2011 . Other Expense: The $ 1.0 million decrease in other expense includes decreases in repairs and maintenance and general reductions as a result of less raw material processed.
Selling, General and Administrative Expenses. Selling, general and administrative expenses were $ 74.3 million during the first six
months of fiscal 2012 , a $ 9.5 million increase ( 14.7% ) from $ 64.8 million during the first six months of fiscal 2011 . Selling, general and administrative expenses increased primarily due to payroll and related expense increases and an increase in expense from a fiscal 2011 purchase accounting contingency gain that did not occur in the first six months of fiscal 2012. The increase was primarily due to the following (in millions of dollars):
Depreciation and Amortization. Depreciation and amortization charges increased $ 3.7 million ( 9.6% ) to $ 42.4 million during the
first six months of fiscal 2012 as compared to $ 38.7 million during the first six months of fiscal 2011 . The increase in depreciation and amortization is primarily due to a general increase in capital expenditures.
Interest Expense. Interest expense was $ 12.7 million during the first six months of fiscal 2012 compared to $ 22.0 million during the first six months of fiscal 2011 , a decrease of $ 9.3 million , primarily due to a decrease in debt outstanding as a result of prior year and current year payoffs of the Company's revolver and term debt facilities, which includes a reduction in the amount of the Company's term loan facilities deferred loan costs due to write-offs of approximately $ 0.7 million in the first six months of fiscal 2012 compared to term loan facility deferred loan cost write-offs of approximately $ 4.2 million in the same period of fiscal 2011 .
Other Income/Expense. Other expense was $ 0.3 million in the first six months of fiscal 2012 , compared to $ 1.5 million during the first six months of fiscal 2011 . The decrease in other expense in the first six months of fiscal 2012 is primarily due to insurance recovery proceeds on prior year fire losses received in the first six months of fiscal 2012 as compared to no proceeds in the same period of fiscal 2011 .
Equity in Net Loss in Investment of Unconsolidated Subsidiary. Represents the Company's portion of the expenses of the Joint Venture
with Valero for the first six months of fiscal 2012 .
Income Taxes. The Company recorded income tax expense of $ 37.8 million for the first six months of fiscal 2012 , compared to $ 57.0 million recorded in the first six months of fiscal 2011 , a decrease of $ 19.2 million , primarily due to decreased pre-tax earnings of the Company in the first six months of fiscal 2012 . The effective tax rate for the first six months of fiscal 2012 and fiscal 2011 is 36.8% and 36.6% , respectively, and differs from the statutory rate of 35% due primarily to state income taxes and qualified production deductions.
40
Rendering Bakery Corporate Total
Increase in payroll and incentive-related benefits $ 1.3 $ 0.4 $ 4.4 $ 6.1 Increase from prior year purchase accounting contingency 2.9 0.6 — 3.5 Increase/(decrease) in other expense — (0.2 ) 0.1 (0.1 )
$ 4.2 $ 0.8 $ 4.5 $ 9.5
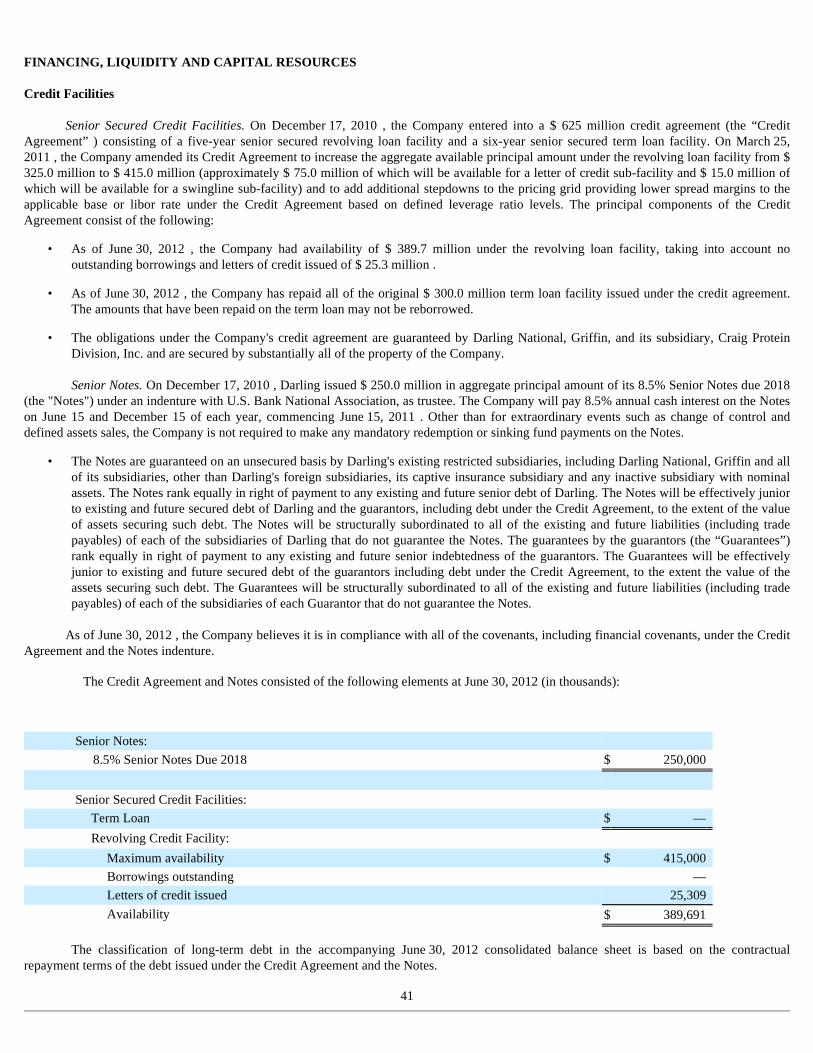
FINANCING, LIQUIDITY AND CAPITAL RESOURCES Credit Facilities
Senior Secured Credit Facilities. On December 17, 2010 , the Company entered into a $ 625 million credit agreement (the “Credit Agreement” ) consisting of a five-year senior secured revolving loan facility and a six-year senior secured term loan facility. On March 25, 2011 , the Company amended its Credit Agreement to increase the aggregate available principal amount under the revolving loan facility from $ 325.0 million to $ 415.0 million (approximately $ 75.0 million of which will be available for a letter of credit sub-facility and $ 15.0 million of which will be available for a swingline sub-facility) and to add additional stepdowns to the pricing grid providing lower spread margins to the applicable base or libor rate under the Credit Agreement based on defined leverage ratio levels. The principal components of the Credit Agreement consist of the following:
Senior Notes. On December 17, 2010 , Darling issued $ 250.0 million in aggregate principal amount of its 8.5% Senior Notes due 2018
(the "Notes") under an indenture with U.S. Bank National Association, as trustee. The Company will pay 8.5% annual cash interest on the Notes on June 15 and December 15 of each year, commencing June 15, 2011 . Other than for extraordinary events such as change of control and defined assets sales, the Company is not required to make any mandatory redemption or sinking fund payments on the Notes.
As of June 30, 2012 , the Company believes it is in compliance with all of the covenants, including financial covenants, under the Credit
Agreement and the Notes indenture.
The Credit Agreement and Notes consisted of the following elements at June 30, 2012 (in thousands):
The classification of long-term debt in the accompanying June 30, 2012 consolidated balance sheet is based on the contractual
repayment terms of the debt issued under the Credit Agreement and the Notes.
41
• As of June 30, 2012 , the Company had availability of $ 389.7 million under the revolving loan facility, taking into account no outstanding borrowings and letters of credit issued of $ 25.3 million .
• As of June 30, 2012 , the Company has repaid all of the original $ 300.0 million term loan facility issued under the credit agreement. The amounts that have been repaid on the term loan may not be reborrowed.
• The obligations under the Company's credit agreement are guaranteed by Darling National, Griffin, and its subsidiary, Craig Protein Division, Inc. and are secured by substantially all of the property of the Company.
• The Notes are guaranteed on an unsecured basis by Darling's existing restricted subsidiaries, including Darling National, Griffin and all of its subsidiaries, other than Darling's foreign subsidiaries, its captive insurance subsidiary and any inactive subsidiary with nominal assets. The Notes rank equally in right of payment to any existing and future senior debt of Darling. The Notes will be effectively junior to existing and future secured debt of Darling and the guarantors, including debt under the Credit Agreement, to the extent of the value of assets securing such debt. The Notes will be structurally subordinated to all of the existing and future liabilities (including trade payables) of each of the subsidiaries of Darling that do not guarantee the Notes. The guarantees by the guarantors (the “Guarantees”) rank equally in right of payment to any existing and future senior indebtedness of the guarantors. The Guarantees will be effectively junior to existing and future secured debt of the guarantors including debt under the Credit Agreement, to the extent the value of the assets securing such debt. The Guarantees will be structurally subordinated to all of the existing and future liabilities (including trade payables) of each of the subsidiaries of each Guarantor that do not guarantee the Notes.
Senior Notes:
8.5% Senior Notes Due 2018 $ 250,000
Senior Secured Credit Facilities:
Term Loan $ — Revolving Credit Facility:
Maximum availability $ 415,000 Borrowings outstanding — Letters of credit issued 25,309 Availability $ 389,691
On June 30, 2012 , the Company had working capital of $ 113.4 million and its working capital ratio was 1.84 to 1 compared to working capital of $ 92.4 million and a working capital ratio of 1.73 to 1 on December 31, 2011 . The increase in working capital is primarily due to the increase cash and cash equivalents. At June 30, 2012 , the Company had unrestricted cash of $ 72.3 million and funds available under the revolving credit facility of $ 389.7 million , compared to unrestricted cash of $ 38.9 million and funds available under the revolving credit facility of $ 391.6 million at December 31, 2011 .
Net cash provided by operating activities was $ 142.9 million and $ 118.5 million for the six months ended June 30, 2012 and July 2, 2011 , respectively, an increase of $ 24.4 million due primarily to changes in operating assets and liabilities that include an increase in income taxes refundable/payable of approximately $ 24.2 million , an increase in cash provided by inventory of approximately $ 12.2 million , an increase in cash provided by accounts payable and accrued expenses of approximately $ 8.6 million and increase in cash from receivables of approximately $ 5.7 million that more than offset a decrease in net income of approximately $ 34.0 million . Cash used by investing activities was $78.5 million for the six months ended June 30, 2012 , compared to $38.1 million for the six months ended July 2, 2011 , an increase of $ 40.4 million primarily due to an increase in current year investments in an unconsolidated subsidiary and an increase in cash paid for capital expenditures. Net cash used by financing activities was $31.0 million for the six months ended June 30, 2012 , compared to $87.2 million for the six months ended July 2, 2011 , a decrease in the use of cash of $ 56.0 million , primarily due to less repayments of debt as compared to the prior year.
Capital expenditures of $ 53.5 million were made during the first six months of fiscal 2012 , compared to $ 27.9 million in the first six
months of fiscal 2011 , for a net increase of $ 25.6 million ( 91.8% ), due primarily to the initiation and completion of a number of planned capital projects in the first six months of fiscal 2012 . Capital expenditures related to compliance with environmental regulations were $ 1.0 million and $ 1.3 million during the six months ended June 30, 2012 and July 2, 2011 , respectively.
Based upon the annual actuarial estimate, current accruals and claims paid during the first six months of fiscal 2012 , the Company has accrued approximately $ 10.9 million it expects will become due during the next twelve months in order to meet obligations related to the Company’s self insurance reserves and accrued insurance obligations, which are included in current accrued expenses at June 30, 2012 . The self insurance reserve is composed of estimated liability for claims arising for workers’ compensation, and for auto liability and general liability claims. The self insurance reserve liability is determined annually, based upon a third party actuarial estimate. The actuarial estimate may vary from year to year due to changes in cost of health care, the pending number of claims or other factors beyond the control of management of the Company. No assurance can be given that the Company’s funding obligations under its self insurance reserve will not increase in the future.
Based upon current actuarial estimates, the Company expects to contribute approximately $ 2.9 million to its pension plans in order to meet minimum pension funding requirements during the next twelve months. The minimum pension funding requirements are determined annually, based upon a third party actuarial estimate. The actuarial estimate may vary from year to year due to fluctuations in return on investments or other factors beyond the control of management of the Company or the administrator of the Company’s pension funds. No assurance can be given that the minimum pension funding requirements will not increase in the future. Additionally, the Company has made tax deductible discretionary and required contributions to its pension plans for the six months ended June 30, 2012 of approximately $ 0.9 million .
The Pension Protection Act of 2006 (“PPA”) was signed into law in August 2006 and went into effect in January 2008. The stated goal of the PPA is to improve the funding of pension plans. Plans in an under-funded status will be required to increase employer contributions to improve the funding level within PPA timelines. The impact of recent declines in the world equity and other financial markets have had and could continue to have a material negative impact on pension plan assets and the status of required funding under the PPA. The Company participates in various multi-employer pension plans which provide defined benefits to certain employees covered by labor contracts. These plans are not administered by the Company and contributions are determined in accordance with provisions of negotiated labor contracts to meet their pension benefit obligations to their participants. The Company's contributions to each individual multi-employer plan represent less than 5% of the total contributions to each such plan. Based on the most currently available information, the Company has determined that, if a withdrawal were to occur, withdrawal liabilities on two of the plans in which the Company currently participates could be material to the Company, with one of these material plans certified as critical or red zone. With respect to the other multi-employer pension plans in which the Company participates and which are not individually significant, five plans have certified as critical or red zone, one plan has certified as endangered or yellow zone and one has certified as seriously endangered or orange zone as defined by the PPA. In June 2009, the Company received a notice of a mass withdrawal termination and a notice of initial withdrawal liability from a multi-employer plan in which it participated. The Company had anticipated this event and as a result had accrued approximately $ 3.2 million as of January 3, 2009 based on the most recent information that was probable and estimable for this plan. The plan had given a notice of redetermination liability in
42
December 2009. In fiscal 2010, the Company received further third party information confirming the future payout related to this multi-employer plan. As a result, the Company reduced its liability to approximately $ 1.2 million . In fiscal 2010, another underfunded multi-employer plan in which the Company participates gave notification of partial withdrawal liability. As of June 30, 2012 , the Company has an accrued liability of approximately $ 1.0 million representing the present value of scheduled withdrawal liability payments under this multi-employer plan. While the Company has no ability to calculate a possible current liability for under-funded multi-employer plans that could terminate or could require additional funding under the PPA, the amounts could be material.
The Company announced on January 21, 2011 that a wholly-owned subsidiary of Darling entered into a limited liability company
agreement with a wholly-owned subsidiary of Valero Energy Corporation (“Valero”) to form Diamond Green Diesel Holdings LLC (the “Joint Venture”). The Joint Venture is owned 50% / 50% with Valero and was formed to design, engineer, construct and operate a renewable diesel plant (the “Facility”), which will be capable of producing approximately 9,300 barrels per day of renewable diesel fuel and certain other co-products, to be located adjacent to Valero's refinery in Norco, Louisiana. The Joint Venture is in the process of constructing the Facility under an engineering, procurement and construction contract that is intended to fix the Company's maximum economic exposure for the cost of the Facility.
On May 31, 2011, the Joint Venture and Diamond Green Diesel LLC, a wholly-owned subsidiary of the Joint Venture (“Opco”),
entered into (i) a facility agreement (the “Facility Agreement”) with Diamond Alternative Energy, LLC, a wholly-owned subsidiary of Valero (the “Lender”), and (ii) a loan agreement (the “Loan Agreement”) with the Lender, which will provide the Joint Venture with a 14 year multiple advance term loan facility of approximately $ 221,300,000 (the “JV Loan”) to support the design, engineering and construction of the Facility, which is now under construction. The Facility Agreement and the Loan Agreement prohibit the Lender from assigning all or any portion of the Facility Agreement or the Loan Agreement to unaffiliated third parties. Opco has also pledged substantially all of its assets to the Lender, and the Joint Venture has pledged all of Opco's equity interests to the Lender, until the JV Loan has been paid in full and the JV Loan has terminated in accordance with its terms.
Pursuant to sponsor support agreements executed in connection with the Facility Agreement and the Loan Agreement, each of the
Company and Valero are committed to contributing approximately $ 93.2 million of the estimated aggregate costs of approximately $ 407.7 million for the completion of the Facility. The Company is also required to pay for 50% of any cost overruns incurred in connection with the construction of the Facility, including relating to any project scope changes and working capital funding. As of the date of this report, it is anticipated that the project will incur an additional $ 8.1 million in costs related to project scope changes, of which the Company will be responsible for 50%. As of June 30, 2012 under the equity method of accounting, the Company has an investment in the Joint Venture of approximately $ 46.4 million included on the consolidated balance sheet.
The Company is aware that a third party patent holder has filed a patent infringement claim against a producer of renewable diesel fuel
and its owners. The producer is unrelated to the Company, the Joint Venture or, to our knowledge, Valero. The Company has not, and to its knowledge neither the Joint Venture or Valero has, received any communication from such patent holder regarding a similar claim against the Joint Venture. The Joint Venture has licensed a process from UOP LLC, a subsidiary of Honeywell International Inc., that it will utilize in producing renewable diesel fuel. The Company believes that the Joint Venture's process differs from the process that is the subject of the infringement suit. Accordingly, any patent infringement claim that might be asserted in the future against either the Company or the Joint Venture would be vigorously opposed.
The Company's management believes that cash flows from operating activities consistent with the level generated in the first six months
of fiscal 2012 , unrestricted cash and funds available under the Credit Agreement will be sufficient to meet the Company's working capital needs and maintenance and compliance-related capital expenditures, scheduled debt and interest payments, income tax obligations, continued funding of the Joint Venture and other contemplated needs through the next twelve months. Numerous factors could have adverse consequences to the Company that cannot be estimated at this time, such as: reductions in raw material volumes available to the Company due to weak margins in the meat production industry as a result of higher feed costs or other factors, reduced volume from food service establishments, reduced demand for animal feed, or otherwise; a reduction in finished product prices; changes to worldwide government policies relating to renewable fuels and greenhouse gas emissions that adversely affect programs like RFS2 and tax credits for bio-fuels both in the U.S. and abroad; possible product recall resulting from developments relating to the discovery of unauthorized adulterations to food or feed additives; the occurrence of Bird Flu in the U.S.; any additional occurrence of BSE in the U.S. or elsewhere; unanticipated costs and/or reductions in raw material volumes related to the Company's compliance with the Enhanced BSE Rule; unforeseen new U.S. or foreign regulations affecting the rendering industry (including new or modified animal feed, 2009 H1N1 flu, Bird Flu or BSE regulations); increased contributions to the Company's multi-employer and employer-sponsored defined benefit pension plans as required by the PPA or resulting from a mass withdrawal event; bad debt write-
43
offs; loss of or failure to obtain necessary permits and registrations; unexpected cost overruns related to the Joint Venture; continued or escalated conflict in the Middle East; and/or unfavorable export markets. These factors, coupled with volatile prices for natural gas and diesel fuel, general performance of the U.S. and global economies and declining consumer confidence including the inability of consumers and companies to obtain credit due to the current lack of liquidity in the financial markets, among others, could negatively impact the Company's results of operations in fiscal 2012 and thereafter. The Company cannot provide assurance that the cash flows from operating activities generated in the first six months of fiscal 2012 are indicative of the future cash flows from operating activities that will be generated by the Company's operations. The Company reviews the appropriate use of unrestricted cash periodically. Except for contributions to the Joint Venture and expenditures relating to the Company's ongoing enterprise resource planning system project, no decision has been made as to non-ordinary course cash usages at this time; however, potential usages could include: opportunistic capital expenditures and/or acquisitions; investments relating to the Company's developing a comprehensive renewable energy strategy, including, without limitation, potential investments in additional renewable diesel and/or biodiesel projects; investments in response to governmental regulations relating to human and animal food safety or other regulations; unexpected funding required by the PPA requirements or mass termination of multi-employer plans; and paying dividends or repurchasing stock, subject to limitations under the Credit Agreement and the Notes, as well as suitable cash conservation to withstand adverse commodity cycles.
The current economic environment in the Company's markets has the potential to adversely impact its liquidity in a variety of ways,
including through reduced raw materials availability, reduced finished product prices, reduced sales, potential inventory buildup, increased bad debt reserves, potential impairment charges and/or higher operating costs.
The principal products that the Company sells are commodities, the prices of which are based on established commodity markets and
are subject to volatile changes. Any decline in these prices has the potential to adversely impact the Company's liquidity. Any of a decline in raw material availability, a decline in commodities prices, increases in energy prices and the impact of the PPA has the potential to adversely impact the Company's liquidity. A decline in commodities prices, a rise in energy prices, a slowdown in the U.S. or international economy, continued or escalated conflict in the Middle East, cost overruns in the construction of the Facility or other factors, could cause the Company to fail to meet management's expectations or could cause liquidity concerns.
OFF BALANCE SHEET OBLIGATIONS
Based upon the underlying purchase agreements, the Company has commitments to purchase $ 19.8 million of commodity products consisting of approximately $ 11.6 million of finished products and approximately $ 8.2 million of natural gas and diesel fuel during the next twelve months, which are not included in liabilities on the Company’s balance sheet at June 30, 2012 . These purchase agreements are entered into in the normal course of the Company’s business and are not subject to derivative accounting. The commitments will be recorded on the balance sheet of the Company when delivery of these commodities occurs and ownership passes to the Company during the remainder of fiscal 2012 and into fiscal 2013 , in accordance with accounting principles generally accepted in the U.S.
Based on the sponsor support agreements executed in connection with the Facility Agreement and the Loan Agreement relating to the Joint Venture with Valero, the Company has committed to contribute approximately $ 93.2 million of the estimated aggregate costs for completion of the Facility. As of June 30, 2012 , the Company has contributed approximately $ 48.8 million and will incur the remaining amount of the commitment through the completion date of the Facility which is expected by the end of fiscal 2012 or early in fiscal 2013 . The Company is also required to pay for 50% of any cost overruns incurred in connection with the construction of the Facility, including relating to any project scope changes and working capital funding. As of the date of this report, it is anticipated that the project will incur an additional $ 8.1 million in costs related to project scope changes, of which the Company will be responsible for 50% .
Based upon the underlying lease agreements, the Company expects to pay approximately $ 15.9 million in operating lease obligations
during the next twelve months, which are not included in liabilities on the Company’s balance sheet at June 30, 2012 . These lease obligations are included in cost of sales or selling, general and administrative expense as the underlying lease obligation comes due, in accordance with accounting principles generally accepted in the U.S. NEW ACCOUNTING PRONOUNCEMENTS
In June 2011 , the FASB issued ASU No. 2011-05 , Presentation of Comprehensive Income . The ASU amends ASC Topic 220 , Comprehensive Income . The new standard eliminates the option to report other comprehensive income and its components in the statement of changes in equity and instead requires entities to present net income and other comprehensive income in either a single continuous statement or in two separate, but consecutive, statements of net income and other
44
comprehensive income. Reclassification adjustments between net income and other comprehensive income must be shown on the face of the statement(s), with no resulting change in net earnings. In December 2011 , the FASB issued ASU No. 2011-12 , Deferral of Effective Date for Amendments to the Presentation of Reclassifications of Items Out of Accumulated Other Comprehensive Income in Accounting Standards Update No. 2011-05 . This ASU amends ASC Topic 220 , Comprehensive Income . The new standard deferred the requirement to present on the face of the financial statements reclassification adjustments for items that are reclassified from other comprehensive income to net income while the FASB further deliberates this aspect of the proposal. This update is effective for the Company on January 1, 2012 and must be applied retrospectively. The Company adopted this standard as of March 31, 2012. The adoption did not have a material impact on the Company's consolidated financial statements.
In September 2011 , the FASB issued ASU No. 2011-08 , Testing Goodwill for Impairment . The ASU amends ASC Topic 350 ,
Intangibles - Goodwill and Other . The new standard is intended to reduce the cost and complexity of the annual goodwill impairment test by providing entities an option to perform a “qualitative” assessment to determine whether further impairment testing is necessary. Specifically, an entity has the option to first assess qualitative factors to determine whether it is necessary to perform the current two-step test. If an entity believes, as a result of its qualitative assessment, that it is more-likely-than-not that the fair value of a reporting unit is less than its carrying amount, the quantitative impairment test is required. Otherwise, no further testing is required. This standard is effective for annual and interim goodwill impairment tests performed for fiscal years beginning after December 15, 2011. The Company adopted this standard in the first quarter of 2012 and the adoption did not have a material impact on the Company's consolidated financial statements.
In July 2012 , the FASB issued ASU No. 2012-02 , Testing Indefinite-Lived Intangible Assets for Impairment . The ASU amends ASC
Topic 350 , Intangibles - Goodwill and Other . The new standard is intended to reduce the cost and complexity of performing an impairment test for indefinite-lived intangible assets by providing entities an option to perform a "qualitative" assessment to determine whether further impairment testing is necessary. The new standard allows an entity to first assess qualitative factors to determine if it is more likely than not that the fair value of an indefinite-lived intangible asset is less than its carrying amount. If based on its qualitative assessment an entity concludes it is more likely than not that the fair value of an indefinite-lived intangible asset is less than its carrying amount, quantitative impairment testing is required. However, if an entity concludes otherwise, quantitative impairment testing is not required. The standards update is effective for annual and interim impairment tests performed for fiscal years beginning after September 15, 2012, with early adoption permitted. The Company is currently evaluating the impact of adopting this standard.
FORWARD LOOKING STATEMENTS
This Quarterly Report on Form 10-Q includes “forward-looking” statements that involve risks and uncertainties. The words “believe,”“anticipate,” “expect,” “estimate,” “intend,” “could,” “may,” “will,” “should,” “planned,” “potential,” and similar expressions identify forward-looking statements. All statements other than statements of historical facts included in the Quarterly Report on Form 10-Q, including, without limitation, the statements under the sections entitled “Management’s Discussion and Analysis of Financial Condition and Results of Operations”and located elsewhere herein regarding industry prospects, expectations for construction of the Facility and the Company’s financial position are forward-looking statements. Actual results could differ materially from those discussed in the forward-looking statements as a result of certain factors, including many that are beyond the control of the Company. Although the Company believes that the expectations reflected in these forward-looking statements are reasonable, it can give no assurance that these expectations will prove to be correct.
In addition to those factors discussed under the heading “Risk Factors” in Item 1A of Part I of the Company’s annual report on Form 10-K for the year ended December 31, 2011 , and in the Company’s other public filings with the SEC, important factors that could cause actual results to differ materially from the Company’s expectations include: the Company’s continued ability to obtain sources of supply for its rendering operations; general economic conditions in the American, European and Asian markets; a decline in consumer confidence; prices in the competing commodity markets which are volatile and are beyond the Company’s control; energy prices; changes to worldwide government policies relating to renewable fuels and greenhouse gas emissions; the implementation of the Enhanced BSE Rule; BSE and its impact on finished product prices, export markets, energy prices and government regulations, which are still evolving and are beyond the Company’s control; the occurrence of Bird Flu in the U.S.; possible product recall resulting from developments relating to the discovery of unauthorized adulterations (such as melamine or salmonella) to food additives; increased contributions to the Company’s multi-employer defined benefit pension plans as required by the PPA or required by a withdrawal event; risks, including future expenditures, relating to the Company's Joint Venture with Valero to construct and complete a renewable diesel plant in Norco, Louisiana and possible difficulties completing and obtaining operational viability with the plant; risks relating to possible third party claims of intellectual property infringement; challenges associated with the Company's ongoing enterprise resource planning system project, including material deviations from the project or unsuccessful execution of the
45
implementation plan for the project; and the Company's ability to combine Darling's business and Griffin's business and to realize the anticipated growth opportunities and cost synergies and to integrate the two businesses efficiently. Among other things, future profitability may be affected by the Company’s ability to grow its business, which faces competition from companies that may have substantially greater resources than the Company. The Company cautions readers that all forward-looking statements speak only as of the date made, and the Company undertakes no obligation to update any forward-looking statements, whether as a result of changes in circumstances, new events or otherwise.
Item 3. QUANTITATIVE AND QUALITATIVE DISCLOSURES ABOUT MARKET RISKS
Market risks affecting the Company are exposures to changes in prices of the finished products the Company sells, interest rates on debt, availability of raw material supply and the price of natural gas and diesel fuel used in the Company's plants. Raw materials available to the Company are impacted by seasonal factors, including holidays, when raw material volume declines; warm weather, which can adversely affect the quality of raw material processed and finished products produced; and cold weather, which can impact the collection of raw material. Predominantly all of the Company's finished products are commodities that are generally sold at prices prevailing at the time of sale.
The Company makes limited use of derivative instruments to manage cash flow risks related to interest expense, natural gas usage, diesel fuel usage and inventory. The Company does not use derivative instruments for trading purposes. Interest rate swaps are entered into with the intent of managing overall borrowing costs by reducing the potential impact of increases in interest rates on floating-rate long-term debt. Natural gas swaps and options are entered into with the intent of managing the overall cost of natural gas usage by reducing the potential impact of seasonal weather demands on natural gas that increases natural gas prices. Heating oil swaps and options are entered into with the intent of managing the overall cost of diesel fuel usage by reducing the potential impact of seasonal weather demands on diesel fuel that increases diesel fuel prices. Inventory swaps and options are entered into with the intent of managing seasonally high concentrations of MBM, PM, BFT, PG, YG and BBP inventories by reducing the potential impact of decreasing prices. The interest rate swaps and the natural gas swaps are subject to the requirements of FASB authoritative guidance. Some of the Company's natural gas and diesel fuel instruments are not subject to the requirements of FASB authoritative guidance because some of the natural gas and diesel fuel instruments qualify as normal purchases as defined in FASB authoritative guidance. At June 30, 2012 , the Company had natural gas swaps outstanding that qualified and were designated for hedge accounting as well as heating oil swaps and heating oil and corn options that did not qualify and were not designated for hedge accounting.
In fiscal 2011 and the first quarter of fiscal 2012, the Company has entered into natural gas contracts that are considered cash flow
hedges according to FASB authoritative guidance. Under the terms of the natural gas swap contracts the Company fixed the expected purchase cost of a portion of its plants expected natural gas usage into the third quarter of fiscal 2012. As of June 30, 2012 , the aggregate fair value of these natural gas swaps was approximately $ 0.1 million and is included in accrued expenses on the balance sheet, with an offset recorded in accumulated other comprehensive income for the effective portion.
Additionally, the Company had heating oil swaps and heating oil and corn options that are marked to market because they did not
qualify for hedge accounting at June 30, 2012 . The heating oil swaps and heating oil and corn options had an aggregate fair value of approximately $ 0.2 million and are included in other current assets and accrued expenses at June 30, 2012 .
As of June 30, 2012 , the Company had forward purchase agreements in place for purchases of approximately $ 8.2 million of natural gas and diesel fuel in fiscal 2012 . As of June 30, 2012 , the Company had forward purchase agreements in place for purchases of approximately $ 11.6 million of finished product in fiscal 2012 .
Item 4. CONTROLS AND PROCEDURES
Evaluation of Disclosure Controls and Procedures. As required by Exchange Act Rule 13a-15(b), the Company's management, including the Chief Executive Officer and Chief Financial Officer, conducted an evaluation, as of the end of the period covered by this report, of the effectiveness of the design and operation of the Company's disclosure controls and procedures. As defined in Exchange Act Rules 13a-15(e) and 15d-15(e) under the Exchange Act, disclosure controls and procedures are controls and other procedures of the Company that are designed to ensure that information required to be disclosed by the Company in the reports it files or submits under the Exchange Act is recorded, processed, summarized and reported within the time periods specified in the SEC's rules and forms. Disclosure controls and procedures include, without limitation, controls and procedures designed to ensure that information required to be disclosed by the Company in the reports it files or submits under the Exchange Act is accumulated and communicated to the Company's management, including the Chief Executive Officer and Chief Financial Officer, as appropriate to allow timely decisions regarding required disclosure. Because of its inherent limitations, internal control over financial reporting may not prevent or detect
46

misstatements. Projections of any evaluation of effectiveness to future periods are subject to the risk that controls may become inadequate because of changes in conditions, or that the degree of compliance with the policies or procedures may deteriorate.
Based on management’s evaluation, the Chief Executive Officer and Chief Financial Officer concluded that the Company's disclosure controls and procedures were effective as of the end of the period covered by this report.
Changes in Internal Control over Financial Reporting . As required by Exchange Act Rule 13a-15(d), the Company’s management, including the Chief Executive Officer and Chief Financial Officer, also conducted an evaluation of the Company’s internal control over financial reporting to determine whether any change occurred during the quarter covered by this report that has materially affected, or is reasonably likely to materially affect, the Company’s internal control over financial reporting. Based on that evaluation, there has been no change in the Company’s internal control over financial reporting during the quarter covered by this report that has materially affected, or is reasonably likely to materially affect, the Company’s internal control over financial reporting.
47

DARLING INTERNATIONAL INC. AND SUBSIDIARIES FORM 10-Q FOR THE QUARTERLY PERIOD ENDED JUNE 30, 2012
PART II: Other Information
Item 6. EXHIBITS
The following exhibits are filed herewith:
48
10.1 Darling International Inc. 2012 Omnibus Incentive Plan (filed as Exhibit 99 to the Company's Registration
Statement on Form S-8 filed on May 31, 2012, and incorporated herein by reference).
31.1 Certification pursuant to Rule 13a-14(a) or Rule 15d-14(a) of the Securities Exchange Act of 1934, of Randall C. Stuewe, the Chief Executive Officer of the Company.
31.2 Certification pursuant to Rule 13a-14(a) or Rule 15d-14(a) of the Securities Exchange Act of 1934, of John O. Muse, the Chief Financial Officer of the Company.
32 Certification pursuant to 18 U.S.C. Section 1350, as adopted pursuant to Section 906 of the Sarbanes-Oxley Act of 2002, of Randall C. Stuewe, the Chief Executive Officer of the Company, and of John O. Muse, the Chief Financial Officer of the Company.
101 Interactive Data Files Pursuant to Rule 405 of Regulation S-T: (i) Consolidated Balance Sheets as of June 30, 2012 and December 31, 2011; (ii) Consolidated Statements of Operations for the three and six months ended June 30, 2012 and July 2, 2011; (iii) Consolidated Statements of Comprehensive Income for the three and six months ended June 30, 2012 and July 2, 2011; (iv) Consolidated Statements of Cash Flows for the three and six months ended June 30, 2012 and July 2, 2011; (v) Notes to the Consolidated Financial Statements
SIGNATURES Pursuant to the requirements of the Securities Exchange Act of 1934, the registrant has duly caused this report to be signed on its behalf by the undersigned thereunto duly authorized.
49
DARLING INTERNATIONAL INC.
Date: August 9, 2012 By: /s/ Randall C. Stuewe
Randall C. Stuewe
Chairman and
Chief Executive Officer
Date: August 9, 2012 By: /s/ John O. Muse
John O. Muse
Executive Vice President
Administration and Finance
(Principal Financial Officer)
EXHIBIT 31.1 CERTIFICATION I, Randall C. Stuewe, certify that:
/s/ Randall C. Stuewe -----------------------------------------------
Randall C. Stuewe Chief Executive Officer
1. I have reviewed this quarterly report on Form 10-Q of Darling International Inc.;
2. Based on my knowledge, this report does not contain any untrue statement of a material fact or omit to state a material fact necessary to make the statements made, in light of the circumstance under which such statements were made, not misleading with respect to the period covered by this report;
3. Based on my knowledge, the financial statements, and other financial information included in this report, fairly present in all material respects the financial condition, results of operations and cash flows of the registrant as of, and for, the periods presented in this report;
4. The registrant's other certifying officer(s) and I are responsible for establishing and maintaining disclosure controls and procedures (as defined in Exchange Act Rules 13a-15(e) and 15d-15(e)) and internal control over financial reporting (as defined in Exchange Act Rules 13a-15(f) and 15d-15(f)) for the registrant and have:
(a) Designed such disclosure controls and procedures, or caused such disclosure controls and procedures to be designed under our supervision, to ensure that material information relating to the registrant, including its consolidated subsidiaries, is made known to us by others within those entities, particularly during the period in which this report is being prepared;
(b) Designed such internal control over financial reporting, or caused such internal control over financial reporting to be designed under our supervision, to provide reasonable assurance regarding the reliability of financial reporting and the preparation of financial statements for external purposes in accordance with generally accepted accounting principles;
(c) Evaluated the effectiveness of the registrant's disclosure controls and procedures and presented in this report our conclusions about the effectiveness of the disclosure controls and procedures, as of the end of the period covered by this report based on such evaluation; and
(d) Disclosed in this report any change in the registrant's internal control over financial reporting that occurred during the registrant's most recent fiscal quarter (the registrant's fourth fiscal quarter in the case of an annual report) that has materially affected, or is reasonably likely to materially affect, the registrant's internal control over financial reporting; and
5. The registrant's other certifying officer(s) and I have disclosed, based on our most recent evaluation of internal control over financial reporting, to the registrant's auditors and the audit committee of the registrant's board of directors (or persons performing the equivalent functions):
(a) All significant deficiencies and material weaknesses in the design or operation of internal control over financial reporting which are reasonably likely to adversely affect the registrant's ability to record, process, summarize and report financial information; and
(b) Any fraud, whether or not material, that involves management or other employees who have a significant role in the registrant's internal control over financial reporting.
Date: August 9, 2012
EXHIBIT 31.2 CERTIFICATION I, John O. Muse, certify that:
/s/ John O. Muse -----------------------------------------------
John O. Muse Chief Financial Officer
1. I have reviewed this quarterly report on Form 10-Q of Darling International Inc.;
2. Based on my knowledge, this report does not contain any untrue statement of a material fact or omit to state a material fact necessary to make the statements made, in light of the circumstance under which such statements were made, not misleading with respect to the period covered by this report;
3. Based on my knowledge, the financial statements, and other financial information included in this report, fairly present in all material respects the financial condition, results of operations and cash flows of the registrant as of, and for, the periods presented in this report;
4. The registrant's other certifying officer(s) and I are responsible for establishing and maintaining disclosure controls and procedures (as defined in Exchange Act Rules 13a-15(e) and 15d-15(e)) and internal control over financial reporting (as defined in Exchange Act Rules 13a-15(f) and 15d-15(f)) for the registrant and have:
(a) Designed such disclosure controls and procedures, or caused such disclosure controls and procedures to be designed under our supervision, to ensure that material information relating to the registrant, including its consolidated subsidiaries, is made known to us by others within those entities, particularly during the period in which this report is being prepared;
(b) Designed such internal control over financial reporting, or caused such internal control over financial reporting to be designed under our supervision, to provide reasonable assurance regarding the reliability of financial reporting and the preparation of financial statements for external purposes in accordance with generally accepted accounting principles;
(c) Evaluated the effectiveness of the registrant's disclosure controls and procedures and presented in this report our conclusions about the effectiveness of the disclosure controls and procedures, as of the end of the period covered by this report based on such evaluation; and
(d) Disclosed in this report any change in the registrant's internal control over financial reporting that occurred during the registrant's most recent fiscal quarter (the registrant's fourth fiscal quarter in the case of an annual report) that has materially affected, or is reasonably likely to materially affect, the registrant's internal control over financial reporting; and
5. The registrant's other certifying officer(s) and I have disclosed, based on our most recent evaluation of internal control over financial reporting, to the registrant's auditors and the audit committee of the registrant's board of directors (or persons performing the equivalent functions):
(a) All significant deficiencies and material weaknesses in the design or operation of internal control over financial reporting which are reasonably likely to adversely affect the registrant's ability to record, process, summarize and report financial information; and
(b) Any fraud, whether or not material, that involves management or other employees who have a significant role in the registrant's internal control over financial reporting.
Date: August 9, 2012
EXHIBIT 32
CERTIFICATION PURSUANT TO
18 U.S.C. SECTION 1350,
AS ADOPTED PURSUANT TO
SECTION 906 OF THE SARBANES-OXLEY ACT OF 2002 In connection with the Quarterly Report of Darling International Inc. (the “Company”) on Form 10-Q for the period ending June 30, 2012 as filed with the Securities and Exchange Commission on the date hereof (the “Report”), the undersigned, Randall C. Stuewe, Chief Executive Officer of the Company and John O. Muse, Chief Financial Officer of the Company, each hereby certifies, pursuant to 18 U.S.C. §1350, as adopted pursuant to §906 of the Sarbanes-Oxley Act of 2002 (the “Act”), that: 1. The Report fully complies with the requirements of Section 13(a) or 15(d) of the Securities Exchange Act of 1934; and 2. The information contained in the Report fairly presents, in all material respects, the financial condition and results of operations of the Company. This certification is being furnished solely for purposes of compliance with the Act.
/s/ Randall C. Stuewe /s/ John O. Muse
Randall C. Stuewe John O. Muse
Chief Executive Officer Chief Financial Officer
Date: August 9, 2012 Date: August 9, 2012