data 1992-1996 8themenkreis 8 – theme 8 – thÈme …edz.bib.uni-mannheim.de/ · cyanamid agro...
TRANSCRIPT

▲8EUROPÄISCHE KOMMISSION
EUROPEAN COMMISSIONCOMMISSION EUROPÉENNE
THEMENKREIS 8 – THEME 8 – THÈME 8Umwelt und EnergieEnvironment and energyEnvironnement et énergie
20
00
ED
ITIO
N
Pflanzenschutz in der EU— Einsatz von Pflanzenschutzmitteln in der Europäischen Union
Daten 1992-1996
Plant protection in the EU— Consumption of plant protection products in the European Union
Data 1992-1996
Protection des cultures dans l’UE— Consommation de produitsphytosanitaires dans l’Union européenne
Données 1992-1996

Zahlreiche weitere Informationen zur Europäischen Union sind verfügbar über Internet, Server Europa (http://europa.eu.int).A great deal of additional information on the European Union is available on the Internet.It can be accessed through the Europa server (http://europa.eu.int).De nombreuses autres informations sur l'Union européenne sont disponibles sur Internet via le serveur Europa (http://europa.eu.int).
Bibliographische Daten befinden sich am Ende der Veröffentlichung.Cataloguing data can be found at the end of this publication.Une fiche bibliographique figure à la fin de l'ouvrage.
Luxembourg: Office des publications officielles des Communautés européennes, 2000
ISBN 92-894-0437-X
© Europäische Gemeinschaften, 2000© European Communities, 2000© Communautés européennes, 2000
Printed in Luxembourg
GEDRUCKT AUF CHLORFREI GEBLEICHTEM PAPIER
PRINTED ON WHITE CHLORINE-FREE PAPER
IMPRIMÉ SUR PAPIER BLANCHI SANS CHLORE

ACKNOWLEDGEMENTS
Eurostat would like to thank the ECPA task force, the marketing research representatives of the fullmembers of the European Crop Protection Manufacturers Association, for providing the datapresented in this report. The opinions expressed are those of the individual author alone and do notnecessarily reflect the official views of the European Commission.
& & & &
Beteiligte / Contributors / Contributeurs:
Belgique / België MonsantoAgriculture Group270-272 Avenue de TervurenB-1150 BRUSSELS
Cyanamid Agro S.A./N.V.Chaussée de Tirlemont 105B-5030 GEMBLOUX
Deutschland Bayer AGDept. Agriculture and EnvironmentCrop protection Business GroupD-51368 LEVERKUSEN Bayerwerk
BASF AGAgricultural CentreD-67114 LIMBURGERHOF
Hoechst Schering AgrEvo GmbHIndustriepark Hoechst, K 607D-65295 FRANKFURT
Rhône-Poulenc AgroKaiserwertherstr. 115D-40880 DUSSELDORF
France Du Pont de Nemours137 rue de l'UniversitéF-75334 PARIS
Dow AgrosciencesBuropolis, BP 229F-06904 SOPHIA ANTIPOLIS
United Kingdom Zeneca AgrochemicalsFernhurstHASLEMERE, SURREY GU27 3JE
Schweiz Novartis Crop Protection AGCP 3.41CH-4002 BASLE
Project coordination:Rosemary MontgomeryJakob-Peter Hansen
Production:Desktop PublishingWorld Systems (Europe) Limited, [email protected]
For further information please contactEurostat:
Rosemary MontgomeryEnvironment Statistics
Tel: (352) 4301 – 37292Fax (352) 4301 – 37316E-mail [email protected]

VORWORT NACH EUROSTAT
Im letzten Jahrzehnt entstand in der Europäischen Union ein wachsender Bedarf an aussagekräftigen undakkuraten Statistiken über die Verwendung von Pestiziden1 . Im Fünften Umwelt-Aktionsprogramm der EUwurden eine Reihe von Zielen für das Jahr 2000 formuliert, unter anderem "die signifikante Verringerung desPestizideinsatzes je bewirtschaftete Flächeneinheit, und Hinwendung zu Methoden der integriertenSchädlingsbekämpfung, zumindest in Gebieten, die für den Naturschutz von Bedeutung sind".
Verringerungen, die nur als Gesamtvolumen von verkauften oder auf landwirtschaftliche Flächenausgebrachten Pestiziden angegeben werden, geben jedoch wenig Aufschluß über das Risiko für dieUmwelt oder die menschliche Gesundheit, da viele neue Wirkstoffe in wesentlich geringerer Aufwandmengeje Hektar ausgebracht werden als die älteren Mittel, die sie ersetzen und so eine signifikante Verringerungder ausgebrachten Mengen mit sich bringen, ohne notwendigerweise eine Verringerung der Anwendungenoder der Risiken zu bewirken. Die Charakteristik des einzelnen Wirkstoffes wie seine Toxizität aufverschiedene Arten, ihre Verweildauer in der Umwelt, sowie die Zwischenprodukte, die beim Abbauentstehen, spielen in jeder Risikobewertung für die Umwelt ebenfalls eine Rolle. Daher wird klar, daß Datenüber den Einsatz individueller Wirkstoffe eine Grundvoraussetzung für eine sinnvolle Analyse derAuswirkung von Änderungen in der Reglementierung des Pestizideinsatzes über einen bestimmten Zeitraumsind.
Bedauerlicherweise erhebt derzeit nur eine Handvoll von EU-Ländern regelmäßig statistische Daten überMengen einzelner in Landwirtschaft und Gartenbau eingesetzter Wirkstoffe. Beim Versuch, diese Lücke zuschließen, nahm Eurostat Verbindung mit der Pflanzenschutzmittel herstellenden Industrie über derenEuropäischen Verband ECPA (European Crop Protection Association) auf. Die Mitglieder der ECPAerklärten sich dazu bereit, Eurostat ihre Daten über die Verwendung von Herbiziden, Fungiziden undInsektiziden in den wichtigsten in der EU angebauten Kulturen zur Verfügung zu stellen. Verschiedenedieser Daten sind kommerziell sensitiv und daher vertraulich. Die Daten werden in einer Form präsentiert,die Vertraulichkeit sicherstellt und dennoch sinnvolle Information liefert. Die Pestizid-Datenbank enthältnatürlich wesentlich mehr Daten, als hier präsentiert werden können. Mehr Details werden über EurostatsCronos Datanbank zur Verfügung gestellt.
Der erfasste Zeitraum, 1992-1996, ist eine Periode, in der die Landwirte sich auf die Reform derGemeinsamen Agrarpolitik von 1992 (CAP, Common Agricultural Policy) einstellen mußten, die nicht nur dieInterventionspreise signifikant verringerte, sondern auch die Marktpreise für Getreide und Ölsaaten.Zusätzlich wurden erhebliche Flächen während dieser Periode stillgelegt. Die auf die Landwirtschaft undUmwelt bezogenen Maßnahmen, die mit der 1992er Reform einher gingen, ermutigten die Integration desUmweltgedankens in die landwirtschaftliche Erzeugung durch Unterstützung substanzieller Verringerungenbei der Verwendung von Pestiziden sowie die Förderung des biologischen Landbaus. Daher sind dieseJahre ein interessanter Zeitraum für Studien.
Eurostat möchte der ECPA und ihren Mitgliedsfirmen für ihre Kooperation bei der Bereitstellung dieser Datenund der Erstellung dieser Publikation danken, insbesondere Herrn Lothar Jacob, der die Daten im Auftragder ECPA zusammengestellt und die einzelnen Kapitel entworfen hat.
1 Der Begriff “Pestizid” wird in Bezug auf Pflanzenschutzmittel verwendet.

FOREWORD BY EUROSTAT
During the last decade, there has been a growing need within the European Union for meaningful andaccurate statistics on pesticide2 use. The EU’s Fifth Environmental Action Programme sets out a series oftargets for the year 2000, including "the significant reduction in pesticide use per unit of land underproduction, and conversion to methods of integrated pest control, at least in areas of importance for natureconservation".
Reductions explained only in terms of total volume of pesticide sold or applied to agricultural land howevertell little about the risk to the environment or to human health, as many new active substances are applied atmuch lower rates per hectare than the older products they are replacing, bringing about significantreductions in the weight applied, without necessarily resulting in a corresponding reduction of use or risk.The characteristics of the individual active ingredients, such as toxicity to different species, persistence in theenvironment, and the by-products which result from degradation, also play a role in any evaluation of risk tothe environment. It therefore becomes clear that data on the use of individual active ingredients is a basicrequirement for a meaningful analysis of the impact of policy changes on pesticide use over time.
Unfortunately only a handful of EU countries currently collect regular statistics on the quantities of individualactive ingredients used in agriculture and horticulture. To try to fill this data gap, Eurostat contacted thepesticide manufacturing industry, through their European association, ECPA (European Crop ProtectionAssociation). The members of ECPA agreed to provide Eurostat with their data on use of herbicides,fungicides and insecticides on the major crops grown in the EU. Some of this data is commercially sensitive,and therefore confidential. The data are presented in such a way as to respect this confidentiality while stillproviding useful information. The pesticides database of course contains more data than can be presentedhere. More detail will be made available in Eurostat’s Cronos database.
The period covered, 1992-1996, is a period when farmers had to adjust to the 1992 reform of the CommonAgricultural Policy (CAP), which decreased significantly not only intervention prices but also market prices forcereals and oilseeds. In addition significant areas of land have been set aside in that period. The agri-environmental measures which accompanied the CAP reform of 1992 encouraged the integration ofenvironmental concerns into the farming industry through support for substantial reductions in the use ofpesticides, as well as encouraging organic farming. Therefore these years are an interesting period to study.
Eurostat would like to thank ECPA and its member companies for their co-operation in supplying this dataand in the production of this publication, and in particular Mr Lothar Jakob who, on behalf of ECPA, broughtthe data together, and drafted the different chapters.
2 The word ‘pesticide’ is used to refer to plant protection products.

AVANT-PROPOS PAR EUROSTAT
Au cours des dix dernières années, les besoins de statistiques significatives et précises sur l’utilisation despesticides3 n’ont cessé de s’accroître dans la Communauté Européenne. Le Cinquième Programme dePolitique et d’Actions en matière d’environnement établit une série de mesures à prendre d'ici l’an 2000,parmi lesquelles "une réduction importante de l’utilisation de pesticides par unité de sol cultivé et laconversion à des méthodes d’action phytosanitaire intégrée, tout au moins dans les régions qui revêtent uneimportance du point de vue de la conservation de la nature”.
Les réductions qui ne se rapportent qu’au volume total de produits phytosanitaires vendu ou appliqué sur lesterres agricoles ne suffisent pas néanmoins pour traduire le risque pour l’environnement et la santé publiquedans la mesure où un grand nombre de nouvelles substances actives sont appliquées à des doses parhectare beaucoup plus faibles que les anciens produits qu’ils remplacent, ce qui entraîne des baissesconsidérables du volume appliqué sans pour autant aboutir à une diminution de l’utilisation ou du risque. Lescaractéristiques des différentes matières actives, telles que la toxicité pour les différentes espèces, lapersistance dans l’environnement et les composés résultant de la dégradation des produits, jouent aussi unrôle dans l’évaluation du risque pour l’environnement. En conséquence, il est évident que les donnéesrelatives à l’utilisation des différentes matières actives sont essentielles pour permettre une évaluationpertinente des effets des changements de politique sur l’utilisation des pesticides.
Malheureusement, à l’heure actuelle, seule une poignée de pays de l’UE recueille régulièrement desstatistiques sur les quantités des différentes matières actives utilisées en agriculture et en horticulture. Afind’essayer de combler cette lacune, Eurostat a pris contact avec les industries de production de produitsphytosanitaires, au travers de leur association européenne, l’ECPA (European Crop Protection Association).Les membres de l’ECPA ont accepté de fournir à Eurostat leurs données sur l'utilisation des herbicides, desfongicides et des insecticides sur les principales cultures de l’UE Certaines de ces données sont « sensibles» sur un plan commercial, et par conséquent confidentielles. Les données sont présentées de façon àrespecter cette confidentialité tout en fournissant néanmoins des informations utiles. La base de donnéesrelative aux produits phytosanitaires contient évidemment davantage de statistiques que celles présentéesici. Davantage de précision sera mise à disposition dans la base de données Cronos d'Eurostat.
La période considérée, 1992-1996, correspond à celle où les agriculteurs ont dû s'adapter à la réforme de laPolitique agricole commune (PAC) de 1992, qui a diminué de façon sensible non seulement les prixd'intervention mais aussi les prix du marché pour les céréales et les plantes oléagineuses. En outre, unnombre significatif de parcelles agricoles ont été mises en jachère durant cette période. Les mesures agri-environnementales qui ont accompagné la réforme de la PAC de 1992 ont encouragé l'intégration despréoccupations environnementales dans le mode d’exploitation agricole en appuyant les réductionssubstantielles de l'utilisation des produits phytosanitaires et en encourageant l'agriculture biologique. Parconséquent, ces années constituent une période interessante à étudier.
Eurostat souhaiterait remercier l’ECPA et ses sociétés membres pour leur coopération dans la fourniture dedonnées et dans la production de cette publication, et notamment M. Lothar Jakob qui au nom de l’ECPA, aréuni ces données, et a rédigé les différents chapitres.
3 Le mot <<pesticide>> est utilisé pour faire référence aux produits phytosanitaires.
Verzeichnisder Abkürzungen
Table ofabbreviations
Listedes abréviations
WS Wirkstoff AI Active Ingredient MA Matière active
WS/ha Wirkstoff je Hektar AI/ha Active ingredient per hectare MA/ha Matière active par hectare
BCPCBritish Crop ProtectionCouncil
BCPCBritish Crop ProtectionCouncil
BCPCBritish Crop ProtectionCouncil
GAP GemeinsameAgrarpolitik CAP Common Agricultural Policy PAC Politique agricole commune
ECPAEuropean Crop ProtectionAssociation
ECPAEuropean Crop ProtectionAssociation
ECPA.Association européenne deprotection des cultures
F Fungizide F Fungicide F Fongicide
ha Hektar ha hectare ha hectare
H Herbizide H Herbicide H Herbicide
g/l Gramm pro Liter g/l gramme per litre g/l gramme par litre
I Insektizide I Insecticide I Insecticide
kg Kilogramm kg kilogramme kg kilogramme
PSMPflanzenschutzmittel
PPPPlant ProtectionProducts
PPPProduits de protectionphytosanitaire
T Tonne t tonne t tonne
UVKUmfassendeVegetationskontrolle
TVCTotal VegetationControl
Herbicides/ totauxDésherbants totaux
nG nach Gewicht w/w Weight for weight P/P Poids/poids
nV nach Volumen w/v Weight for volume P/V Poids/volume
SYMBOLE SYMBOLS SYMBOLES
0
Wert “0” oder Angabeweniger als die Hälfte derletzten verwendetenDezimale
0
Value “0” or less than halfof the unit used
0
Valeur “0” ou donnéeinférieure à la moitié del’unité utilisée
:Kein Nachweisvorhanden
:Data not available
:Donnée non disponible
* Schätzung * Estimation * Estimation
c Vertrauliche Daten c Confidential data c Donnée confidentielle
- Nicht anwendbar - Not applicable - Non applicable

A Pflanzenschutz / Plant protection / Protection des cultures 9
INHALTSVERZEICHNIS
DEUTSCHER TEXT ........................................................................................................................................ 15-43
ENGLISCHER TEXT ....................................................................................................................................... 53-79
FRANZÖSISCHER TEXT............................................................................................................. ................. 89-117
1. PFLANZENSCHUTZ IN DER EU .................................................................................................... .........15
Einleitung nach Eurostat ...................................................................................................................17
Einleitung nach ECPA.......................................................................................................................21
2. METHODIK UND METADATEN ....................................................................................................... .......23
2.1 Datenquellen und Erfassungsbereich der vorliegenden Erhebung...................................................25
2.2 Methodik ............................................................................................................................................25
2.3 Beschreibung der Pflanzenschutzmittelgruppen...............................................................................28
2.3.1 Herbizide ......................................................................................................................................28
2.3.2 Fungizide......................................................................................................................................29
2.3.3 Insektizide ....................................................................................................................................29
3. WICHTIGSTE ERGEBNISSE UND ANMERKUNGEN NACH EBENE DER
EUROPÄISCHEN UNION.........................................................................................................................31
3.1 Einsatz von Pflanzenschutzmitteln – Entwicklung und derzeitige Lage............................................33
3.2 Untergliederung der eingesetzten Pflanzenschutzmittel nach Mitgliedstaaten.................................35
3.3 Zielkulturen des Pflanzenschutzmitteleinsatzes................................................................................36
3.4 Chemische Klassen von Pflanzenschutzmitteln................................................................................39
4. KOMMENTARE NACH EBENE DER MITGLIEDSTAATEN...................................................................43
5. DETAILLIERTE TABELLEN NACH EBENE DER EUROPÄISCHEN UNION......................................127
6. HAUPTRESULTATE NACH EBENE DER MITGLIEDSTAATEN .........................................................139
Belgien / Luxemburg (B/L)...............................................................................................................142
Dänemark (DK) ...............................................................................................................................146
Deutschland (D) ..............................................................................................................................150
Griechenland (EL) ...........................................................................................................................155
Spanien (E)......................................................................................................................................160
Frankreich (F)..................................................................................................................................165
Irland (IRL).......................................................................................................................................170
Italien (I)...........................................................................................................................................174
Die Niederlande (NL).......................................................................................................................179
Österreich (A) ..................................................................................................................................183
Portugal (P) .....................................................................................................................................188

10 Pflanzenschutz / Plant protection / Protection des cultures A
INHALTSVERZEICHNIS
Finnland (FIN)..................................................................................................................................193
Schweden (S) ..................................................................................................................................197
Vereinigtes Königreich (UK) ............................................................................................................201
ANHANG.................................................................................................................................................207
Anhang A: Von der chemischen Kurzbezeichnung von WS zu chemischen Klassen ....................209
Anhang B: WS nach chemischen Klassen......................................................................................221

A Pflanzenschutz / Plant protection / Protection des cultures 11
TABLE OF CONTENTS
GERMAN TEXT............................................................................................................................................... 15-43
ENGLISH TEXT............................................................................................................................................... 53-79
FRENCH TEXT.............................................................................................................................................. 89-117
1. PLANT PROTECTION IN THE EU...........................................................................................................53
Introduction by Eurostat ....................................................................................................................55
Introduction by ECPA........................................................................................................................57
2. METHODOLOGY AND METADATA .......................................................................................................59
2.1 Data sources and scope of this survey .............................................................................................61
2.2 Methodology......................................................................................................................................61
2.3 Description of PPP groups ................................................................................................................64
2.3.1 Herbicides ....................................................................................................................................64
2.3.2 Fungicides ....................................................................................................................................64
2.3.3 Insecticides...................................................................................................................................65
3. MAIN RESULTS AND COMMENTS AT EUROPEAN UNION LEVEL ...................................................67
3.1 Evolution and situation of PPP consumption ....................................................................................69
3.2 Breakdown of PPP consumption by Member State ..........................................................................71
3.3 Target crops for PPP.........................................................................................................................72
3.4 Chemical classes of PPP ..................................................................................................................74
4. COMMENTS AT MEMBER STATE LEVEL.............................................................................................79
5. DETAILED TABLES AT EUROPEAN UNION LEVEL ..........................................................................127
6. MAIN RESULTS AT MEMBER STATE LEVEL.....................................................................................139
Belgium / Luxembourg (B/L)............................................................................................................142
Denmark (DK) .................................................................................................................................146
Germany (D)....................................................................................................................................150
Greece (EL) .....................................................................................................................................155
Spain (E)..........................................................................................................................................160
France (F)........................................................................................................................................165
Ireland (IRL).....................................................................................................................................170
Italy (I)..............................................................................................................................................174
The Nederlands (NL).......................................................................................................................179
Austria (A)........................................................................................................................................183
Portugal (P) .....................................................................................................................................188

12 Pflanzenschutz / Plant protection / Protection des cultures A
TABLE OF CONTENTS
Finnland (FIN)..................................................................................................................................193
Sweden (S)......................................................................................................................................197
United Kingdom (UK) ......................................................................................................................201
ANNEXES...............................................................................................................................................207
Annex A: From common name of AI to chemical class...................................................................209
Annex B: AI by chemical class ........................................................................................................221

A Pflanzenschutz / Plant protection / Protection des cultures 13
CONTENU
TEXTE ALLEMAND ........................................................................................................................................ 15-43
TEXTE ANGLAIS ............................................................................................................................................ 53-79
TEXTE FRANCAIS........................................................................................................................................ 89-117
1. PROTECTION DES CULTURES DANS L’UE.........................................................................................89
Introduction par Eurostat ...................................................................................................................91
Introduction par ECPA.......................................................................................................................95
2. METHODOLOGIE ET METADONNEES..................................................................................................97
2.1 Sources de données et champ d’application de cette enquête ........................................................99
2.2 Méthodologie .....................................................................................................................................99
2.3 Description des groupes de PPP ....................................................................................................102
2.3.1 Herbicides ..................................................................................................................................102
2.3.2 Fongicides ..................................................................................................................................103
2.3.3 Insecticides.................................................................................................................................103
3.
3.1 Evolution et situation de la consommation de PPP.........................................................................107
3.2 Ventilation de la consommation de PPP par Etat Membre .............................................................109
3.3 Principales cultures traitées au moyen de PPP ..............................................................................110
3.4 Groupes chimiques des PPP ..........................................................................................................112
4. COMMENTAIRES PAR ETAT MEMBRE ..............................................................................................117
5.
6. PRINCIPAUX RESULTATS AU NIVEAU DES ETATS MEMBRES .....................................................139
Belgique / Luxembourg (B/L)...........................................................................................................142
Danmark (DK) .................................................................................................................................146
Allemagne (D) .................................................................................................................................150
Grèce (EL) .......................................................................................................................................155
Espagne (E).....................................................................................................................................160
France (F)........................................................................................................................................165
Irlande (IRL).....................................................................................................................................170
Italie (I).............................................................................................................................................174
Pays Bas (NL) .................................................................................................................................179
Autriche (A)......................................................................................................................................183
Portugal (P) .....................................................................................................................................188
PRINCIPAUX RESULTATS ET COMMENTAIRES AU NIVEAU DE L’UNION EUROPEENNE ........105
TABLEAUX DETAILLES AU NIVEAU DE L’UNION EUROPEENNE .................................................127

14 Pflanzenschutz / Plant protection / Protection des cultures A
CONTENU
Finlande (FIN)..................................................................................................................................193
Suède (S) ........................................................................................................................................197
Royaume Uni (UK) ..........................................................................................................................201
ANNEXES...............................................................................................................................................207
Annexe A: De l’appellation courante de MA par groupe chimique..................................................209
Annexe B: MA par groupe chimique................................................................................................221

1
PFLANZENSCHUTZ IN DER EU

Einleitung nach Eurostat
A Pflanzenschutz / Plant protection / Protection des cultures 17
EINLEITUNG NACH EUROSTAT
Die Kontrolle des Verkaufs und des Einsatzes von Pflanzenschutzmitteln in der EU wird in der Direktive91/414/EEC behandelt, die die Voraussetzungen festlegt, die jedes Mittel erfüllen muß, das in der EU neu aufden Markt gebracht werden soll. Darüber hinaus enthält die Direktive eine Verpflichtung, alle derzeit in der EUauf dem Markt befindlichen Pflanzenschutzmittel einer neuerlichen Prüfung zu unterziehen, die zu einerAberkennung der Zulassung führen kann, oder zu einer Einschränkung des Verkaufs bestimmter MittelBeispielsweise sollte ein Mittel, das sich als toxisch für Vögel erwiesen hat, nicht zur Saatgutbehandlungverwendet werden. Daher wird ein umfassender Informationsbestand über die Eigenschaften der einzelnenMittel aufgebaut, wie LD50 (eine Standardmasseinheit der Toxidität), oder die Persistenz in unterschiedlicheFloren und Faunen etc.
Es mangelt insbesondere an Informationen über den tatsächliche Verbrauch an Pestiziden in den MitgliedsStaaten: die genaue Einsatzmenge der verschiedenen Mittel (Wirksubstanzen), und die Fruchtarten, in denensie ausgebracht werden. Diese Veröffentlichung versucht einen Teil dieser Informationen zu liefern.
Die Erstellung eines zuverlässigen Satzes von Einsatzstatistiken ist in vielen Bereichen der Forschung,Gesetzgebung und landwirtschaftlichen Unterstützung von Nutzen.4
Im Folgenden sind die Hauptanwender aufgeführt:
• Nationale Entscheidungsträger, insbesondere in den Bereichen Landwirtschaft,Umweltschutz und |ffentliches Gesundheitswesen. Statistische Zeitreihen liefern derRegierung Informationen über den aktuellen Stand des Pestizideinsatzes. Nach einer Reihe vonunlängst in der Presse ausgelösten "Pestizidalarmen" bezüglich karzinogener, neurologischer odersonstiger unerwünschter Wirkungen bestimmter Pestizide ist es von wesentlicher Bedeutung, daßden Ministern aktuelle Informationen über den Einsatz diese Pestizide vorliegen. Hierunter fallenAngaben über die Palette der Produkte, in denen diese Pestizide vorkommen, die Fruchtarten, beidenen sie eingesetzt werden, und das Ausmaß, in dem diese Fruchtarten behandelt werden, sowieletztendlich Angaben über die vermutliche Exposition der Bevölkerung im Hinblick auf dieangebliche Gefahr.
• Europäische Entscheidungsträger. Das Fünfte EU-Umweltaktionsprogramm enthält eineZielvorgabe für das Jahr 2000 im Hinblick auf die "beträchtliche Verringerung desPestizideinsatzes je landwirtschaftlich genutzter Flächeneinheit...". Der Erfolg hiervon kann nurdurch die Erstellung zuverlässiger Einsatzdaten im Zeitverlauf kontrolliert werden. Für dieGemeinsame Agrarpolitik (GAP) sind ebenfalls Angaben dieser Art nötig, um eine vollständigeBewertung der wirtschaftlichen Auswirkungen der Einrichtung eines Preisniveaus derlandwirtschaftlichen Produkte vorzunehmen.
• Internationale Organisationen. Die Organisation für Ernährung und Landwirtschaft (FAO) erstelltjährliche Statistiken für alle Länder gemäß Artikel 1 Absatz 1 der FAO-Satzung, die besagt, daß dieOrganisation Informationen über Ernährung, Nahrung und Landwirtschaft erfaßt, auswertet undverbreitet.
Der Nutzen dieser Daten für Entscheidungsträger auf nationaler, EU und internationaler Ebene umfasstfolgende Kontrollaktivitäten:
• Bereitstellung von Informationen im Rahmen des Überprüfungsprozesses vorliegenderPestizide. Ein wesentlicher Teil des Überprüfungsprozesses unter der Direktive 91/414/EEC ist dieKenntnis des lokalen und nationalen Einsatzes und des Bedarfs an diesem Pestizid. Falls dieKontrolle darauf schließen läßt, daß die Erzeuger ohne ein bestimmtes Pestizid nichtkonkurrenzfähig sind und keine Alternativen bestehen, muß dies bei der Überprüfungberücksichtigt werden. Zuverlässige Einsatzdaten sind für solche Beurteilungen von grundlegender
4 Großbritannien hat die umfassendste Erhebung im Pestizideinsatz in der EU; der Pestizideinsatz wurde für alle Fruchtarten periodischüber 30 Jahre hinweg erhoben.
Einleitung nach Eurostat
18 Pflanzenschutz / Plant protection / Protection des cultures A
• Bedeutung und ein geeignetes Mittel zur Quantifizierung der Auswirkungen eines Rückzugs desProdukts. Falls demgegenüber nachgewiesen wird, daß ein bestimmtes Pestizid keinen Nutzen hatund sicherere oder weniger schädliche Alternativen zur Verfügung stehen, kann dies dazu führen,daß ein Pestizid beschleunigt zurückgezogen wird.
• Bereitstellung von Informationen als Teil des Zulassungsverfahrens neuer Pestizide. Bei derGenehmigung neuer Wirkstoffe können Einsatzdaten einen klaren Anhalt für die vermutlicheAufnahme eines neuen Pestizids liefern, da bekannt ist, welche(s) Pestizid(e) es wahrscheinlichersetzen wird und in welchem Ausmaß der derzeitige Einsatz erfolgt.
• Kontrolle der potentiellen Einleitung von Pestiziden ins Wasser. Daten über denPestizideinsatz können herangezogen werden, um zur Kontrolle der Verunreinigung vonOberflächen- und Grundwasser durch Pestizide beizutragen. Beispielsweise strebt die EU denSchutz von Trinkwasser und Grundwasser auf gesetzgeberischem Wege an, was zu einerausgedehnten Kontrolle von Pestizidrückständen gemäß den entsprechenden Richtlinien führenwird. In Groβbritannien werden Einsatzdaten im Rahmen eines komplexen geographischenInformationssystems herangezogen, das Karten von Oberflächen- und Grundwasser, Flüssen undanderen Wasserwegen sowie Wassergewinnungsstellen enthält. Dieses wird mit aktuellen Anbau-und Pestizideinsatzschemata überlegt, die sowohl geographisch als auch saisonal ausgelegt sind,und zusammen mit einer Datenbank der Pestizideigenschaften und Modelle der Bewegungendurch verschiedene Böden zur Vorhersage des vermutlichen Erscheinens von Pestiziden anWassergewinnungsstellen verwendet, um die Kontrolle von Pestiziden im Wasser zu vereinfachen.Dadurch hofft man, unnötige Kontrollen bei Pestiziden zu vermeiden, die an einer bestimmtenStelle oder zu einem bestimmten Zeitpunkt wahrscheinlich nicht in einem bestimmten Gewässerauftreten werden. Es ist jedoch festzuhalten, daß solche Methoden nur für die direkte Kontrolleherangezogen werden können und kein Ersatz dafür darstellen.
• Bereitstellung von Informationen für Rückstandskontrollprogramme bei Frischobst,Gemüse, usw . EU weite Einsatzdaten waren die Grundlage für die Entwicklung vonRückstandskontrollreihen bei einer großen Palette inländischer Erzeugnisse zur Kontrolle derÜbereinstimmung mit den maximal zulässigen Höchstmengen an Rückständen.
Bei der Einleitung neuer Kontrollprogramme, geben Einsatzdaten Aufschluß über die Palette derderzeit bei den zu kontrollierenden Fruchtarten eingesetzten Pestiziden und ermöglichen es, dieUntersuchungsreihe nur auf die Pestizide zuzuschneiden, die wahrscheinlich vorkommen.
Bei der Ermittlung ungewöhnlicher oder unerwarteter Rückstände können aufgrund vonkonkreten landwirtschaftlichen Erhebungsdaten die Ergebnisse bestätigt oder alternative Verfahrenangewandt werden, um die Feststellungen zu erhärten oder zu entkräften. Beispielsweise wies eineUntersuchung von Pflaumen durch Hochleistungs-Flüssigkeitschromatographie mit UV-Diodenarray-Detektion darauf hin, daß 50 % der Stichproben Rückstände von Diflubenzuron enthielten, währenddie Einsatzdaten darauf schließen ließen, daß nur 5 % der Fruchtart behandelt worden war. DieseErhebungsergebnisse gaben Veranlassung zu einer alternativen Untersuchung anhand einerFlüssigkeitschromatographie-Massenspektrometrie, die zeigte, daß es sich bei den vermeintlichenRückständen um Artefakte handelte. Demgegenüber wurde die Feststellung von Rückständen vonChlorthalonil in Kopfsalat, dessen Einsatz in Großbritannien nicht zugelassen ist, durchErhebungsdaten bestätigt, als diese unzulässige Verwendung vor Ort festgestellt wurde.
Andere maßgebliche Nutzungsarten sind folgende:
Bereitstellung von Datensätzen für die Entwicklung von Indikatoren der Auswirkung auf dieUmwelt. Einsatzdaten sind für die Entwicklung von Indikatoren z.B. der Auswirkungen von Pestizidenauf die Umwelt, Indikatoren zur Kontrolle der Integration von Umweltaspekten in dieLandwirtschaftspolitik, Indikatoren für nachhaltige Entwicklung und das Projekt zur Verringerung desPestizidrisikos der OECD (Pestizidforum) eine wichtige Grundlage. Darüber hinaus werden imZeitablauf erstellte Datensätze benötigt, um den Einfluß der politischen Maßnahmen auf denPestizideinsatz und die dadurch entstehenden Umweltauswirkungen zu kontrollieren.

Einleitung nach Eurostat
A Pflanzenschutz / Plant protection / Protection des cultures 19
Bereitstellung von Informationen für die Forschung . Ist es einmal zur Erstellung einesregelmäßigen Satzes von Einsatzstatistiken gekommen, können Veränderungen im Zeitablauf beimEinsatz bei bestimmten Fruchtarten oder bestimmter Pestizide kontrolliert werden. Diese können aufverschiedene Faktoren zurückzuführen sein, wie zum Beispiel:
Klimabedingungen: jährliche Witterungsunterschiede, die Einfluß auf die Reihe der durchSchädlinge, Krankheiten und Unkräuter bedingten Probleme haben, die eine Bekämpfung nötigmachen, oder die den Landwirt dabei beeinträchtigen, das Pestizid unter geeignetenBedingungen auszubringen.
Innovationsfaktoren: die Einführung neuer Moleküle, die u. U. ältere, weniger wirksamePestizide ersetzen und u. U. darüber hinaus in einer sehr viel geringeren Dosierung pro Hektarausgebracht werden können.
Wirtschaftsfaktoren: Änderungen beim Preis von bzw. der Beihilfe für Fruchtarten, wodurchsich die Spannen verändern und der Pestizideinsatz mehr oder weniger ökonomisch wird.
Die in dieser Publikation präsentierten Daten geben keine vollständige Übersicht über den Einsatz vonPflanzenschutzmitteln, da sie einige der in der Landwirtschaft häufig genutzten Pestizide nicht enthalten, wieMolluskizide (Schneckenmittel), Nematizide (Mittel gegen Nematoden), Wachstumsregulatoren und Mittel fürdie Behandlung der Ernteprodukte. Ebenfalls ausgeschlossen ist die Palette der Biozide und dietiermedizinischen Medikamente, (zum Beispiel Desinfekionsbäder für Schafe), die in der Landwirtschaft benutztwerden. Trotzdem kann diese Publikation für die oben genannten Zwecke verwendet werden.
Einleitung nach ECPA
A Pflanzenschutz / Plant protection / Protection des cultures 21
EINLEITUNG NACH ECPA
Seit der Mensch seßhaft wurde und anfing, Pflanzen anzubauen, kam es ihm hauptsächlich darauf an, seineErzeugung mengen- und qualitätsmäßig zu verbessern und die von ihm angebauten Pflanzen gegen unzähligeSchädlinge, Krankheiten und abiotische Bedrohungen aus der Umwelt zu schützen. Es ist für unsere westlicheGesellschaft schwer nachvollziehbar, daß während der gesamten Menschheitsgeschichte Hungersnöte an derTagesordnung waren. In vielen Teilen Europas kämpften die Landwirte darum, so viel Lebensmittelherzustellen, um wenigstens ihre eigene Familie ernähren zu können. Der geringe Ertrag, den die kargenBöden lieferten, nachdem Schädlinge, Krankheiten und Unkraut ihren Anteil hatten, war einer zusätzlichenBedrohung durch Schädlinge und Krankheiten ausgesetzt, die das gelagerte Erntegut angriffen. Das Verhältniszwischen Aufwand und Ertrag kommt in einer Redewendung der nordamerikanischen Indianer zum Ausdruck,die von Mais als einem Hauptnahrungsmittel abhingen und sieben Samenkörner in ein Pflanzloch steckten:"Two for fox, two for crow, two to rot, and one to grow" (Zwei für den Fuchs, zwei für die Krähe, zwei zumVerfaulen und eines zum Wachsen“).
Während das Unkraut durch ständiges Jäten mehr oder weniger erfolgreich unter Kontrolle gehalten werdenkonnte, waren Schädlinge und Krankheiten, die häufig im Zuge ungünstiger klimatischer Bedingungenauftraten, schwieriger zu bekämpfen. Diese Situation herrschte bis zu Beginn dieses Jahrhunderts vor. Erstnachdem es der Wissenschaft gelungen war, die Schädlinge und Krankheiten sowie die Umstände ihresAuftretens zu erforschen, konnten entsprechende Bekämpfungsmittel entwickelt werden. Pestizide, die Endedes 19. Jahrhunderts entwickelt wurden, standen mehrere Jahrzehnte lang hauptsächlich nur als anorganischeVerbindungen zur Verfügung. Die Entdeckung der fungitoxischen Wirkung von Kupferkalk war ein wesentlicherDurchbruch beim Schutz von Weintrauben vor falschem Mehltau und führte im Jahr 1882 zur Entwicklung dersogenannten Bordeauxbrühe, die heute noch eingesetzt wird. Kurz danach wurden zahlreiche Fungizide auf derBasis von Schwermetallen und Schwefel entwickelt. Arsen war das erste Insektizid, das in Form von PariserGrün zur Bekämpfung einer Kartoffelkäferinvasion in den Vereinigten Staaten erstmals in großem Umfangeingesetzt wurde. Weitere Meilensteine in der Geschichte des Kampfes gegen die Unwägbarkeiten der Naturwaren die Entdeckung der insektiziden Wirkung von DDT im Zweiten Weltkrieg, das ursprünglich zu sanitärenund hygienischen Zwecken verwendet wurde, sowie die Entwicklung von Herbiziden auf Basis derWachstumshormone von breitblättrigen Pflanzen, den Auxinen. Dadurch konnten Anfang der fünfziger Jahrezweikeimblättrige Unkräuter in Getreide selektiv beseitigt werden (2,4 – D/ „U46“ - BASF).
Die Ziele des Pflanzenschutzes
Im Laufe ihrer Entwicklung bilden einige wild wachsende Arten komplizierte Verteidigungsmechanismen gegenSchädlinge und Krankheiten aus oder können sich in einem frühen Stadium des Befalls noch erholen. ReifesGewebe ist aufgrund von Gerbstoffen und anderen Toxinen, die die Pflanze zu ihrem Schutz entwickelt hat, fürbeissende oder saugende Schädlinge häufig unverdaubar. Daher befallen Insekten ihre Wirtspflanzen häufig imfrühen Entwicklungsstadium des neuen Wachstums, wenn die Zellen über keine oder wenige Toxine verfügenund aufgrund ihres hohen Kohlenhydrat- bzw. Proteingehalts äußerst nahrhaft sind. Bakterielle undPilzkrankheiten befallen häufig Pflanzen, die unter schlechten Bedingungen wachsen oder geschwächt bzw.verletzt sind. Diesen Organismen kommt in der Natur eine wichtige Funktion zu, da sie tote oder sterbendeorganische Substanz zersetzen und die in ihr enthaltene Energie und Mineralien wieder verwerten. Beim Obststeigt während der Reife der Gehalt an Zucker und aromatischen Bestandteilen, um es für die Organismenattraktiv zu machen, die die Natur dabei unterstützen, die äußere Schutzschicht aufzubrechen und somit denSamen zur Ausbreitung freizusetzen. Verständlicherweise versucht der Obstzüchter diese natürlicheZersetzung zu verhindern.
Die natürliche Umwelt ist durch den Kampf ums Überleben gekennzeichnet, der allen Arten hauptsächlichaufgrund der Nahrungsmittelknappheit gemein ist. Die vom Menschen angebauten Nahrungsmittelkulturenwurden aufgrund ihrer geringen Toxizität, ihrem hohen Nährwert und ihren schmackhaften Bestandteilenausgewählt und gezüchtet. Diese Pflanzen stellen für alle Arten von wild lebenden Organismen eineunwiderstehliche Nahrungsquelle dar. Der maßgebliche Unterschied zwischen dem Menschen und anderen
Einleitung nach ECPA
22 Pflanzenschutz / Plant protection / Protection des cultures A
Arten besteht darin, daß der Mensch gelernt hat, Massnahmen zu entwickeln, um sich und seineNahrungsquellen vor Schädlings- und Krankheitsbefall zu schützen.
Die wichtigsten Faktoren beim Einsatz von Pflanzenschutzmitteln sind:
- die Sicherstellung der Erzeugung einer marktfähigen Qualität durch Verringerung des Schadens durchSchädlinge und Krankheiten;
- die Senkung der Arbeitskosten durch Vermeidung des arbeitsaufwendigen Unkrautjätens von Hand;
- die Erleichterung des mechanischen Erntens durch die Verringerung des Unkrautbefalls der Kulturen;
- die Vermeidung von Ertragseinbußen aufgrund von Schädlings- und Krankheitsbefall oderUnkrautkonkurrenz.

2
METHODIK UND METADATEN

Methodik und Metadaten
A Pflanzenschutz / Plant protection / Protection des cultures 25
2.1 Datenquellen und Erfassungsbereich der vorliegenden Erhebung
Diese Studie wurde anhand von Daten über den Einsatz von Pflanzenschutzmitteln entwickelt, die von denMitgliedsunternehmen der ECPA, der European Crop Protection Association, zur Verfügung gestellt wurden.Zusammen entfallen auf diese zehn Unternehmen zirka 90 % des europäischen Marktes fürPflanzenschutzmittel. Dadurch ist sichergestellt, daß die Daten zuverlässig sind und ein mehr oder wenigerrepräsentatives Bild von der derzeitigen Situation im Pflanzenschutzsektor der Europäischen Union und ihrerMitgliedstaaten zeichnen.
Zu den erfaßten Ländern zählten Belgien und Luxemburg, Dänemark, Deutschland, Griechenland, Spanien,Frankreich, Irland, Italien, die Niederlande, Österreich, Portugal, Finnland, Schweden und das VereinigteKönigreich. Während die Daten aus den west- und südeuropäischen Ländern recht umfassend sind, sind dieAngaben für die nordischen Länder, insbesondere für Schweden und Finnland, wenig aufschlußreich, da dieseLänder bei den ECPA-Mitgliedsunternehmen nur in sehr geringem Rahmen vertreten sind. Zwei derUnternehmen, die Daten lieferten, haben im Hinblick auf ihre Verkäufe keine einzelnen Länder angegeben,sondern lediglich die Mengen für die „Nördliche Region“.
In der vorliegenden Erhebung wurden die Kulturen berücksichtigt, auf die erwiesenermaßen der Großteil dessignifikanten Einsatzes von Pflanzenschutzmitteln in der EU entfällt. Diese Kulturen wurden soweit wie möglichausführlich berücksichtigt. Sofern eine Untergliederung des Einsatzes von Pflanzenschutzmitteln für einzelneKulturen nicht möglich oder durchführbar war, wurden Daten für Kulturgruppen, z. B. „Getreide“ oder„Baumobst“, ohne weitere Angabe gemeldet. Darüber hinaus wurden die Kulturen als „Ackerkulturen“ (Rüben,Getreide, Mais, Kartoffeln, Ölsaaten) und „Sonderkulturen“ (Zitrusfrüchte, Kern- und Steinobst, Rebflächen)klassifiziert. Gemüse fällt unter „Sonderkulturen“, sofern die Gruppen genannt werden.
Die Wirkstoffe der Pflanzenschutzmittel werden gemäß ihren chemischen Kurzbezeichnungen5 laut derDefinition im Handbuch des British Crop Protection Council (BCPC) aufgeführt. Bei der Gruppierung vonWirkstoffen wurde ebenfalls so weit wie möglich die BCPC-Klassifikation befolgt. Bei den erfaßtenProduktgruppen handelt es sich um die wichtigsten Pflanzenschutzmittel, d. h. Fungizide, Herbizide undInsektizide. Fungizide umfassen in der Regel keine Beizmittel; Insektizide enthalten auch Akarizide. Sonstige inder Landwirtschaft eingesetzte Wirkstoffgruppen wie Molluskizide, Nematozide und Wachstumsregulatorenwerden nicht berücksichtigt.
Dem Industriebericht zufolge werden in der EU jährlich ca. 300 000 t Wirkstoffe eingesetzt. Die vorliegendeVeröffentlichung bezieht sich auf den Einsatz von etwa 250 000 t dieser Wirkstoffe im Jahr 1996, womit alsoüber 80 % des gesamten Pflanzenschutzmittelmarkts abgedeckt sind. Obgleich nicht alle Segmente desPflanzenschutzes in der EU erfaßt werden konnten, dürften die vorgelegten Daten für den gesamten Marktrecht repräsentativ sein.
2.2 Methodik
Die Daten, die in der Referenzdatenbank für den vorliegenden Bericht enthalten sind, wurden von den fürMarktforschung bzw. Landwirtschaft zuständigen Abteilungen der zehn Vollmitgliedunternehmen des ECPAbereitgestellt: AgrEvo, BASF, Bayer, Cyanamid, Dow Agrosciences, Du Pont de Nemours, Monsanto, Novartis,Rhône Poulenc und Zeneca. Bei der Datenquelle handelte es sich in der Regel um Marktforschungspanels,z. B. jährliche Befragungen von Landwirten, die bei einer ziemlich gleichbleibenden Zielgruppe durchgeführtwerden. Die Daten, die anhand dieser repräsentativen Nutzergruppe ermittelt wurden, wurden unterHeranziehung allgemeiner statistischer Verfahren auf die Ebene jedes Landes hochgerechnet. Im Rahmen derErhebungen wurden nicht alle Kulturen und geringfügige Einsatzzwecke erfaßt; die Mitarbeiter derUnternehmen haben die entsprechenden Rohdaten jedoch in der Regel ggf. vervollständigt und berichtigt.
5 Die chemischen Kurzbezeichnungen von Pflanzenschutzmitteln sind im vorliegenden Text unterstrichen, während die chemischenKlassen, denen sie angehören, fettgedruckt sind.

Methodik und Metadaten
26 Pflanzenschutz / Plant protection / Protection des cultures A
Sofern wichtige Wirkstoffe in beträchtlichen Mengen von anderen als den zehn genannten Unternehmenvermarktet wurden, legte der ursprüngliche Hersteller der Verbindung eine Schätzung der neben seineneigenen Verkäufen im Markt eingesetzten Gesamtmenge vor, um ein repräsentatives Bild des Gesamtvolumenszu zeichnen (z. B. Atrazin, Isoproturon, Schwefel). Die Wirkstoffmengen wurden den formuliertenHandelsprodukten gemäß ihrem Wirkstoffgehalt in Prozent (nG) oder g/l (nV) entnommen. Die ursprünglichenHandelsnamen des Produktes bzw. die Namen der Unternehmen wurden in der endgültigen Datenbankgelöscht.
Vergleicht man die Angaben in der ECPA/Eurostat-Datenbank mit den Angaben der nationalenIndustrieverbände, muß man berücksichtigen, daß die von den nationalen Stellen gemeldeten Wirkstoffmengenalle Einsatzzwecke und chemischen Klassen von Pflanzenschutzmitteln als Verkäufe des Kalenderjahresumfassen. Diese Chemikalien können beträchtliche Mengen darstellen, z. B. Bodenentseuchungsmittel bzw.Nematizide, die in der vorliegenden Erhebung nicht berücksichtigt werden.
Ferner können große Abweichungen zwischen den Daten in der vorliegenden Studie und den von denIndustrieverbänden gemeldeten Daten in Ländern vorliegen, in denen ein erheblicher Einsatz vonPflanzenschutzmitteln bei Nebenfruchtarten erfolgt, die im Rahmen dieser Studie nicht berücksichtigt werden.
Dasselbe gilt für einige Kulturen. Während die Daten für Zuckerrüben, Mais, Kartoffeln, Zitrusfrüchte undRebflächen im allgemeinen aufgrund der kulturspezifischen Wirkung der Wirkstoffe direkt den Zielkulturenzugeordnet werden, wurden einige Verbindungen mit einem breiten Einsatzspektrum, bei denen die endgültigeZielkultur nicht ermittelt werden kann, nur für Kulturgruppen gemeldet: Getreide, Obst und Reben, Ölsaaten undGemüse enthalten die angegebenen Kulturen in unterschiedlichem Verhältnis. Daher ist die Ebene derKulturgruppe für Vergleichszwecke die zuverlässigere Datenbasis. Sofern möglich, erfolgte stets eineverhältnismäßige Zuordnung des Einsatzes von Pflanzenschutzmitteln zu einzelnen Kulturen (Weizen undGerste, Obstbäume und Rebflächen) gemäß den Vorschlägen des Meldeunternehmens (Tabelle 1).
Unter den EG Mitgliedstaaten werden spezifische Erhebungen über die Verwendung von Pestiziden in derLandwirtschaft nur von den Niederlanden, Schweden und dem Vereinten Königreich geführt. In der Publikationvon Eurostat “Pestizideinsatz in der EU”6, wurden die Ergebnisse der von diesen drei Mitgliedstaaten geführtenErhebungen dargestellt. Wiederum sollte man beim Vergleich der Daten jener Erhebungen mit den von ECPAgelieferten Daten vorsichtig handeln, da sich der Umfang und die Bedeckung der Erhebungen unterscheiden.Einer der grössten Unterschiede besteht darin, dass die Erhebung von ECPA Molluskizide, Bodensterilisierer,Nematizide und (Pflanzen)wuchsregulatoren ausschliesst, wobei Pestizide dieser Art in den Erhebungen überdie nationalen Einsatz eingeschlossen sind.
Im allgemeinen beziehen sich die im vorliegenden Bericht angegebenen Daten auf den tatsächlichen Einsatz imAnbaujahr/Erntejahr. (Die Verkaufsdaten für das Kalenderjahr umfassen ferner häufig Bestände in derVertriebskette, die in einem bestimmten Anbaujahr nicht tatsächlich verbraucht wurden.).
6 Statistik kurzgefaßt, Umwelt, 1998/3.

Methodik und Metadaten
A Pflanzenschutz / Plant protection / Protection des cultures 27
Tabelle 1 : Untergliederung der Kulturen 7
Kulturart Kulturgruppe Spezifische Kulturen Verbundene Kulturen
Weizen * Winter-, Sommer- und Hartweizen
Gerste * Winter- und Sommergerste
Getreide (n.g.)
Zuckerrüben *
Futterrüben
Körnermais
Silo Mais
Raps Winter- und Sommerraps
Sonnenblumensamen
Kartoffeln * Kartoffeln Speise- und Saatkartoffeln
Zitrusfrüchte * Zitrusfrüchte Alle Arten
Rebflächen * Trauben
Kernobst Tafeläpfel, Tafelbirnen *
Steinobst *Kirschen, Pfaumen, Aprikosen, Nektarinen, usw. Nur kommerzielle Baumobstanlagen
Baumobstanlagen
Früchte (n.g.)
SpeisekohlWeißkohl, Blumenkohl, Rosenkohl, Kohlrüben usw.
CurcurbitaceenSchälgurken, Melonen, Kürbisse, Einlegegurken, Zucchini usw.
Erbsen und Bohnen (Hülsenfrüchte)Erbsen und Bohnen, frisch oder für Konserven.
Tomaten
Gemüse (n.g.)
Acker-kulturen
Getreide
Zuckerrüben
Mais *
Ölsaaten *
Baumobst
Gemüse *
n.g.: nicht genannt.
Sonder-kulturen
7 Kulturen welche mit einem “*” versehen sind, wurden für die Berechnung der Anbaufläche der Kulturen und die Anwendungsraten genutzt.Zum Beispiel, die Anbaufläche der Kulturen und die Anwendungsraten für Getreide beinhalten nur Weizen und Gerste.
Quelle: Eurostat.
Methodik und Metadaten
28 Pflanzenschutz / Plant protection / Protection des cultures A
2.3 Beschreibung der Pflanzenschutzmittelgruppen
Obgleich zahlreiche unterschiedliche Arten von chemischen Verbindungen in der landwirtschaftlichenErzeugung eingesetzt werden, z. B. Rodentizide, Molluskizide, Nematizide, Boden- undLagerungsdesinfektionsmittel, konzentriert sich die vorliegende Erhebung auf die drei Produktgruppen, denenheutzutage beim Pflanzenschutz in der Landwirtschaft die wichtigste Rolle zukommt: Herbizide, Fungizide undInsektizide. Nicht berücksichtigt wird in der vorliegenden Erhebung der Einsatz dieser Mittel in nichtlandwirtschaftlichen Sektoren, beispielsweise im öffentlichen Gesundheitswesen usw.
Insgesamt werden in der Datei 491 Wirkstoffnamen aufgeführt; dabei handelt es sich bei 26 % um Fungizide,bei 40 % um Herbizide und bei 34 % um Insektizide/Akarizide.
2.3.1 Herbizide
Der Einsatz von Herbiziden dient der Bekämpfung des unerwünschten bzw. schädlichen Wachstums vonPflanzen, im allgemeinen Unkräuter genannt, auf landwirtschaftlichen Anbauflächen oder auf sonstigenFlächen, die von Pflanzenbewuchs freigehalten werden sollen. Neben der Eindämmung einer konkurrierendenVegetation auf Anbauflächen ist die Unkrautbekämpfung notwendig, um die mechanische Ernte zu ermöglichenoder zu erleichtern. Ferner ist die Verunreinigung von geerntetem Saatgut und Körnerfrüchten mitUnkrautsamen von Bedeutung für den Getreidehandel und die weiterverarbeitende Industrie, beispielsweise dieMühlen; darüber hinaus führt eine Verunreinigung des Ernteguts zu erheblichen Einschnitten bei denKostendeckungsbeiträgen der Landwirte.
Herbizide können entweder selektiv oder nicht selektiv wirken. Selektive Herbizide können vor dem Auflaufender Unkräuter bzw. Kultur oder nach dem Auflaufen eingesetzt werden. In der Regel werden sie einmal imfrühen Entwicklungsstadium einer Kultur eingesetzt, in dem die Unkräuter den größten Schaden anrichten, dasie mit der Kultur um Wasser, Nährstoffe und Licht konkurrieren. Die Wirkungsweise dieser Herbizide erfolgtentweder durch Aufnahme über die Wurzeln (Residualwirkung) oder über die Blätter (Blattwirkung). Imallgemeinen werden selektive Herbizide nach der Art der bekämpften Unkräuter klassifiziert: Breitblattherbizide,Gräserherbizide (Graminizide) oder Herbizide mit breitem Wirkungsspektrum, durch die in bestimmten Kulturensowohl Ungräser als auch breitblättrige Unkräuter bekämpft werden. Selektive Herbizide werden am häufigstenbei Ackerbaukulturen eingesetzt, z. B. bei Getreide, Zuckerrüben, Kartoffeln, Mais usw. Selektive Herbizidewerden ständig ausgereifter. Während die klassischen Herbizide bei Dosierungen von ca. 0,5 bis 1 kg Wirkstoffpro Hektar oder mehr wirkten (TCA wurde beispielsweise zur Bekämpfung der Quecke bei Dosierungen von 60kg/ha eingesetzt), werden neu entwickelte Produkte wie Sulfonylharnstoffe mit niedrigen Dosierungen von 10bis 25 g/ha ausgebracht. Alle Herbizide werden in der Regel bis zum Ende der Kulturperiode abgebaut odermetabolisiert, ohne daß feststellbare Rückstände zurückbleiben. Sogar nach jahrelangem intensiven Einsatzauf ausgewählten Flächen läßt sich im Boden keine für Folgekulturen möglicherweise schädlicheHerbizidakkumulierung nachweisen.
Nichtselektive Herbizide ("Totalherbizide") unterscheiden in ihrer Wirkung nicht zwischen Kulturen undUnkräutern und werden am häufigsten zur umfassenden Vegetationskontrolle in Dauerkulturen wiebeispielsweise Rebflächen und Obstplantagen eingesetzt oder im Umkreis des landwirtschaftlichen Betriebs,um Betriebsflächen von unerwünschtem Pflanzenwuchs freizuhalten. Herbizide zur umfassendenVegetationskontrolle können sich durch Residual- und/oder Blattwirkung auszeichnen. Herbizide zurumfassenden Vegetationskontrolle mit Blattwirkung werden ferner zur Unkrautbekämpfung auf stillgelegtenFlächen eingesetzt, und zwar entweder während die Flächen brachliegen oder zur Säuberung bevor sie erneutfür die Erzeugung genutzt werden. Ein weiterer wichtiger Einsatzbereich ist die Austrocknung (Desikkation) desBlattwerks von Kulturen zur Erleichterung der mechanischen Ernte bzw. zur Vernichtung der Quecke(Agropyron repens) in den Stoppeln nach der Getreideernte.

Methodik und Metadaten
A Pflanzenschutz / Plant protection / Protection des cultures 29
2.3.2 Fungizide
Fungizide sind Verbindungen, die zum Schutz von Kulturen vor Krankheiten eingesetzt werden, die durchpilzliche Krankheitserreger verursacht werden. Pilzkrankheiten bedrohen Kulturen vom Keimungsstadium biszur Ernte und verursachen ferner erhebliche Schäden am Erntegut während der Lagerung. PhytopathologischePilze sind überall anzutreffen und werden im allgemeinen durch die Luft als Sporen übertragen. Wenn dieSporen auf der Pflanzenoberfläche landen, setzt je nach Pilzart die Keimung ein, falls die Bedingungen(Temperatur, Feuchtigkeit) günstig sind. Wenn die gekeimten Sporen die Pflanzenhaut durchdrungen habenund das Pilzgeflecht in das Pflanzengewebe eingedrungen ist, kann es durch klassische Fungizide nicht mehrbekämpft werden. Pilzkrankheiten können in der Regel nur prophylaktisch bekämpft werden, indem verhindertwird, daß gekeimte Sporen in das Pflanzengewebe eindringen. Daher werden klassische Fungizide häufigwiederholt ausgebracht, um einen Schutzbelag mit Wirkstoff aufrecht zu erhalten, insbesondere in der Phasedes schnellen Pflanzenwachstums und bei häufigen Regenfällen. Nachlässigkeit bei der Bekämpfung vonPilzkrankheiten kann mitunter zur Vernichtung der gesamten Ernte eines Jahres führen. Daher ist es beiintensiven Anbausystemen unbedingt notwendig, die Umweltbedingungen im Hinblick auf einenKrankheitsbefall zu überwachen, um den optimalen Zeitpunkt für den Fungizideinsatz zu ermitteln. ModerneFungizide haben häufig auch eine heilende (kurative) Wirkung, da sie systemisch wirken, d.h. sie können dasPflanzengewebe durchdringen und das Pilzmyzel in den Pflanzenzellen angreifen. Diese heilende Wirkung istjedoch auf einen kurzen Zeitraum nach dem Befall beschränkt und kann nicht als Standardmaßnahmeherangezogen werden. Daher sind die klassischen Belagsfungizide nach wie vor die wichtigste Grundlage fürdie Bekämpfung von Pilzkrankheiten.
2.3.3 Insektizide
Im Gegensatz zu Fungiziden werden Insektizide, die klassischen „Pestizide“, nur dann eingesetzt, wenn derSchädlingsbefall offenkundig ist. Zur Vorbeugung gegen einen Befall durch Bodeninsekten werden sie lediglichim Rahmen einer Saatgutbeizung eingesetzt. Insektizide wirken gegen den bekämpften Schädling durchKontakt, Inhalation oder Aufnahme beim Frass. Die Überwachung der Umweltbedingungen im Hinblick auf denSchädlingsbefall ist bei integrierten Anbausystemen unerläßlich.
In der letzten Zeit wurden ferner biologische Mittel zur Schädlingsbekämpfung entwickelt, d. h. spezifischeinsektizide Krankheitserreger wie das Toxin Bacillus thuringiensis bzw. schädlingsspezifische Virustoxinehauptsächlich zur Bekämpfung von Schmetterlingslarven eingesetzt. Ferner werden Raubinsekten als Mittel derbiologischen Schädlingsbekämpfung gezüchtet. Lockstofffallen werden häufig während der Paarungszeit derInsekten eingesetzt, um den optimalen Zeitpunkt für Schutzmaßnahmen gegen auftretende Larven zu ermitteln,bevor sie in das Gewebe der Wirtspflanze eingedrungen sind und mit gewöhnlichen Insektiziden nicht mehrbekämpft werden können. Biologische Bekämpfungsmaßnahmen sind im allgemeinen sehr komplex underfordern eine genaue und fortlaufende Überwachung des Schädlingsbefalls. Ferner ist bei biologischeninsektentötenden Mitteln eher eine größere als eine geringere Zahl von Einsätzen erforderlich, da sie in derRegel nach dem Einsatz sehr schnell abgebaut werden. Insektizide werden in der Europäischen Unionhauptsächlich zur Bekämpfung von Blattläusen eingesetzt, die die Kulturen nicht nur durch das Saugen an demzarten Pflanzengewebe schädigen, sondern häufig auch Viruskrankheiten übertragen, und gegen Larven vonNachtfaltern. Einen gesondertes Segment der Schädlingsbekämpfung stellen Akarizide dar, die gegenSpinnenmilben eingesetzt werden, durch die häufig schwere Schäden am Blattwerk von mehrjährigen Kulturen,z. B. Zitronen, Obstbäume und Rebstöcke, verursacht werden.

3
WICHTIGSTE ERGEBNISSE UNDANMERKUNGEN NACH EBENE
DER EUROPÄISCHEN UNION

Wichtigste Ergebnisse und Anmerkungen nach Ebene der europäischen Union
A Pflanzenschutz / Plant protection / Protection des cultures 33
Bezugstabellen : Seite
EU-1.1 - 1.8: Eingesetzte Menge an Pflanzenschutzmitteln nach Mitgliedstaaten.......................................................................................129
EU-2.1 – 2.6: Eingesetzte Menge an Pflanzenschutzmitteln nach Kulturgruppen........................................................................................133
EU-3.1 – 3.2: Anbaufläche nach Mitgliedstaaten und Kulturgruppen...........................................................................................................135
EU-4.1 – 4.5: Dosierung der eingesetzten Mengen an Pflanzenschutzmitteln nach Mitgliedstaaten und Kulturgruppen..............................136
3.1 Einsatz von Pflanzenschutzmitteln – Entwicklung und derzeitige Lage
In den EU-Mitgliedstaaten, für die Daten für 1992 – 1996 vorlagen, hat sich die eingesetzte Menge anPflanzenschutzwirkstoffen von 231 524 Tonnen im Jahr 1992 um 8 % auf 249 646 Tonnen im Jahr 1996 erhöht,nachdem zwischen 1993 und 19948 ein Rückgang um 4 % zu verzeichnen war . Vergleicht man dieWirkstoffpalette von 1992 mit der von 1996, ist festzustellen, daß 16 Stoffe, die 1992 nicht erwähnt wurden,1996 aufgeführt werden, während 10 Stoffe, die 1996 nicht erwähnt wurden, 1992 aufgeführt wurden.
Der Pflanzenschutzmarkt in der EU, an dem die Landwirtschaft einen hohen Anteil hat, ist gesättigt.Änderungen bei der eingesetzten Menge an Pflanzenschutzmitteln sind meistens auf einen unterschiedlichenSchädlings- und Krankheitsbefall zurückzuführen, für den häufig die Wetterbedingungen maßgeblich sind.
Im Zuge der GAP-Reform von 1992 waren Überlegungen zu Kosteneinsparungen und zur Rentabilität dieFaktoren, die sich maßgeblich auf die Intensität der Behandlungsmaßnahmen und die Auswahl derPflanzenschutzmittelmarken auswirkten. Nachdem anfänglich Unsicherheit bezüglich der Auswirkungen derReform bestand, die sich für die meisten landwirtschaftlichen Erzeugnisse in niedrigeren Ab-Hof-Preisenniederschlugen, ist der Einsatz von Pflanzenschutzmitteln mittlerweile wieder über den Stand von 1992 hinausangestiegen.
Ein Rückgang zwischen 1993 und 1994 trat hauptsächlich in Frankreich und Deutschland auf – den wichtigstenGetreide- und Rapsanbauländern – und auf die Reform der GAP sowie die Unsicherheit der Landwirtebezüglich der Auswirkungen der neuen Bestimmungen auf die Anbauflächen und die Marktpreise für ihrErntegut zurückzuführen. Die Reformmaßnahmen waren hauptsächlich auf Getreide und Eiweißpflanzenausgerichtet. Die Folge hiervon war ein sparsamer Einsatz von Pflanzenschutzmitteln, insbesondere Fungizidenund Herbiziden, wobei die Dosierungen zur Kosteneinsparung häufig bis an die Grenze der Wirksamkeitverringert wurden.
Im Jahr 1996 „normalisierte“ sich die Lage wieder mehr oder weniger. Die Betriebsinhaber waren mitniedrigeren Ab-Hof-Preisen pro Tonne Erntegut konfrontiert. Um die Höhe ihres Einkommensaufrechtzuerhalten bzw. zu verbessern, mußten sie eine bestmögliche ökonomische Situation anstreben unddabei den Kosten-Nutzen-Aspekt bei jeder einzelnen Tätigkeit abwägen, indem sie beispielsweisePflanzenschutzmittel nur wenn unbedingt notwendig einsetzten. Andererseits kann der Einsatz vonPflanzenschutzmitteln als eine Maßnahme betrachtet werden, die eingesetzte Arbeitskraft und Investitionengegen Verluste während des Erzeugungsprozesses zu schützen. In bestimmten Fällen könntenPflanzenschutzmittel selbst dann eingesetzt werden, wenn der Ertrag nicht in dem Maße steigt, daß dieBehandlungskosten gerechtfertigt sind: Dies ist beispielsweise der Fall, wenn die Qualität des Ernteguts (z. B.Braugerste) die vom Handel und der verarbeitenden Industrie vorgegebenen Standards erfüllen muß oder wenndie Ausbreitung von Viruskrankheiten (Vektorenbekämpfung) bei der Erzeugung von Saatgut (Saatkartoffeln)verhindert werden muß.
Die in den skandinavischen Ländern und den Niederlanden durchgeführten Programme zur Verringerung desEinsatzes von Pflanzenschutzmitteln betrafen hauptsächlich den Einsatz von Nematiziden bzw.Bodendesinfektionsmitteln in Gartenbau- und Sonderkulturen, die im Rahmen dieser Erhebung nicht erfaßt
8 Bei der Erörterung der mit dem Einsatz von Pflanzenschutzmitteln verbundenen Gefahren muß jedoch berücksichtigt werden, daß manhierbei die eingesetzte Menge nicht als das einzig wesentliche Kriterium zugrundelegen kann. Weitere wichtige Faktoren sind die Toxizitätsowie die Persistenz im Boden.

Wichtigste Ergebnisse und Anmerkungen nach Ebene der europäischen Union
34 Pflanzenschutz / Plant protection / Protection des cultures A
werden. Daher treten die Auswirkungen dieser Programme bei den zentralen Kulturen, auf die der Großteil desEinsatzes von Pflanzenschutzmitteln entfällt, nicht zutage.
Eine reale Zunahme des Einsatzes von Pflanzenschutzmittelwirkstoffen ist nur in Mitgliedstaaten festzustellen,bei denen ausgehend von niedrigeren Bewirtschaftungsstandards eine Weiterentwicklung erfolgt (P, EL); diesist vermutlich darauf zurückzuführen, daß für diese Länder die pflanzliche Erzeugung gewinnbringender wurde.
Beim Ackerbau geht die Entwicklung eindeutig hin zu Wirkstoffen, die bei niedrigeren Dosierungen als diefrüheren Standardprodukte wirken. Allerdings hätte der verringerte Einsatz von Herbiziden und Fungiziden beiden Hauptfruchtarten, z. B. Getreide, Mais und Zuckerrüben, nur marginale Auswirkungen auf die gesamteEinsatzmenge, bei der nach wie vor Schwefel und Kupfer vorherrschend sind (38 % im Jahr 1992 und 41 % imJahr 1996 aller eingesetzten Wirkstoffe), die die wichtigsten Wirkstoffe zur Krankheitsbekämpfung aufRebflächen, in Baumobstanlagen und in Betrieben sind, die nach den Grundsätzen des organischen Landbausbewirtschaftet werden. Solange Schwefel und Kupfer eine maßgebliche Rolle beim integrierten Pflanzenschutzspielen, wird die Gesamtmenge der eingesetzten Wirkstoffe in der Europäischen Union nicht wesentlichzurückgehen.
Die Herbizide waren von der Unsicherheit der Landwirte bezüglich der Auswirkungen der GAP-Reform auf dieGewinne am stärksten betroffen. Trotz eines Rückgangs um 8 % zwischen 1992 und 1993 erhöhte sich dieeingesetzte Herbizid-Wirkstoffmenge konstant bis 1996. Fungizide und Insektizide waren weniger starkbetroffen (siehe Abbildung 1), da der Großteil dieser Produkte bei Sonderkulturen eingesetzt wird, auf die sichdie GAP-Regelungen nicht beziehen. Darüber hinaus wirkt sich eine nachlässige Bekämpfung von Schädlingenund Krankheiten direkt auf die Qualität und die Absatzchancen von Obst und Gemüse aus.
Abbildung 1: Entwicklung des Einsatzes von Pflanzenschutzmittelnin der EU, 1992 bis 1996
134140 148 146 149
8683
7476 70
16 17 19 1519
0
50
100
150
200
250
1992 1993 1994 1995 1996
Fungizide Herbizide InsektizideQuelle: Eurostat.
(in 1 000 t Wirkstoff)
Das größte Segment entfällt mit 60 % der gesamten Wirkstoffmenge in der EU auf Fungizide. Dies ist auf ihrenhäufigen Einsatz bei aufeinanderfolgenden Sprühprogrammen bei Sonderkulturen zurückzuführen sowie auf diedominierende Stellung von Schwefel, der in hoher Dosierung aufgebracht wird. 69 % des Fungizideinsatzesentfällt auf Rebflächen, gefolgt von Getreide (10 %) und Baumobst (8 %). Auf Kartoffeln und Gemüse entfallen5 % bzw. 4 % des Fungizideinsatzes.
Der Herbizideinsatz entfällt mit 36 % bzw. 29 % überwiegend auf Getreide bzw. Mais gefolgt von Rebflächen(12 %), Zuckerrüben (7 %) und Ölsaaten (6 %).
Beim Insektizideinsatz entfallen auf Obstbäume, Rebflächen und Zitrusfrüchte 33 %, 18 % bzw. 14 % dergesamten Wirkstoffmenge. Ferner werden Insektizide eingesetzt, um Schäden zu verhüten, die hauptsächlichvon Blattläusen und Raupen an Gemüse angerichtet werden (10 %). Mais (7 %) muß hauptsächlich vor demMaiszünsler geschützt werden, und zwar insbesondere in wärmeren Ländern. Allgemein ist festzustellen, daß
Wichtigste Ergebnisse und Anmerkungen nach Ebene der europäischen Union
A Pflanzenschutz / Plant protection / Protection des cultures 35
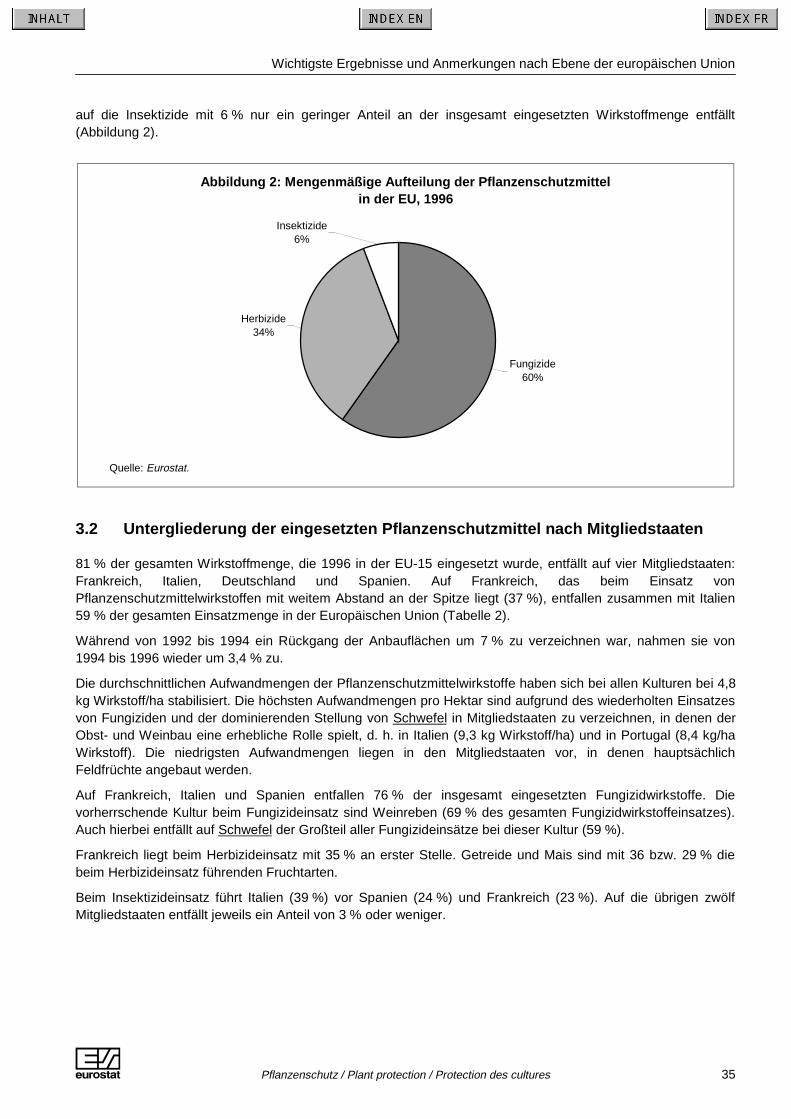
auf die Insektizide mit 6 % nur ein geringer Anteil an der insgesamt eingesetzten Wirkstoffmenge entfällt(Abbildung 2).
Abbildung 2: Mengenmäßige Aufteilung der Pflanzenschutzmittelin der EU, 1996
Fungizide60%
Herbizide34%
Insektizide6%
Quelle: Eurostat.
3.2 Untergliederung der eingesetzten Pflanzenschutzmittel nach Mitgliedstaaten
81 % der gesamten Wirkstoffmenge, die 1996 in der EU-15 eingesetzt wurde, entfällt auf vier Mitgliedstaaten:Frankreich, Italien, Deutschland und Spanien. Auf Frankreich, das beim Einsatz vonPflanzenschutzmittelwirkstoffen mit weitem Abstand an der Spitze liegt (37 %), entfallen zusammen mit Italien59 % der gesamten Einsatzmenge in der Europäischen Union (Tabelle 2).
Während von 1992 bis 1994 ein Rückgang der Anbauflächen um 7 % zu verzeichnen war, nahmen sie von1994 bis 1996 wieder um 3,4 % zu.
Die durchschnittlichen Aufwandmengen der Pflanzenschutzmittelwirkstoffe haben sich bei allen Kulturen bei 4,8kg Wirkstoff/ha stabilisiert. Die höchsten Aufwandmengen pro Hektar sind aufgrund des wiederholten Einsatzesvon Fungiziden und der dominierenden Stellung von Schwefel in Mitgliedstaaten zu verzeichnen, in denen derObst- und Weinbau eine erhebliche Rolle spielt, d. h. in Italien (9,3 kg Wirkstoff/ha) und in Portugal (8,4 kg/haWirkstoff). Die niedrigsten Aufwandmengen liegen in den Mitgliedstaaten vor, in denen hauptsächlichFeldfrüchte angebaut werden.
Auf Frankreich, Italien und Spanien entfallen 76 % der insgesamt eingesetzten Fungizidwirkstoffe. Dievorherrschende Kultur beim Fungizideinsatz sind Weinreben (69 % des gesamten Fungizidwirkstoffeinsatzes).Auch hierbei entfällt auf Schwefel der Großteil aller Fungizideinsätze bei dieser Kultur (59 %).
Frankreich liegt beim Herbizideinsatz mit 35 % an erster Stelle. Getreide und Mais sind mit 36 bzw. 29 % diebeim Herbizideinsatz führenden Fruchtarten.
Beim Insektizideinsatz führt Italien (39 %) vor Spanien (24 %) und Frankreich (23 %). Auf die übrigen zwölfMitgliedstaaten entfällt jeweils ein Anteil von 3 % oder weniger.

Wichtigste Ergebnisse und Anmerkungen nach Ebene der europäischen Union
36 Pflanzenschutz / Plant protection / Protection des cultures A
Tabelle 2: Untergliederung der eingesetzten Pflanzenschutzmittel nach Mitgliedstaaten, 1996 (in 1 000 t Wirkstoff)
EU-15 148.9 86.0 14.7 249.6 100.0
B/L 1.3 1.8 0.2 3.3 1.3
DK 1 1.3 1.9 0.1 3.3 1.3
D 8.4 18.3 0.4 27.1 10.8
EL 8.7 1.1 0.5 10.4 4.2
E 16.4 6.8 3.5 26.7 10.7
F 53.2 34.6 3.4 91.2 36.5
IRL 0.2 0.3 0.0 0.5 0.2
I 44.1 7.3 5.8 57.2 22.9
NL 2.1 1.9 0.3 4.3 1.7
A 1.2 1.1 0.0 2.3 0.9
P 7.3 2.5 0.2 10.1 4.0
FIN 1 0.0 0.5 0.0 0.5 0.2
S 1 0.3 0.7 0.0 0.9 0.4
UK 4.3 7.4 0.3 11.9 4.8
Quelle: Eurostat.
%
(1) Der Anteil der "Nordischen Region", für die die Menge der eingesetzten Pflanzenschutzmittel im Jahr 1996 bei 543 Tonnen lag, wurde DK zu 69 % zugewiesen, FIN zu 11 % und S zu 20 %.
Fungizide Herbizide Insektizide INSGESAMT
3.3 Zielkulturen des Pflanzenschutzmitteleinsatzes
Der Großteil, bzw. 60 % - des gesamten Einsatzes von Pflanzenschutzmitteln nach der Menge des Wirkstoffesentfällt auf Sonderkulturen. 46 % des gesamten Wirkstoffeinsatzes in der EU entfällt auf Rebflächen, die sichüber 3,6 Mio. ha erstrecken (7 % der Bezugsanbaufläche). Obgleich die behandelte Grundfläche derSonderkulturen (6,3 Mio. ha, 12 % der Bezugsanbaufläche) erheblich kleiner ist als die von Ackerkulturen (45,2Mio. ha, 88 % der Bezugsanbaufläche), sind die Sonderkulturen, hauptsächlich Rebflächen, weiterhin derwichtigste Markt der hoch dosierten Verbindungen wie Schwefel und Kupfer. Darüber hinaus müssen dieBehandlungen in diesem Fall regelmäßig wiederholt werden, um einen Schädlings- oder Krankheitsbefall zuvermeiden. Beispielsweise können zur Schorfbekämpfung bei Tafeläpfeln, die in befallsträchtigen Lagen mithoher Feuchtigkeit angebaut werden, im Verlauf der Wachstumssaison bis zu 25 Fungizidanwendungennotwendig sein.
Ackerkulturen bedürfen keiner derartig hohen Aufmerksamkeit, da das Erntegut entweder als Futtermittel imBetrieb verbraucht oder von der Industrie verarbeitet wird. Auf Getreide – insbesondere Weizen und Gerste –entfällt 55 % der Anbaufläche und 19 % des Wirkstoffeinsatzes. Da Getreide der zentrale Zielmarkt fürinnovative Wirkstoffe ist, die bei niedrigen Dosierungen wirken (z. B. Sulfonylharnstoffherbizide), ist dergesamte Wirkstoffeinsatz von 1992 bis 1996 um 6,9 % zurückgegangen. Es wird damit gerechnet, daß dieinsgesamt eingesetzte Wirkstoffmenge in den nächsten Jahren in etwa konstant auf diesem Niveau bleibt. BeiMais – der Kultur, die beim Wirkstoffeinsatz an dritter Stelle liegt (10 %) – kommen überwiegend Herbizide zumEinsatz. Fungizide werden lediglich im Rahmen von Saatgutbeizungen eingesetzt. Auf alle anderen Kulturenentfallen 24 % der eingesetzten Wirkstoffmenge (Abbildung 3).
Fungizide werden überwiegend bei Sonderkulturen eingesetzt (82 % der eingesetzten Fungizidmenge). DieTraubenerzeugung erfordert den höchsten Fugizideinsatz (69 % der eingesetzten Fungizidmenge), da dieReben während der gesamten Wachstumsperiode vor Pilzkrankheiten geschützt werden müssen. Diegefährlichsten Krankheiten sind der Falsche Mehltau (Peronospora sp.), der Echte Mehltau (Oidium tuckerii)und der Grauschimmel (Botrytis cinerea). Schwefel, der als Spritzmittel oder als Trockenstaub eingesetzt wird,

Wichtigste Ergebnisse und Anmerkungen nach Ebene der europäischen Union
A Pflanzenschutz / Plant protection / Protection des cultures 37
schützt die Reben nicht nur vor dem Echten Mehltau, sondern hat auch eine akarizide Wirkung gegenSpinnmilben. Bei Baumobst (8 % der eingesetzten Fungizidmenge) liegt der Schwerpunkt auf der Bekämpfungdes Apfelschorfs (Venturia inaequalis), da Früchte mit Schorfstellen nicht als Tafeläpfel vermarktet, sondern nurzu einem niedrigeren Preis an die verarbeitende Industrie verkauft werden können.
Herbizide werden überwiegend bei Ackerkulturen eingesetzt, sie machen 69 % der gesamten Wirkstoffmengeaus (Abbildung 4). Beim Schutz der Ackerkulturen geht es hauptsächlich um die Unkrautbekämpfung, da dieUnkräuter mit den Kulturen um Wasser, Nährstoffe usw. konkurrieren. In den letzten Jahren schenken dieGetreideanbauer der Bekämpfung von Pilzkrankheiten mehr Aufmerksamkeit, da Getreide, das von Pilzenbefallen ist und als Futtermittel verwendet wird, gefährlich hohe Aflatoxinwerte aufweisen kann. Aflatoxine sindhochgiftige und karzinogene Stoffe, die zu Fruchtabgängen, beispielsweise bei trächtigen Sauen, führenkönnen.
Insektizide spielen bei der eingesetzten Pflanzenschutzmittelmenge nur eine untergeordnete Rolle. Bei Acker-und Gemüsekulturen liegt ihr Anteil an sämtlichen eingesetzten chemischen Wirkstoffen bei 4 bzw. 7 %. DieHauptziele des Insektizideinsatzes bei Obst und Reben sind die Larven verschiedener Lepidopteren (Motten),Blattläuse und Schildläuse (Abbildung 5).
Abbildung 3: Entwicklung des gesamten Pflanzenschutzmitteleinsatzes,nach Art der Kultur, EU 1992 bis 1996
0
40
80
120
160
1992 1993 1994 1995 1996
Ackerkulturen SonderkulturenQuelle: Eurostat.
(in 1 000 t Wirkstoff)
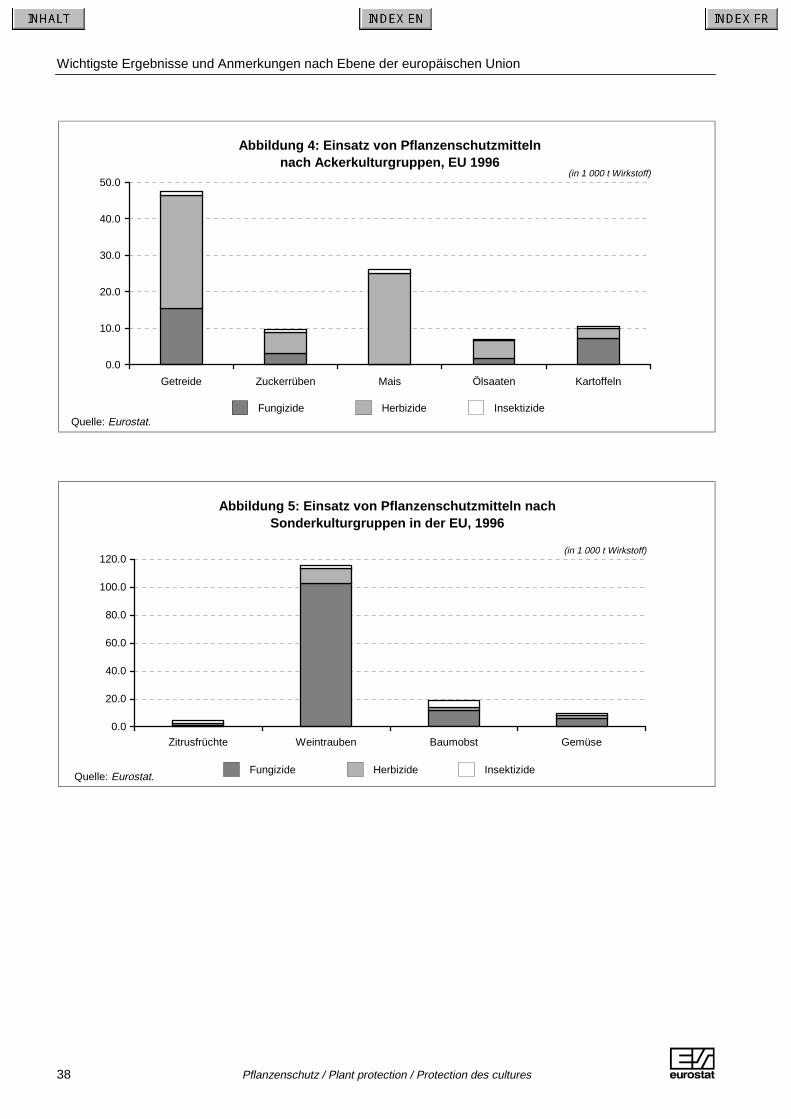
Wichtigste Ergebnisse und Anmerkungen nach Ebene der europäischen Union
38 Pflanzenschutz / Plant protection / Protection des cultures A
Abbildung 4: Einsatz von Pflanzenschutzmittelnnach Ackerkulturgruppen, EU 1996
0.0
10.0
20.0
30.0
40.0
50.0
Getreide Zuckerrüben Mais Ölsaaten Kartoffeln
Fungizide InsektizideHerbizideQuelle: Eurostat.
(in 1 000 t Wirkstoff)
Abbildung 5: Einsatz von Pflanzenschutzmitteln nachSonderkulturgruppen in der EU, 1996
0.0
20.0
40.0
60.0
80.0
100.0
120.0
Zitrusfrüchte Weintrauben Baumobst Gemüse
Fungizide InsektizideHerbizideQuelle: Eurostat.
(in 1 000 t Wirkstoff)
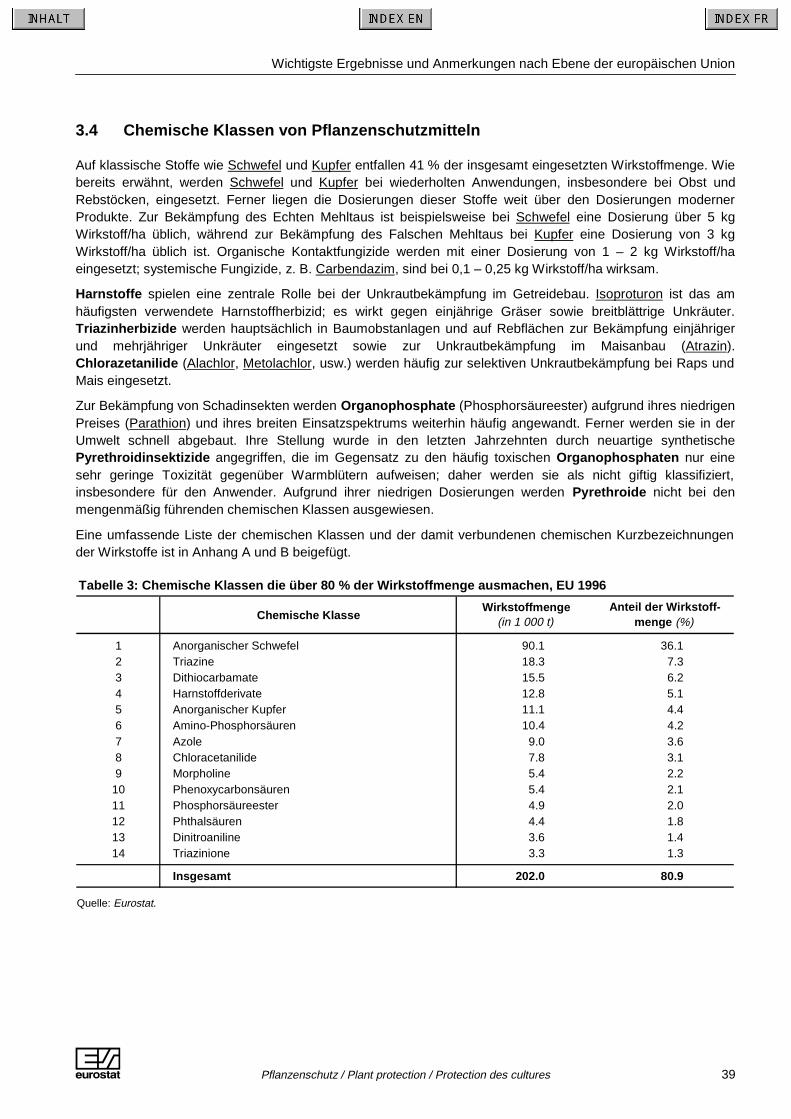
Wichtigste Ergebnisse und Anmerkungen nach Ebene der europäischen Union
A Pflanzenschutz / Plant protection / Protection des cultures 39
3.4 Chemische Klassen von Pflanzenschutzmitteln
Auf klassische Stoffe wie Schwefel und Kupfer entfallen 41 % der insgesamt eingesetzten Wirkstoffmenge. Wiebereits erwähnt, werden Schwefel und Kupfer bei wiederholten Anwendungen, insbesondere bei Obst undRebstöcken, eingesetzt. Ferner liegen die Dosierungen dieser Stoffe weit über den Dosierungen modernerProdukte. Zur Bekämpfung des Echten Mehltaus ist beispielsweise bei Schwefel eine Dosierung über 5 kgWirkstoff/ha üblich, während zur Bekämpfung des Falschen Mehltaus bei Kupfer eine Dosierung von 3 kgWirkstoff/ha üblich ist. Organische Kontaktfungizide werden mit einer Dosierung von 1 – 2 kg Wirkstoff/haeingesetzt; systemische Fungizide, z. B. Carbendazim, sind bei 0,1 – 0,25 kg Wirkstoff/ha wirksam.
Harnstoffe spielen eine zentrale Rolle bei der Unkrautbekämpfung im Getreidebau. Isoproturon ist das amhäufigsten verwendete Harnstoffherbizid; es wirkt gegen einjährige Gräser sowie breitblättrige Unkräuter.Triazinherbizide werden hauptsächlich in Baumobstanlagen und auf Rebflächen zur Bekämpfung einjährigerund mehrjähriger Unkräuter eingesetzt sowie zur Unkrautbekämpfung im Maisanbau (Atrazin).Chlorazetanilide (Alachlor, Metolachlor, usw.) werden häufig zur selektiven Unkrautbekämpfung bei Raps undMais eingesetzt.
Zur Bekämpfung von Schadinsekten werden Organophosphate (Phosphorsäureester) aufgrund ihres niedrigenPreises (Parathion) und ihres breiten Einsatzspektrums weiterhin häufig angewandt. Ferner werden sie in derUmwelt schnell abgebaut. Ihre Stellung wurde in den letzten Jahrzehnten durch neuartige synthetischePyrethroidinsektizide angegriffen, die im Gegensatz zu den häufig toxischen Organophosphaten nur einesehr geringe Toxizität gegenüber Warmblütern aufweisen; daher werden sie als nicht giftig klassifiziert,insbesondere für den Anwender. Aufgrund ihrer niedrigen Dosierungen werden Pyrethroide nicht bei denmengenmäßig führenden chemischen Klassen ausgewiesen.
Eine umfassende Liste der chemischen Klassen und der damit verbundenen chemischen Kurzbezeichnungender Wirkstoffe ist in Anhang A und B beigefügt.
Tabelle 3: Chemische Klassen die über 80 % der Wirkstoffmenge ausmachen, EU 1996
Chemische Klasse
1 Anorganischer Schwefel 90.1 36.12 Triazine 18.3 7.33 Dithiocarbamate 15.5 6.24 Harnstoffderivate 12.8 5.15 Anorganischer Kupfer 11.1 4.46 Amino-Phosphorsäuren 10.4 4.27 Azole 9.0 3.68 Chloracetanilide 7.8 3.19 Morpholine 5.4 2.2
10 Phenoxycarbonsäuren 5.4 2.111 Phosphorsäureester 4.9 2.012 Phthalsäuren 4.4 1.813 Dinitroaniline 3.6 1.414 Triazinione 3.3 1.3
Insgesamt 202.0 80.9
Wirkstoffmenge(in 1 000 t)
Anteil der Wirkstoff-menge (%)
Quelle: Eurostat.

Wichtigste Ergebnisse und Anmerkungen nach Ebene der europäischen Union
40 Pflanzenschutz / Plant protection / Protection des cultures A
Tabelle 4: Die zehn wichtigsten Wirkstoffe nach Menge, EU 1996 (alphabetisch geordnet)
Wirkstoff Chemische Klasse Wirkung
Atrazin Triazine H 3.0Kupfer Anorganischer Kupfer F 4.4Fenpropimorph Morpholine F 1.3Glyphosat Amino-Phosphorsäuren H 3.4Isoproturon Harnstoffderivate H 2.1Mancozeb Dithiocarbamate F 3.8Metolachlor Chloroacetanilide H 2.4Pendimethalin Dinitroaniline H 1.3Schwefel Anorganischer Schwefel F, I 36.1Terbuthylazin Triazine H :
Insgesamt :
F = Fungizide; H = Herbizide; I = Insektizide
Anteil der Wirkstoff-menge (%)
Tabelle 5: Die zehn wichtigsten chemischen Klassen von Fungiziden nach Menge, EU 1996
Chemische Klassevon Fungiziden
1 Anorganischer Schwefel 87.4 58.72 Dithiocarbamate 15.5 10.43 Anorganischer Kupfer 11.1 7.44 Azole 9.0 6.15 Morpholine 5.4 3.76 Phthalsäuren 4.4 2.97 Ethylphosphate 3.1 2.18 Harnstoffderivate 2.7 1.89 Acylalanine 2.1 1.4
10 Benzimidazole 1.7 1.1
Insgesamt 142.5 95.7
Anteil der Wirkstoff-menge (%)
Wirkstoffmenge(in 1 000 t)
Tabelle 6: Die zehn wichtigsten Fungizidwirkstoffe nach Menge, EU 1996 (alphabetisch geordnet)
Wirkstoffnamen der Fungizide
Chemische Klasse
Kupfer Anorganischer Kupfer 7.4Cymoxanil Harnstoffderivate :Fenpropimorph Morpholine 2.2Folpet Phthalsäuren 1.7Fosetyl Ethylphosphate 2.1Mancozeb Dithiocarbamate 6.4Metalaxyl Acylalanine :Metiram Dithiocarbamate 1.3Propiconazol Azole 1.5Schwefel Anorganischer Schwefel 58.7
Insgesamt :
Anteil der Wirkstoff-menge (%)
Quelle: Eurostat.

Wichtigste Ergebnisse und Anmerkungen nach Ebene der europäischen Union
A Pflanzenschutz / Plant protection / Protection des cultures 41
Tabelle 7: Die zehn wichtigsten chemischen Klassen von Herbiziden nach Menge, EU 1996
Chemische Klassevon Herbiziden
1 Triazine 18.0 21.02 Amino-Phosphorsäuren 10.4 12.13 Harnstoffderivate 10.0 11.64 Chloracetanilide 7.8 9.15 Phenoxycarbonsäuren 5.4 6.26 Dinitroaniline 3.6 4.27 Triazinone 3.3 3.88 Thiocarbamate 3.3 3.89 Diazine 2.5 2.9
10 Hydroxybenzonitrile 2.2 2.6
Insgesamt 66.5 77.3
Anteil (%)Wirkstoffmenge
(in 1 000 t)
Tabelle 8: Die zehn wichtigsten Herbizidwirkstoffe nach Menge, EU 1996 (alphabetisch geordnet)
Wirkstoffnamen der Herbizide Chemische Klasse
Atrazin Triazine 8.6Chlortoluron Harnstoffderivate 3.1Glyphosat Amino-Phosphorsäuren 10.0Isoproturon Harnstoffderivate 6.0Metamitron Triazinone 3.5Metolachlor Chloroazetanelide 6.9Pendimethalin Dinitroaniline 3.7Pyridat Diazine 2.9Simazin Triazine 2.4Terbuthylazin Triazine :
Insgesamt :
Anteil (%)
Tabelle 9: Die zehn wichtigsten chemischen Klassen von Insektiziden nach Menge, EU 1996
Chemische Klassevon Insektiziden
1 Phosphorsäureester 4.8 32.62 Mineralöl : :3 Anorganischer Schwefel 2.6 17.94 Carbamate 1.4 9.45 Pyrethroid 0.7 4.56 Oxim-Carbamate 0.4 2.77 Cyclodiene-Organochlorine 0.3 2.28 Biologische Wirkstoffe 0.1 1.09 Benzoylharnstoffderivate 0.1 0.9
10 Benzilate 0.1 0.9
Insgesamt : :
Wirkstoffmenge(in 1 000 t)
Anteil (%)
Quelle: Eurostat.
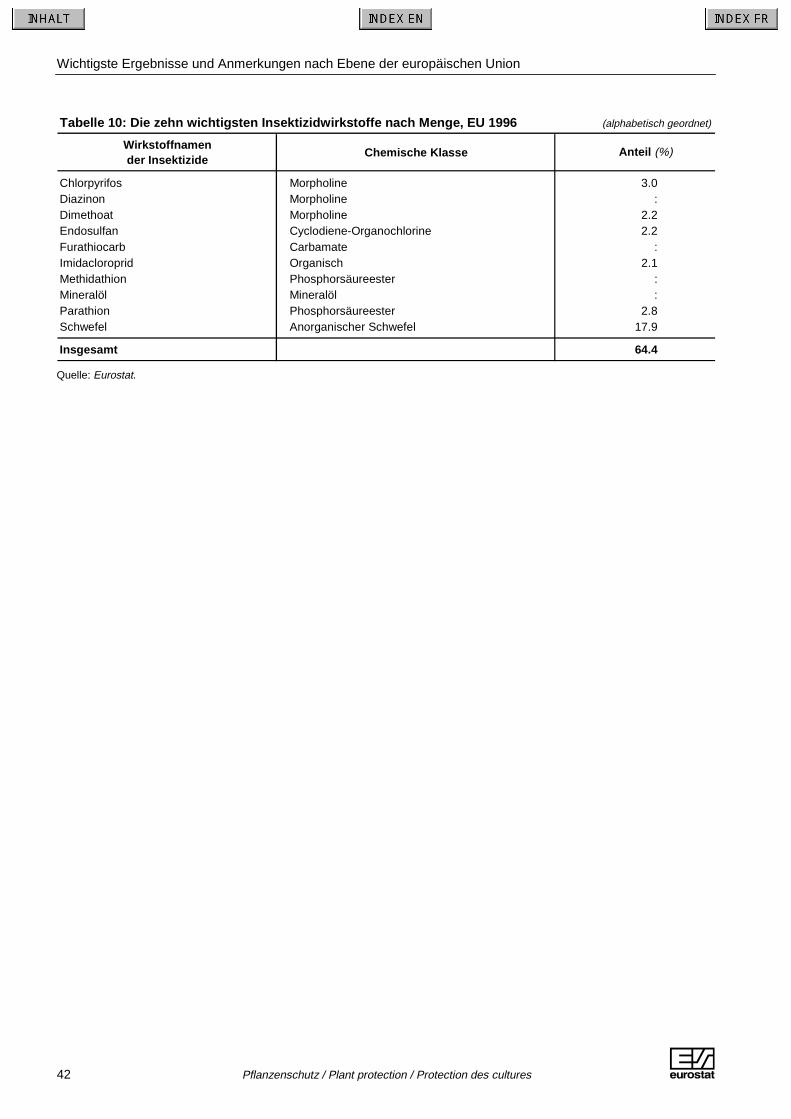
Wichtigste Ergebnisse und Anmerkungen nach Ebene der europäischen Union
42 Pflanzenschutz / Plant protection / Protection des cultures A
Tabelle 10: Die zehn wichtigsten Insektizidwirkstoffe nach Menge, EU 1996 (alphabetisch geordnet)
Wirkstoffnamen der Insektizide
Chemische Klasse
Chlorpyrifos Morpholine 3.0Diazinon Morpholine :Dimethoat Morpholine 2.2Endosulfan Cyclodiene-Organochlorine 2.2Furathiocarb Carbamate :Imidacloroprid Organisch 2.1Methidathion Phosphorsäureester :Mineralöl Mineralöl :Parathion Phosphorsäureester 2.8Schwefel Anorganischer Schwefel 17.9
Insgesamt 64.4
Anteil (%)
Quelle: Eurostat.

4
KOMMENTARE NACH EBENEDER MITGLIEDSTAATEN
Kommentare nach Ebene der Mitgliedstaaten
A Pflanzenschutz / Plant protection / Protection des cultures 45
Belgien / Luxemburg
Die Gesamtfläche von Acker- und Dauerkulturen in Belgien betrug 790 000 ha9. Auf die Kulturen, die in dervorliegenden Erhebung über den Pflanzenschutzmitteleinsatz erfaßt werden, entfielen ca. 91 % (721 000 ha )dieser gesamten Anbaufläche. Seit 1992 ging die Getreide-anbaufläche um 8 % zurück, während die Mais-anbaufläche um 25 % zugenommen hat.
Von der 1996 insgesamt eingesetzten Wirkstoffmenge entfielen 39 % auf Fungizide, 55 % auf Herbizide undnur 5 % auf Insektizide. Mit Ausnahme saisonaler Veränderungen aufgrund eines unterschiedlichen Schädlings-und Krankheitsbefalls war dieses Verhältnis recht konstant.
Die insgesamt auf Anbauflächen in Belgien eingesetzte Wirkstoffmenge liegt bei ca. 4,6 kg/ha. Die wichtigstenZielkulturen für in großen Mengen erfolgende Einsätze von Pflanzen-schutzmitteln sind Baumfrüchte (22,8 kgWirkstoff pro ha) und Kartoffeln (12,1 kg Wirkstoff pro ha). Den Landwirten, die diese Kulturen anbauen, kommtes dabei hauptsächlich auf die Bekämpfung der Kraut- und Knollenfäule bei Kartoffeln (Phytophthora sp. ) unddes Apfelschorfes (Venturia sp. ) an.
Was die insgesamt eingesetzte Wirkstoffmenge betrifft, liegen die Getreidearten bei den Zielkulturen weiterhinan erster Stelle: Ihr Anteil am Gesamteinsatz beträgt 35 %, gefolgt von Kartoffeln mit 23 %. Im allgemeinenveränderte sich der Wirkstoffeinsatz zwischen 1996 und 1992 um – 8,5 %. Es ist festzuhalten, daß auf Atrazinnach wie vor 44 % des Herbizideinsatzes bei Mais entfällt.
Prosulfocarb, das bei Getreide und Kartoffeln eingesetzt wird, ist mengenmäßig der wichtigste Herbizidwirkstoff.Bei Zuckerrüben sind Metamitron und Chloridazon die am häufigsten eingesetzten Herbizide. Mancozeb liegtbeim Einsatz von Kartoffelfungiziden klar an erster Stelle.
Dänemark
Die in der vorliegenden Erhebung erfaßten Anbauflächen machen 73 % der Gesamtfläche von Acker- undDauerkulturen aus. Bei anderen wichtigen Kulturen in Dänemark, die in dieser Erhebung nicht berücksichtigtsind, handelt es sich hauptsächlich um Dauergrünland sowie um Ackerwiesen und -weiden. Ferner erstrecktsich die vorliegende Untersuchung nicht auf Gartenbau-kulturen, die in Dänemark eine wichtige Rolle spielen.
Insgesamt ging die Menge der in Dänemark eingesetzten Pflanzen-schutzmittelwirkstoffe von 1992 bis 1996 um7,1 % zurück. Das mengenmäßige Verhältnis zwischen Fungiziden (41 %) und Herbiziden (57 %) blieb dabeiwährend des Berichtszeitraums relativ konstant. Der Anteil der Insektizide an der Wirkstoffmenge liegt imallgemeinen unter 2 %. Wenn man die für Dänemark gemeldete gesamte Wirkstoffmenge betrachtet, muß manberücksichtigen, daß einige Unternehmen ihre Angaben für die Nördliche Region nicht nach Mitgliedstaatenuntergliedert haben. Falls 69 % der für die Nördliche Region insgesamt gemeldeten Wirkstoffmenge Dänemarkzugewiesen wird, würde sich die gesamte Wirkstoffmenge für Dänemark etwa von 3 279 auf 3 654 Tonnenerhöhen.
Aufgrund der geringen Bedeutung von Sonderkulturen beim Einsatz von Pflanzenschutzmittelwirkstoffen imRahmen dieser Erhebung ist die durchschnittliche Einsatzmenge von Pflanzenschutzmittelwirkstoffen mit nur2,1 kg/ha recht gering.
Getreide spielt beim Ackerland (84 % der Gesamtfläche) und bei der Menge der Pflanzenschutzmittelwirkstoffe(72 % der Gesamtmenge) die dominierende Rolle.
9 NewCronos/Eurofarm – 1996er Daten.

Kommentare nach Ebene der Mitgliedstaaten
46 Pflanzenschutz / Plant protection / Protection des cultures A
Die Bekämpfung des Echten Mehltaus und der Ungräser ist das Hauptanliegen der Landwirte beim Einsatz vonPflanzenschutzmitteln.
Auf Morpholin- und Azole-Fungizide zur Bekämpfung von Getreide-krankheiten entfällt der größte Anteil amdänischen Pflanzenschutz-mittelmarkt. Maneb wurde bis 1995 zur Krautfäulebekämpfung bei Kartoffelneingesetzt. Danach ersetzte das Lieferunternehmen das Produkt durch Mancozeb. Aufgrund des Bezugsjahres1996 erscheint Maneb nicht in der Liste der führenden Kartoffelfungizide.
Deutschland
Die in Deutschland zu beobachtende Entwicklung der Anbauflächen spiegelt mehr oder weniger die im Rahmender GAP-Reform geforderte Flächen-stillegung wider. 1996 lagen die Getreideanbauflächen um 4,1 % und dieAnbauflächen von Ölsaaten, hauptsächlich Raps, um 15,8 % unter den Werten von 1992. Die im vorliegendenBericht berücksichtigten Kulturen machen 70 % der statistisch erfaßten Anbaufläche aus. Im übrigen sind keinewesentlichen Änderungen im Hinblick auf das gesamte Ackerland festzustellen.
Der deutsche Pflanzenschutzmittel-markt wird mengenmäßig eindeutig von Herbiziden dominiert, deren Anteil1996 68 % betrug. Auf Fungizide entfielen 31 % und auf Insektizide 1 %.
Die Einsatzmenge von Pflanzen-schutzmittelwirkstoffen pro Hektar Acker- bzw. Dauerkultur blieb während desBerichtszeitraums mit etwa 3,2 kg/ha stabil. Aufgrund der aufeinander folgenden Anwendungen hauptsächlichvon Fungiziden ist der Wirkstoffeinsatz auf Rebflächen (27,3 kg/ha) und Baumobstanlagen (12,5 kg/ha) relativhoch. Mengen-mäßige Veränderungen während des Berichtszeitraums sind hauptsächlich auf einenunterschiedlichen Krankheits-befall aufgrund der klimatischen Bedingungen zurückzuführen.
Im allgemeinen ist der Herbizideinsatz auf Rebflächen deutlich zurück-gegangen. Ein deutlicher Anstieg desEinsatzes von Schwefel- und Kupferfungiziden (+ 161 %) ist wahrscheinlich aufgrund der Förderungorganischer Anbaugrundsätze zu verzeichnen.
Im Anschluß an die Reform der GAP fiel der gesamte Wirkstoffeinsatz 1994 auf einen Tiefststand von 21 851Tonnen, wobei diese Entwicklung hauptsächlich auf den Rückgang bei Getreide (- 10,2 % zwischen 1992 und1994) und Ölsaaten (- 17,4 %) als die wesentlichen Zielflächen der Reform zurückzuführen war. In der Folgestiegen die Mengen wieder an und lagen 1996 um 11,1 % höher, verglichen mit der Gesamtmenge von 1992.
Der Pflanzenschutzmittelmarkt in Deutschland entfällt hauptsächlich auf Weizen, Gerste und Mais (größtenteilsGrünmais zur Silierung), und zwar im Hinblick auf die behandelte Fläche (Getreide: 57 %, Mais: 20 %) und diegesamte Einsatzmenge (Getreide: 45 %, Mais: 22 %).
Die führenden Einzelwirkstoffe sind Isoproturon (IPU), ein bei Getreide eingesetzes Gräserherbizid, die bei Maiseingesetzten Herbizide Terbuthylazin, Pyridat und Metolachlor, Metamitron bei Zuckerrüben und Schwefel aufRebflächen.
Griechenland
Die Anbaufläche der in der vorliegenden Erhebung berücksichtigten Kulturen macht lediglich ca. 44 % derAnbaufläche von Acker- und Dauerkulturen aus, die in Griechenland statistisch erfaßt wird. Bei derverbleibenden Fläche, die im Rahmen dieses Berichts nicht berücksichtigt wird, handelt es sich umDauergrünland sowie um Anbauflächen von Oliven, Frischobst (mit Ausnahme von Tafelkern- und Steinobst)sowie von verschiedenen Nebenfruchtarten. Diese sind für den lokalen Markt zwar wichtig, spielen jedoch beimEinsatz von Pflanzenschutzmitteln nur eine untergeordnete Rolle. Eine Gesamtfläche von 1,7 Mio. ha wird fürdiese Studie als Bezugsfläche betrachtet.
Fungiziden kommt der größte Anteil am Pflanzenschutzmittelmarkt zu (84 % im Jahr 1996).

Kommentare nach Ebene der Mitgliedstaaten
A Pflanzenschutz / Plant protection / Protection des cultures 47
Die landesweit durchschnittliche Dosierung von Pflanzenschutzmitteln beträgt aufgrund der Dominanz vonTrauben 6,0 kg Wirkstoff pro ha. Auf Rebflächen entfallen 78 % der insgesamt eingesetzten Wirkstoffmenge.Bei dieser Kultur liegt die durchschnittliche Dosierung der Pflanzenschutzmittelwirkstoffe bei 60,8 kg/ha, wobeies sich meist um Schwefel handelt (94 %).
Während Weizen und Gerste beim Anbau die größte Bedeutung zukommt (1,0 Mio. ha, 58 % der gesamtenAnbaufläche), spielen sie als Zielkulturen von Pflanzenschutzmitteln nur eine untergeordnete Rolle (1 % dergesamten Einsatzmenge).
Der Einsatz von Pflanzenschutzmitteln bei Getreide ist jedoch im Berichtszeitraum um 149 % gestiegen, waswahrscheinlich auf die zunehmende Rentabilität des Getreideanbaus in Griechenland nach der GAP-Reformzurückzuführen ist.
Der Einsatz von Pflanzenschutzmitteln bei Zuckerrüben hat ebenfalls deutlich zugenommen (um 80 %), undzwar offensichtlich aufgrund der häufigen Anwendungen von Schwefel gegen den Echten Mehltau.
Mit einem Anteil von 73 % am gesamten Wirkstoffeinsatz in der griechischen Landwirtschaft liegt Schwefel vorallen anderen Wirkstoffen mengenmäßig mit weitem Abstand an erster Stelle.
Spanien
Auf die in der vorliegenden Erhebung berücksichtigten Kulturen entfällt ein Anteil von 48 % an der erfaßtenAnbaufläche von Acker- und Dauerkulturen in Spanien. In diesem Bericht nicht berücksichtigt werden Oliven,Reis und Hülsenfrüchte, die in Spanien zwar von großer Bedeutung sind, nicht jedoch in den meisten anderenEU-Mitgliedstaaten.
Auf dem spanischen Pflanzenschutzmittelmarkt herrschen eindeutig Fungizide vor. Der gesamte Anteil amWirkstoffeinsatz lag zwischen 61 % (1995 und 1996) und 71 % (1992 und 1993), was hauptsächlich auf diegroßen Einsatzmengen von Schwefel zurückzuführen ist. Auf Herbizide entfiel ein Anteil zwischen 21 % (1992)und 26 % (1996), auf Insektizide ein Anteil zwischen 8 % (1992) und 16 % (1995).
Die durchschnittliche Dosierung von Pflanzenschutzmitteln war im Berichtszeitraum mit 2,5 – 2,7 kg Wirkstoff/hainsgesamt recht stabil. Nur 0,5 kg Wirkstoff/ha werden bei Getreide eingesetzt, während die Einsatzmenge beiRebflächen bis zu 11,3 kg Wirkstoff/ha beträgt.
Während auf Getreide 58 % der im vorliegenden Bericht berücksichtigten Anbaufläche entfällt, liegt der Anteilvon Getreide an der insgesamt eingesetzten Menge an Pflanzen-schutzmitteln bei 10 %. Pflanzen-schutzmittelkommen vor allem bei Trauben und Zitrusfrüchten zum Einsatz, deren Anteil an der insgesamt eingesetztenMenge von Pflanzen-schutzmittelwirkstoffen 61 % beträgt. Im Berichtszeitraum sind in Spanien keinewesentlichen Änder-ungen bei den Gesamteinsatz-mengen von Pflanzenschutzmittelwirk-stoffen ein-getreten.Im Hinblick auf einzelne Kulturen ist bei Mais ein steigender Herbizideinsatz zu ver-zeichnen und bei Kartoffelnsowie bei Zuckerrüben ein steigender Fungizideinsatz.
Schwefel ist der in Spanien dominierende Einzelwirkstoff beim Pflanzenschutz. Er wird hauptsächlich zurBekämpfung des Echten Mehltaus sowie zur Bekämpfung von Spinnmilben auf Rebflächen, Baumobstanlagenund im Gemüsebau eingesetzt. Glyphosat ist das beim Einsatz auf Rebflächen führende Herbizid. BeiZitrusfrüchten werden zur Bekämpfung von Schildläusen und Milben beträchtliche Mengen von Mineralöleingesetzt (25 % der bei dieser Kultur insgesamt eingesetzten Pflanzenschutzmittel).

Kommentare nach Ebene der Mitgliedstaaten
48 Pflanzenschutz / Plant protection / Protection des cultures A
Frankreich
Frankreich ist der größte Einzelmarkt für Pflanzenschutzmittel in der Europäischen Union. Sein Anteil an der inder EU insgesamt eingesetzten Wirkstoffmenge beträgt 37 %.
Die vorliegende Studie bezieht sich auf 70 % der erfaßten Gesamtanbaufläche von Acker- und Dauerkulturen.Auf den Weizen- und Gersteanbau entfallen dabei 48 % der erfaßten Fläche.
Bei den im Rahmen dieser Studie nicht erfaßten Hauptkulturen handelt es sich um Dauergrünland undAckerwiesen sowie mehrjährige und temporäre Grünfutterkulturen.
Auf Fungizide bzw. Herbizide entfallen 58 % bzw. 38 % der insgesamt eingesetzten Wirkstoffmengen. Im Jahr1994 wurden insgesamt 13,5 % weniger Wirkstoffmengen eingesetzt als 1992, was hauptsächlich aufKostensenkungs- und Dosierungsver-minderungsstrategien nach der GAP-Reform zurückzuführen ist. Aufgrundeines durch Trockenheit bedingten geringen Krankheitsbefalls wurden weniger Fungizide eingesetzt, wobei dieEinsatzmengen inzwischen allerdings wieder die früheren Spitzenwerte erreichen.
Die durchschnittliche Einsatzmenge von Pflanzenschutzmittelwirkstoffen pro ha bewegte sich imBerichtszeitraum mehr oder weniger konstant zwischen 5,8 und 6,9 kg/ha, was hauptsächlich auf diedominierende Stellung des Wein- und Obstanbaus und die dafür erforderlichen aufeinanderfolgendenAnwendungen von Fungiziden zurückzuführen ist. Auf Rebflächen steigt die Einsatzmenge pro Hektar durchden Mehrfacheinsatz von Fungiziden zur Bekämpfung des Falschen Mehltaus und der Botrytis pro Saison aufbis zu 50,5 kg. Zur Bekämpfung von Fusarium und Phytophthora bei Kartoffeln sowie von Schorf und EchtemMehltau bei Baumobst sind während der Saison ebenfalls Mehrfachanwendungen von Fungiziden erforderlich,die zu erhöhten Wirkstoffmengen pro ha führen (13,9 kg/ha bei Kartoffeln und 36,0 kg/ha bei Baumobst).
Auf Rebflächen entfallen 51 % der in Frankreich insgesamt eingesetzten Wirkstoffmenge. Für Weizen, Gersteund Mais (Körner- und Grünmais) werden 29 % der gesamten Wirkstoffmenge eingesetzt. Der Rest entfällt aufBaumobst (7 %), Ölsaaten (5 %), Zuckerrüben, Gemüse und Kartoffeln (jeweils 3 %).
Auf Rebflächen ist Schwefel der am häufigsten verwendete Einzelwirkstoff. Glyphosat und Isoproturon sind dieam häufigsten zur Ungrasbekämpfung eingesetzten Herbizide bei Getreide. Während Isoproturon bei Getreideselektiv wirkt, wird Glyphosat in der Regel entweder nach der Ernte zur Vernichtung der Quecke (Agropyron)oder zur Unkraut-vernichtung auf stillgelegten Flächen eingesetzt, die wieder in Kultur genommen werdensollen. Atrazin ist bei der Unkrautbekämpfung im Maisanbau weiterhin dominierend
Irland
Von den 1,4 Mio. ha Acker- und Dauerkulturen in Irland, werden im Rahmen dieser Erhebung nur 24 % alsBezugskulturen betrachtet. Der größte Teil der statistisch erfaßten Anbauflächen sind Ackerwiesen sowieDauerwiesen und –weiden, die beim Pflanzenschutzmitteleinsatz keine Rolle spielen. Über den Pflanzen-schutzmitteleinsatz bei Baumobst werden in Irland keine Daten geliefert.
Auf Herbizide und Fungizide entfallen 54 % bzw. 45 % der insgesamt eingesetzten Wirkstoffmenge.
Die landesweit durchschnittlich eingesetzte Gesamtmenge an Pflanzenschutzmitteln beträgt 1,6 kg Wirkstoff/ha.Allerdings erscheint die Dosierung bei Kartoffeln (2,7 kg/ha) angesichts der aufgrund der Krautfäulenotwendigen Fungizidanwendungen zu gering eingeschätzt.
Kommentare nach Ebene der Mitgliedstaaten
A Pflanzenschutz / Plant protection / Protection des cultures 49
Die wichtigsten Zielkulturen für Pflanzenschutzmittel sind Weizen und Gerste, auf die 65 % der insgesamteingesetzten Wirkstoffmenge entfallen. Die zweite Hauptkultur bei der eingesetzten Pflanzenschutzmittel-menge sind Kartoffeln (hauptsächlich Fungizide).
Propachlor ist das Herbizid, das am häufigsten zur Unkrautbekämpfung bei Gemüse (Brassica) eingesetzt wird.Glyphosat ist das führende Herbizid zur Säuberung stillgelegter Flächen vor dem erneuten Getreideanbau bzw.zur Bekämpfung der Quecke nach der Ernte.
Italien
Auf die in der vorliegenden Erhebung beinhalteten Kulturen entfallen 57 % der erfaßten Gesamtanbaufläche inItalien. Zu den nicht berücksichtigten Anbauflächen einiger Hauptfruchtarten gehören die Anbauflächen voneinjährigen Futterkulturen, Oliven, Nüssen, Sojabohnen und Reis. Die gesamte Bezugsfläche der vorliegendenStudie beträgt 6,2 Mio. ha.
Fungizide liegen aufgrund der großen eingesetzten Schwefelmengen eindeutig an erster Stelle (77 % derinsgesamt eingesetzten Menge an Pflanzenschutzmitteln). Auf Herbizide entfällt ein Anteil von 13 % und aufInsektizide von 10 %.
Die sich aus den vorliegenden Daten ergebende landesweite durch-schnittliche Dosierung beträgt ca. 9,3 kgWirkstoff/ha. Dabei sind Getreideanbauflächen mit nur 0,4 kg/ha unbedeutend. Bei Rebflächen undBaumobstanlagen ist mit 41,0 bzw. 27,6 kg Wirkstoff/ha die höchste Einsatzintensität zu verzeichnen.
Rebflächen (66 %) und Baumobstanlagen (14 %) sind die wichtigsten Zielkulturen für denPflanzenschutzmitteleinsatz (80 % der insgesamt eingesetzten Wirkstoffmenge). Auf Getreide, dessen Anteil ander Bezugsfläche bei 46 % liegt, entfällt hingegen nur ein Anteil von 2 % an der gesamten Wirkstoffmenge.
Wie bei zahlreichen anderen, vornehmlich auf Rebflächen ausgerichteten Pflanzenschutz-mittelmärkten entfälltauf Schwefel der größte Anteil (55 %) der in Italien eingesetzten Wirkstoffmenge und 77 % der auf Rebflächeneingesetzten Wirkstoffmenge. Kupfer ist mit einem Anteil von 11 % an der Gesamtmenge die zweitwichtigsteVerbindung.
Die Niederlande
Bei der gesamten erfaßten nationalen Anbaufläche von Acker- und Dauerkulturen werden keine Dauerwiesenund –weiden, Anbauflächen von Gartenbaukulturen und Kulturen unter Glas berücksichtigt. In der vorliegendenStudie werden 87 % der Acker- und Obstbaubezugskulturen (810 000 ha) einbezogen.
Die 1991 in den Niederlanden eingeleitete Politik zur Verringerung des Pflanzenschutzmitteleinsatzes forderteeine 35 %ige Verringerung des Wirkstoffeinsatzes für das Jahr 1995, verglichen mit dem Bezugszeitraum1984 – 1988. Diese Verringerung wurde größtenteils durch die Senkung des Einsatzes von Nematizidenerreicht, die den niederländischen Markt beherrschten. Nematizide werden im vorliegenden Bericht jedoch nichtberücksichtigt; ferner werden zahlreiche Nebenfruchtarten nicht berücksichtigt, bei denen ein intensiver Einsatzvon Pflanzenschutzmitteln vorliegt. Daher kommen die durch das Programm zur Verringerung des Einsatzesvon Pflanzenschutzmitteln erzielten Ergebnisse in der vorliegenden Studie nicht zum Ausdruck, der zufolgenämlich im Berichtszeitraum eine geringfügige Zunahme der Einsatzmengen vonStandardpflanzenschutzmitteln pro Hektar zu verzeichnen ist.
Im Bezugsjahr 1996 lag der Anteil der Fugizide an der insgesamt eingesetzten Wirkstoffmenge bei 50 %, derder Herbizide bei 44 % und der der Insektizide bei 6 %.

Kommentare nach Ebene der Mitgliedstaaten
50 Pflanzenschutz / Plant protection / Protection des cultures A
Die durchschnittliche nationale Einsatzmenge für Acker- und Dauerkulturen liegt bei 5,3 kg Wirkstoff/ha.
Bei Obstbäumen ist die Einsatzmenge mit 26,1 kg Wirkstoff/ha am höchsten, im Laufe einer Saison hervorgeht.Bei Kartoffeln liegt die durchschnittliche Dosierung bei 10,3 kg Wirkstoff/ha.
Mengenmäßig liegen Kartoffeln mit einem Anteil von 45 % am Gesamteinsatz von Pflanzenschutz-mittelwirkstoffen an erster Stelle. Auf Getreide, Mais und Zuckerrüben entfällt zusammengenommen ein Anteilvon 37 % an der eingesetzten Wirkstoffmenge.
Kartoffelfungizide sind die in den Niederlanden mit Abstand führende Produktgruppe. Mancozeb, Maneb undFentin waren mit einem Anteil von 67 % die führenden bei Kartoffeln eingesetzten Pflanzenschutzmittel-wirkstoffe. Atrazin war das bei Mais vorherrschende Herbizid.
Österreich
Das Ackerland und die Anbaufläche von Dauerkulturen beliefen sich 1996 in Österreich auf insgesamt 1,5 Mio.ha. Die in der Erhebung über Pflanzenschutzmittel erfaßten Kulturen (1,0 Mio. ha) machen etwa 67 % diesergesamten Anbaufläche aus.
Der Anteil der Herbizide an der insgesamt eingesetzten Wirkstoffmenge ging von 55 % im Jahr 1992 auf 47 %im Jahr 1996 zurück. Andererseits ist der Fungizidanteil an der insgesamt eingesetzten Wirkstoffmenge von 42auf 52 % gestiegen. Auf Insektizide entfällt nach wie vor ein geringer Anteil von unter 3 %.
Während bei Getreideanbauflächen im Jahr 1996 durchschnittlich 1,0 kg Wirkstoff pro ha eingesetzt wurden,lag die Einsatzmenge bei Rebflächen aufgrund des großen Einsatzes von Schwefel (33 % der insgesamteingesetzten Menge) zur Bekämpfung des Echten und Falschen Mehltaus bei 12,3 kg Wirkstoff pro ha. Dadiese Stoffe als „natürliche Chemikalien“ klassifiziert werden und sie somit für den Einsatz beim organischenLandbau zugelassen sind, ist zu erwarten, daß die Einsatzmenge hoch bleiben wird. Im allgemeinen lag diedurchschnittliche Einsatzmenge bei den in der vorliegenden Erhebung erfaßten Kulturen landesweit bei 2,2 kgWirkstoff/ha.
Der Pflanzenschutzmittelmarkt ist schwerpunktmäßig auf vier Haupt-fruchtarten ausgerichtet: Rebflächen(26 %), Getreide (24 %), Mais (17 %) und Zuckerrüben (16 %). Auf diese vier Segmente entfallen 83 % derinsgesamt eingesetzten Wirkstoff-menge.
Vergleicht man die Wirkstoffmenge von 1996 mit der von 1992, so ist ein Rückgang des Einsatzes von 21,0 %festzustellen, und zwar hauptsächlich bei Getreideherbiziden.
Dieser Rückgang ist in erster Linie darauf zurückzuführen, daß das Herbizid Dicamba bei Getreide durchneuartige Sulfonylharnstoffe ersetzt wurde; bei der mengenmäßigen Abnahme spielte aber auch derrückläufige Einsatz von Atrazin bei Mais und Isoproturon bei Getreide eine Rolle. Schwefel ist der wichtigsteEinzelwirkstoff bei Rebflächen und Zuckerrüben; sein Anteil an der insgesamt eingesetzten Fungizidmenge liegtin Österreich bei 63 %.
Portugal
Von den 2,9 Mio. ha Acker- und Dauerkulturen in Portugal, werden 1,2 Mio. ha (41 %) in der vorliegendenStudie berücksichtigt. Auf Getreide (24 %), Mais (26 %) und Rebflächen (22 %) entfallen 71 % derBezugsfläche. Oliven, Futterkulturen und Grünland wurden nicht berücksichtigt.

Kommentare nach Ebene der Mitgliedstaaten
A Pflanzenschutz / Plant protection / Protection des cultures 51
Auf den Einsatz von Fungiziden, hauptsächlich Schwefel, entfallen 73 % der in Portugal insgesamt eingesetztenWirkstoffmenge. Der Herbizidanteil liegt bei 25 % und der Insektizidanteil bei 2 %.
Die durchschnittliche Einsatzmenge erhöhte sich im Berichtszeitraum von 5,3 auf 8,4 kg Wirkstoff/ha, was einerZunahme von 1992 bis 1996 um 61 % entspricht. Diese Zunahme war bei Getreide (+ 695 %) und Kartoffeln(+ 111 %) am ausgeprägtesten. Bei Ölsaat, Mais und Rebflächen stieg der Einsatz ebenfalls um 84 %, 57 %bzw. 56 % an. Diese außerordentlich hohe Zunahme ist offensichtlich auf den niedrigen Fungizideinsatz imJahre 1992 zurückzuführen, der durch extreme Trockenheit und einen geringen Krankheitsbefall verursachtwurde. Auf Rebflächen entfallen 71 % der insgesamt in Portugal eingesetzten Wirkstoffmenge und auf Getreide,Mais, Kartoffeln, Obstbäume und Gemüse bis zu 27 %.
Schwefel, Kupfer und Propineb sind die führenden Fungizide auf Rebflächen, wobei Schwefel mit weitemAbstand an erster Stelle liegt. Pendimethalin hat bei Getreide erhebliche Marktanteile erlangt.
Phenoxycarbonsäure -Herbizide (2,4-D) wurden offensichtlich durch Sufonylharnstoffe ersetzt. DieseHerbizide werden die in der Regel drastisch niedriger dosiert (20 bis 30 g Wirkstoff gegenüber 500 bis 1 000 gbei den älteren Herbiziden).
Finnland
Die gesamte finnische Anbaufläche von Acker- und Dauerkulturen beträgt 2,2 Mio. ha. Für die vorliegendeErhebung wurde eine Fläche von 735 000 ha berücksichtigt, die hauptsächlich der Erzeugung von Getreide(89 %), Zuckerrüben (5 %) und Kartoffeln (5 %) dient. In der vorliegenden Studie nicht berücksichtigt wurdenAckerwiesen und -weiden sowie Dauergrünland, Hafer und sonstiges Menggetreide sowie Futterkulturen.
Auf Herbizide entfällt ein Anteil von 94 % am gesamten Wirkstoffeinsatz. Fungizide und Insektizide sind mit 6 %bzw. 1 % von geringerer Bedeutung. Der finnische Pflanzenschutzmittelmarkt spielt mit einem Anteil von 0,2 %am europäischen Markt nur eine untergeordnete Rolle.
Der gesamte Wirkstoffeinsatz pro ha Anbaufläche beträgt 0,7 kg/ha. Die wichtigste Zielkultur für den Einsatzvon Pflanzenschutzmittelwirkstoffen pro ha sind Zuckerrüben.
Auf Getreide (65 %), Zuckerrüben (16 %) und Kartoffeln (13 %) entfällt ein Anteil von 94 % an der insgesamt inFinnland eingesetzten Wirkstoffmenge. Das Hauptziel beim Pflanzenschutz-mitteleinsatz ist die Unkraut-bekämpfung.
Bei Getreide sind die wichtigsten Verbindungen für den Pflanzenschutz Glyphosat zur Bekämpfung der Queckenach der Ernte oder zur Säuberung zuvor stillgelegter Flächen und MCPA zur Bekämpfung von breitblättrigemUnkraut.
Schweden
Die Anbauflächen von Acker- und Dauerkulturen in Schweden weist beträchtliche Flächen von Ackerwiesenund –weiden auf. Da diese beim Pflanzenschutzmitteleinsatz keine Rolle spielen und daher nicht berücksichtigtwerden, wird in der vorliegenden Studie eine Bezugsfläche von 948 000 ha (34 %) herangezogen. Auf dieserFläche wird zu 85 % Getreide angebaut, zu 6 % Zuckerrüben, zu 4 % Ölsaaten – hauptsächlich Raps – und zu4 % Kartoffeln. Die Anbaufläche von Ölsaaten ist von 138 000 ha im Jahr 1992 auf 41 000 ha im Jahr 1996stark zurückgegangen.

Kommentare nach Ebene der Mitgliedstaaten
52 Pflanzenschutz / Plant protection / Protection des cultures A
Herbizide sind die in Schweden am häufigsten eingesetzten Pflanzenschutzmittel; ihr Anteil an der gesamtenEinsatzmenge liegt bei 70 %. Der Einsatz von Fungiziden (27 %) ist nach wie vor insbesondere bei Getreideund Kartoffeln von Bedeutung. Auf den Insektizideinsatz entfällt durchschnittlich ein Anteil von 2 %.
Mit einer durchschnittlichen landesweiten Einsatzrate von 1,0 kg Wirkstoff/ha gehört Schweden zu den Ländernmit den niedrigsten Einsatzraten pro ha. Die Dosierung bei Gemüse (18,9 kg Wirkstoff/ha) ist hauptsächlich aufden Einsatz des Herbizids Propachlor zurückzuführen, das bei Kohlkulturen einschließlich Kohlrübenangewendet wird.
Auf Getreide (61 %), Zuckerrüben (14 %) und Gemüse - hauptsächlich Kohlarten – (13 %) entfällt ein Anteil von88 % an der gemeldeten Wirkstoffmenge, hauptsächlich Herbizide.
Glyphosat ist das führende Herbizid bei Getreide und wird hauptsächlich zur Bekämpfung der Quecke nach derErnte angewandt. Bei Kartoffeln sind Mancozeb und Metalaxyl die wichtigsten Fungizide zur Bekämpfung vonPhytophthora sp., Fusarium sp. und Alternaria sp.. Das am häufigsten eingesetzte Herbizid bei Zuckerrüben istMetamitron. Bei Gemüse - hauptsächlich Kohlarten – ist Propachlor das führende Herbizid.
Vereinigtes Königreich
Die der Erhebung zugrunde liegende Bezugsfläche entspricht 69 % der gesamten Anbaufläche von Acker- undDauerkulturen. Mit einem Anteil von 53 % an der Gesamtfläche und von 76 % an der in dieser Studieherangezogenen Bezugsfläche ist Getreide die mit weitem Abstand wichtigste Kultur. Grünmais ist zunehmendvon Bedeutung: Die Anbaufläche von Silage- und Futtermais ist im Berichtszeitraum um 119 % gestiegen. DieRapsanbaufläche hat sich 1996 aufgrund der GAP-Reform von 1992 bei 356 000 ha stabilisiert.
Im Jahr 1996 lag der Anteil der Fungizide an der insgesamt eingesetzten Wirkstoffmenge bei 36 %, der derHerbizide bei 62 % und der der Insektizide bei 3 %.
Mit einem landesweiten Durchschnittswert von 2,8 kg Wirkstoff/ha liegt das Vereinigte Königreich gleichauf mitanderen Mitgliedstaaten, die hauptsächlich Ackerkulturen anbauen. Der intensivste Einsatz vonPflanzenschutzmitteln erfolgt bei Baumobst (10,8 kg Wirkstoff/ha) zur Bekämpfung von Schorf und EchtemMehltau sowie bei Kartoffeln (6,1 kg Wirkstoff/ha) zur Bekämpfung von Phytophthora, Alternaria und Fusarium.
Auf Getreide entfällt ein Anteil von 71 % an der gesamten im Vereinigten Königreich eingesetzten Wirkstoff-menge; auf Kartoffeln (9 %), Zuckerrüben (7 %) und Ölsaaten – Raps – (4 %) entfällt zusammen-genommen einAnteil von 20 %.
Die Unkrautbekämpfung bei Getreide, Zuckerrüben und Raps ist hauptsächlich maßgeblich dafür, daß aufHerbizide ein Anteil von 62 % an der insgesamt eingesetzten Menge an Pflanzenschutzmittelwirkstoffen entfällt.Fungizide werden größtenteils bei Getreide zur Bekämpfung des Echten Mehltaus und verschiedener andererBlatt- und Ährenkrankheiten eingesetzt. Die Bekämpfung des Kartoffelbrandes (Phytophthora) und dieBekämpfung der Alternaria sind für die Kartoffelerzeugung unbedingt notwendig. Insektizide werdenhauptsächlich zur Blattlaus- (Vektoren-) bekämpfung bei Zuckerrüben, Hülsenfrüchten und anderenGemüsekulturen eingesetzt.
Isoproturon und Glyphosat sind die führenden Herbizide bei Getreide. Mancozeb liegt bei Kartoffeln an ersterStelle. Bei Zuckerrüben ist Metamitron das am häufigsten eingesetzte Herbizid und bei Raps Metazachlor. DerEinsatz von Atrazin ist im Berichtszeitraum aufgrund der Zunahme der Maisanbauflächen gestiegen.

1
PLANT PROTECTION IN THE EU

Introduction by Eurostat
A Pflanzenschutz / Plant protection / Protection des cultures 55
INTRODUCTION BY EUROSTAT
The control of sales and use of plant protection products in the European Union is addressed by Directive91/414/EEC, which sets out the requirements which must be met for any new product introduced onto the EUmarket. The Directive also requires a comprehensive review all plant protection products currently on the EUmarket, which may lead to withdrawal of approval or restriction of the sale of certain products: for example, aproduct which is found to be toxic to birds should not be used for seed treatment. Thus a comprehensive bodyof information is being built up on the characteristics of the different products, such as LD-50 (a standardmeasure of the toxicity), or the effects of persistence on a variety of flora and fauna, etc.
The main gap in the information concerns the actual use of the pesticides in the Member States: particularly theactual quantities of the different products (active substances) used and the crops to which they are applied. Thispublication attempts to fill some of these gaps.
The collection of a reliable set of usage statistics has value in many areas of research, legislation andagricultural support.10
Major types of users are the following:
• National policy-makers, in particular in agriculture, environment protection and public health.Statistical time series provide information to governments on the current status of pesticide use.Following a number of recently reported “pesticide scares” appearing in the press concerningcarcinogenic, neurological or other undesirable effects of specific pesticides, it is vital that policy-makershave up-to-date information on their usage. Ideally this should include data on the product range inwhich they occur, the crops to which they are applied and the extent to which those crops are treated.These data should ultimately yield information on the likely exposure of the population to the purportedhazard.
• European Union policy-makers. The EU’s Fifth Environmental Action Programme sets a target for theyear 2000 of “the significant reduction of pesticide use per unit of land under production…”. Thesuccess of this can only be monitored by collating reliable usage data over time. The CommonAgriculture Policy (CAP) also needs this type of data for a complete assessment of the economicimplications for the establishment of the level of prices of agricultural products.
• International organisations. The Food and Agriculture Organisation (FAO) compiles annual statisticsacross all countries under Article 1, paragraph 1 of the FAO Constitution, which stipulates that “theOrganisation shall compile, analyse and disseminate information relating to nutrition, food and agriculture”.
Uses of these data for policy-makers at national, European Union and international level include the followingtypes of monitoring activity:
• Providing information as part of the review process of existing pesticides. An essential part ofthe review process under Directive 91/414/EEC is a knowledge of the local and national uses andrequirements for that pesticide. If monitoring suggests that growers cannot compete without aparticular pesticide, and no alternatives are available, this must be borne in mind during its review.Reliable usage data are fundamental to such appraisals and are a suitable means of quantifying theeffect of withdrawal. Alternatively, the demonstrated lack of use of a particular pesticide, coupledwith the availability and uptake of safer or more benign alternatives, may hasten a pesticide’swithdrawal.
• Providing information as part of the approvals process of new pesticides. During the approvalof new active substances, usage data may provide a clear indication of the likely uptake of a newpesticide, knowing what pesticide(s) it is likely to replace and the current extent of their use.
10 For example, in Great Britain, which has the most comprehensive pesticide usage survey in the EU, pesticide use has been surveyed onall crops cyclically for over 30 years.

Introduction by Eurostat
56 Pflanzenschutz / Plant protection / Protection des cultures A
• Monitoring the potential movement of pesticides into water. Data on pesticide usage can beused to assist in the monitoring of pesticide contamination in surface and ground waters. Forexample, the EU aims to protect drinking water and groundwater through legislation, leading towidespread monitoring of pesticide residues in order to comply with these directives. In GreatBritain, pesticide usage data are used within a complex geographical information system,containing maps of soil and groundwater, rivers and other waterways and water abstraction points.This is overlaid with current cropping and pesticide usage patterns, both geographically andseasonally, and, together with a database of pesticide properties and models of movement throughdifferent soils, is used to predict the likely appearance of pesticides at abstraction points to facilitatethe monitoring of pesticides in water. By so doing, it is hoped to avoid unnecessary monitoring forpesticides which are unlikely to appear at a specific point or time within a given water body. It isimportant to note, however, that such methods can only be used to direct monitoring rather than actas a substitute for monitoring.
• Providing information for residue monitoring programmes of fresh fruit, vegetables etc. EU-wide usage data would allow Member States to tailor their residue monitoring systems for a widerange of home-grown produce and for imports from other EU countries, to monitor compliance withMaximum Residue Levels (MRLs):
Where new monitoring programmes are being undertaken, usage data will illustrate the rangeof pesticides currently used on the crops to be monitored and allow the analytical suite to betailored to consider only those pesticides likely to be encountered.
Where unusual or unexpected residues are found, usage data from actual surveys of farmerscan confirm the results or invoke alternative methods to corroborate or invalidate the findings. Forexample, analysis of plums by HPLC with UV diode array detection indicated that 50% of samplescontained residues of diflubenzuron, whereas usage data suggested that only 5% of the crop hadbeen treated. These survey results prompted alternative analysis by LC-MS which revealed thatsuspected residues were artefacts. In contrast, residues of chlorothalonil in lettuce, a non-approveduse within the UK, were corroborated by survey data where such misuse had been encountered inthe field.
Other relevant types of uses are the following:
• Providing data sets for the development of indicators of environmental impact. Usage dataare critical for the development of environmental indicators, e.g. environmental pressure indicators,indicators to monitor the integration of environmental concerns into agricultural policy, indicators forsustainable development, and the OECD’s pesticide risk reduction project. Data sets over time arerequired in order to monitor the effects that policy changes may have on the impact of pesticide useon the environment.
• Providing data sets for research studies. Once the collection of a regular set of usage statisticshas been established, changes over time in use on particular crops, or of particular pesticides, canbe monitored. These changes may result from several factors such as:
Climatic conditions: annual differences in the weather, influencing the range of pest, diseaseand weed problems requiring control, or affecting the ability of the farmer to apply the pesticideunder suitable conditions.
Innovation factors: the introduction of new molecules which may replace older, less activepesticides, and may additionally be applied at much lower rates per hectare.
Economic factors: changes in the price of, or support level to, crops, thereby altering marginsand making the use of pesticides more or less economic.
The data presented in this publication do not give a comprehensive overview of the total use of pesticides, giventhat some pesticides commonly used in agriculture such as molluscicides (slug killers), nematicides (nematodekillers), growth regulators and treatments of crops after harvest are excluded. Nor does it include the range ofbiocides or veterinary medicines (for example, sheep dips) used in agriculture. It can nevertheless be used forsome of the above-mentioned purposes.

Introduction by ECPA
A Pflanzenschutz / Plant protection / Protection des cultures 57
INTRODUCTION BY ECPA
Ever since man settled down and began crop husbandry, his main concerns were to improve the output andquality of his produce and to defend his crops against pests, diseases and abiotic environmental threats. It isdifficult for our western society to conceive that throughout history, famine and starvation were commonplace. Inmany parts of Europe, farmers struggled to produce enough food even to sustain their own families. What littlethe poor soils yielded after pests, diseases and weeds took their share was additionally threatened by pests anddiseases which attacked the stored harvest. The ratio of input to output is characterised by a saying of the NorthAmerican Indians, dependent on maize as a staple crop, who put seven kernels of corn into one planting pit :“Two for fox, two for crow, two to rot, and one to grow“.
While weeds could more or less successfully be kept at bay physically by constant weeding and hoeing, attacksof pests and diseases, which often followed in the wake of unfavourable climatic conditions, were more difficultto control. This situation prevailed until the beginning of this century. Only after science had identified the agentsof pest and diseases and the circumstances of their incidence, could means of defence be developed.Pesticides were first developed in the late nineteenth century, and for several decades it was confined mainly toinorganic compounds. The discovery of the fungitoxic action of copper sulphate/lime was a major breakthroughin the protection of grapes against downy mildew, leading to the development of the so-called Bordeaux mixturein 1882, which is still in use today. This was soon followed by a range of heavy metal and sulphur-basedfungicides. The first widely used insecticide was arsenic which, in the form of Paris Green, was used to fight anepidemic of Colorado beetle in the USA. Further milestones in man‘s quest for defences against nature‘suncertainties were the discovery of the insecticidal action of DDT during the Second World War, employedinitially for sanitary and hygienic purposes, and the development of herbicides based on broadleaf weeds‘ owngrowth hormones, auxins. This made it possible to selectively eliminate dicotyledoneous weeds in cereals in theearly fifties (2,4-D / “U46“ - BASF).
Objectives of crop protection
During their evolution, some wild species develop sophisticated defence mechanisms against pest and diseaseattack or can recover from early infestations. Mature tissue is often indigestible to chewing or sucking pestsbecause of tannins and other toxins which the plant has developed to defend itself. That is why insects oftenattack their host plants in the early developing stage of new growth when the cells have little or no toxins andare most nutritious because of their high content of carbohydrates or proteins. Fungal and bacterial diseasesfrequently attack plants growing under adverse conditions or which are otherwise weakened or injured. Theseorganisms have an important role in nature in breaking down dead or dying organic matter, recycling the energyand minerals it contains. Fruits, when ripening, develop increased contents of sugar and aromatic ingredients tomake them attractive to those organisms which help nature to break up the protective outer tissue, thusliberating the seeds to enable their distribution. Quite understandably, the fruit grower aims to prevent thisnatural disintegration of his crop.
The natural environment is characterised by the battle for survival, which is common to all species, mainly dueto the scarcity of food. The food crops cultivated by man have been selected and bred for their low toxicity, highnutrition and tasty ingredients. These plants represent an irresistible source of nourishment for all kinds of wildlife. The key feature which differentiates man from other species is that he has learned to develop means todefend himself and his food and fibre sources from attack by pests and diseases.
The most important factors in the use of plant protection products (PPP) are:
- to ensure produce of marketable quality, by reducing the damage caused by pests and disease;
- to reduce labour costs, by removing the need for labour-consuming hand weeding;
- to facilitate mechanical harvesting, by reducing the contamination of the crop by weeds;
- to prevent yield losses from pest and disease attack or weed competition.

2
METHODOLOGY AND METADATA

Methodology and Metadata
A Pflanzenschutz / Plant protection / Protection des cultures 61
2.1 Data sources and scope of this survey
This study has been developed using data on the use of plant protection products (PPP) supplied by themember companies of ECPA, the European Crop Protection Association. Together, these ten companies coverabout 90% of the European market for plant protection products. This ensures that the data displayed arereliable and represent more or less the current situation in the crop protection sector in the European Union andits Member States.
Countries covered were Belgium and Luxembourg, Denmark, Germany, Greece, Spain, France, Ireland),Italy,Netherlands, Austria, Portugal, Finland, Sweden , and the United Kingdom . While the data from the Westand South European countries is fairly comprehensive, information for the Nordic countries, specifically Swedenand Finland, is inconclusive due to the marginal relevance of these countries to the ECPA member companies.Two contributing companies did not specify individual countries in their sales history, but recorded volumes for"Northern Region" only.
The crops covered by this survey were identified as the key crops accountable for the majority of the significantPPP applications in the EU. As far as possible, identified crops were covered in detail. Where a breakdown ofPPP use for individual crops was not possible or feasible, crop groups, e.g. “cereals“ or “tree fruit“, werereported without further specification. Additionally, crops were classified as “arable“ (beets, cereals, maize,potatoes, oilseeds) and “speciality“ (citrus, pomaceous and stone fruits, vineyards). Vegetables are included in“speciality crops” where these groupings are mentioned.
PPP active ingredients (AI) are listed according to their common names11 as defined in the manual of the BritishCrop Protection Council (BCPC). Grouping of AI also followed the BCPC classification as far as possible. Theproduct groups covered were the main constituents of the crop protection portfolio, i.e. fungicides, herbicidesand insecticides. Fungicides generally do not include seed treatments; insecticides include acaricides. Otheractive ingredient groups used in agriculture such as molluscicides, nematicides and growth regulators are notcovered.
Industry reports show that around 300 thousand tonnes of active ingredients are used annually in the EU. Thispublication reports on the use of some 250 thousand tonnes of these active ingredients in 1996, thus coveringmore than 80 % of the total PPP market. Although not all segments of crop protection in the EU could becovered, the data presented is considered to be fairly representative of the total market.
2.2 Methodology
The data contained in the reference database for this report were supplied by the market research departmentsor agricultural branches of the ten full member companies of ECPA: AgrEvo, BASF, Bayer, Cyanamid, DowAgrosciences, Du Pont de Nemours, Monsanto, Novartis, Rhone Poulenc, and Zeneca. The source of the datawas, in general, syndicated market research panels, e.g. annual farmer surveys carried out with a fairly constanttarget group. Data obtained from this representative user group were calculated on a country basis usingcommon statistical methods. The surveys did not cover all crops and minor uses, but the staff of the companiesgenerally completed and corrected the corresponding raw data as appropriate. Whenever important activeingredients were marketed in substantial amounts by distributors other than the ten mentioned (commodities),the original manufacturer of the compound estimated the full amount used in the market, apart from his ownsales, to give a representative view of the total volume (e.g. Atrazine, Isoproturon, Sulphur). Active ingredientvolumes were extracted from commercially formulated products according to their AI content in % (w/w) or g/l(w/v). Original product trade names or companies' names were deleted in the final database.
11 Common names of PPP are underlined in this text while the chemical classes to which they belong are in bold character.
Methodology and Metadata
62 Pflanzenschutz / Plant protection / Protection des cultures A
When comparing figures from the ECPA / Eurostat database with data from national industry associations, onemust be aware that active ingredient volumes reported by the national organisations comprise all uses andchemical classes of crop protection products as calendar year sales. Some chemicals may represent substantialvolumes, e.g. soil sterilants or nematicides, which are not included in this survey.
Large differences may also result between this study and Industry Association data in countries with substantialPPP use on minor crops not covered by this study.
The same is true for some crops. While data for sugar beets, maize, potatoes, citrus and vineyards aregenerally allocated directly to the target crops due to their crop-specific action, some compounds with broad usespectrums, where the final target crop was not identifiable, were reported for groups of crops only: cereals, fruitsand vines, oilseeds, and vegetables containing any of the specified crops in varying ratios. Therefore forcomparisons of use, the crop group level is the more reliable data basis. Wherever possible, PPP use wasallocated pro rata to individual crops (wheat and barley; fruit trees and vineyards) according to suggestions bythe company reporting (Table 1).
Among the EU Member States, only the Netherlands, Sweden and the United Kingdom conduct specificsurveys on the usage of pesticide in agriculture. In the Eurostat publication ‘Pesticide Use in the EU’ 12 results ofthe surveys in these three Member States were presented. Again, care needs to be taken when comparing datafrom these surveys and the data provided by the ECPA, as the scope and coverage of the surveys varies. Onemajor difference is the exclusion of molluscicides, soil sterilants, nematicides and growth regulators in theECPA, whereas these types of pesticides are included in the national usage surveys.
In general, the figures in this report represent crop year / harvest year real use while calendar year sales dataoften also contain inventory in the distribution chain, which was not actually consumed in a specific crop year.
12 Statistics in Focus, Environment, 1998/3.

Methodology and Metadata
A Pflanzenschutz / Plant protection / Protection des cultures 63
Table 1 : Breakdown of crops 13
Crop Type Crop group Crops specified Associated Crops
Wheat *Winter wheat, spring wheat, hard (durum) wheat
Barley * Winter barley, spring barley
Cereals (n.s.)
Sugar beets *
Fodder beets
Grain corn / maize
Green (silage) corn / maize
Rape Winter rape, spring rape
Sunflower seeds
Potatoes * Potatoes Ware and seed potatoes
Citrus * Citrus All types
Vineyards * Grapes
Pome fruit Apples, pears: dessert types only *
Stone fruit *Cherries, plums, apricots, nectarines, peaches etc. Only commercial fruit trees / orchards
Orchards
Fruits (n.s.)
BrassicasCabbages, cauliflower, Brussels sprouts, turnip rape etc.
CurcurbitsCucumbers, melons, squash, gherkins, zucchini etc.
Peas and beans (Pulses)Peas and beans for fresh or canned consumption
Tomatoes
Vegetables (n.s.)
Tree fruits
Vegetables *
n.s.: not specified
Speciality
Arable
Cereals
Sugar beets
Maize *
Oilseeds *
13 Crops marked with “*” are those used in the calculation of crop areas and application rates. For example, the crop areas and applicationrates given for cereals includes only wheat and barley.
Source: Eurostat.

Methodology and Metadata
64 Pflanzenschutz / Plant protection / Protection des cultures A
2.3 Description of PPP groups
Although many different types of chemical compounds are used in agricultural production, e.g. rodenticides,molluscicides, nematicides, soil and storage sterilants, this study concentrates on the three crop protectionproduct groups which comprise the main components of a farmer’s plant protection strategy: herbicides,fungicides and insecticides. Also not included in this study are uses of these agents for non-agricultural sectors,e.g. public hygiene.
A total of 491 AI common names are listed in the data file. Of these common names listed, 26 % are fungicides,40 % are herbicides and 34 % are insecticides/acaricides.
2.3.1 Herbicides
Herbicides are used to control undesirable or noxious plant growth, generally called weeds, in areas dedicatedto crop production or in non-crop areas where plant growth is unwanted. Besides keeping competing vegetationat bay in cultivated crops, weed control is necessary to enable or facilitate mechanical harvesting. Also,contamination of harvested seed and grain crops with weed seeds is of concern for the grain trade and theprocessing industry - for example the flour producers - and contaminated harvests result in substantial cuts innet profits for the farmer.
Herbicides can be either selective or non-selective in their action. Selective herbicides can be applied before theemergence of the weeds or crop or post-emergence. They are generally applied once to a crop in its earlydevelopment stage, where the most damage can be done by weeds as they compete for water, nutrients andlight. The mode of action of these herbicides is either by uptake through the roots (residual action) or throughthe leaves (foliar action) of the target weeds. Generally, selective herbicides are classified by the type of targetweeds: broadleaf herbicides, grassy weed killers (graminicides) or broad spectrum herbicides, which controlgrassy weeds and broadleaf weeds in selected crops. Selective herbicides are most frequently used in arablecrops, e.g. cereals, sugar beets, potatoes, maize, etc. Selective herbicides are becoming more and moresophisticated. While classical herbicides were active at dosage rates of around 0,5 to 1 kg of active ingredientper ha or more (TCA, for example, controlled couch grass at dosages as high as 60 kg/ha), novel products likesulfonylureas are applied at rates as low as 10 to 25 g/ha. All herbicides are usually broken down ormetabolised at the end of the cropping period without leaving detectable residues. Even after years of intensiveuse on selected areas, there is no record of herbicide accumulation in the soil, which might pose a hazard forsubsequent crops.
Non-selective herbicides do not differentiate between crops and weeds in their action and are most frequentlyused for total vegetation control (T.V.C.) in established crops, e.g. vineyards, orchards or around the farm tokeep utility areas free of unwanted plant growth. T.V.C. herbicides can also have residual and/or foliar action.Foliar T.V.C. herbicides are also used to control weed growth in set-aside areas during the idle period or toclean up the fields before they are put back into production. Another important area of use is to desiccate cropfoliage of crops to facilitate mechanical harvesting or to kill couch grass (Agropyron repens) in the stubble afterharvesting cereals.
2.3.2 Fungicides
Fungicides are compounds used to protect crops from diseases caused by fungal pathogens. Fungal diseasesthreaten crops from the germination phase to harvest and also cause substantial damage to the harvest instorage. Phytopathogenic fungi are ubiquitous and are generally dispersed through the air as spores. When thespores land on the plant surface, they germinate when conditions (temperature, moisture) are favourable,depending on the species of fungus. Once the germinated spores have penetrated the plant epidermis and thefungus mycelium has spread in the plant tissue, it cannot be controlled by classical fungicides. Fungal diseasesgenerally can be controlled only by prophylactic action to prevent germinating spores penetrating the planttissue. Therefore, classical fungicides are applied frequently to maintain a protective layer of active ingredient,especially during the phase of rapid crop growth and under heavy rainfall conditions. Negligence in the control

Methodology and Metadata
A Pflanzenschutz / Plant protection / Protection des cultures 65
of fungal diseases can sometimes destroy the complete harvest for a year. Therefore, under intensive croppingsystems, monitoring environmental conditions for disease incidence to determine the optimal timing forfungicide applications is indispensable. Modern fungicides frequently also have curative action, as they aresystemic, i.e. they are able to penetrate the plant tissue and attack the mycelium in the plant cells.
This curative action, however, is only limited to a brief period after the infection has occurred and can not berelied on as a standard measure. Classical protective fungicides still form the backbone of fungal diseasecontrol.
2.3.3 Insecticides
Unlike fungicides, insecticides, the classical “pesticides“, are applied only when the pest incidence is manifest.They are only applied as protective measure against attack from soil insects when incorporated into a seeddressing. Insecticides can act via contact, inhalation or ingestion on the target pest. Monitoring environmentalconditions for pest incidence is indispensable in integrated cropping systems.
Lately, biological means of pest control have also been developed, i.e. utilisation of specific insecticidalpathogens such as Bacillus thuringiensis toxin or pest-specific virus toxins for the control of mainly lepidopteralarvae. Predator insects are also propagated as means of biological pest control. Pheromone traps arefrequently used to monitor insect mating periods to determine the optimal timing for defence measures againstemerging larvae, before they have penetrated the host tissue where they are uncontrollable by commoninsecticides. Biological control measures generally are highly sophisticated and call for exact and continuousmonitoring of pest incidences. Furthermore, biological insecticidal agents often call for more rather than lessapplications as they are usually broken down very fast after application. The main target for insecticides in theEuropean Union are aphids, which cause damage to crops not only through their sucking action on tendertissue, but also because they are frequently vectors for virus diseases, and larvae of moths (lepidoptera). Aspecific segment in pest control is represented by acaricides used against spider mites which frequently causesevere damage to the foliage of perennial crops, e.g. citrus, orchard trees and vines.

3
MAIN RESULTS AND COMMENTSAT EUROPEAN UNION LEVEL

Main results and comments at European Union level
A Pflanzenschutz / Plant protection / Protection des cultures 69
Tables of reference: Page
EU-1.1 – 1.8: Volume of PPP use by Member State ...................................................................................................................................129
EU-2.1 – 2.6: Volume of PPP use by crop group ........................................................................................................................................133
EU-3.1 – 3.2: Crop area by Member State and by crop group.....................................................................................................................135
EU-4.1 – 4.5: Dosage of PPP use by Member State and by crop group......................................................................................................136
3.1 Evolution and situation of PPP consumption
In those EU Member States for which data for 1992-1996 were available, volumes of crop protection activeingredients used have increased 8 % from 231 524 tonnes in 1992 to 249 646 tonnes in 1996, after a decline of4 % from 1993 to 199414. When comparing the AI portfolio of 1992 to that of 1996, 16 substances which werenot mentioned in 1992 are listed in 1996 and 10 substances which are not mentioned in 1996 were listed in1992.
The crop protection market in the EU is a mature market, where agriculture has a relevant proportion. Changesin the level of PPP use are mostly attributable to varying pest and disease incidence, frequently influenced byweather conditions.
In the wake of the 1992 CAP reform, considerations about cost savings and profitability were dominant factorsinfluencing the intensity of treatment measures and the selection of PPP brands or commodity products. Afterinitial insecurity about the implications and impact of the reform, leading to lower farm gate prices for mostagricultural commodities, PPP consumption has now risen to above the 1992 level.
This decline from 1993 to 1994 occurred mainly in France and Germany – the main cereal and oilseed rapegrowing countries – resulting from the CAP reform and the insecurity of farmers about the effects of the newregulations on crop areas and market prices for their harvested crops. The main targets for the reforms werecereals and protein crops. Sparing use of crop protection products, primarily fungicides and herbicides, ensued,and dosage rates were frequently reduced to the limit of effectiveness to cut costs.
This situation returned more or less back to "normal" in 1996. Farm holders had to face lower farm gate pricesper tonne of harvested product. To maintain and improve their level of income, they aimed at achieving aneconomic optimum by estimating the cost-benefit ratio in each of their activities, for example by applying PPP totheir crops only when necessary. On the other hand, use of PPP can be seen as a way to safeguard investedlabour and capital expenditures against losses in the crop production process. In certain instances, PPP couldbe applied even when the yield is not increased to warrant the treatment cost: that is the case when the qualityof the harvested crop, for example brewing barley, has to meet the set standards of traders and the processingindustry or when the spread of virus diseases (vector control) in seed, for example potato production, has to beprevented.
PPP use reduction programs implemented in the Scandinavian countries and in The Netherlands have mainlyaffected the use of nematicides or soil sterilants in horticultural or speciality crops, which are not covered in thissurvey. Consequently, the effects of these programs are not visible in the key crops accounting for the main useof PPP–AI.
Real growth of PPP–AI use has only occurred in the Member States developing from lower farming standards(P, EL), presumably because crop production became more profitable for these countries.
In arable farming there is a clear trend towards active ingredients which are effective at lower dosage rates thanformer standard products. However, reducing the use of herbicides or fungicides in the major agricultural crops,e.g. cereals, maize or sugar beets, would only have a marginal effect on the total volume used, which is still
14 When discussing PPP hazards, however, it must be borne in mind that crop protection products can not be judged by the volume used asthe main criterion only. Toxicity and persistence in the soil are important factors also.

Main results and comments at European Union level
70 Pflanzenschutz / Plant protection / Protection des cultures A
dominated by sulphur and copper (38 % in 1992 and 41 % in 1996 of all AI used), key active ingredients fordisease control in vineyards, orchards, and on farms dedicated to organic farming practices.
As long as sulphur and copper are key products in integrated crop protection, the total volume of AI used willnot decrease significantly in the European Union.
Herbicides use was most affected by the uncertainty among farmers of the impact of the CAP reform on profits.Nevertheless after an 8% decline over the years 1992 and 1993, the herbicide AI volume constantly increaseduntil 1996. Fungicides and insecticides use were less affected (see Figure 1), as the bulk of these products isused on speciality crops not subject to the CAP regulations. Moreover, neglecting the defence against pestsand diseases has a direct impact on the quality and marketability of fruits and vegetables.
Figure 1: Trend in PPP consumption, for the EU, 1992 to 1996
134140 148 146 149
8683
7476 70
16 17 19 1519
0
50
100
150
200
250
1992 1993 1994 1995 1996
Fungicides Herbicides InsecticidesSource: Eurostat.
(in 1 000 t of AI)
Fungicides represent the largest segment: 60 % of the total AI volume in the EU. This is due to their frequentuse in sequential spray programmes in speciality crops and the dominating position of sulphur which is appliedat high dosages. 69 % of the fungicide volume is used in vineyards, followed by cereals (10 %) and tree fruits(8 %). Potatoes and vegetables account for 5 and 4 % of the fungicide volume respectively.
The herbicide market is dominated by cereals and maize, accounting for 36 and 29 % respectively of thevolume. The proportions of vineyards, sugar beets, and oilseeds are respectively 12, 7 and 6%.
As far as insecticide use is concerned, tree fruits, vineyards and citrus represent 33, 18 and 14 % respectivelyof the total AI volume. Insecticides are also used to prevent damage mainly by aphids and caterpillars tovegetables (10 %). Maize (7 %) has to be protected mainly against the corn borer caterpillar, especially incountries with a warmer climate. In general, insecticides play only a minor role in terms of AI volume,representing 6 % of the total (Figure 2).

Main results and comments at European Union level
A Pflanzenschutz / Plant protection / Protection des cultures 71
Figure 2: Composition of PPP, by volume, for the EU, in 1996
Insecticides6%
Herbicides34%
Fungicides60%
Source: Eurostat.
3.2 Breakdown of PPP consumption by Member State
Of the total AI volume applied in the EU-15, in 1996, 81 % is used by four Member States: France, Italy,Germany, and Spain. France led by far in the use of PPP–AI (37 %). France and Italy alone accounted for 59 %of the total volume of the European Union (Table 2).
While crop areas decreased 7,0 % over the period 1992-94, they increased by 3,4 % over the period 1994-96.
The average use rates of PPP–AI have stabilised at 4,8 kg AI/ha in all crops. The highest use rates per haoccured in Member States with important fruit trees and vineyards sectors: Italy (9,3 kg AI/ha) and Portugal (8,4kg AI/ha). This is due to the sequential application of fungicides and the dominant position of sulphur. Thelowest use rates occured in Member States which grow mainly arable crops.
France, Italy and Spain accounted for 76 % of total fungicide AI utilised. The dominating crop in fungicide use isgrapes (69 % of total fungicide AI). Again, sulphur accounted for the bulk of all fungicide applications in this crop(59 %).
France led in the ranking of herbicide consumption among Member States, accounting for 35 % of all herbicidalagents. Cereals and maize are the crops which dominate herbicide consumption, with 36 and 29 %respectively.
The insecticide market is led by Italy (39 %), Spain (24 %) and France (23 %). The remaining twelve MemberStates each have 3 % or less individual market share.

Main results and comments at European Union level
72 Pflanzenschutz / Plant protection / Protection des cultures A
Table 2: Breakdown of PPP consumption by Member States in 1996 (in 1 000 t of AI)
EU-15 148.9 86.0 14.7 249.6 100.0
B/L 1.3 1.8 0.2 3.3 1.3
DK 1 1.3 1.9 0.1 3.3 1.3
D 8.4 18.3 0.4 27.1 10.8
EL 8.7 1.1 0.5 10.4 4.2
E 16.4 6.8 3.5 26.7 10.7
F 53.2 34.6 3.4 91.2 36.5
IRL 0.2 0.3 0.0 0.5 0.2
I 44.1 7.3 5.8 57.2 22.9
NL 2.1 1.9 0.3 4.3 1.7
A 1.2 1.1 0.0 2.3 0.9
P 7.3 2.5 0.2 10.1 4.0
FIN 1 0.0 0.5 0.0 0.5 0.2
S 1 0.3 0.7 0.0 0.9 0.4
UK 4.3 7.4 0.3 11.9 4.8
Source: Eurostat.
%
(1) The "Northern Region" for which the volume of PPP amounts to 543 tonnes in 1996, has been reallocated as 69 % for DK, 11 % for FIN and 20 % for S.
Fungicides Herbicides Insecticides TOTAL
3.3 Target crops for PPP
The majority, i.e. 60% of all PPP use by AI volume, is used in established speciality crops. 46 % of the total AIvolume used in the EU goes into vineyards, which cover 3,6 millions ha (7 % of the reference crop area).Although the base area treated in speciality crops (6,3 millions ha, 12 % of the reference crop area) isconsiderably smaller than that of arable crops (45,2 millions ha, 88 % of the reference crop area), thesespeciality crops, mainly vineyards, are still the major market for the high dosage rate compounds such assulphur and copper. Moreover, treatments have to be repeated regularly to avoid pest or disease. For example,for scab control in dessert apples grown in susceptible locations with high humidity, up to 25 applications offungicide may be necessary over the growing season.
Arable crops do not require this level of attention, as the harvested crop is either used as animal feed on thefarm or processed by the industry. Cereals – wheat and barley specifically – cover 55 % of the crop area andaccount for 19 % of the AI volume used. As cereals are the key market target for innovative AI, effective at lowdosage rates (e.g. sulfonyl urea herbicides), the total volume of AI has declined by 6,9 % over the period 1992-96. The total volume of AI is expected to remain more or less at this level over the next years. Maize – third interms of AI volume used (10 %) – is predominantly a herbicide market. Fungicides are used only ascomponents in seed treatments. All other crops account for 24 % of the AI volume (Figure 3).
Fungicide applications are predominant in speciality crops (82 % of the fungicide volume). Grape productionrequires the highest proportion of fungicides (69 % of the fungicide volume) because the vines must beprotected against fungal diseases throughout the growing season. The most critical diseases are downy mildew(Peronospora sp.), powdery mildew (Oidium tuckerii) and grey mould (Botrytis cinerea). Sulphur, applied asspray solution or dry dust, not only protects the vines against powdery mildew, but also has an acaricidal effectagainst spider mites. For tree fruits (8 % of the fungicide volume), emphasis is placed primarily on the control ofapple scab (Venturia inaequalis) because fruits with scab spots cannot be marketed as dessert apples, but canonly be sold for a cheaper price as bulk to the processing industry.

Main results and comments at European Union level
A Pflanzenschutz / Plant protection / Protection des cultures 73
Herbicides dominate in arable crops, representing 69 % of the total AI volume (Figure 4). The main concern inarable crops is weed control, as weeds compete with crops for water, nutrients, etc. In recent years, cerealfarmers have paid more attention to fungal disease control, because grain infested by fungi and used for animalfeed, may contain hazardous levels of aflatoxins. Aflatoxins are highly toxic and carcinogenic substances andcan induce abortions, e.g. in carrying sows.
Insecticides play only a minor role as far as PPP volumes are concerned. The proportions of insecticides inarable and vegetable crops are respectively 4 and 7 % of all applied chemical agents. The primary targets forinsecticides in fruits and vines are the larvae of various lepidoptera (moths), aphids and scales (Figure 5).
Figure 3: Trend in total PPP use, by crop typefor the EU, 1992 to 1996
0
40
80
120
160
1992 1993 1994 1995 1996
Arable crops Specialty cropsSource: Eurostat.
(in 1 000 t of AI)
Figure 4: PPP use, by arable crop group, EU in 1996
0.0
10.0
20.0
30.0
40.0
50.0
Cereals Sugar beets Maize Oilseeds Potatoes
Fungicides InsecticidesHerbicidesSource: Eurostat.
(in 1 000 t of AI)

Main results and comments at European Union level
74 Pflanzenschutz / Plant protection / Protection des cultures A
Figure 5: PPP use, by speciality crop group, EU in 1996
0.0
20.0
40.0
60.0
80.0
100.0
120.0
Citrus Grapes Tree fruits Vegetables
Fungicides InsecticidesHerbicidesSource: Eurostat.
(in 1 000 t of AI)
3.4 Chemical classes of PPP
Classical substances such as sulphur and copper account for 41 % of all AI volumes. It has already beenmentioned that sulphur and copper are used in repeated applications, mainly in fruits and vines. Moreover, theapplication rates for these substances far exceed those of modern products. For the control of powdery mildew,for example, rates of over 5 kg AI/ha are common for sulphur, 3 kg AI/ha are common for copper for downymildew control. Organic contact fungicides are applied at 1 - 2 kg AI/ha, systemic fungicides, e.g. carbendazim,are active at 0,1 - O,25 kg AI/ha.
Ureas play a major role in cereal weed control. Isoproturon is the most frequently used urea herbicide; it isactive against annual grasses and also broadleaf weeds. Triazine herbicides are used for annual and perennialweed control, mostly in fruit orchards and vineyards and for weed control in maize (Atrazine).Chloroacetanilides (Alachlor, Metolachlor, etc.) are frequently used for selective weed control in rape andmaize.
For the control of insect pests, organophosphates are still frequently used because of their cheap price(Parathion) and broad spectrum of activity. They are also rapidly decomposed in the environment. Their positionhas been challenged in recent decades by novel synthetic pyrethroid insecticides which, in contrast to thefrequently toxic organophosphates, have a very low mammalian toxicity and thus are classified as non-hazardous, especially for the applicator. Because of their low dosage rates, pyrethroids do not appear amongthe leading chemical classes by volume.
A comprehensive list of chemical classes and associated active ingredient common names is included inannexes A and B.

Main results and comments at European Union level
A Pflanzenschutz / Plant protection / Protection des cultures 75
Table 3: Chemical classes representing more than 80 % of all Al volume, for the EU in 1996
Groupe chimique
1 Inorganic sulphur 90.1 36.12 Triazine 18.3 7.33 Dithiocarbamate 15.5 6.24 Urea 12.8 5.15 Inorganic copper 11.1 4.46 Amino-phosphoric acid 10.4 4.27 Azole 9.0 3.68 Chloroacetanilide 7.8 3.19 Morpholine 5.4 2.2
10 Phenoxycarbonic acid 5.4 2.111 Organophosphate 4.9 2.012 Phthalic acid 4.4 1.813 Dinitroaniline 3.6 1.414 Triazinone 3.3 1.3
Total 202.0 80.9
Al volume (in 1 000 t)
Share of Al volume (%)
Table 4: Top ten AI, by volume, for the EU in 1996 (alphabetic order)
Active ingredient Chemical class Action
Atrazine Triazine H 3.0Copper Inorganic copper F 4.4Fenpropimorph Morpholine F 1.3Glyphosate Amino-phosphoric acid H 3.4Isoproturon Urea H 2.1Mancozeb Dithiocarbamate F 3.8Metolachlor Chloroacetanilide H 2.4Pendimethalin Dinitroaniline H 1.3Sulphur Inorganic sulphur F, I 36.1Terbuthylazine Triazine H :
Total :
F = Fungicide; H = Herbicide; I = Insecticide
Share of AI volume (%)
Table 5: Top ten fungicide chemical classes, by volume, for the EU in 1996
Chemical classof fungicides
1 Inorganic - sulphur 87.4 58.72 Dithiocarbamate 15.5 10.43 Inorganic - copper 11.1 7.44 Azole 9.0 6.15 Morpholine 5.4 3.76 Phthalic acid 4.4 2.97 Ethylphosphate 3.1 2.18 Urea 2.7 1.89 Acylalanine 2.1 1.4
10 Benzimidazole 1.7 1.1
Total 142.5 95.7
Share of fungicideAI volume (%)
AI volume(in 1 000 t)
Source: Eurostat.

Main results and comments at European Union level
76 Pflanzenschutz / Plant protection / Protection des cultures A
Table 6: Top ten fungicide AI, by volume, for the EU in 1996 (alphabetic order)
Common name of fungicides Chemical class
Copper Inorganic copper 7.4Cymoxanil Urea :Fenpropimorph Morpholine 2.2Folpet Phthalic Acid 1.7Fosetyl Ethylphosphate 2.1Mancozeb Dithiocarbamate 6.4Metalaxyl Acylalanine :Metiram Dithiocarbamate 1.3Propiconazole Azole 1.5Sulphur Inorganic sulphur 58.7
Total :
Share of fungicideAI volume (%)
Table 7: Top ten herbicide chemical classes, by volume, for the EU in 1996
Chemical classof herbicides
1 Triazine 18.0 21.02 Amino-phosphoric acid 10.4 12.13 Urea 10.0 11.64 Chloro-acetanilides 7.8 9.15 Phenoxycarbonic acid 5.4 6.26 Dinitro-aniline 3.6 4.27 Triazinone 3.3 3.88 Thiocarbamate 3.3 3.89 Diazine 2.5 2.9
10 Hydroxybenzonitril 2.2 2.6
Total 66.5 77.3
Share (%)AI volume(in 1 000 t)
Table 8: Top ten herbicide AI, by volume, for the EU in 1996 (alphabetic order)
Common name of fungicides Chemical class
Atrazine Triazine 8.6Chlorotoluron Urea 3.1Glyphosate Amino-phosphoric acids 10.0Isoproturon Urea 6.0Metamitron Triazinone 3.5Metolachlor Chloro-acetanilide 6.9Pendimethalin Dinitro-aniline 3.7Pyridate Diazine 2.9Simazine Triazine 2.4Terbuthylazine Triazine :
Total :
Share (%)
Source: Eurostat.

Main results and comments at European Union level
A Pflanzenschutz / Plant protection / Protection des cultures 77
Table 9: Top ten insecticide chemical classes, by volume, for the EU in 1996
Chemical classof insecticides
1 Organophosphate 4.8 32.62 Oil. mineral : :3 Inorganic-sulphur 2.6 17.94 Carbamate 1.4 9.45 Pyrethroid 0.7 4.56 Oxime-carbamates 0.4 2.77 Cyclodiene organochlorine 0.3 2.28 Biological 0.1 1.09 Benzoylurea 0.1 0.9
10 Benzilate 0.1 0.9
Total : :
AI volume(in 1 000 t)
Share (%)
Table 10: Top ten insecticide AI, by volume, for the EU in 1996 (alphabetic order)
Common name of insecticides Chemical class
Chlorpyrifos Morpholine 3.0Diazinon Morpholine :Dimethoate Morpholine 2.2Endosulfan Cyclodiene organochlorine 2.2Furathiocarb Carbamate :Imidacloprid Organic 2.1Methidathion Organophosphate :Mineral oil Oil. mineral :Parathion Organophosphate 2.8Sulphur Inorganic - sulphur 17.9
Total 64.4
Share (%)
Source: Eurostat.

4
COMMENTS AT MEMBER STATE LEVEL
Comments at Member State level
A Pflanzenschutz / Plant protection / Protection des cultures 81
Belgium / Luxembourg
The total area of arable land and permanent crops in Belgium was 790 thousands15 ha. The crops reported inthe PPP survey represent approximately 91 % (721 thousand ha) of this total crop area. Since 1992 the areaplanted with cereals has decreased by 8 %, while the area planted with maize has increased by 25 %.
Of the total AI volume used in 1996, 39 % were fungicides, 55 % herbicides and only 5 % insecticides. Exceptfor seasonal variations due to changing pest and disease incidence, this ratio was fairly constant.
The total use of PPP-AI on cultivated land in Belgium is approximately 4,6 kg/ha. Major target crops for highvolume PPP applications are tree fruits (22,8 kg AI/ha ) and potatoes (12,1 kg AI/ha ). Control of potato blight(Phytophthora sp.) and apple scab (Venturia sp. ) is the main concern of growers of these crops.
Cereals remain at the top of the target crops as far as total AI volume is concerned: their proportion of the totalvolume is 35 %, followed by potatoes with 23 %. Overall, the use of PPP-AI varied over the period 1992-1996by 8,5 %. It is notable that atrazine still accounts for 44 % of herbicide volumes to protect maize.
Prosulfocarb, used to treat cereals and potatoes, is the major herbicide AI in terms of volume. For sugar beets,metamitron and chloridazone are the most frequently used herbicides. Mancozeb clearly dominates the marketfor potato fungicides.
Danmark
The crop areas covered in this survey account for 73 % of the total area dedicated to arable and permanentcrops. Other relevant crops in Denmark not included in this survey are mainly permanent and temporarygrassland. Also, horticultural crops, which play an important role in Denmark, are not considered in the contextof this study.
In total, the volume of PPP-AI used in Denmark decreased by 7,1 % over the period 1992-1996. Fungicide(41 %) and herbicide (57 %) volumes are fairly constant in their relationship over the report period. Insecticidesgenerally rank below 2 % in terms of AI volume. When looking at the total AI volume reported for Denmark, itshould be noted that some of the companies did not separate their figures by Member State for the Northernregion. If 69 % of the total AI volume for Northern regions is attributed to Denmark, the total AI volume forDenmark would increase approximately from 3 279 to 3 654 tonnes.
Because of the minor importance of speciality crops in the use of PPP-Al in this survey, the average use ofPPP-Al is rather low at only 2,1kg/ha.
Cereals dominate the arable area (84 % of the total area) and the PPP-Al volume (72 % of the global volume).
Control of powdery mildew and grass weeds is the farmers’ main concern when using PPP.
Morpholine and azole fungicides for the control of cereal diseases have the biggest share of the Danish cropprotection market. Maneb was used for blight control in potatoes until 1995. Thereafter the company supplyingthe product replaced it with mancozeb. Because 1996 is the ranking reference year, maneb does not show up inthe list of leading potato fungicides.
15 NewCronos/Eurofarm – 1996 data.

Comments at Member State level
82 Pflanzenschutz / Plant protection / Protection des cultures A
Germany
The crop area development in Germany more or less depicts the area reduction scheme called for in the CAPreform: in 1996 cereal areas were down 4,1 %, and oilseeds, mainly rape, were down 15,8 % compared to1992. The crops covered in this report represent 70 % of the statistical crop area. Otherwise, no significantchanges in the total arable area are apparent.
The German PPP market is clearly dominated by herbicides in terms of volume. Their share was 68 % in 1996.Fungicides comprised 31 %, and insecticides, 1 %.
The use of PPP-AI per ha of arable or permanent crop is also stable at approximately 3,2 kg/ha over the reportperiod. Due to sequential applications of mainly fungicides, AI use is rather high in vineyards (27,3 kg/ha) andfruit trees (12,5 kg/ha). Variations in the volumes over the report period are attributable mainly to varyingdisease incidence due to climatic conditions.
Generally, herbicide use in vineyards has been reduced considerably. A remarkable increase of sulphur andcopper fungicide use (+ 161 %) is apparent, probably due to the promotion of organic crop production principles.
Following the CAP reform, the total volume of AI dipped to a low of 21 851 tonnes in 1994, mainly for cereals(10,2 % down between 1992 and 1994) and oilseeds (17,4 % down) as key target areas for the reform. Fromthen on, volumes have recovered and increased 11,1 % in 1996 compared to the total volume shown in 1992.
The PPP market in Germany is led by wheat, barley and maize (most of the maize is green maize for silage) interms of area treated (57 % for cereals and 20 % for maize) and total volume used (45 % for cereals and 22 %for maize).
The leading single active ingredients are isoproturon (IPU), a grass weed herbicide used in to protect cereals,terbuthylazine, pyridate and metolachlor herbicides for maize, metamitron for sugar beets and sulphur forvineyards.
Greece
The area of crops considered in this survey is only about 44 % of the statistical area reported for arable andpermanent crops in Greece. The remaining area, not covered by this survey, is permanent grassland, olives,fresh fruit other than dessert pome fruit and stone fruit, and a variety of minor crops. These minor crops, whileimportant for the local market, do not play a large role in the use of PPP. A total area of 1,7 million ha isregarded as the reference area in this study.
Fungicides represent the main share of the PPP market (84 % in 1996).
The national average dosage of PPP is 6,0 kg AI/ha, due to the dominance of grapes. Vineyards account for78 % of the total AI volume. For this crop, the average use of PPP-AI is 60,8 kg/ha, most of which is sulphur(94 %).
While wheat and barley are the largest single crops grown (1,0 million ha, 58 % of the total crop area), thesecrops are of only marginal importance as target crops for PPP (1 % of the total volume). The use of PPP forcereals, however, has increased by 149 % in the report period, probably due to the increased profitability ofcereal growing in Greece after the CAP reform.
Its use to treat sugar beets has also increased considerably (by 80 %), apparently because of frequentapplications of sulphur against powdery mildew.
Sulphur far outranks all other AI in terms of volume, representing 73 % of the total AI use in Greek agriculture.

Comments at Member State level
A Pflanzenschutz / Plant protection / Protection des cultures 83
Spain
The crops included in this survey cover 48 % of the area of arable and permanent crops in Spain. Crops notconsidered in this context are olives, rice, and dried pulses, which are of major importance in Spain, but not inthe majority of the EU Member States.
The Spanish PPP market is clearly dominated by fungicides. The proportion of total Al volume represented byfungicides varied between 61 % (1995 and 1996) and 71 % (1992 and 1993), mainly due to the large quantitiesof sulphur in use. The proportion of herbicides oscillated between 21 % (1992) and 26 % (1996) and theproportion of insecticides ranged from 8 % (1992) to 16 % (995).
The overall average intensity of PPP use over the report period was fairly constant from 2,5 to 2,7 kg AI/ha.Only 0,5 kg AI/ha are used in cereals. Vineyards receive up to 11,3 kg AI/ha.
While cereals account for 58 % of the crop area covered in this report, the total volume of PPP-AI used incereals is 10 %. The dominating crops for PPP use are grapes and citrus, accounting together for 61 % of thetotal PPP-AI volume. No significant changes in the volumes of overall PPP-AI used in Spain have occurred inthe report period. Looking at individual crops, herbicide use is up for maize and increased use of fungicides isapparent for potatoes and sugar beets.
Sulphur is the dominating single active ingredient used for Spanish crop protection. Its target is mainly powderymildew control and the control of red spider mites in vineyards, fruit trees and vegetables. Glyphosate is theleading herbicide used in vineyards. Considerable amounts of mineral oil have been used for the control ofscales and mites in citrus (25 % of all PPP for this crop).
France
France has the largest market share for PPP in the European Union. Its share of the total AI volume in the EU is37 %.
Of the total area of arable and permanent crops, this study covers 70 %. Wheat and barley cover 48 % of thereported area. Major crops not considered in this context are temporary and permanent grassland and perennialor temporary green fodder crops.
Fungicide use accounts for 58 % of all AI volumes, and herbicides for 38 %. Overall volumes of activeingredients were 13,5 % down in 1994 compared to 1992, mainly due to cost saving and rate-cutting strategiesafter the CAP reform: less fungicides were used due to low disease incidence in drought conditions, but havegone up again to top former levels.
Over the report period, the average use of PPP-AI per ha has remained more or less constant between 5,8 and6,9 kg/ha, primarily due to the dominating position of the wine and fruit growing business which necessitatessequential applications of fungicides. In vineyards the use of multiple fungicide applications for the control ofdowny mildew and Botrytis boost the per ha use rate up to 50,5 kg per growing season. Control of Fusariumand Phytophthora in potatoes, and scab and powdery mildew in tree fruits also require multiple applications offungicides over the growing season, resulting in elevated levels of AI per ha(13,9 kg/ha for potatoes and 36,0kg/ha for tree fruits).
Vineyards account for 51 % of all PPP-AI volumes used in France. The treatment of wheat, barley and maize(grain and green maize) represents 29 % of the total volume of PPP-AI used. The balance is made up of fruittrees (7 %), oilseeds (5 %), sugar beets, vegetables and potatoes (3 % each).

Comments at Member State level
84 Pflanzenschutz / Plant protection / Protection des cultures A
In vineyards, sulphur is the leading single active ingredient used., Glyphosate and isoproturon are theherbicides most frequently used for grass weed control in cereals. While isoproturon is selective to cereals,glyphosate is used generally either after harvest for the destruction of perennial Agropyron couch grass or forweed destruction on set-aside areas being taken back into cultivation. Atrazine still has a dominant position inmaize weed control.
Ireland
Of the 1,4 million ha of arable and permanent crops in Ireland, only 24 % are considered as reference crops inthis survey. The majority of crop areas in the statistics are temporary and permanent meadows and grazing,which are irrelevant for PPP use. No data is provided for PPP use on fruit trees in Ireland.
Herbicides and fungicides represent 54 % and 45 % respectively of the global AI volume.
The total national average use of PPP is 1,6 kg AI/ha. However, the dosage rate in potatoes seemsunderestimated (2,7 kg/ha), considering potato blight and the necessity of fungicide applications.
The key target crops for PPP are wheat and barley, accounting for 65 % of the total AI volume. The secondmain crop in terms of PPP volume is potatoes (mainly fungicides).
Propachlor is the leading herbicide for weed control in vegetables (brassicas). Glyphosate leads for pre-plantingcleanup of previous set-aside areas or post-harvest couch grass control in cereals.
Italy
The crops included in this survey represent 57 % of the total crop area in Italy. Some major crop areas notconsidered are annual fodder crops, olives, nuts, soya beans and rice. The total reference area in this study is6,2 million ha.
Fungicides clearly dominate the volume balance (77 % of total PPP volume), due to the large amounts ofsulphur in use. Herbicides represent 13 % and insecticides 10 % of total PPP volume.
The national average dosage rate resulting from the data presented is around 9,3 kg AI/ha. Cereals arenegligible with only 0,4 kg/ha. Vineyards and tree fruits display the greatest use intensity with 41,0 and 27,6 kgAI/ha respectively.
Vineyards (66 %) and tree fruits (14 %) are the key targets for PPP, making up 80 % of the total AI volume.Cereals, although accounting for 46 % of the reference area, represent 2 % of the total AI volume.
As in many other PPP markets dominated by vines, sulphur accounts for the bulk (55 %) of AI volumes used inItaly, and 77 % of AI volumes used in vineyards. Copper is the second most important compound, representing11 % of the total.

Comments at Member State level
A Pflanzenschutz / Plant protection / Protection des cultures 85
The Netherlands
The total national arable and permanent crop area does not include permanent pastures and grassland, norhorticultural crop areas and crops under glass. Of the reference arable and orchard crops, 87 % (810 thousandha) are included in this study.
In the Netherlands, the crop protection product usage reduction policy initiated in 1991 called for a 35 %reduction of AI usage in 1995 compared with the reference period 1984-1988. This use reduction was largelyachieved by the cut back of nematicides, which dominated the Dutch market. Nematicides, however, are notcovered in this report; many minor crops with intensive use of PPP have also not been included in this survey.So the results achieved by the use reduction program are not mirrored in this study, where the per ha dosagesof standard PPP have, in fact, slightly increased over the reporting period. In the reference year 1996, theproportion of the total AI volume represented by fungicides was 50 % and the proportion represented byherbicides was 44 %. The proportion represented by insecticides was 6 %.
The national average is 5,3 kg AI/ha for arable and permanent crops.
Fruit trees receive the most intensive care, reaching 26,1 kg AI / ha used over a growing season. The averagedosage for potatoes is 10,3 kg AI/ha.
The biggest single crop in terms of PPP-AI use is potatoes, accounting for 45 % of the total volume used incrops. Cereals, maize and sugar beets together account for 37 % of PPP-AI volumes.
Potato fungicides are by far the leading product group used in The Netherlands. Mancozeb, maneb and fentinhave been the leading active ingredients, representing 67 % of PPP-AI used for potatoes. Atrazine was thedominating herbicide used for maize.
Austria
The total area of arable land and permanent crops in Austria in 1996 was 1,5 millions of ha. The crops reportedin the PPP survey (1,0 ha) represent approximately 67 % of this total crop area.
The proportion of the total AI volume represented by herbicides fell from 55 % in 1992 to 47 % in 1996. On theother hand, the proportion of total AI volume represented by fungicides increased from 42 % to 52 %.Insecticides remained at a low level: under 3 %.
While in cereals an average of 1,0 kg AI was used per ha in 1996, vineyards received 12,3 kg of AI / ha, due tothe high usage of sulphur for powdery and downy mildew control (33 % of the total volume). As thesesubstances are classified as "natural" chemicals, allowing their use in organic production, this volume isexpected to remain at a high level. Overall, a national average of 2,2 kg AI/ha was used in the crops included inthe survey.
The crop protection market is concentrated on four main crops: vineyards (26 %), cereals (24 %), maize (17 %),and sugar beets (16 %). These four segments make up 83 % of the total AI volume.
Comparing the 1996 AI volume with that of 1992, a use decrease of 21,0 % is recorded, mainly in herbicides toprotect cereals.
This decrease is primarily due to the replacement of dicamba herbicide with novel sulfonylureas to treatcereals, but the withdrawal of atrazine to protect maize and isoproturon to protect cereals also contributed to thereduction in volume. Sulphur is the major single active ingredient in compounds to treat vineyards and sugarbeets. It accounts for 63 % of the total fungicide volume in Austria.

Comments at Member State level
86 Pflanzenschutz / Plant protection / Protection des cultures A
Portugal
Of the 2,9 million ha of arable and permanent crops in Portugal, 1,2 million ha (41 %) are included in this study.Cereals (24 %), maize (26 %), and vineyards (22 %) account for 71 % of the reference area. Olives, foddercrops or grassland were not considered.
Fungicide use, mainly sulphur, accounts for 73 % of the total AI use in Portugal. Herbicides comprise 25 % ofthe volume and insecticides represent 2 % of the total PPP-AI volume.
The global average application rate increased from 5,3 to 8,4 kg AI/ha in the report period, an increase of 61 %over the period 1992-1996. The increase in application rate was most significant in cereals (+ 695 %) andpotatoes (+ 111 %). Use in treating oilseeds, maize and vineyards also increased over the period by 84 %, 57 %and 56 % respectively. This extraordinary increase is apparently the result of the low 1992 fungicide use rate invineyards caused by severe dry weather conditions and low disease incidence.
Vineyards account for 71 % of the total AI volume in Portugal. Cereals, maize, potatoes, tree fruits andvegetables account for 27 % of the AI volume.
Sulphur, copper and propinebare are the leading fungicides in vineyards. Pendimethalin has gained substantialmarket share in treating cereals.
Phenoxy carbonic acids (2,4-D) herbicides apparently have been replaced by sulfonylureas herbicides.These herbicides are applied generally at dramatically lower dosage rates: from 20 to 30 g AI compared to 500to 1 000 g for the older herbicides.
Finnland
The total area of arable and permanent crops in Finland is 2,2 million ha. The area included in this survey is 735thousands of ha, consisting for the most part of cereals (89 %), sugar beets (5 %) and potatoes (5 %). Cropsnot considered in this study are temporary and permanent grassland, oats and other mixed grain and foddercrops.
Herbicides account for 94 % of the total AI volume. Fungicides and insecticides are of lesser importance: theirproportion of total AI volume is 6 % and 1 % respectively. The Finnish crop protection market is of minorimportance as it represents 0,2 % of the European Union market.
The total AI use per ha of cultivated land is 0,7 kg/ha. The main target crop for PPP-AI use per ha is sugarbeets.
Cereals (65 %), sugar beets (16 %) and potatoes (13 %) account for 94 % of the total AI volume used inFinland. The key concern is weed control.
The leading compounds to protect cereals are Glyphosate for couch grass control (see yellow below) afterharvest or to clean up former set-aside areas and MCPA for broadleaf weed control.

Comments at Member State level
A Pflanzenschutz / Plant protection / Protection des cultures 87
Sweden
The Swedish arable and permanent crops area includes substantial areas of temporary grazing and grassland.Excluding these crops as irrelevant for PPP use, the reference area for this study is 948 thousand ha (34 %).Cereals cover 85 % of this area, sugar beets (6 %), oilseeds – mainly rape – (4 %) and potatoes (4 %). Aremarkable decline took place in the area for oilseeds – from 138 thousand ha in 1992 to 41 thousand ha in1996.
Herbicides are the most frequently used PPP in Sweden. Their proportion of the total volume is 70 %.Fungicides (27 %) remain important, particularly for treatment of cereals and potatoes. The average forinsecticide use over this period is 2 %.
With an average national use rate of 1,0 kg AI / ha, Sweden ranks among the countries with the lowestapplication rates per ha. Dosage rate in vegetables (18,9 kg AI/ha) results mainly from propachlor herbicide,used in brassica crops including turnip rape.
Cereals (61 %), sugar beets (14 %) and vegetables – mainly turnip rape – (13 %) use 88 % of the reported AIvolume, mostly herbicides.
Glyphosate is the leading herbicide for treating cereals. It is used mainly for couch grass control after harvest. Inpotatoes, mancozeb and metalaxyl are the major fungicides used for the control of Phytophthora sp., Fusariumsp. and Alternaria sp. The most commonly used sugar beet herbicide is Metamitron. Propachlor is the leadingherbicide for vegetables, mainly brassica.
United Kingdom
The reference area incuded in this survey corresponds to 69 % of the total arable and permanent crop area.Cereals are by far the most important crops grown as they cover 53 % of the total area and 76 % of thereference area in this study. Green maize is becoming more popular as the area planted for silage and foddermaize has increased by 119 % over the report period. The rape area levelled off at 356 thousand ha in 1996due to the 1992 CAP reform.
In 1996, the proportion of fungicides was 36 %, of the total AI volume while the proportion of herbicides was62 % and insecticides 3 %.
With a national average of 2,8 kg AI/ha, the UK is in line with other Member States growing mainly arable crops.Most intensive PPP use is in tree fruits (10,8 kg AI/ha) for scab and powdery mildew control and in potatoes(6,1 kg AI/ha) for Phytophthora, Alternaria and Fusarium control.
Cereals account for 71 % of the total AI volume used in the UK. Potatoes (9 %), sugar beets (7 %) and oilseeds– rape – (4 %) together make up a 20 % share of the total volume.
Weed control in cereals, sugar beets and oilseed rape is the main reason why herbicides account for 62 % oftotal PPP-AI. Fungicides are mostly used to protect cereals against powdery mildew and a variety of other leafand ear diseases. Potato blight control (Phytophthora) and Alternaria control are indispensable for potatoproduction. Insecticides are mainly used for aphid control in sugar beets, pulses, and other vegetable crops.
Isoproturon and glyphosate are the leading herbicides used in cereals. Mancozeb leads the ranking list inpotatoes. In sugar beets, metamitron leads in herbicide use and metazachlor is most frequently used in oilseedrape. Atrazine use has grown over the report period with the increase in areas of maize.

1
PROTECTION DES CULTURES DANSL’UNION EUROPÉENNE

Introduction par Eurostat
A Pflanzenschutz / Plant protection / Protection des cultures 91
INTRODUCTION PAR EUROSTAT
Le contrôle de la vente et de l'utilisation des produits phytosanitaires dans l'UE se fonde sur la directive91/414/CEE, qui dresse les règles à satisfaire pour tout nouveau produit devant être introduit dans le marchéeuropéen. En outre, la directive inclut la nécessité de contrôler tous les produits phytosanitaires actuellementsur le marché européen, ce qui peut entraîner un retrait de l’approbation ou une restriction de la vente decertains produits ; par exemple, un produit qui s'avère toxique pour les oiseaux ne doit pas être utilisé pour letraitement des semences. En conséquence, une base d'informations complète répertorie les caractéristiquesdes différents produits, tels que le DL-50 (qui mesure la toxicité), ou les effets de la persistance sur la flore et lafaune, etc.
Le principal domaine où des informations manquent concerne l’utilisation effective de pesticides dans les Etatsmembres, et notamment, les quantités réelles des différents produits (matières actives) utilisés et les culturespour lesquelles ils sont appliqués. Cette publication essaye de répondre à une partie de cette question.
Etablir des séries fiables de statistiques sur l’utilisation de pesticides revêt une importance certaine dans denombreux domaines de recherche, dans la législation et pour l’aide à l’agriculture16.
Les principaux utilisateurs sont les suivants :
• Les responsables nationaux, notamment dans le domaine de l’agriculture, de la protectionde l’environnement et de la santé publique. Les séries statistiques donnent au gouvernementdes informations sur la situation dans le domaine de l’utilisation des pesticides. Etant donné lesnombreux “signaux d’alarme” lancés récemment par la presse et concernant les effetsindésirables, cancérogènes, neurologiques ou autres de certains pesticides, il est essentiel queles ministres disposent d’informations actualisées sur leur utilisation. Il peut s’agir de données surla gamme des produits concernée, les cultures sur lesquelles ils sont utilisés et l’étendue dutraitement de ces cultures mais aussi d’informations sur la possible exposition de la populationaux risques supposés.
• les responsables de l’UE . Le 5e programme d’actions en matière d’environnement a comme objectif pourl’an 2000 “la réduction importante de l’utilisation de pesticides par unité de sol cultivé ...”. Pour atteindre cetobjectif, il convient de réunir des données fiables sur l’évolution de l’utilisation. La Politique AgricoleCommune (PAC) fait également usage de ce type de données pour évaluer les implications économiqueset établir le niveau de prix des produits agricoles.
• Les organisations internationales, la FAO essaie de réunir des statistiques annuelles dans l’ensembledes pays au titre de l’article 1, paragraphe 1 de la constitution de la FAO, qui stipule que “l’organisation doitrassembler, analyser et diffuser des informations relatives à la nutrition, la nourriture et l’agriculture”.
Les responsables nationaux, européens et internationaux utilisent ces données pour mener à bien les activitésde contrôle suivantes :
• Apport d’informations dans le cadre de la procédure de contrôle des pesticides existants .Un volet essentiel de la procédure de contrôle recueillie dans la directive 91/414/EEC, vise àconnaître les utilisations locales et nationales ainsi que les besoins correspondants. Si lesstatistiques indiquent que les agriculteurs ne peuvent rester compétitifs sans un pesticideparticulier et qu’aucune autre solution n’est envisageable, il convient d’en tenir compte dans laprocédure. Des statistiques fiables sur l’utilisation sont essentielles à de telles évaluations etconstituent le moyen approprié pour quantifier les effets du retrait d’un pesticide. S’il estdémontré qu’un pesticide particulier n’a pas d’utilité et qu’il existe des solutions plus sûres oumoins nuisibles, un pesticide peut être retiré plus rapidement.
16 Par exemple, en Grande Bretagne, l’enquête sur l’utilisation des pesticides sur toutes les cultures est conduite de manière prévoyantedepuis 30 ans (c’est l’enquête la plus complète parmi celles existantes dans l’UE.

Introduction par Eurostat
92 Pflanzenschutz / Plant protection / Protection des cultures A
• Apport d’informations dans le cadre des procédures d’approbation de nouveauxpesticides . Lors de l’approbation de nouvelles matières actives, les données sur l’utilisation despesticides peuvent fournir des indications sur la probable pénétration du nouveau pesticide,sachant quel(s) pesticide(s) est(sont) susceptible(s) d’être remplacé(s) et l’étendue de son (leur)utilisation actuelle.
• Contrôle de la contamination éventuelle de l’eau par des pesticides . Les données surl’utilisation des pesticides peuvent permettre de mieux surveiller la contamination des eauxsuperficielles et souterraines par les pesticides. L’U.E. souhaite protéger les eaux potables et leseaux souterraines par voie législative, ce qui conduirait à une surveillance générale des résidusde pesticides conformément à ces directives. En Grande-Bretagne, les données sur l’utilisationdes pesticides sont employées dans le cadre d’un système complexe d’informationgéographique, reprenant des cartes des eaux superficielles et souterraines, des fleuves et desautres voies d’eau ainsi que des points de captage. Ce système est complété par des schémasde cultures et d’utilisation des pesticides à la fois géographiques et saisonniers et, à l’aide d’unebase de données sur les caractéristiques des pesticides et la modélisation de leurs mouvementsdans différents sols, est employé pour effectuer des prévisions sur la probable apparition depesticides aux points de prélèvement afin de faciliter la surveillance des pesticides dans l’eau. Cefaisant, on espère éviter le suivi inutile des pesticides qui sont peu susceptibles d’apparaître à unpoint ou à un moment particuliers dans un cours d’eau donné. Il importe toutefois de noter que detelles méthodes ne peuvent être utilisées que pour orienter le contrôle et non se substituer à lui.
• Apport d’informations pour les programmes de contrôle des résidus de pesticides sur lesfruits frais, les légumes, etc . Les données sur l’utilisation des pesticides à l’échelle européennepermettraient aux Etats membres d’adapter leur programmes de contrôle de résidus à un largeéventail de produits importés d’autres Etats membres de l'UE et aux aliments produits à l’intérieurdu pays, afin de surveiller leur conformité avec les niveaux de résidus maximaux autorisés ;
dans le cadre du lancement de programmes de contrôle , les données sur l’utilisation despesticides illustrent la gamme utilisée sur les cultures à surveiller et permettent de limiterl’analyse aux pesticides susceptibles d’apparaître;
lorsque des résidus inhabituels ou inattendus sont détectés , les données surl’utilisation provenant d’enquêtes auprès des agriculteurs permettent de confirmer lesrésultats ou de faire appel à d’autres méthodes pour corroborer ou invalider les conclusions.Par exemple, l’analyse de prunes par chromatographie en phase liquide à hauteperformance à l’aide de la détection par système de diodes UV a montré que 50 % deséchantillons contenaient des résidus de diflubenzuron, alors que les données sur l’utilisationindiquaient que seules 5 % des cultures avaient été traitées. Ces résultats d’enquête ontincité à réaliser une autre analyse par CL.—SM. qui a révélé que les résidus suspectésétaient des artefacts. En revanche, la présence de résidus de chlorothalonil – employé demanière illicite au Royaume-Uni – dans les laitues, a été confirmée par les donnéesd’enquête, puisque cette utilisation illicite avait été effectivement rencontrée.
Les séries statistiques peuvent également s’utiliser dans les cas suivants :
• Pour établir des indicateurs d’incidence sur l’environnement . Les données sur l’utilisationdes pesticides sont indispensables à l’établissement d’indicateurs environnementaux tels que lesindicateurs de pression sur l’environnement, les indicateurs de contrôle de l’intégration desmesures environnementales dans la Politique agricole, les indicateurs de développement durableet le projet de réduction des risques de pesticides conduit par l’OCDE; il convient aussi dedisposer de séries statistiques pour suivre les éventuels effets des changements de politiquerelatifs à l’incidence des pesticides sur l’environnement;
• Pour la recherche. Une fois établie la collecte régulière de séries statistiques sur l’utilisation despesticides, les changements dans l’application de certains pesticides sur certaines culturespeuvent être surveillés. Ces changements peuvent découler de plusieurs facteurs, tels que:

Introduction par Eurostat
A Pflanzenschutz / Plant protection / Protection des cultures 93
Les conditions climatiques: des différences météorologiques annuelles, qui ont un effetsur l’éventail des problèmes liés aux parasites, aux maladies et aux mauvaises herbesdevant être contrôlés, ou qui empêchent l’agriculteur d’appliquer les pesticides dans desconditions appropriées;
Les facteurs d’innovation : l’introduction de nouvelles molécules susceptibles de remplacerdes pesticides plus anciens ou moins actifs et qui peuvent, en outre, être appliqués à desdoses par hectare moins élevées;
Les facteurs économiques : des changements de prix ou du niveau de subvention descultures qui modifient les marges bénéficiaires et rendent l’utilisation des pesticides plus oumoins rentable.
Les données présentées dans cette publication ne donnent pas un aperçu complet de l'utilisation despesticides, puisqu’elle exclut des pesticides généralement utilisés en agriculture tels que les molluscicides(tueurs de limaces), les nématicides (tueurs de nématodes), les régulateurs de croissance et les traitementsdes cultures après récolte. Elle exclut également tout l’éventail de biocides ou de médicaments à usagevétérinaire utilisés en agriculture (comme les bains parasiticides pour moutons). Cette publication peut êtrenéanmoins utilisée pour quelques unes des fins susmentionnées.
Introduction par ECPA
A Pflanzenschutz / Plant protection / Protection des cultures 95
INTRODUCTION PAR ECPA
Depuis que l’homme s’est sédentarisé et a entrepris de cultiver la terre, ses principales préoccupations ont étéd’améliorer le rendement et la qualité de ses produits et de défendre ses cultures contre des légions denuisibles et de maladies et contre les menaces environnementales abiotiques. Il est difficile à notre sociétéoccidentale d’imaginer que la famine ait constitué un fléau courant au cours de l’histoire. Dans de nombreusesrégions d’Europe, les agriculteurs luttaient pour ne produire que de quoi nourrir les membres de leur famille.Une fois que les nuisibles, les maladies et les mauvaises herbes avaient prélevé leur part, le peu que le solproduisait, était en outre menacé par les ravageurs et les maladies qui s’attaquaient aux denrées stockées. Lerapport intrants / production est illustré par un dicton des Indiens d’Amérique du Nord dont le maïs était laprincipale culture vivrière et qui semaient sept grains à la fois : « deux pour le renard, deux pour le corbeau,deux qui pourriront et un qui lèvera ».
Alors qu’il était plus ou moins possible d’éliminer les mauvaises herbes par des procédés physiques, etnotamment par des désherbages et des binages fréquents, les attaques des ravageurs et des maladies, quisurvenaient souvent à la suite de conditions climatiques défavorables, étaient plus difficiles à maîtriser. Cettesituation s’est poursuivie jusqu’au début du 20e siècle. Lorsque la science a pu identifier les causes desdommages et des maladies et déterminer les circonstances de leurs manifestations, des moyens de défenseont pu alors être mis au point. Les premiers pesticides ont été produits à la fin du 19e siècle et pendantplusieurs décennies ;, il s’agissait surtout de composés minéraux. La découverte de l’action fongitoxique ducomposé sulfate de cuivre / lait de chaux a constitué une percée majeure dans la protection de la vigne contrele mildiou et a donné lieu, en 1882, à la préparation de la bouillie bordelaise qui est encore utilisée de nos jours.La mise au point de ce produit a rapidement été suivie par une gamme de fongicides à base de métaux lourdset de soufre. Le premier insecticide largement employé a été l’arsenic qui, sous la forme de vert de Paris, a étéutilisé pour lutter contre une épidémie de doryphores de la pomme de terre aux Etats-Unis. La découverte, lorsde la Deuxième guerre mondiale, de l’action insecticide du D.D.T. (initialement utilisé à des fins sanitaires ethygiéniques) ainsi que la mise au point d’herbicides basés sur les hormones de croissance des dicotylédones,les auxines, ont constitué d’autres grandes étapes dans la recherche de moyens de défense contre les aléas dela nature. Le D.D.T. a permis d’éliminer de manière sélective les dicotylédones dans les céréales au début desannées 50 (2,4-D / « U46 » - B.A.S.F.).
Aujourd’hui, les agriculteurs européens disposent de remèdes contre pratiquement tous les ravageurs,mauvaises herbes ou maladies, ce qui se traduit par une amélioration des rendements et de la qualité desaliments. Les consommateurs ont accès à une profusion de produits alimentaires de haute qualité à des prixraisonnables.
Objectifs de la protection des cultures
Durant leur croissance, certaines espèces sauvages acquièrent des mécanismes de défense très sophistiquéscontre les attaques des nuisibles et des maladies ou peuvent se régénérer après une infestation. Souvent, lesinsectes broyeurs ou suceurs ne peuvent digérer le tissu arrivé à maturité en raison du tanin et d’autres toxinesque la plante produit pour se défendre. C’est pourquoi les insectes attaquent souvent leurs plantes hôtes dansla phase initiale du cycle végétatif, lorsque les cellules contiennent peu ou pas de toxines et lorsqu’elles sont lesplus nourrissantes en raison de leur forte teneur en glucides ou en protéines. Les infections fongiques etbactériennes affectent fréquemment les plantes qui croissent dans des conditions difficiles ou qui, d’unemanière ou d’une autre, sont affaiblies ou blessées. Ces organismes jouent un rôle important dans la nature carils décomposent les matières organiques mortes ou en cours de putréfaction et recyclent l’énergie et lesminéraux qu’elles contiennent. Lorsqu’ils mûrissent, les fruits contiennent de plus en plus de sucre etd’ingrédients aromatiques les rendant attrayants pour ces organismes qui aident la nature à dégrader les tissusprotecteurs extérieurs, libérant ainsi les graines pour permettre leur dissémination. On comprend bien que leproducteur de fruits s’efforce d’empêcher cette désintégration naturelle de sa récolte.

Introduction par ECPA
96 Pflanzenschutz / Plant protection / Protection des cultures A
Le milieu naturel se caractérise par la lutte pour la survie, phénomène qui est commun à toutes les espèces etqui est essentiellement dû à la pénurie de produits alimentaires. Les espèces vivrières cultivées par l’hommeont été sélectionnées et reproduites pour leur faible toxicité, leur pouvoir nutritif et leur sapidité. Ces végétauxreprésentent une source majeure d’alimentation pour toutes sortes d’organismes vivants. La principalecaractéristique qui différencie l’homme des autres espèces est qu’il a appris à trouver les moyens de sedéfendre et de défendre ses sources d’alimentation contre les attaques des ravageurs et des maladies.
Les aspects les plus importants dans l’utilisation des produits de qualité de protection phytosanitaire (P.P.P.)sont les suivants :
- garantir la production de denrées commercialisables en réduisant les dégâts causés par les ravageurs etles maladies;
- réduire les coûts de la main-d’œuvre en éliminant la nécessité du désherbage manuel coûteuse en main-d’œuvre ;
- faciliter la mécanisation de la récolte en réduisant l’envahissement des cultures par les mauvaisesherbes;
- empêcher les baisses de rendement dues aux attaques des ravageurs et des maladies ou à laconcurrence des mauvaises herbes.

2
MÉTHODOLOGIE ET METADONNÉES

Méthodologie et Metadonnées
A Pflanzenschutz / Plant protection / Protection des cultures 99
2.1 Sources de données et champ d’application de cette enquête
Cette publication a été préparé à partir de données sur l’utilisation de produits de protection phytosanitairefournies par les entreprises membres de l’ECPA, l’Association Européenne de Protection des Cultures.Ensemble, ces dix entreprises représentent environ 90 % du marché européen des produits de protectionphytosanitaire, ce qui garantit la fiabilité des données affichées, ces dernières reflétant par ailleurs plus oumoins la situation actuelle dans le secteur de la protection des cultures au sein de l’Union Européenne et desEtats Membres.
Les pays couverts sont la Belgique et le Luxembourg, le Danemark, l’Allemagne, la Grèce, l’Espagne, laFrance, l’Irlande, l’Italie, les Pays-Bas, l’Autriche, le Portugal, la Finlande, la Suède et le Royaume-Uni. Si lesdonnées fournies par les pays d’Europe occidentale et du sud sont assez complètes, les informations provenantdes pays nordiques, en particulier du Danemark, de la Suède et de la Finlande, sont peu concluantes en raisondu peu de liens entre ces trois pays et les entreprises membres de l’ECPA. Deux entreprises n’ont pas fait dedistinction entre les trois pays dans leur historique des ventes et n’ont enregistré les volumes que pour la“ Région nordique “.
Les cultures couvertes par la présente enquête ont été identifiées comme étant celles faisant l’objet de lamajorité des applications importantes de PPP dans l’UE. Dans la mesure du possible, les cultures identifiéesont été couvertes en détail. Lorsqu’une ventilation de l’usage de PPP par culture n’a pas été possible oufaisable, des groupes de cultures (par exemple, “céréales” ou “cultures fruitières”) ont été indiqués sans plus deprécision. En outre, les cultures ont été classées en “cultures de terres arables” (betteraves, céréales, maïs,pommes de terre, graines oléagineuses) et en “cultures spéciales” (agrumes, fruits à pépins et à noyau,vignes). Les légumes entrent dans la catégorie des “cultures spéciales” lorsque ce groupe est mentionné.
Les matières actives (MA) des PPP sont répertoriées selon leur appellation courante17 définie dans le manueldu British Crop Protection Council (BCPC). Dans la mesure du possible, la répartition des MA par groupe aégalement suivi la classification du BCPC. Les groupes de produits couverts étaient les principaux constituantsde la gamme de produits pour la protection des cultures, à savoir les fongicides, les herbicides et lesinsecticides. Les fongicides ne comprennent généralement pas les produits de traitement des semences.
Les insecticides comprennent les acaricides. D’autres groupes de matières actives utilisées dans l’agriculture(les molluscicides, les nématicides et les régulateurs de croissance, par exemple) ne sont pas pris en compte.
Selon l’industrie, environ 300 mille tonnes de matières actives sont annuellement utilisées dans l’UE. Cettepublication fait état de l’utilisation de quelque 250 mille tonnes d’entre eux en 1996, ce qui représente plus de80 % du marché total des PPP. Bien que tous les aspects de la protection des cultures dans l’UE n’aient pu êtrecouverts, les données présentées sont considérées comme relativement représentatives du marché total.
2.2 Méthodologie
Les informations contenues dans la base de données de référence du présent rapport ont été fournies par lesservices d’étude de marché ou la branche agricole des dix entreprises membres à part entière de l’ECPA:AgrEvo, BASF, Bayer, Cyanamid, Dow Agrosciences, Du Pont de Nemours, Monsanto, Novartis, RhonePoulenc et Zeneca. En général, des études de marché groupées (par exemple des enquêtes annuelles auprèsdes agriculteurs) effectuées avec un groupe cible relativement constant ont constitué la source des données.
Les données fournies par ce groupe représentatif d’utilisateurs ont été calculées par chaque pays selon desméthodes statistiques communes. Les panels ne couvrent pas toutes les cultures et toutes les utilisationsmineures mais selon le cas, les personnels des entreprises ont généralement complété et corrigé les donnéesbrutes correspondantes. Lorsque d’importantes matières actives étaient commercialisées* par des distributeursautres que les dix mentionnés, le fabricant initial du composé breveté a estimé la quantité totale de produitutilisée sur le marché, en dehors de ses propres ventes, pour donner une idée représentative du volume total
17 Les appellations courantes des PPP sont soulignées dans le texte alors que les groupes chimiques auxquels ils appartiennent sont engras.

Méthodologie et Metadonnées
100 Pflanzenschutz / Plant protection / Protection des cultures A
(Atrazine, Isoproturon, Soufre). Les volumes de matières actives ont été obtenus à partir des produitscommerciaux en fonction de leur teneur en MA exprimée en pourcentage (de poids) ou en g/l (p/v). Lesappellations commerciales des produits d’origine ou les noms des entreprises ont été éliminés de la base dedonnées finale. Lorsqu’on compare les chiffres provenant de la base de données de l’ECPA / Eurostat auxdonnées fournies par des associations industrielles nationales, il faut bien garder à l’esprit que les volumes dematières actives déclarés par les organisations nationales comprennent toutes les utilisations et tous lesgroupes chimiques de produits phytosanitaires sous forme de ventes effectuées au cours de l’année civile.Certains produits chimiques peuvent représenter des volumes considérables, par exemple les produits destérilisation du sol ou les nématicides, qui ne sont pas inclus dans la présente enquête.
On peut également constater d’importantes différences entre cette étude et les données d’associationsindustrielles dans les pays faisant un usage considérable des PPP sur des cultures mineures non couvertes parla présente étude.
Il en est de même pour certaines cultures. Alors que les données relatives à la betterave sucrière, au maïs, à lapomme de terre, aux agrumes et à la vigne concernent directement les cultures cibles en raison de leur actionspécifique, certains composés à large spectre, pour lesquels la culture cible finale n’était pas identifiable, ontuniquement été déclarés pour des groupes de cultures (céréales, fruits du verger et cucurbitacées, grainesoléagineuses, légumes) contenant les cultures spécifiées en proportions variables. C’est pourquoi, pour lescomparaisons d’utilisation, le niveau du groupe de cultures constitue la base de données la plus fiable. Danstoute la mesure du possible, l’usage des PPP a été affecté au prorata aux cultures individuelles (blé et orge;arbres fruitiers et vigne) en fonction des suggestions faites par l’entreprise déclarante (Tableau 1).
Parmi les Etats Membres de l’Union Européenne, seuls les Pays-Bas, la Suède et le Royaume-Uni mènent desenquêtes spécifiques sur l'utilisation des pesticides dans l'agriculture. Les résultats des enquêtes dans ces troisEtats Membres sont présentés dans la publication d'Eurostat: L’utilisation des Pesticides dans l’UE18. Anouveau, il faut être prudent dans la comparaison des données de ces enquêtes et celles fournies par l'ECPA,car le champ d'application et la couverture de ces enquêtes est différent. Une différence majeure est l'exclusionde molluscicides, stérilisants de sols, nematicides et des régulateurs de croissance dans l'ECPA, alors que cestypes de pesticides sont inclus dans les enquêtes nationales d'utilisation.
En général, les chiffres figurant dans le présent rapport représentent l’utilisation réelle pour la campagneagricole / l’année de récolte souvent, les chiffres de ventes par année civile comprennent également lesproduits de la chaîne de distribution qui n’ont pas été effectivement consommés au cours d’une campagneagricole donnée.
18 Statistiques en Bref, Environnement, 1998/3.

Méthodologie et Metadonnées
A Pflanzenschutz / Plant protection / Protection des cultures 101
Tableau 1 : Ventilation des cultures 19
Types de cultures
Groupe de cultures Cultures spécifiées Cultures associées
Blé * Blé d'hiver, blé d'été, blé dur
Orge * Orge d'hiver, orge d'été
Céréales (n.s.)
Betteraves à sucre *
Betteraves fourragères
Maïs grain / maïs
Maïs à ensilage / maïs
Colza Colza d'hiver, colza d'été
Graines de tournesol
Pommes de terre * PotatoesPommes de terre de consommation et de semence
Agrumes * Agrumes Tous types
Vigne * Raisin
Fruits à pépinsPommes, poires: de table uniquement *
Fruits à noyau *Ceries, prunes, abricots, nectarines, pêches, etc. Vergers / arbres fruitiers commerciaux uniquement
Vergers
Fruits du verger (n.s.)
ChouxChoux, choux-fleurs, choux de Bruxelles, navette, etc.
CucurbitacéesConcombres, melons, courges, cornichons, courgettes, etc.
Pois et haricots (légumes secs)Pois et haricots à consommer frais ou en boîte
Tomates
Légumes (n.s.)
Fruits du verger
Légumes *
n.s.: non spécifié
Cultures spéciales
Cultures de terres arables
Céréales
Betteraves à sucre
Maïs *
Graines oléagineuses *
19 Les cultures qui sont identifiées par un “*” sont celles qui sont utilisées pour le calcul de la superficie cultivée des cultures et pour lesdoses d’application. Par exemple, la superficie cultivée des cultures et les doses d’application pour les céréales comprennent uniquement leblé et l’orge.
Source: Eurostat.

Méthodologie et Metadonnées
102 Pflanzenschutz / Plant protection / Protection des cultures A
2.3 Description des groupes de PPP
Si de nombreux types différents de composés chimiques sont utilisés dans la production agricole (rodenticides,molluscicides, nématicides, produits de stérilisation du sol et des locaux de stockage, par exemple), le présentrapport se concentre sur les trois groupes de produits phytosanitaires qui constituent aujourd’hui les principauxéléments de la panoplie de produits dont dispose l’agriculteur pour protéger ses cultures : les herbicides, lesfongicides et les insecticides. Par ailleurs, ce rapport n’aborde pas la question de l’utilisation de ces agentsdans des secteurs non agricoles, par exemple pour l’hygiène publique et autre.
Le fichier contient un total de 491 appellations courantes de MA dont 26 % sont des fongicides, 40 % desherbicides et 34 % des insecticides/acaricides.
2.3.1 Herbicides
Les herbicides sont utilisés pour lutter contre le développement de plantes indésirables ou adventices,généralement appelés mauvaises herbes, sur les surfaces à vocation agricole ainsi que dans les zones noncultivées où la présence de végétation n’est pas désirée. Outre qu’elle sert à éliminer la végétation concurrentedans les cultures, la lutte contre les mauvaises herbes est nécessaire pour permettre ou faciliter la récoltemécanique. Par ailleurs, la contamination des récoltes de semences ou de céréales par des graines demauvaises herbes pose un problème au commerce des grains et à l’industrie de transformation (par exempleaux minotiers) et cette contamination entraîne des réductions considérables des profits nets des agriculteurs.
Les herbicides peuvent avoir une action sélective ou non sélective. Les herbicides sélectifs peuvent êtreappliqués avant ou après la levée des adventices ou des plantes cultivées. Le traitement d’une culture consistegénéralement en une application unique effectuée à un stade végétatif précoce, au moment où les mauvaisesherbes peuvent causer le plus de dégâts en absorbant une partie de l’eau, des substances nutritives et de lalumière nécessaires à la plante cultivée. Ces herbicides agissent par absorption par les racines (actionrésiduelle) ou par les feuilles (action foliaire) des adventices qu’ils doivent supprimer. Généralement, lesherbicides sélectifs sont classés en fonction des plantes adventices visées par leur action : anti-dicotylédones,destructeurs de graminées (graminicides) ou herbicides à large spectre qui détruisent les graminées adventiceset les dicotylédones dans des cultures déterminées. Les herbicides sélectifs sont le plus souvent utilisés dansles cultures de terres arables, par exemple les céréales, la betterave sucrière, la pomme de terre, le maïs, etc.Ils sont de plus en plus élaborés. Alors que les herbicides classiques agissaient à des doses d’environ 0,5 à 1kg de matière active par ha ou plus (le TCA, par exemple, employé pour lutter contre le chiendent, étaitappliqué à des doses pouvant atteindre 60 kg/ha), de nouveaux produits tels que les sulfonylurées sontefficaces à des doses d’à peine 10 à 25 g/ha. Tous les herbicides sont généralement dégradés ou métabolisésà la fin de la campagne culturale sans laisser de résidus décelables. Même après des années d’emploi intensifsur des surfaces déterminées, on ne connaît aucun exemple d’accumulation d’herbicide dans le sol susceptiblede constituer un risque pour les récoltes ultérieures.
Les herbicides non sélectifs ne font aucune différence entre plantes cultivées et mauvaises herbes et sont leplus souvent utilisés comme désherbants totaux dans les cultures pérennes (par exemple les vignes, lesvergers) ou aux alentours des exploitations agricoles pour éliminer toute végétation non désirée. Lesdésherbants totaux peuvent également avoir une action résiduelle et / ou foliaire. Les herbicides totaux foliairessont également employés pour éliminer les mauvaises herbes sur les terres gelées pendant la périoded’inactivité ou pour “nettoyer” les champs avant leur remise en exploitation. Un autre important domained’utilisation est le dessèchement du feuillage des plantes cultivées pour faciliter la récolte mécanique ou pourdétruire le chiendent (Agropyron repens) dans les chaumes après la moisson des céréales.
Méthodologie et Metadonnées
A Pflanzenschutz / Plant protection / Protection des cultures 103
2.3.2 Fongicides
Les fongicides sont des composés utilisés pour protéger les cultures contre les maladies causées par deschampignons pathogènes. Les infections fongiques menacent les cultures de la phase de germination à larécolte et peuvent également causer des dommages considérables aux denrées stockées. Les champignonsphytopathogènes sont ubiquistes et sont généralement dispersés dans l’air sous forme de spores. Lorsque cesspores se posent à la surface de la plante, elles germent si les conditions (température, humidité) sontfavorables et selon les espèces de champignons. Une fois que les spores germées ont pénétré dans l’épidermede la plante et que le mycélium du champignon s’est répandu dans le tissu de cette dernière, il n’est pluspossible de l’éliminer au moyen de fongicides classiques. Il est généralement possible de lutter contre lesmaladies fongiques grâce à une action prophylactique visant à empêcher la pénétration des spores germéesdans le tissu de la plante. C’est pourquoi les fongicides classiques font l’objet de fréquentes applications demanière à maintenir une couche protectrice de matière active, surtout pendant la phase de croissance rapidede la plante cultivée et dans des conditions de forte pluviosité. Une négligence dans la lutte contre les maladiesfongiques peut parfois entraîner la destruction de la récolte complète d’une année. Dans les systèmes deculture intensive, il est par conséquent nécessaire de surveiller les conditions du milieu afin de déterminer lemoment optimal d’application du fongicide. Fréquemment, les fongicides modernes ont également une actioncurative dans la mesure où ils sont systémiques, c’est-à-dire qu’ils sont capables de pénétrer dans le tissu de laplante et d’attaquer le mycélium dans les cellules végétales.
Toutefois, cette action curative se limite à une brève période de temps après l’infection et ne constitue donc pasune mesure standard fiable. Les fongicides classiques à action préventive continuent de constituer le fer delance de la lutte contre les maladies fongiques.
2.3.3 Insecticides
Contrairement aux fongicides, les insecticides, produits phytosanitaires “classiques”, ne sont appliqués quelorsque l’infestation par les insectes est manifeste. Ils ne sont employés comme mesure de protection contre lesinsectes qu’incorporés à un traitement d’enrobage de la semence. Les insecticides peuvent agir par contact,inhalation ou ingestion. Dans les systèmes de culture intégrée, la surveillance des conditionsenvironnementales favorables à la prolifération des insectes est indispensable.
Récemment, des moyens de lutte biologique ont également été développés, par exemple, l’utilisation degermes entomopathogènes spécifiques tels que la toxine Bacillus thuringiensis ou de virus pathogènes pourlutter surtout contre les larves de lépidoptères. La propagation d’insectes entomophages est également utiliséecomme moyen de lutte biologique. Les pièges à bouquet phéromonal sont fréquemment utilisés pour contrôlerles périodes d’accouplement des insectes et déterminer le moment optimal pour prendre des mesures dedéfense contre les jeunes larves avant qu’elles aient le temps de pénétrer dans le tissu hôte où il est impossiblede les détruire au moyen d’insecticides ordinaires. Les mesures de lutte biologique sont généralement trèsélaborées et exigent une surveillance précise et continue des infestations par les insectes. En outre, les agentsinsecticides biologiques exigent souvent plus d’applications car il sont généralement dégradés très rapidementaprès l’application. Dans l’Union Européenne, les insecticides sont surtout utilisés pour lutter contre lesaphididés (pucerons) et les larves de papillons de nuit (lépidoptères). Les aphididés causent des dommagesaux cultures non seulement en perforant les tissus des organes végétatifs pour en aspirer la sève mais aussiparce qu’ils sont fréquemment porteurs de maladies virales. Les acaricides utilisés contre les tétranyques quicausent souvent de graves dommages au feuillage des cultures pérennes (agrumes, arbres de vergers etvigne, par exemple) constituent un secteur spécial de la protection phytosanitaire.

3
PRINCIPAUX RÉSULTATS ETCOMMENTAIRES AU NIVEAUDE L’UNION EUROPÉENNE

Principaux résultats et commentaires au niveau de l’Union Européenne
A Pflanzenschutz / Plant protection / Protection des cultures 107
Tableaux de référence: Page
EU-1.1 – 1.8: Volume de PPP utilisé par Etat Membre ...............................................................................................................................129
EU-2.1 – 2.6: Volume de PPP utilisé par groupe de cultures ......................................................................................................................133
EU-3.1 – 3.2: Superficies cultivées par Etat Membre et par groupe de cultures ..........................................................................................135
EU-4.1 – 4.5: Dose de PPP utilisée par Etat Membre et par groupe de cultures .........................................................................................136
3.1 Evolution et situation de la consommation de PPP
Dans les Etats Membres de l’UE pour lesquels les données de la période 1992-1996 sont disponibles, lesvolumes de matières actives utilisés pour la protection des cultures ont augmenté de 8 % (de 231 524 tonnesen 1992 à 249 646 tonnes en 1996) après un recul de 4 % de 1993 à 199420 . Lorsqu’on compare la panopliede MA de 1992 à celle de 1996, on constate que 16 substances non mentionnées en 1992 y figurent en 1996 etqu’inversement 10 substances non citées en 1996 y figuraient en 1992.
Dans l’UE, le marché des produits phytosanitaires est un marché solidement établi dans lequel l’agricultureoccupe une place très importante. Les modifications du niveau d’utilisation des PPP sont essentiellement duesà l’incidence des ravageurs et des maladies qui dépend souvent des conditions météorologiques.
À la suite de la réforme de la PAC, en 1992, les considérations de réduction des coûts et de rentabilité ont étéles principaux facteurs ayant une incidence sur l’intensité des mesures de traitement et le choix des marquesde PPP ou des produits eux-mêmes. Après le sentiment initial d’insécurité quant aux implications et à l’impactde la réforme (à savoir des prix à la production inférieurs pour la plupart des produits agricoles), laconsommation de PPP est aujourd’hui repassée au-dessus de son niveau de 1992.
Le recul enregistré de 1993 à 1994 a essentiellement été perçu en France et en Allemagne, principaux paysproducteurs de céréales et de colza, et résultait de la réforme de la PAC et de l’insécurité des agriculteursquant aux effets des nouveaux règlements sur les superficies cultivées et sur les prix du marché applicables àleurs récoltes. Les céréales et les protéagineux étaient les principales cibles de la réforme. Il s’en est suivi unebaisse de l’utilisation des produits phytosanitaires, surtout des fongicides et des herbicides, et les dosesd’emploi ont fréquemment été réduites à la limite de l’efficacité, pour abaisser les coûts.
La situation est plus ou moins revenue à la “normale” en 1996. Les exploitants agricoles ont dû faire face à uneréduction des prix à la ferme par tonne de produit récolté. Pour préserver et améliorer leur niveau de revenu, ilsont dû se fixer un optimum économique comme objectif en surveillant le rapport coût-bénéfice pour chacune deleurs activités, et par exemple en ne traitant leurs cultures avec des PPP que lorsque c’était nécessaire. Parcontre, l’utilisation des PPP peut être perçue comme un moyen de protéger le travail investi et les dépenses encapital effectuées pour les cultures agricoles. Dans certains cas, on peut appliquer des PPP, même lorsqu’il n’ya pas augmentation du rendement, pour justifier le coût du traitement : c’est le cas lorsque la qualité de larécolte (l’orge de brasserie, par exemple) doit répondre aux conditions fixées par les négociants et l’industrie detransformation ou lorsqu’il faut empêcher la propagation des maladies virales (lutte contre le vecteur) dans laproduction de semences (pommes de terre, par exemple).
Les programmes de réduction de l’utilisation des PPP mis en œuvre dans les pays nordiques et aux Pays-Basont surtout eu une incidence sur l’utilisation des nématicides ou des produits de stérilisation du sol dans lescultures horticoles ou spéciales, qui n’entrent pas dans le cadre de cette enquête. Par conséquent, les effets deces programmes ne sont pas visibles dans les chiffres indiqués pour les principales cultures consommant desPPP–MA.
20 Toutefois, lorsqu’on discute des risques posés par les PPP, il faut bien garder à l’esprit qu’on ne peut juger les produits phytosanitairessur le seul critère du volume utilisé. Leur toxicité et leur rémanence dans le sol sont également d’importants facteurs à prendre en compte.

Principaux résultats et commentaires au niveau de l’Union Européenne
108 Pflanzenschutz / Plant protection / Protection des cultures A
Un accroissement réel de l’utilisation des PPP–MA ne peut être observé que dans les pays partant de niveauxagricoles relativement bas (P, EL), probablement parce que la production agricole est devenue plus rentablepour ces pays.
Dans les cultures de terres arables, on constate que les agriculteurs ont manifestement tendance à utiliser lesmatières actives qui sont efficaces à une dose inférieure à celle des anciens produits standards. Toutefois, uneréduction de l’emploi d’herbicides ou de fongicides dans les principales cultures (céréales, maïs ou betteraves àsucre, par exemple) n’aurait qu’un effet marginal sur le volume total utilisé. Ce volume total reste en effetdominé par le soufre et le cuivre (38 % en 1992 et 41 % en 1996 de la totalité des MA utilisées), principalesmatières actives utilisées pour lutter contre les maladies de la vigne et des arbres fruitiers ainsi que dans lesfermes pratiquant l’agriculture biologique. Tant que le soufre et le cuivre seront les principaux produits utilisésdans la protection intégrée des cultures, le volume total de MA utilisé ne diminuera pas de manière significativedans l’Union Européenne.
L’utilisation des herbicides a surtout subi les conséquences du doute qui s'est installé chez les agriculteurs àpropos des effets que pouvait avoir la réforme de la PAC sur leurs bénéfices. Pourtant, après un recul de 8 %entre 1992 et 1993, le volume de MA d'herbicides a régulièrement progressé jusqu’en 1996. L’utilisation defongicides et d’insecticides a été moins affectée (voir Graphique 1) dans la mesure où la majeure partie de cesproduits est utilisée sur des cultures spéciales non soumises à la réglementation de la PAC. Par ailleurs,l’abandon de toute protection contre les ravageurs et les maladies a une incidence directe sur la qualité et lespossibilités de commercialisation des fruits et légumes.
Graphique 1: Evolution de la tendance de consommation des PPPpour l'UE, 1992 à 1996
134140 148 146 149
8683
7476 70
16 17 19 1519
0
50
100
150
200
250
1992 1993 1994 1995 1996
Fongicides Herbicides InsecticidesSource: Eurostat.
(en 1 000 t de MA)
Les fongicides représentent le segment le plus important (60 % du volume total de MA dans l’UE) en raison deleur utilisation fréquente dans le cadre de programmes d’applications séquentielles sur les cultures spéciales etde la position dominante du soufre employé à fortes doses. 69 % du volume de fongicides sont utilisés dans lesvignes, loin devant les céréales (10 %) et les arbres fruitiers (8 %). Les pommes de terre et les légumesreprésentent respectivement 5 et 4 % du volume de fongicides utilisé.
Le marché des herbicides concerne en premier lieu les céréales et le maïs qui représentent respectivement 36et 29 % du volume total. Cette proportion passe à 12 % pour la vigne, 7 % pour la betterave sucrière et 6 %pour les graines oléagineuses.
Pour ce qui concerne les insecticides, les arbres fruitiers, la vigne et les agrumes représentent respectivement33 %, 18 % et 14 % du volume total de MA Les insecticides sont également utilisés pour empêcher les dégâtsessentiellement causés aux légumes (10 %) par les pucerons et les chenilles. Le maïs (7 %) doit principalementêtre protégé contre la pyrale du maïs, surtout dans les pays chauds. En général, les insecticides ne jouent

Principaux résultats et commentaires au niveau de l’Union Européenne
A Pflanzenschutz / Plant protection / Protection des cultures 109
qu’un rôle mineur pour ce qui concerne le volume de MA puisqu’ils ne représentent que 6 % du total(Graphique 2).
Graphique 2: Composition des PPP, par volume, pour l’UE, en 1996
Insecticides6%
Herbicides34%
Fongicides60%
Source: Eurostat.
3.2 Ventilation de la consommation de PPP par Etat Membre
En 1996, 81 % du volume total de MA appliqué dans l’UE-15 étaient utilisés par quatre Etats Membres : laFrance, l’Italie, l’Allemagne et l’Espagne. La France est de loin le pays qui utilise le plus de PPP–MA (37 %).Avec l’Italie, ces deux Etats Membres représentent 59 % du volume total pour l’Union Européenne (Tableau 2).
Alors que les surfaces cultivées avaient régressé de 7,0 % de 1992 à 1994, elles ont augmenté de 3,4 % de1994 à 1996.
Les taux d’utilisation moyens de PPP–MA se sont stabilisés à 4,8 kg de MA/ha pour l’ensemble des cultures.Les taux d’utilisation par hectare les plus élevés sont observés pour les Etats Membres dans lesquelsl’arboriculture fruitière et la vigne sont des secteurs particulièrement importants (Italie, 9,3 kg de MA/ha etPortugal, 8,4 kg de MA/ha), en raison de l’application séquentielle de fongicides et de la position dominante dusoufre. Les taux d’utilisation les plus faibles concernent les Etats Membres qui pratiquent surtout les cultures deterres arables.
La France, l’Italie et l’Espagne représentent 76 % de la totalité des MA fongicides utilisées. La culture principalepour ce qui concerne l’utilisation de fongicides est celle de la vigne (69 % de l’ensemble des MA fongicides). Làencore, le soufre représente la majeure partie (59 %) de la totalité des applications de fongicides effectuéesdans ce secteur.
Avec 35 % de l’ensemble des désherbants utilisés, la France est le premier consommateur d’herbicides parmiles Etats Membres. Les céréales et le maïs sont les cultures qui dominent en matière de consommationd’herbicides (36 % et 29 % respectivement).
L’Italie se classe en tête du marché des insecticides (39 %) devant l’Espagne (24 %) et la France (23 %). Lapart de marché individuelle des douze Etats Membres restants est de 3 % ou moins.

Principaux résultats et commentaires au niveau de l’Union Européenne
110 Pflanzenschutz / Plant protection / Protection des cultures A
Tableau 2: Ventilation de la consommation de PPP par Etat Membre, en 1996 (en 1 000 t de MA)
EU-15 148.9 86.0 14.7 249.6 100.0
B/L 1.3 1.8 0.2 3.3 1.3
DK 1 1.3 1.9 0.1 3.3 1.3
D 8.4 18.3 0.4 27.1 10.8
EL 8.7 1.1 0.5 10.4 4.2
E 16.4 6.8 3.5 26.7 10.7
F 53.2 34.6 3.4 91.2 36.5
IRL 0.2 0.3 0.0 0.5 0.2
I 44.1 7.3 5.8 57.2 22.9
NL 2.1 1.9 0.3 4.3 1.7
A 1.2 1.1 0.0 2.3 0.9
P 7.3 2.5 0.2 10.1 4.0
FIN 1 0.0 0.5 0.0 0.5 0.2
S 1 0.3 0.7 0.0 0.9 0.4
UK 4.3 7.4 0.3 11.9 4.8
Source: Eurostat.
%
(1) Dans la "Région nordique", pour laquelle le volume de PPP s’élevait à 543 tonnes en 1996, la ventilation est la suivante : 69 % pour DK, 11 % pour FIN et 20 % pour S.
Fongicides Herbicides Insecticides TOTAL
3.3 Principales cultures traitées au moyen de PPP
En termes de volume de MA, la majorité (60 %) des PPP utilisés est destinée à des cultures spéciales. 46 % duvolume total de MA utilisé dans l’UE sont consacrés à la vigne, qui couvre 3,6 millions ha (7 % de la superficiecultivée de référence). Bien que la superficie de base consacrée aux cultures spéciales (6,3 millions ha, soit12 % de la superficie cultivée de référence) soit considérablement inférieure à celle des cultures de terresarables (45,2 millions ha, soit 88 % de la superficie cultivée de référence), ces cultures spéciales, en particuliercelle de la vigne, constituent toujours le marché principal des composés utilisés à haute dose tels que le soufreet le cuivre. En outre, les traitements doivent être répétés régulièrement pour éviter les nuisibles ou lesmaladies. Par exemple, pour lutter contre la tavelure des pommes de table cultivées dans les régions où le tauxélevé d’humidité est propice au développement de la maladie, jusqu’à 25 applications de fongicide peuvent êtrenécessaires sur l’ensemble de la campagne culturale.
Les cultures de terres arables ne nécessitent pas ce niveau d’attention dans la mesure où la récolte estdestinée soit à l’alimentation des animaux, soit à la transformation industrielle. Les céréales (blé et orge, enparticulier) couvrent 55 % de la superficie cultivée et représentent 19 % du volume de MA utilisé. Comme lescéréales constituent le principal marché cible pour les nouvelles MA efficaces à faible dose d’emploi (parexemple, les sulfonylurées ), le volume total de MA a diminué de 6,9 % de 1992 à 1996 et devrait plus oumoins rester à ce niveau dans les années à venir. Le maïs, qui se classe troisième pour ce qui est du volumede MA utilisé (10 %), représente essentiellement un marché pour les herbicides. Les fongicides ne sontemployés que comme composants dans le traitement des semences. L’ensemble des autres culturesreprésente 24 % du volume de MA (Graphique 3).
Les fongicides sont surtout utilisés pour les cultures spéciales (82 % du volume total de fongicides). Laviticulture fait le plus appel à eux (69 % du volume total) car la vigne doit être protégée contre les infectionsfongiques durant tout le cycle végétatif. Les maladies les plus dangereuses sont le mildiou de la vigne(Peronospora sp.), l’oïdium (Oidium tuckerii) et la pourriture grise (Botrytis cinerea).

Principaux résultats et commentaires au niveau de l’Union Européenne
A Pflanzenschutz / Plant protection / Protection des cultures 111
Appliqué par pulvérisation ou sous forme de poudre sèche, le soufre non seulement protège la vigne contrel’oïdium mais a également un effet acaricide sur les tétranyques. Dans l’arboriculture fruitière (8 % du volumede fongicides), l’accent est essentiellement mis sur la lutte contre la tavelure de la pomme (Venturia inaequalis)car les fruits portant des marques de tavelure ne peuvent être commercialisés comme pommes de table; ils nepeuvent qu’être vendus en vrac, à moindre prix, à l’industrie de transformation.
Les herbicides sont surtout utilisés dans les cultures de terres arables où ils représentent 69 % du volume totalde MA (Graphique 4). La principale préoccupation, en ce qui concerne les cultures de terres arables, est la luttecontre les mauvaises herbes en raison de la concurrence exercée par ces plantes adventices pour l’eau, lessubstances nutritives, etc., dont les cultures ont besoin. Ces dernières années, les céréaliers ont accordé uneplus grande attention à la lutte contre les maladies fongiques car le grain, infesté de champignonsmicroscopiques et utilisé pour nourrir les animaux, peut contenir des niveaux dangereux d’aflatoxines. Cesdernières sont des substances cancérigènes très toxiques qui peuvent être la cause d’avortements, parexemple chez les truies gestantes.
Les insecticides ne jouent qu’un rôle mineur au regard des volumes de PPP. Leur part dans les cultures deterres arables et les cultures légumières est respectivement de 4 % et 7 % de la totalité des agents chimiquesappliqués. Les principales cibles des insecticides, pour ce qui concerne l’arboriculture fruitière et la vigne, sontles larves de divers lépidoptères (papillons de nuit), les aphididés et les coccidés (Graphique 5).
Graphique 3: Evolution de l’utilisation totale de PPP, par type de culture pour l'UE, 1992 à 1996
0
40
80
120
160
1992 1993 1994 1995 1996
Cultures arables Cultures spécialesSource: Eurostat.
(en 1 000 t de MA)

Principaux résultats et commentaires au niveau de l’Union Européenne
112 Pflanzenschutz / Plant protection / Protection des cultures A
Graphique 4: Utilisation de PPP, par groupe de culturesde terres arables, UE en 1996
0.0
10.0
20.0
30.0
40.0
50.0
Céréales Betteraves à sucre Maïs Grainesoléagineuses
Pommes de terre
Fongicides InsecticidesHerbicidesSource: Eurostat.
(en 1 000 t de MA)
Graphique 5: Utilisation de PPP, par groupe de cultures spéciales, UE en 1996
0.0
20.0
40.0
60.0
80.0
100.0
120.0
Agrumes Raisins Fruits du verger Légumes
Fongicides InsecticidesHerbicidesSource: Eurostat.
(en 1 000 t de MA)
3.4 Groupes chimiques des PPP
Les substances classiques telles que le soufre et le cuivre représentent 41 % du volume total de MA Il a déjàété dit que le soufre et le cuivre sont utilisés par applications répétées, surtout sur les cultures fruitières et lavigne. En outre, les taux d’application de ces substances sont de loin supérieurs à ceux des produits modernes.Pour lutter contre l’oïdium, par exemple, il est courant d’utiliser des doses de plus de 5 kg de MA/ha pour lesoufre et de 3 kg de MA/ha pour le cuivre dans le cas de la lutte contre le mildiou de la vigne. Les fongicidesorganiques de contact sont appliqués à raison de 1 à 2 kg de MA/ha, alors que les fongicides systémiques telsque le carbendazime sont actifs à des doses d’emploi de 0,1 à 0,25 kg de MA/ha.
Les urées jouent un rôle majeur dans la lutte contre les adventices des céréales. L’isoproturon est l’herbicideuréique le plus fréquemment utilisé. Il est actif contre les graminées adventices annuelles ainsi que contre lesdicotylédones. Les herbicides à base de triazine sont utilisés pour lutter contre les adventices annuelles et

Principaux résultats et commentaires au niveau de l’Union Européenne
A Pflanzenschutz / Plant protection / Protection des cultures 113
vivaces, surtout dans les vergers et les vignobles, ainsi que pour lutter contre les adventices du maïs (Atrazine).Les chloro-acétanilides (Alachlor, Metolachlore, etc.) sont souvent employés comme herbicides sélectifs dansles champs de colza et de maïs.
Pour lutter contre les insectes nuisibles, les insecticides organo-phosphorés sont fréquemment utilisés enraison de leur prix intéressant (Parathion) et de leur large spectre d’action. Par ailleurs, ils se dégradentrapidement dans l’environnement. Ces dernières décennies, leur position sur le marché a été menacée par denouveaux insecticides, les pyréthrinoïdes de synthèse qui, contrairement aux insecticides organo-phosphorés souvent toxiques, présentent une très faible toxicité pour les mammifères et sont de ce fait classéscomme non dangereux, en particulier pour l’opérateur. En raison de leurs faibles doses d’emploi, lespyréthrinoïdes ne figurent pas parmi les groupes chimiques principaux en terme de volume utilisé.
Une liste complète des groupes chimiques avec les appellations courantes des matières actives est donnée enannexes A et B.
Tableau 3: Groupes chimiques représentant plus de 80 % du volume total de MA, pour l’UE, en 1996
Groupe chimique
1 Soufre inorganique 90.1 36.12 Triazines 18.3 7.33 Dithiocarbamates 15.5 6.24 Urées 12.8 5.15 Cuivre inorganique 11.1 4.46 Acides amino-phosphoriques 10.4 4.27 Azoles 9.0 3.68 Chloro-acétanilides 7.8 3.19 Morpholines 5.4 2.2
10 Acides phénoxycarboniques 5.4 2.111 Organo-phosphorés 4.9 2.012 Acides phthaliques 4.4 1.813 Dinitroanilines 3.6 1.414 Triazinones 3.3 1.3
Total 202.0 80.9
Volume de MA (en 1 000 t)
Part du volumede MA (%)
Tableau 4: Les dix MA les plus importantes, en volume, pour l’UE, en 1996 (ordre alphabétique)
Matière active Groupe chimique Action
Atrazine Triazines H 3.0Cuivre Cuivre inorganique F 4.4Fenpropimorph Morpholines F 1.3Glyphosate Acides amino-phosphoriques H 3.4Isoproturon Urées H 2.1Mancozèbe Dithiocarbamates F 3.8Metolachlore Chloro-acétanilides H 2.4Pendiméthaline Dinitroanilines H 1.3Soufre Soufre inorganique F, I 36.1Terbuthylazine Triazines H :
Total :
F = Fongicide; H = Herbicide; I = Insecticide
Part de volumede MA (%)
Source: Eurostat.

Principaux résultats et commentaires au niveau de l’Union Européenne
114 Pflanzenschutz / Plant protection / Protection des cultures A
Tableau 5: Les dix groupes chimiques de fongicides les plus importants, en volume, pour l’UE, en 1996
Groupe chimiquedes fongicides
1 Soufre inorganique 87.4 58.72 Dithiocarbamates 15.5 10.43 Cuivre inorganique 11.1 7.44 Azoles 9.0 6.15 Morpholines 5.4 3.76 Acides phthaliques 4.4 2.97 Phosphates d'éthyle 3.1 2.18 Urées 2.7 1.89 Acylalanines 2.1 1.4
10 Benzimidazoles 1.7 1.1
Total 142.5 95.7
Part du volumede MA (%)
Volume de MA(en 1 000 t)
(ordre alphabétique)
Appellation courantedes fongicides
Groupe chimique
Cuivre Cuivre inorganique 7.4Cymoxanil Urées :Fenpropimorph Morpholines 2.2Folpel Acides phthaliques 1.7Fosetyl Phosphates d'éthyle 2.1Mancozèbe Dithiocarbamates 6.4Métalaxyl Acylalanines :Métirame Dithiocarbamates 1.3Propiconazole Azoles 1.5Soufre Soufre inorganique 58.7
Total :
Tableau 6: Les dix MA des fongicides les plus importantes, en volume, pour l’UE, en 1996
Part du volumede MA (%)
Tableau 7: Les dix groupes chimiques d’herbicides les plus importants, en volume, pour l’UE, en 1996
Groupe chimiquedes herbicides
1 Triazines 18.0 21.02 Acides amino-phosphoriques 10.4 12.13 Urées 10.0 11.64 Chloro-acétanilides 7.8 9.15 Acides phénoxycarboniques 5.4 6.26 Dinitroanilines 3.6 4.27 Triazinones 3.3 3.88 Thiocarbamates 3.3 3.89 Diazines 2.5 2.9
10 Hydroxybenzonitrils 2.2 2.6
Total 66.5 77.3
Part (%)Volume de MA
(en 1 000 t)
Source: Eurostat.

Principaux résultats et commentaires au niveau de l’Union Européenne
A Pflanzenschutz / Plant protection / Protection des cultures 115
Tableau 8: Les dix MA d’herbicides les plus importantes, en volume, pour l’UE, en 1996 (ordre alphabétique)
Appellation courantedes herbicides
Groupe chimique
Atrazine Triazines 8.6Chlorotoluron Urées 3.1Glyphosate Acides amino-phosphoriques 10.0Isoproturon Urées 6.0Métamitrone Triazinones 3.5Metolachlore Chloro-acétanilides 6.9Pendiméthaline Dinitroanilines 3.7Pyridate Diazines 2.9Simazine Triazines 2.4Terbuthylazine Triazines :
Total :
Part (%)
Tableau 9: Les dix groupes chimiques d’insecticides les plus importants, en volume, pour l’UE, en 1996
Groupe chimiquedes insecticides
1 Organo-phosphorés 4.8 32.62 Huiles minérales : :3 Soufre inorganique 2.6 17.94 Carbamates 1.4 9.45 Pyréthroïdes 0.7 4.56 Oxime-carbamates 0.4 2.77 Cyclodiènes organochlorés 0.3 2.28 Biologiques 0.1 1.09 Benzoylurées 0.1 0.9
10 Benzilates 0.1 0.9
Total : :
Volume de MA(en 1 000 t)
Part (%)
Tableau 10: Les dix MA d’insecticides les plus importantes, en volume, pour l'UE en 1996 (ordre alphabétique)
Appellation courantedes insecticides
Groupe chimique
Chlorpyrifos Morpholines 3.0Diazinon Morpholines :Diméthoate Morpholines 2.2Endosulfan Cyclodiènes organochlorés 2.2Furathiocarb Carbamates :Imidaclopride Organiques 2.1Méthidathion Organo-phosphorés :Huile minérale Huiles minérales :Parathion Organo-phosphorés 2.8Soufre Soufre inorganique 17.9
Total 64.4
Part (%)
Source: Eurostat.

4
COMMENTAIRES PAR ETAT MEMBRE

Commentaires par Etat Membre
A Pflanzenschutz / Plant protection / Protection des cultures 119
Belgique / Luxembourg
La superficie totale de terres arables et de cultures permanentes en Belgique était de 790 mille21 hectares en1996. Les cultures déclarées dans l’enquête sur les PPP occupent environ 91 % (721 mille ha ) de cettesuperficie cultivée totale. Alors que la superficie céréalière a diminué de 8 % depuis 1992, dans le mêmetemps, celle du maïs a augmenté de 25 %.
Sur le volume total de MA utilisées en 1996, 39 % étaient des fongicides, 55 % des herbicides et seulement5 % des insecticides. Exception faite des fluctuations saisonnières dues à l’incidence variable des nuisibles etdes maladies, ces pourcentages ont été relativement constants.
En Belgique, l’utilisation totale de PPP-MA sur les terres cultivées est d’environ 4,6 kg/ha. Les principalescultures faisant l’objet d’applications de PPP à forte dose sont les arbres fruitiers (22,8 kg de MA/ha ) et lapomme de terre (12,1 kg de MA/ha ). La lutte contre la brunissure de la pomme de terre (Phytophthora sp. ) etla tavelure de la pomme (Venturia sp. ) est la principale préoccupation des producteurs de pommes de terre etde pommes.
Les céréales restent en tête des cultures traitées pour ce qui concerne le volume total de MA : avec une part de35 %, elles devancent la pomme de terre (23 %). Globalement, entre 1996 et 1992, l’utilisation des PPP-MA adiminué de 8,5 %. Il est à noter que l’atrazine représente encore 44 % des volumes d’herbicides appliqués surle maïs.
Utilisé pour les céréales et la pomme de terre, le prosulfocarb est la principale MA herbicide en termes devolume. Par contre, le métamitrone et le chloridazone sont les herbicides les plus fréquemment employés pourla betterave sucrière. Le mancozèbe domine nettement le marché des fongicides pour la pomme de terre.
Danemark
La superficie cultivée couverte par la présente étude représente 73 % de la superficie totale consacrée auxcultures des terres arables et aux cultures permanentes. Les cultures qui n’ont pas été prises en considérationdans cette enquête mais qui font partie de la production au Danemark sont essentiellement des prairiespermanentes et temporaires. Par ailleurs, les cultures horticoles, qui occupent une place importante auDanemark, n’entrent pas dans le cadre de cette étude.
Au total, le volume de PPP-MA utilisé au Danemark a diminué de 7,1 % entre 1992 et 1996. Les volumes defongicides (41 %) et d’herbicides (57 %) sont restés relativement constants l’un par rapport à l’autre pendant lapériode de référence. Les insecticides représentent généralement moins de 2 % du volume de MA. Lorsqu’onconsidère le volume total de MA déclaré pour le Danemark, il faut garder à l’esprit que certaines entreprisesn’ont pas ventilé leurs chiffres par Etat Membre pour la “région Nord”. Si, pour cette dernière, 69 % du volumetotal de MA étaient attribués au Danemark, le volume total de MA pour ce pays passerait d’environ 3 279 à3 654 tonnes.
En raison de l’importance mineure des cultures spéciales faisant appel aux PPP-MA dans cette enquête,l’utilisation moyenne de ces derniers est plutôt faible (seulement 2,1 kg/ha).
Les céréales occupent une place prédominante pour ce qui concerne les terres arables (84 % de la superficietotale) et le volume de PPP-MA (72 % du volume global).
Les agriculteurs utilisent surtout les PPP pour lutter contre l’oïdium et les adventices.
21 NewCronos/Eurofarm – données 1996.

Commentaires par Etat Membre
120 Pflanzenschutz / Plant protection / Protection des cultures A
Les fongicides appartenant aux groupes des morpholines et azoles, qui sont utilisés pour lutter contre lesmaladies des céréales, représentent la part la plus importante du marché danois des produits phytosanitaires.Le manèbe a été utilisé jusqu’en 1995 pour lutter contre la brunissure de la pomme de terre. Par la suite, lefournisseur a remplacé ce produit par le mancozèbe. En raison de l’année de référence (1996), le manèben’apparaît pas dans la liste des principaux fongicides utilisés pour la pomme de terre.
Allemagne
En Allemagne, l’évolution des superficies cultivées reflète plus ou moins les exigences du programme deréduction des superficies imposé par la réforme de la PAC. Ainsi, en 1996, les superficies consacrées auxcéréales et aux graines oléagineuses (surtout le colza) étaient respectivement inférieures de 4,1 % et 15,8 % àcelles de 1992. Les cultures couvertes par le présent rapport représentent 70 % de la superficie cultivée priseen compte dans les statistiques. Sinon, aucun changement significatif n’a été constaté dans la superficieagricole utilisée totale.
En termes de volume, le marché allemand des PPP est nettement dominé par les herbicides dont la part étaitde 68 % en 1996. Celle des fongicides était de 31 % et celle des insecticides, 1 %.
L’utilisation de PPP-MA par ha de cultures des terres arables ou de cultures permanentes est également stable(environ 3,2 kg/ha pour la période de référence). En raison des applications séquentielles concernantessentiellement les fongicides, l’utilisation de MA est plutôt élevée dans les vignes (27,3 kg/ha) et les arbresfruitiers (12,5 kg/ha). Les fluctuations de volumes pendant la période de référence sont essentiellementimputables à l’incidence variable des maladies due aux conditions climatiques.
D’une manière générale, l’utilisation des herbicides dans la vigne a considérablement diminué. On constate, enrevanche, une augmentation importante de l’utilisation des fongicides à base de soufre et de cuivre (+ 161 %),probablement en raison de la promotion des principes de production de l’agriculture biologique.
Suite à la réforme de la PAC, le volume total de MA est tombé à 21 851 tonnes en 1994, surtout pour lescéréales (recul de 10,2 % entre 1992 et 1994) et les graines oléagineuses (recul de 17,4 %) qui étaientparticulièrement visées par la réforme. Les volumes ont ensuite suivi une courbe ascendante pour être, en1996, de 11,1 % supérieurs à ceux de 1992.
Le marché des PPP en Allemagne est dominé par le blé, l’orge et le maïs (essentiellement du maïs fourrager àensiler) pour ce qui est de la superficie traitée (57 % pour les céréales et 20 % pour le maïs) et du volume totalutilisé (45 % pour les céréales et 22 % pour le maïs).
Les matières actives les plus utilisées sont l’isoproturon (IPU), un herbicide de lutte contre les graminéesadventices dans les céréales, le terbuthylazine, le pyridate et le metolachlore, des herbicides pour les champsde maïs, le métamitrone pour la betterave sucrière et le soufre dans les vignes.
Grèce
En Grèce, la superficie cultivée prise en considération dans cette enquête ne représente qu’environ 44 % de lasuperficie statistique déclarée pour les cultures des terres arables et les cultures permanentes. La superficierestante, non couverte par cette enquête, concerne des prairies permanentes, la production d’olives et de fruitsfrais autres que les fruits de table à pépins et à noyau, ainsi que diverses cultures mineures qui, bienqu’importantes sur le marché local, ne jouent qu’un rôle mineur en ce qui concerne l’utilisation de PPP. Unesuperficie totale de 1,7 millions d’hectares est considérée comme superficie de référence pour ce rapport.

Commentaires par Etat Membre
A Pflanzenschutz / Plant protection / Protection des cultures 121
Les fongicides représentent la part principale du marché des PPP (84 % en 1996).Compte tenu de l’importance de la viticulture, la dose nationale moyenne de PPP est de 6,0 kg de MA/ha. Lavigne représente 78 % du volume total de MA. Pour cette culture, l’utilisation moyenne de PPP-MA est de 60,8kg/ha, la matière active étant essentiellement le soufre (94 %).
Alors que la culture du blé et de l’orge est la plus importante (1,0 million ha, 58 % de la superficie cultivéetotale), elle n’a qu’une incidence marginale en ce qui concerne l’utilisation des PPP (1 % du volume total). Pourles céréales, cette dernière a toutefois augmenté de 149 % pendant la période de référence, probablement enraison de l’accroissement de la rentabilité de cette culture en Grèce après la réforme de la PAC.
L’utilisation des PPP dans la culture de la betterave sucrière a elle aussi considérablement augmenté (de80 %), apparemment en raison des applications fréquentes de soufre pour lutter contre l’oïdium.
En termes de volume, le soufre se place loin devant toutes les autres MA puisqu’il représente 73 % del’utilisation totale de MA dans l’agriculture grecque.
Espagne
Les cultures présentées dans ce rapport couvrent 48 % de la superficie statistique des cultures des terresarables et des cultures permanentes en Espagne. Les cultures n’entrant pas dans ce cadre sont celles del’olive, du riz et des légumes secs qui, bien que très importantes pour l’Espagne, ne le sont pas dans la majoritédes Etats Membres de l’UE.
Le marché espagnol des PPP est nettement dominé par les fongicides dont la part du volume total de MA sesituait entre 61 % (1995 et 1996) et 71 % (1992 et 1993), surtout en raison des grandes quantités de soufreemployées. La part des herbicides se situait entre 21 % (1992) et 26 % (1996) et celle des insecticides entre8 % (1992) et 16 % (1995).
Pendant la période de référence, l’utilisation moyenne globale de PPP a été relativement constante puisqu’ellen’a varié que de 2,5 à 2,7 kg de MA/ha. Les céréales ne « consomment » que 0,5 kg de MA/ha contre 11,3 kgpour la vigne.
Alors que les céréales représentent 58 % de la superficie cultivée couverte dans ce rapport, le volume de PPP-MA utilisé pour les céréales ne représente que 10 % du volume total. Les cultures qui font le plus appel auxPPP sont la viticulture et la culture des agrumes qui, ensemble, représentent 61 % du volume total de PPP-MA.Il n’y a eu aucune modification significative des volumes globaux de PPP-MA utilisés en Espagne pendant lapériode de référence. Si on considère les cultures individuellement, l’utilisation des herbicides a augmenté pourle maïs tout comme celle des fongicides pour la pomme de terre et la betterave sucrière.
Le soufre est la matière active la plus employée pour la protection des cultures en Espagne. Il sertessentiellement à lutter contre l’oïdium et le tétranyque rouge de la vigne, des arbres fruitiers et des légumes.Le glyphosate est le principal herbicide appliqué à la vigne. Des quantités considérables d’huile minérale ontété utilisées pour lutter contre les coccidés et les acariens dans la culture des agrumes (25 % de la totalité desPPP pour cette dernière).
France
Dans l’Union Européenne, la France constitue le marché le plus important pour les PPP. Sa part du volumetotal de MA dans l’UE est de 37 %.
Cette étude couvre 70 % de la superficie statistique totale des cultures des terres arables et des culturespermanentes. Le blé et l’orge couvrent 48 % de la superficie déclarée. Les principales cultures non prises en

Commentaires par Etat Membre
122 Pflanzenschutz / Plant protection / Protection des cultures A
compte dans ce contexte sont les prairies permanentes et temporaires ainsi que les fourrages verts permanentset temporaires.
Les fongicides représentent 58 % du volume total de MA et les herbicides 38 %. Les volumes globaux dematières actives ont baissé de 13,5 % en 1994 par rapport à 1992, en grande partie en raison des stratégies deréduction des coûts et des tarifs adoptées après la réforme de la PAC. La quantité de fongicides utilisée adiminué grâce à une moindre incidence des maladies due à la sécheresse mais elle est repartie à la haussepour atteindre ses niveaux initiaux.
Pendant la période de référence, l’utilisation moyenne de PPP-MA par hectare est restée plus ou moinsconstante entre 5,8 et 6,9 kg/ha, ce qui s’explique essentiellement par la position dominante de la viticulture etde l’arboriculture fruitière qui nécessitent des applications séquentielles de fongicides. Dans la vigne, le recoursà de multiples applications de fongicides pour lutter contre le mildiou et le Botrytis porte le taux d’utilisation parhectare à 50,5 kg par période de végétation. La lutte contre les fusarioses et la phytophtoriose de la pomme deterre et contre la tavelure et l’oïdium des fruits exige également de multiples applications de fongicides pendantla période de végétation, ce qui entraîne des niveaux élevés de MA par ha (13,9 kg/ha pour la pomme de terreet 36,0 kg/ha pour les fruits du verger).
En France, la vigne représente 51 % du volume total de PPP-MA utilisé contre 29 % pour le blé, l’orge et lemaïs (maïs grains et maïs fourrager). Le reste concerne les arbres fruitiers (7 %), les graines oléagineuses(5 %), la betterave sucrière, les légumes et la pomme de terre (3 % chacun).
Le soufre est la matière active la plus utilisée dans la vigne. Pour les céréales, le glyphosate et l’isoproturonsont les herbicides les plus fréquemment appliqués pour lutter contre les graminées adventices. Alors quel’isoproturon est un herbicide sélectif, le glyphosate est généralement utilisé après la récolte pour détruire lechiendent (Agropyron) ou pour désherber les terres gelées remises en culture. L’atrazine conserve une positiondominante dans la lutte contre les adventices du maïs.
Irlande
Sur les 1,4 million d'hectares consacrés aux cultures des terres arables et aux cultures permanentesenregistrés pour l’Irlande, 24 % seulement sont considérés comme superficie de référence dans la présenteenquête. La majeure partie de la superficie cultivée prise en compte par les statistiques est occupée par desprairies et des pâturages permanents et temporaires qui ne sont pas concernés par l’utilisation des PPP.Aucune donnée n’est fournie pour l’emploi de PPP sur les arbres fruitiers en Irlande.
Les herbicides et les fongicides représentent respectivement 54 % et 45 % du volume global de MA.
En moyenne, à l’échelle nationale, l’utilisation totale de PPP est de 1,6 kg de MA/ha. Toutefois, la doseindiquée pour la pomme de terre (2,7 kg/ha) semble trop faible, compte tenu de l’incidence de la brunissure dela pomme de terre et de la nécessité d’appliquer des fongicides.
Les principales cultures concernées par les PPP sont le blé et l’orge, qui représentent 65 % du volume total deMA. La deuxième grande culture cible est la pomme de terre (fongicides surtout)
Le propachlore est le principal herbicide utilisé pour lutter contre les mauvaises herbes des légumes (brassica).En ce qui concerne les céréales, le glyphosate se classe en tête pour le « nettoyage » de présemis sur lessurfaces gelées ou pour lutter contre le chiendent après la récolte.
Commentaires par Etat Membre
A Pflanzenschutz / Plant protection / Protection des cultures 123
Italie
Les cultures prises en considération dans ce rapport représentent 57 % de la totalité de la superficie cultivéestatistique en Italie. Il n’est pas tenu compte des superficies occupées par certaines cultures importantes tellesque les cultures fourragères annuelles, les olives, les noix, le soja et le riz. La superficie de référence totalepour ce rapport est de 6,2 millions d’hectares.
En raison des grandes quantités de soufre appliquées, les fongicides sont de loin les produits phytosanitairesles plus utilisés (77 % du volume total de PPP). La part des herbicides est de 13 % et celle des insecticides de10 %.
La dose moyenne nationale calculée à partir des données présentées est d’environ 9,3 kg de MA/ha. La partdes céréales (0,4 kg/ha) est négligeable. La vigne et les arbres fruitiers sont les plus importants utilisateurs deMA/ha (41,0 et 27,6 kg, respectivement).
Les PPP sont surtout utilisés pour la vigne (66 %) et les arbres fruitiers (14 %) qui, ensemble, représentent 80% du volume total de MA. Bien que leur culture occupe 46 % de la superficie de référence, les céréales nereprésentent que 2 % du volume total de MA.
Comme dans de nombreux autres marchés des PPP dominés par la vigne, le soufre représente la majeurepartie (55 %) du volume de MA utilisé en Italie et 77 % du volume de MA utilisé dans la vigne. Le cuivre, quireprésente 11 % du total, vient au deuxième rang derrière le soufre.
Les Pays Bas
La superficie nationale totale des cultures des terres arables et des cultures permanentes ne comprend pas lessuperficies consacrées aux prairies et pâturages permanents ni celles qui sont utilisées pour l’horticulture et lescultures en serres. 87 % (soit 810 mille hectares) de la superficie de référence pour les cultures des terresarables et les vergers sont concernés par cette étude.
Aux Pays-Bas, la politique de réduction de l’utilisation des produits phytosanitaires adoptée en 1991 exigeait,pour 1995, une baisse de 35 % des quantités de MA utilisées par rapport à la période de référence de 1984-1988. Ce résultat a été obtenu en grande partie grâce à une réduction de l’utilisation des nématicides quioccupaient une position dominante sur le marché hollandais. Toutefois, les nématicides ne sont pas pris encompte dans ce rapport et de nombreuses cultures mineures faisant intensivement appel aux PPP n’ont pas étéincluses dans l’enquête. C’est pourquoi les résultats obtenus par le programme de réduction ne sont pasreflétés par cette étude dont il ressort, en fait, que les doses par hectare de PPP standard ont légèrementaugmenté pendant la période de référence.
Pendant l’année de référence 1996, la part des fongicides était de 50 % du volume total des MA, celle desherbicides, de 44 % et celle des insecticides, de 6 % .
L’enquête donne une moyenne nationale de 5,3 kg de MA/ha pour les cultures des terres arables et les culturespermanentes.
Ce sont les arbres fruitiers qui reçoivent les soins les plus intensifs, comme en témoignent les 26,1 kg de MA/hautilisés pendant une période de végétation. Pour les pommes de terre, la dose moyenne est de 10,3 kg deMA/ha.
La culture de la pomme de terre (45 % du volume total utilisé dans les cultures) est celle qui fait le plus appelaux PPP-MA. Ensemble, les céréales, le maïs et la betterave sucrière représentent 37 % du volume de PPP-MA.

Commentaires par Etat Membre
124 Pflanzenschutz / Plant protection / Protection des cultures A
Les fongicides pour la pomme de terre sont de loin le groupe de produits phytosanitaires le plus utilisé auxPays-Bas. Le mancozèbe, le manèbe et le fentin, qui représentent 67 % des PPP-MA appliqués à la culture dela pomme de terre, sont les matières actives les plus importantes. L’atrazine était l’herbicide le plus utilisé dansla culture du maïs.
Autriche
Selon les statistiques, la superficie totale des terres arables et des cultures permanentes en Autriche était de1,5 million d’hectares en 1996. Les cultures déclarées dans l’enquête sur les produits phytosanitaires (1 millionha) représentent environ 67 % de cette superficie totale cultivée.
La part des herbicides dans le volume total de MA est passée de 55 % en 1992 à 47 % en 1996. Par contre,celle des fongicides est passée de 42 % à 52 %. Les insecticides restent à un faible niveau (moins de 3 %).
Si, en 1996, on a utilisé en moyenne 1,0 kg de MA par hectare de céréales, cette dose a été de 12,3 kg deMA/ha pour le traitement de la vigne, en raison des grandes quantités de soufre (33 % du volume total) utiliséespour lutter contre le mildiou et l’oïdium. Ces substances étant classées comme produits chimiques « naturels »,ce qui autorise leur utilisation dans la production biologique, ce volume devrait rester à un niveau élevé.Globalement, une moyenne nationale de 2,2 kg de MA/ha a été utilisée dans les cultures déclarées.
Le marché des produits phytosanitaires est axé sur quatre cultures principales : la vigne (26 %), les céréales(24 %), le maïs (17 %) et la betterave sucrière (16 %). Ces quatre secteurs représentent 83 % du volume totalde MA utilisé.
Une comparaison du volume de MA utilisé en 1996 avec celui de 1992 fait ressortir une réduction de 21,0 %,surtout pour ce qui concerne les herbicides employés pour le traitement des céréales.
Ce résultat est essentiellement dû au remplacement du dicamba par les nouvelles sulfonylurées dans lescéréales, mais le retrait de l’atrazine dans le maïs et de l’isoproturon dans les céréales a également contribué àcette réduction du volume. Le soufre est la principale matière active employée dans la culture de la vigne et dela betterave sucrière. Il représente 63 % du volume total de fongicides utilisé en Autriche.
Portugal
Le présent rapport couvre 1,2 million d’hectares (41 %) sur les 2,9 millions de cultures des terres arables et decultures permanentes déclarées dans les statistiques nationales. Les céréales (24 %), le maïs (26 %) et lavigne (22 %) représentent 71 % de la superficie de référence. La culture de l’olive, les cultures fourragères etles herbages n’ont pas été pris en considération.
Les fongicides, essentiellement le soufre, représentent 73 % du volume total de PPP-MA utilisé au Portugal. Lapart des herbicides est de 25 % et celle des insecticides de 2 %.
La dose moyenne globale est passée de 5,3 à 8,4 kg de MA/ha pendant la période de référence, soit uneaugmentation de 61 % de 1992 à 1996. Cette progression a surtout été sensible dans la culture des céréales(+ 695 %) et celle de la pomme de terre (+ 111 %). L’utilisation des MA dans la culture des grainesoléagineuses, du maïs et de la vigne a également progressé de 84 %, 57 % et 56 % respectivement. Cetteaugmentation exceptionnelle est apparemment due aux faibles doses de fongicides utilisées dans les vignoblesen 1992, cette année ayant été caractérisée par une extrême sécheresse et une faible incidence des maladies.
Au Portugal, la viticulture représente 71 % du volume total de MA contre 27 % pour la culture des céréales, dumaïs, de la pomme de terre, des fruits et des légumes pris ensemble.
Commentaires par Etat Membre
A Pflanzenschutz / Plant protection / Protection des cultures 125
Le soufre (de loin), le cuivre et le propinèbe sont les principaux fongicides utilisés pour la vigne. Lapendiméthaline a gagné des parts substantielles du marché pour les céréales.
Les herbicides dérivés des acides phénoxycarboniques (2,4-D) ont apparemment été remplacés par desherbicides à base de sulfonylurées qui sont généralement appliqués à des doses considérablement plus faibles(de 20 à 30 g MA au lieu de 500 à 1 000 g pour les autres herbicides).
Finlande
En Finlande, la superficie totale consacrée aux cultures des terres arables et aux cultures permanentes est de2,2 millions d’hectares. La superficie prise en considération pour le présent rapport est de 735 mille hectares etelle concerne essentiellement les céréales (89 %), la betterave sucrière (5 %) et la pomme de terre (5 %). Leprésent rapport ne tient pas compte des prairies temporaires et permanentes, de la culture de l’avoine et decelle d’autres céréales ainsi que des cultures fourragères.
Les herbicides représentent 94 % du volume total de MA, la part des fongicides et des insecticides n’étantrespectivement que de 6 % et 1 %. Le marché finlandais des produits phytosanitaires est peu développépuisqu’il ne représente que 0,2 % du marché européen.
La dose totale de MA par hectare de terre cultivée est de 0,7 kg et elle concerne essentiellement la culture de labetterave sucrière.
Les céréales (65 %), la betterave sucrière (16 %) et la pomme de terre (13 %) représentent 94 % du volumetotal de MA utilisé en Finlande, essentiellement pour lutter contre les mauvaises herbes.
Les principaux composés employés pour le traitement des céréales sont le glyphosate, (contre le chiendentaprès la récolte ou pour désherber d’anciennes terres gelées), et le 2,4-MCPA (contre les adventices(dicotylédones) des céréales).
Suède
Il ressort des statistiques suédoises sur les superficies consacrées aux cultures des terres arables et auxcultures permanentes que des superficies considérables sont utilisées pour les pâturages et les prairiestemporaires. Ces cultures n’étant pas concernées par l’utilisation des PPP, la superficie de référence prise encompte pour ce rapport est de 948 mille hectares (34 % du total). La culture des céréales couvre 85 % de cettesuperficie, celle de la betterave sucrière 6 %, celle des graines oléagineuses (surtout le colza) 4 % et celle de lapomme de terre également 4 %. La superficie consacrée à la culture des graines oléagineuses est passée de138 mille hectares en 1992 à 41 mille en 1996.
Les herbicides sont les PPP les plus fréquemment utilisés en Suède. Leur part du volume total est de 70 %. Lerecours aux fongicides (27 %) reste important, en particulier pour les céréales et la pomme de terre. La part desinsecticides est de 2 % en moyenne.
Avec une dose nationale moyenne de 1,0 kg de MA/ha, la Suède se classe parmi les pays ayant les plus faiblestaux d’application par hectare. La dose appliquée dans les cultures maraîchères (18,9 kg de MA/ha) estessentiellement due à l’utilisation d’un herbicide, le propachlore, dans les cultures de brassica, notamment de lanavette.
Les céréales (61 %), la betterave sucrière (14 %) et les légumes, surtout la navette, (13 %) utilisent 88 % duvolume déclaré de MA, essentiellement sous forme d’herbicides.Surtout utilisé pour lutter contre le chiendent après la récolte, le glyphosate est l’herbicide le plus courammentappliqué. En ce qui concerne la pomme de terre, le mancozèbe et le métalaxyl sont les principaux fongicides de
Commentaires par Etat Membre
126 Pflanzenschutz / Plant protection / Protection des cultures A
lutte contre le mildiou (Phytophthora sp.), la fusariose (Fusarium sp). et l’alternariose (Alternaria sp.). Lemétamitrone est l’herbicide le plus couramment employé pour la betterave sucrière, tout comme le propachlorepour les légumes (surtout les brassica).
Royaume Uni
La superficie de référence pour les pesticides correspond à 69 % de la superficie totale consacrée aux culturesdes terres arables et aux cultures permanentes. Avec 53 % de cette superficie totale et 76 % de la superficie deréférence prise en considération pour le présent rapport, les céréales sont de loin les cultures les plusimportantes. La culture du maïs fourrager est de plus en plus pratiquée : la superficie utilisée pour le maïs àensiler et le maïs fourrager a augmenté de 119 % durant la période de référence. Suite à la réforme de la PACen 1992, la superficie consacrée au colza s’est stabilisée à 356 mille hectares en 1996. En 1996, la part desfongicides dans le volume total des MA était de 36 %, alors que celle des herbicides était de 62 % et celle desinsecticides de 3 %.
Au Royaume-Uni, la moyenne nationale de 2,8 kg de MA/ha correspond à celle des pays européens pratiquantsurtout les cultures de terres arables. Les PPP sont utilisés de manière très intensive pour lutter contre latavelure et l'oïdium des arbres fruitiers (10,8 kg de MA/ha) et contre le mildiou (Phytophtra), l'alternariose(Alternaria) et la fusariose (Fusarium) de la pomme de terre (6,1 kg de MA/ha). Les céréales représentent 71 %du volume total de MA utilisé au R.-U.. Ensemble, la pomme de terre (9 %), la betterave sucrière (7 %) et lesgraines oléagineuses – colza – (4 %) représentent 20 % du volume total.
La lutte contre les mauvaises herbes dans les céréales, la betterave sucrière et le colza explique que lesherbicides représentent 62 % du volume total de PPP-MA. Les fongicides sont surtout utilisés dans les céréalespour lutter contre l’oïdium et diverses autres maladies des feuilles et des épis. La lutte contre la brunissure de lapomme de terre (Phytophthora) et Alternaria sont indispensables à la production de pommes de terre. Lesinsecticides sont surtout appliqués pour lutter contre les aphididés dans la betterave sucrière, les légumineuseset autres cultures maraîchères.
L’isoproturon et le glyphosate (céréales), le mancozèbe (pomme de terre), le métamitrone (betterave sucrière)et le métazachlore (colza) sont les herbicides les plus utilisés. En raison de l’accroissement de la superficieconsacrée à la culture du maïs, l’utilisation de l’atrazine a progressé pendant la période de référence.

5
DETAILLIERTE TABELLEN NACH EBENEDER EUROPÄISCHEN UNION
DETAILED TABLES ATEUROPEAN UNION LEVEL
TABLEAUX DÉTAILLÉS AU NIVEAUDE L’UNION EUROPÉENNE

EU-15
A Pflanzenschutz / Plant protection / Protection des cultures 129
(in Tonnen Wirkstoff) (en tonnes de MA)
1992 1993 1994 1995 1996
EU-15 231 524 235 487 227 218 248 145 249 646
B/L 3 616 3 179 3 246 3 571 3 310
DK 3 798 3 512 3 464 3 375 3 279
D 24 383 21 944 21 851 25 506 27 082
EL 9 888 9 922 9 968 10 121 10 371
E 28 348 26 454 26 814 25 634 26 662
F 86 686 85 091 74 941 90 881 91 233
IRL 561 439 463 531 529
I 48 869 58 301 57 927 58 763 57 195
NL 4 034 3 846 4 024 4 168 4 259
A 2 853 3 055 2 541 2 594 2 254
P 6 246 7 933 9 259 9 504 10 086
FIN 390 359 327 531 533
S 670 614 787 865 950
UK 11 181 10 837 11 605 12 102 11 906
Eingesetzte Mengen anPflanzenschutzmittelnTabelle EU - 1.1
Volume of PPP usedTable EU - 1.1
Volume de PPP utiliséTableau UE - 1.1
(in tonnes of AI)
1992 1993 1994 1995 1996
EU-15 100 102 98 107 108
B/L 100 88 90 99 92
DK 100 92 91 89 86
D 100 90 90 105 111
EL 100 100 101 102 105
E 100 93 95 90 94
F 100 98 86 105 105
IRL 100 78 83 95 94
I 100 119 119 120 117
NL 100 95 100 103 106
A 100 107 89 91 79
P 100 127 148 152 161
FIN 100 92 84 136 136
S 100 92 117 129 142
UK 100 97 104 108 106
Index der eingesetzten Mengenan PflanzenschutzmittelnTabelle EU - 1.2
Index of volumeof PPP usedTable EU - 1.2
Indice de volumede PPP utiliséTableau UE - 1.2
(1992 = 100)
Quelle / Source: Eurostat.

EU-15
130 Pflanzenschutz / Plant protection / Protection des cultures A
(in Tonnen Wirkstoff) (en tonnes de MA)
1992 1993 1994 1995 1996
EU-15 139 663 148 339 133 644 146 070 148 907
B/L 1 596 1 286 1 410 1 557 1 307
DK 1 779 1 548 1 484 1 360 1 341
D 8 888 7 819 6 803 8 900 8 396
EL 8 260 8 451 8 429 8 608 8 743
E 20 141 18 867 16 571 15 679 16 361
F 53 632 54 952 43 591 53 289 53 206
IRL 270 248 209 232 239
I 33 251 42 304 41 103 42 010 44 142
NL 2 087 1 882 2 258 2 290 2 139
A 1 205 1 203 999 1 014 1 173
P 4 633 5 788 6 718 6 779 7 313
FIN 41 44 34 23 30
S 215 99 178 199 260
UK 3 667 3 848 3 856 4 131 4 256
EingesetzteFungizidmengenTabelle EU - 1.3
Volume offungicide used
Table EU - 1.3
Volume defongicides utilisé
Tableau UE - 1.3
(in tonnes of Al)
1992 1993 1994 1995 1996
EU-15 100 106 96 105 107
B/L 100 81 88 98 82
DK 100 87 83 76 75
D 100 88 77 100 94
EL 100 102 102 104 106
E 100 94 82 78 81
F 100 102 81 99 99
IRL 100 92 78 86 89
I 100 127 124 126 133
NL 100 90 108 110 102
A 100 100 83 84 97
P 100 125 145 146 158
FIN 100 108 83 56 74
S 100 46 83 93 121
UK 100 105 105 113 116
Index der eingesetztenFungizidmengenTabelle EU - 1.4
Index of volumeof fungicide used
Table EU - 1.4
Indice de volumede fongicide utilisé
Tableau UE - 1.4
(1992 = 100)
Quelle / Source: Eurostat.

EU-15
A Pflanzenschutz / Plant protection / Protection des cultures 131
(in Tonnen Wirkstoff) (en tonnes MA)
1992 1993 1994 1995 1996
EU-15 75 559 69 858 74 293 83 473 86 037
B/L 1 833 1 731 1 683 1 841 1 828
DK 1 932 1 872 1 897 1 917 1 880
D 14 855 13 662 14 517 16 018 18 292
EL 1 108 1 005 1 042 1 036 1 150
E 5 874 5 443 6 092 5 966 6 799
F 29 696 25 867 27 500 33 913 34 577
IRL 272 189 251 296 286
I 7 567 7 357 8 004 8 250 7 265
NL 1 644 1 694 1 539 1 632 1 858
A 1 575 1 781 1 456 1 494 1 052
P 1 284 1 832 2 222 2 460 2 533
FIN 333 304 288 503 498
S 407 483 570 651 666
UK 7 177 6 637 7 231 7 497 7 352
EingesetzteHerbizidmengenTabelle EU - 1.5
Volume ofherbicide used
Table EU - 1.5
Volume d’herbicidesutilisé
Tableau UE - 1.5
(in tonnes of Al)
1992 1993 1994 1995 1996
EU-15 100 92 98 110 114
B/L 100 94 92 100 100
DK 100 97 98 99 97
D 100 92 98 108 123
EL 100 91 94 93 104
E 100 93 104 102 116
F 100 87 93 114 116
IRL 100 70 92 109 105
I 100 97 106 109 96
NL 100 103 94 99 113
A 100 113 92 95 67
P 100 143 173 191 197
FIN 100 91 86 151 149
S 100 119 140 160 164
UK 100 92 101 104 102
Index der eingesetztenHerbizidmengenTabelle EU - 1.6
Index of volumeof herbicide used
Table EU - 1.6
Indice de volumed'herbicides utilisé
Tableau UE - 1.6
(1992 = 100)
Quelle / Source: Eurostat.

EU-15
132 Pflanzenschutz / Plant protection / Protection des cultures A
(in Tonnen Wirkstoff) (en tonnes de MA)
1992 1993 1994 1995 1996
EU-15 16 301 17 290 19 281 18 602 14 703
B/L 187 163 153 172 174
DK 87 92 83 98 58
D 639 464 530 589 394
EL 520 467 496 477 478
E 2 333 2 144 4 151 3 990 3 501
F 3 359 4 272 3 850 3 679 3 449
IRL 20 2 3 3 5
I 8 052 8 640 8 820 8 503 5 789
NL 303 270 227 246 261
A 72 71 86 87 29
P 329 312 319 265 239
FIN 16 11 5 5 4
S 48 31 39 15 24
UK 337 351 519 474 298
EingesetzteInsektizidmengenTabelle EU - 1.7
Volume ofinsecticide used
Table EU - 1.7
Volume d’insecticidesutilisé
Tableau UE - 1.7
(in tonnes of Al)
1992 1993 1994 1995 1996
EU-15 100 106 118 114 90
B/L 100 87 82 92 93
DK 100 106 96 113 67
D 100 72 83 92 62
EL 100 90 95 92 92
E 100 92 178 171 150
F 100 127 115 110 103
IRL 100 8 15 17 24
I 100 107 110 106 72
NL 100 89 75 81 86
A 100 98 119 120 40
P 100 95 97 81 73
FIN 100 67 32 29 28
S 100 65 81 30 49
UK 100 104 154 141 89
Index der eingesetztenInsektizidmengenTabelle EU - 1.8
Index of volumeof insecticide used
Table EU - 1.8
Indice de volumed'insecticides utilisé
Tableau UE - 1.8
(1992 = 100)
Quelle / Source: Eurostat.

EU-15
A Pflanzenschutz / Plant protection / Protection des cultures 133
(in Tonnen Wirkstoff)
1992 1993 1994 1995 1996
Getreide Cereals Céréales 50 917 44 239 43 333 47 532 47 414Zuckerrüben Sugar beets Betteraves à sucre 8 766 8 625 8 435 9 310 9 589Mais Maize Maïs 23 128 20 317 21 507 23 896 26 191Ölsaat Oilseeds Graines oléagineuses 5 270 3 966 5 209 6 656 6 934Kartoffeln Potatoes Pommes de terre 11 262 10 457 10 637 10 846 10 620Zitrusfrüchte Citrus Agrumes 3 666 3 417 4 745 4 497 4 293Weintrauben Grapes Raisins 98 834 113 452 103 324 113 527 115 815Baumobst Tree fruits Fruits du verger 20 405 21 625 21 440 22 560 19 177Gemüse Vegetables Légumes 9 252 9 362 8 562 9 298 9 591
Insgesamt Total Total 231 524 235 487 227 218 248 145 249 646
Volume de PPP utiliséTableau UE - 2.1
(en tonnes de MA)
Eingesetzte Mengen anPflanzenschutzmittelnTabelle EU - 2.1
Volume of PPP usedTable EU - 2.1
(in tonnes of Al)
1992 1993 1994 1995 1996
Getreide Cereals Céréales 100 87 85 93 93Zuckerrüben Sugar beets Betteraves à sucre 100 98 96 106 109Mais Maize Maïs 100 88 93 103 113Ölsaat Oilseeds Graines oléagineuses 100 75 99 126 132Kartoffeln Potatoes Pommes de terre 100 93 94 96 94Zitrusfrüchte Citrus Agrumes 100 93 129 123 117Weintrauben Grapes Raisins 100 115 105 115 117Baumobst Tree fruits Fruits du verger 100 106 105 111 94Gemüse Vegetables Légumes 100 101 93 101 104
Insgesamt Total Total 100 102 98 107 108
Indice de volumede PPP utiliséTableau UE - 2.2
Index der eingesetzten Mengenan PflanzenschutzmittelnTabelle EU - 2.2
Index of volumeof PPP usedTable EU - 2.2
(1992 = 100)
1992 1993 1994 1995 1996
Getreide Cereals Céréales 22 19 19 19 19Zuckerrüben Sugar beets Betteraves à sucre 4 4 4 4 4Mais Maize Maïs 10 9 9 10 10Ölsaat Oilseeds Graines oléagineuses 2 2 2 3 3Kartoffeln Potatoes Pommes de terre 5 4 5 4 4Zitrusfrüchte Citrus Agrumes 2 1 2 2 2Weintrauben Grapes Raisins 43 48 45 46 46Baumobst Tree fruits Fruits du verger 9 9 9 9 8Gemüse Vegetables Légumes 4 4 4 4 4
Insgesamt Total Total 100 100 100 100 100
Pourcentage du volumede PPP utiliséTableau UE - 2.3
Anteil an der eingesetzten Mengenan PflanzenschutzmittelnTabelle EU - 2.3
Share of PPPvolume usedTable EU - 2.3
(%)
Quelle / Source: Eurostat.

EU-15
134 Pflanzenschutz / Plant protection / Protection des cultures A
(in Tonnen Wirkstoff)
1992 1993 1994 1995 1996
Getreide Cereals Céréales 21 573 17 088 14 598 15 130 15 416Zuckerrüben Sugar beets Betteraves à sucre 1 865 2 043 2 076 2 765 3 075Mais Maize Maïs 13 12 13 34 33Ölsaat Oilseeds Graines oléagineuses 1 109 810 1 085 1 577 1 657Kartoffeln Potatoes Pommes de terre 8 018 7 482 7 643 7 597 7 290Zitrusfrüchte Citrus Agrumes 772 652 717 615 779Weintrauben Grapes Raisins 88 318 101 913 90 454 99 607 102 472Baumobst Tree fruits Fruits du verger 11 448 12 176 11 692 12 826 12 078Gemüse Vegetables Légumes 6 522 6 137 5 341 5 896 6 084
Insgesamt Total Total 139 663 148 339 133 644 146 070 148 907
(en tonnes de MA)
EingesetzteFungizidmengenTabelle EU - 2.4
Volume offungicide used
Table EU - 2.4
(in tonnes of Al)
Volume defongicides utilisé
Tableau UE - 2.4
(in Tonnen Wirkstoff)
1992 1993 1994 1995 1996
Getreide Cereals Céréales 28 248 26 193 27 524 31 039 31 064Zuckerrüben Sugar beets Betteraves à sucre 6 079 5 916 5 643 5 839 5 842Mais Maize Maïs 21 970 18 550 19 705 22 781 25 072Ölsaat Oilseeds Graines oléagineuses 3 754 2 768 3 636 4 626 4 884Kartoffeln Potatoes Pommes de terre 2 478 2 276 2 309 2 519 2 690Zitrusfrüchte Citrus Agrumes 1 152 1 281 1 313 1 274 1 508Weintrauben Grapes Raisins 8 246 9 055 9 787 10 981 10 667Baumobst Tree fruits Fruits du verger 1 995 1 939 2 593 2 428 2 208Gemüse Vegetables Légumes 1 637 1 881 1 783 1 986 2 100
Insgesamt Total Total 75 559 69 858 74 293 83 473 86 037
(en tonnes de MA)
EingesetzteHerbizidmengenTabelle EU - 2.5
Volume ofherbicide used
Table EU - 2.5
(in tonnes of Al)
Volume d’herbicidesutilisés
Tableau UE - 2.5
(in Tonnen Wirkstoff)
1992 1993 1994 1995 1996
Getreide Cereals Céréales 1 095 959 1 212 1 363 934Zuckerrüben Sugar beets Betteraves à sucre 822 666 716 705 673Mais Maize Maïs 1 145 1 755 1 790 1 081 1 086Ölsaat Oilseeds Graines oléagineuses 407 388 487 452 393Kartoffeln Potatoes Pommes de terre 766 699 686 730 640Zitrusfrüchte Citrus Agrumes 1 741 1 485 2 716 2 608 2 006Weintrauben Grapes Raisins 2 270 2 484 3 082 2 939 2 676Baumobst Tree fruits Fruits du verger 6 962 7 509 7 156 7 306 4 890Gemüse Vegetables Légumes 1 093 1 344 1 438 1 417 1 407
Insgesamt Total Total 16 301 17 290 19 281 18 602 14 703
(en tonnes de MA)
EingesetzteInsektizidmengenTabelle EU - 2.6
Volume ofinsecticide used
Table EU - 2.6
(in tonnes of Al)
Volume d’insecticidesutilisés
Tableau UE - 2.6
Quelle / Source: Eurostat.

EU-15
A Pflanzenschutz / Plant protection / Protection des cultures 135
1992 1993 1994 1995 1996
EU-15 54 101 51 055 50 324 51 000 51 511
B/L 712 690 699 712 721
DK 1 812 1 650 1 598 1 645 1 707
D 8 743 8 348 8 331 8 361 8 498
EL 1 869 1 798 1 783 1 683 1 734
E 11 112 10 710 9 933 9 811 9 710
F 14 026 12 850 12 811 13 223 13 691
IRL 341 317 307 311 327
I 6 480 6 247 6 322 6 644 6 180
NL 798 765 791 793 810
A 1 042 1 030 1 032 959 1 002
P 1 188 1 146 1 157 1 216 1 194
FIN 638 637 675 699 735
S 950 958 947 895 948
UK 4 388 3 908 3 939 4 047 4 254
AnbauflächeTabelle EU - 3.1
Crop areaTable EU - 3.1
Superficie cultivéeTableau UE - 3.1
(1 000 ha)
1992 1993 1994 1995 1996
Getreide Cereals Céréales 30 082 27 173 26 817 27 567 28 433Zuckerrüben Sugar beets Betteraves à sucre 2 153 2 120 2 089 2 129 2 086Mais Maize Maïs 7 855 7 822 7 690 7 726 8 243Ölsaat Oilseeds Graines oléagineuses 5 234 5 612 5 549 5 164 4 899Kartoffeln Potatoes Pommes de terre 1 682 1 462 1 423 1 499 1 511Zitrusfrüchte Citrus Agrumes 355 357 355 544 533Weintrauben Grapes Raisins 3 934 3 771 3 671 3 603 3 553Baumobst Tree fruits Fruits du verger 994 991 985 963 937Gemüse Vegetables Légumes 1 813 1 749 1 746 1 805 1 316
Insgesamt Total Total 54 101 51 055 50 324 51 000 51 511
Superficie cultivéeTableau UE - 3.2
AnbauflächeTabelle EU - 3.2
Crop areaTable EU - 3.2
(1 000 ha)
Quelle / Source: Eurostat.

EU-15
136 Pflanzenschutz / Plant protection / Protection des cultures A
(kg Wirkstoff / ha)
1992 1993 1994 1995 1996
EU-15 4.3 4.6 4.5 4.9 4.8
B/L 5.1 4.6 4.6 5.0 4.6
DK 2.2 2.3 2.3 2.3 2.1
D 2.8 2.6 2.6 3.1 3.2
EL 5.3 5.5 5.6 6.0 6.0
E 2.6 2.5 2.7 2.6 2.7
F 6.2 6.6 5.8 6.9 6.7
IRL 1.6 1.4 1.5 1.7 1.6
I 7.5 9.3 9.2 8.8 9.3
NL 5.1 5.0 5.1 5.3 5.3
A 2.7 3.0 2.5 2.7 2.2
P 5.3 6.9 8.0 7.8 8.4
FIN 0.6 0.6 0.5 0.8 0.7
S 0.7 0.6 0.8 1.0 1.0
UK 2.5 2.8 2.9 3.0 2.8
(kg de MA / ha)(kg Al / ha)
Dosierung der eingesetztenPflanzenschutzmittelTabelle EU - 4.1
Dosage of PPP usedTable EU - 4.1
Dose de PPP utiliséeTableau UE - 4.1
(kg Wirkstoff / ha)
1992 1993 1994 1995 1996
Getreide Cereals Céréales 1.7 1.6 1.6 1.7 1.7Zuckerrüben Sugar beets Betteraves à sucre 4.1 4.1 4.0 4.4 4.6Mais Maize Maïs 2.9 2.6 2.8 3.1 3.2Ölsaat Oilseeds Graines oléagineuses 1.0 0.7 0.9 1.3 1.4Kartoffeln Potatoes Pommes de terre 6.7 7.2 7.5 7.2 7.0Zitrusfrüchte Citrus Agrumes 10.3 9.6 13.4 8.3 8.1Weintrauben Grapes Raisins 25.1 30.1 28.1 31.5 32.6Baumobst Tree fruits Fruits du verger 20.5 21.8 21.8 23.4 20.5Gemüse Vegetables Légumes 5.1 5.4 4.9 5.2 7.3
Insgesamt Total Total 4.3 4.6 4.5 4.9 4.8
Dose de PPP utiliséeTableau UE - 4.2
Dosierung der eingesetztenPflanzenschutzmittelTabelle EU - 4.2
Dosage of PPP usedTable EU - 4.2
(kg Al / ha) (kg de MA / ha)
Quelle / Source: Eurostat.

EU-15
A Pflanzenschutz / Plant protection / Protection des cultures 137
(kg Wirkstoff / ha)
1992 1993 1994 1995 1996
Getreide Cereals Céréales 0.7 0.6 0.5 0.5 0.5Zuckerrüben Sugar beets Betteraves à sucre 0.9 1.0 1.0 1.3 1.5Mais Maize Maïs 0.0 0.0 0.0 0.0 0.0Ölsaat Oilseeds Graines oléagineuses 0.2 0.1 0.2 0.3 0.3Kartoffeln Potatoes Pommes de terre 4.8 5.1 5.4 5.1 4.8Zitrusfrüchte Citrus Agrumes 2.2 1.8 2.0 1.1 1.5Weintrauben Grapes Raisins 22.5 27.0 24.6 27.6 28.8Baumobst Tree fruits Fruits du verger 11.5 12.3 11.9 13.3 12.9Gemüse Vegetables Légumes 3.6 3.5 3.1 3.3 4.6
Insgesamt Total Total 2.6 2.9 2.7 2.9 2.9
Dose de fongicides utiliséeTableau UE - 4.3
(kg de MA / ha)
Dosierung dereingesetzten FungizideTabelle EU - 4.3
Dosage of fungicide usedTable EU - 4.3
(kg Al / ha)
(kg Wirkstoff / ha)
1992 1993 1994 1995 1996
Getreide Cereals Céréales 0.9 1.0 1.0 1.1 1.1Zuckerrüben Sugar beets Betteraves à sucre 2.8 2.8 2.7 2.7 2.8Mais Maize Maïs 2.8 2.4 2.6 2.9 3.0Ölsaat Oilseeds Graines oléagineuses 0.7 0.5 0.7 0.9 1.0Kartoffeln Potatoes Pommes de terre 1.5 1.6 1.6 1.7 1.8Zitrusfrüchte Citrus Agrumes 3.2 3.6 3.7 2.3 2.8Weintrauben Grapes Raisins 2.1 2.4 2.7 3.0 3.0Baumobst Tree fruits Fruits du verger 2.0 2.0 2.6 2.5 2.4Gemüse Vegetables Légumes 0.9 1.1 1.0 1.1 1.6
Insgesamt Total Total 1.4 1.4 1.5 1.6 1.7
Dose d'herbicides utiliséeTableau UE - 4.4
(kg de MA / ha)
Dosierung dereingesetzten HerbizideTabelle EU - 4.4
Dosage of herbicide usedTable EU - 4.4
(kg Al / ha)
(kg Wirkstoff / ha)
1992 1993 1994 1995 1996
Getreide Cereals Céréales 0.0 0.0 0.0 0.0 0.0Zuckerrüben Sugar beets Betteraves à sucre 0.4 0.3 0.3 0.3 0.3Mais Maize Maïs 0.1 0.2 0.2 0.1 0.1Ölsaat Oilseeds Graines oléagineuses 0.1 0.1 0.1 0.1 0.1Kartoffeln Potatoes Pommes de terre 0.5 0.5 0.5 0.5 0.4Zitrusfrüchte Citrus Agrumes 4.9 4.2 7.7 4.8 3.8Weintrauben Grapes Raisins 0.6 0.7 0.8 0.8 0.8Baumobst Tree fruits Fruits du verger 7.0 7.6 7.3 7.6 5.2Gemüse Vegetables Légumes 0.6 0.8 0.8 0.8 1.1
Insgesamt Total Total 0.3 0.3 0.4 0.4 0.3
Dose d’insecticidesutilisée
Tableau UE - 4.5
(kg de MA / ha)
Dosierung dereingesetzten InsektizideTabelle EU - 4.5
Dosage of insecticide used
Table EU - 4.5
(kg Al / ha)
Quelle / Source: Eurostat.

6
HAUPTRESULTATE NACH EBENEDER MITGLIEDSTAATEN
MAIN RESULTS ATMEMBER STATE LEVEL
PRINCIPAUX RÉSULTATS AU NIVEAUDES ETATS MEMBRES

A Pflanzenschutz / Plant protection / Protection des cultures 141
TABLES OF REFERENCE
Table Country Page Table Country Page
Belgique-Belgïe / Luxembourg ItaliaB/L-1 Crops areas 142 I-1 Crops areas 174B/L-2 Dosage of PPP use by crop group: 142 I-2 Dosage of PPP use by crop group: 174B/L-3 Volume of PPP use by crop group: 143 I-3.x Volume of PPP use by crop group: 175B/L-4.x Top 5 of AL by crop group: 144 I-4.x Top 5 of AL by crop group: 176
Danmark NederlandDK-1 Crops areas 146 NL-1 Crops areas 179DK-2 Dosage of PPP use by crop group: 146 NL-2 Dosage of PPP use by crop group: 179DK-3.x Volume of PPP use by crop group: 147 NL-3.x Volume of PPP use by crop group: 180DX-4.x Top 5 of AL by crop group: 148 NL-4.x Top 5 of AL by crop group: 181
Deutschland ÖsterreichD-1 Crops areas 150 A-1 Crops areas 183D-2 Dosage of PPP use by crop group: 150 A-2 Dosage of PPP use by crop group: 183D-3.x Volume of PPP use by crop group: 151 A-3.x Volume of PPP use by crop group: 184D-4.x Top 5 of AL by crop group: 152 A-4.x Top 5 of AL by crop group: 185
Ellada PortugalEL-1 Crops areas 155 P-1 Crops areas 188EL-2 Dosage of PPP use by crop group: 155 P-2 Dosage of PPP use by crop group: 188EL-3.x Volume of PPP use by crop group: 156 P-3.x Volume of PPP use by crop group: 189EL-4.x Top 5 of AL by crop group: 157 P-4.x Top 5 of AL by crop group: 190
España FinlandE-1 Crops areas 160 FIN-1 Crops areas 193E-2 Dosage of PPP use by crop group: 160 FIN-2 Dosage of PPP use by crop group: 193E-3.x Volume of PPP use by crop group: 161 FIN-3.x Volume of PPP use by crop group: 194E-4.x Top 5 of AL by crop group: 162 FIN-4.x Top 5 of AL by crop group: 195
France SverigeF-1 Crops areas 165 S-1 Crops areas 197F-2 Dosage of PPP use by crop group: 165 S-2 Dosage of PPP use by crop group: 197F-3.x Volume of PPP use by crop group: 166 S-3.x Volume of PPP use by crop group: 198F-4.x Top 5 of AL by crop group: 167 S-4.x Top 5 of AL by crop group: 199
Ireland United KingdomIRL-1 Crops areas 170 UK-1 Crops areas 201IRL-2 Dosage of PPP use by crop group: 170 UK-2 Dosage of PPP use by crop group: 201IRL-3.x Volume of PPP use by crop group: 171 UK-3.x Volume of PPP use by crop group: 202IRL-4.x Top 5 of AL by crop group: 172 UK-4.x Top 5 of AL by crop group: 203

Belgique - Belgïe / Luxembourg
142 Pflanzenschutz / Plant protection / Protection des cultures A
1992 1993 1994 1995 1996
Getreide Cereals Céréales 303 292 283 285 278Zuckerrüben Sugar beets Betteraves à sucre 101 99 95 99 98Mais Maize Maïs 168 173 189 193 209Ölsaat Oilseeds Graines oléagineuses 7 6 8 8 7Kartoffeln Potatoes Pommes de terre 63 48 52 56 61Zitrusfrüchte Citrus Agrumes 0 0 0 0 0Weintrauben Grapes Raisins 1 1 1 1 1Baumobst Tree fruits Fruits du verger 14 14 14 14 15Gemüse Vegetables Légumes 55 57 56 56 52
Insgesamt Total Total 712 690 699 712 721
Gesamte Anbau-fläche für Acker-und Dauerkulturen
Total arable andpermanent croparea
Superficie totaledes cultures de terres arables etcultures perman.
872 884 1 011 938 915
AnbauflächeTabelle B/L - 1
Crop areaTable B/L - 1
(1 000 ha)
Superficie cultivéeTableau B/L - 1
(kg Wirkstoff / ha) (kg de MA / ha)
1992 1993 1994 1995 1996
Getreide Cereals Céréales 4.0 3.3 3.3 4.0 4.2Zuckerrüben Sugar beets Betteraves à sucre 3.6 3.8 4.1 4.0 4.2Mais Maize Maïs 2.8 2.6 2.4 2.8 2.5Ölsaat Oilseeds Graines oléagineuses 0.2 0.5 0.4 0.4 0.5Kartoffeln Potatoes Pommes de terre 15.7 18.2 18.0 16.7 12.1Zitrusfrüchte Citrus Agrumes - - - - -Weintrauben Grapes Raisins 0.0 0.0 0.2 0.2 0.1Baumobst Tree fruits Fruits du verger 33.5 26.9 28.3 28.6 22.8Gemüse Vegetables Légumes 2.5 2.4 2.4 2.6 2.5
Insgesamt Total Total 5.1 4.6 4.6 5.0 4.6
Dosierung der eingesetztenPflanzenschutzmittelTabelle B/L - 2
Dosage of PPP useTable B/L - 2
(kg AI / ha)
Dose de PPP utiliséTableau B/L - 2
Quelle / Source: Eurostat.
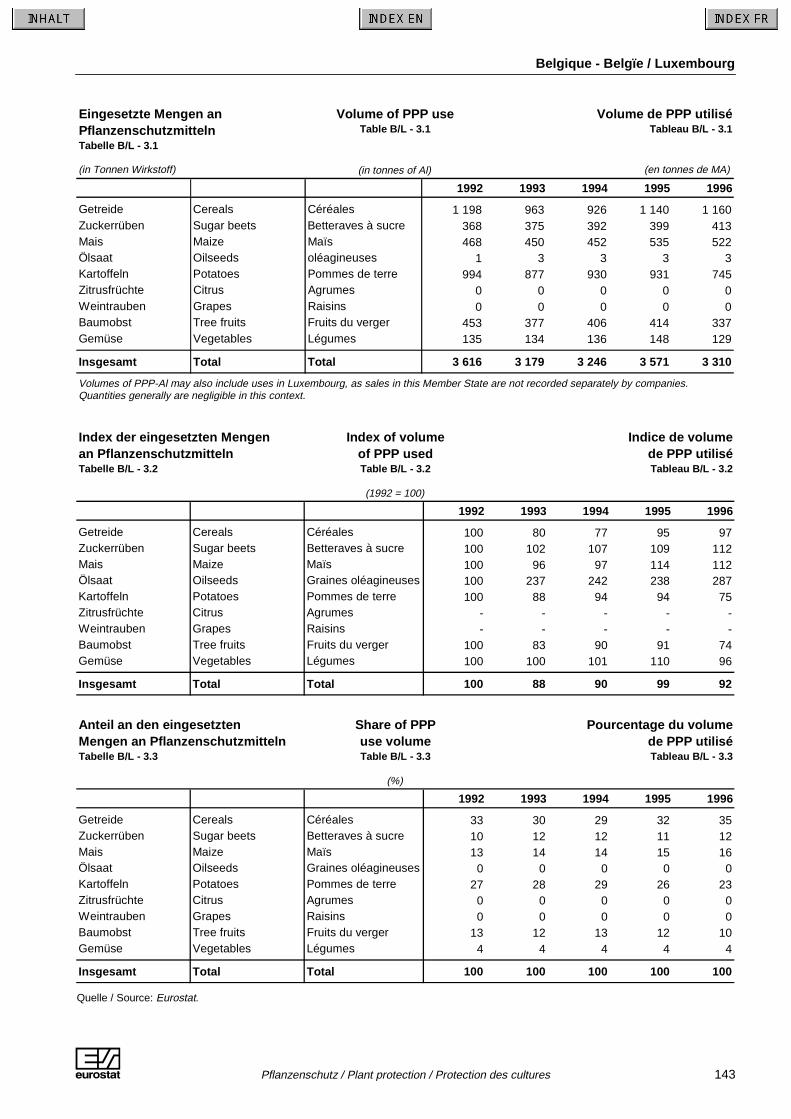
Belgique - Belgïe / Luxembourg
A Pflanzenschutz / Plant protection / Protection des cultures 143
(in Tonnen Wirkstoff) (en tonnes de MA)
1992 1993 1994 1995 1996
Getreide Cereals Céréales 1 198 963 926 1 140 1 160Zuckerrüben Sugar beets Betteraves à sucre 368 375 392 399 413Mais Maize Maïs 468 450 452 535 522Ölsaat Oilseeds oléagineuses 1 3 3 3 3Kartoffeln Potatoes Pommes de terre 994 877 930 931 745Zitrusfrüchte Citrus Agrumes 0 0 0 0 0Weintrauben Grapes Raisins 0 0 0 0 0Baumobst Tree fruits Fruits du verger 453 377 406 414 337Gemüse Vegetables Légumes 135 134 136 148 129
Insgesamt Total Total 3 616 3 179 3 246 3 571 3 310
Volumes of PPP-Al may also include uses in Luxembourg, as sales in this Member State are not recorded separately by companies.Quantities generally are negligible in this context.
Eingesetzte Mengen anPflanzenschutzmittelnTabelle B/L - 3.1
Volume of PPP useTable B/L - 3.1
(in tonnes of Al)
Volume de PPP utiliséTableau B/L - 3.1
1992 1993 1994 1995 1996
Getreide Cereals Céréales 100 80 77 95 97Zuckerrüben Sugar beets Betteraves à sucre 100 102 107 109 112Mais Maize Maïs 100 96 97 114 112Ölsaat Oilseeds Graines oléagineuses 100 237 242 238 287Kartoffeln Potatoes Pommes de terre 100 88 94 94 75Zitrusfrüchte Citrus Agrumes - - - - -Weintrauben Grapes Raisins - - - - -Baumobst Tree fruits Fruits du verger 100 83 90 91 74Gemüse Vegetables Légumes 100 100 101 110 96
Insgesamt Total Total 100 88 90 99 92
Index der eingesetzten Mengenan PflanzenschutzmittelnTabelle B/L - 3.2
Index of volumeof PPP usedTable B/L - 3.2
(1992 = 100)
Indice de volumede PPP utiliséTableau B/L - 3.2
1992 1993 1994 1995 1996
Getreide Cereals Céréales 33 30 29 32 35Zuckerrüben Sugar beets Betteraves à sucre 10 12 12 11 12Mais Maize Maïs 13 14 14 15 16Ölsaat Oilseeds Graines oléagineuses 0 0 0 0 0Kartoffeln Potatoes Pommes de terre 27 28 29 26 23Zitrusfrüchte Citrus Agrumes 0 0 0 0 0Weintrauben Grapes Raisins 0 0 0 0 0Baumobst Tree fruits Fruits du verger 13 12 13 12 10Gemüse Vegetables Légumes 4 4 4 4 4
Insgesamt Total Total 100 100 100 100 100
Anteil an den eingesetztenMengen an PflanzenschutzmittelnTabelle B/L - 3.3
Share of PPPuse volumeTable B/L - 3.3
(%)
Pourcentage du volumede PPP utiliséTableau B/L - 3.3
Quelle / Source: Eurostat.

Belgique - Belgïe / Luxembourg
144 Pflanzenschutz / Plant protection / Protection des cultures A
(in Tonnen Wirkstoff) (en tonnes de MA)
WirkstoffActive
Ingredient(AI)
Matièreactive(MA)
GruppeGroup
Groupe1992 1993 1994 1995 1996
Cyproconazole Cyproconazole Cyproconazole F 52.2 45.8 58.4 66.6 83.9Fenpropimorph Fenpropimorph Fenpropimorphe F 82.0 61.4 83.6 69.0 74.3Glyphosate Glyphosate Glyphosate H 64.3 70.2 53.8 111.5 93.6Prosulfocarb Prosulfocarb Prosulfocarbe H 64.4 83.3 135.0 158.9 196.1Schwefel Sulphur Soufre F, I 121.6 99.3 88.5 54.1 92.5Andere Others Autres 813.9 603.5 506.9 680.3 619.3
Insgesamt Total Total 1 198.3 963.4 926.3 1 140.4 1 159.7
Top 5 der Wirkstoffeim GetreideanbauTabelle B/L - 4.1
Top 5 Al appliedto cereal crops
Table B/L - 4.1
Top 5 des MA utiliséespour les cultures céréalières
Tableau B/L - 4.1
(in tonnes of Al)
(in Tonnen Wirkstoff) (en tonnes de MA)
WirkstoffActive
Ingredient(AI)
Matièreactive(MA)
GruppeGroup
Groupe1992 1993 1994 1995 1996
Chloridazon Chloridazone Chloridazone H 73.5 124.1 128.5 104.6 107.4Cyproconazol Cyproconazole Cyproconazole F 0.0 0.0 11.0 10.3 10.5Ethofumesat Ethofumesate Ethofumesate H : 1.0 1.2 18.4 17.1Metamitron Metamitron Métamitrone H 151.9 145.8 131.2 132.4 148.0Metolachlor Metolachlor Metolachlore H 0.0 3.8 0.0 16.6 20.3Andere Others Autres 142.3 100.1 120.4 116.9 110.2
Insgesamt Total Total 367.7 374.6 392.3 399.1 413.4
Top 5 der Wirkstoffeim ZuckerrübenanbauTabelle B/L - 4.2
Top 5 Al appliedto sugar beet crops
Table B/L - 4.2
Top 5 des MA utiliséespour les cultures de
betteraves à sucreTableau B/L - 4.2
(in tonnes of Al)
(in Tonnen Wirkstoff) (en tonnes de MA)
WirkstoffActive
Ingredient(AI)
Matièreactive(MA)
GruppeGroupGroupe
1992 1993 1994 1995 1996
Atrazin Atrazine Atrazine H 187.6 198.4 158.4 223.3 230.1Dimethenamid Dimethenamide Diméthenamide H c c c c cMetolachlor Metolachlor Metolachlore H 56.6 43.5 48.5 36.4 37.1Pyridat Pyridate Pyridate H 92.9 96.2 78.9 72.2 70.2Sulcotrion Sulcotrione Sulcotrione H c c c c cAndere Others Autres c c c c c
Insgesamt Total Total 467.8 450.2 452.1 535.1 521.8
Top 5 der Wirkstoffeim MaisanbauTabelle B/L - 4.3
Top 5 Al appliedto maize crops
Table B/L - 4.3
Top 5 des MA utiliséespour les cultures de maïs
Tableau B/L - 4.3
(in tonnes of Al)
Quelle / Source: Eurostat.
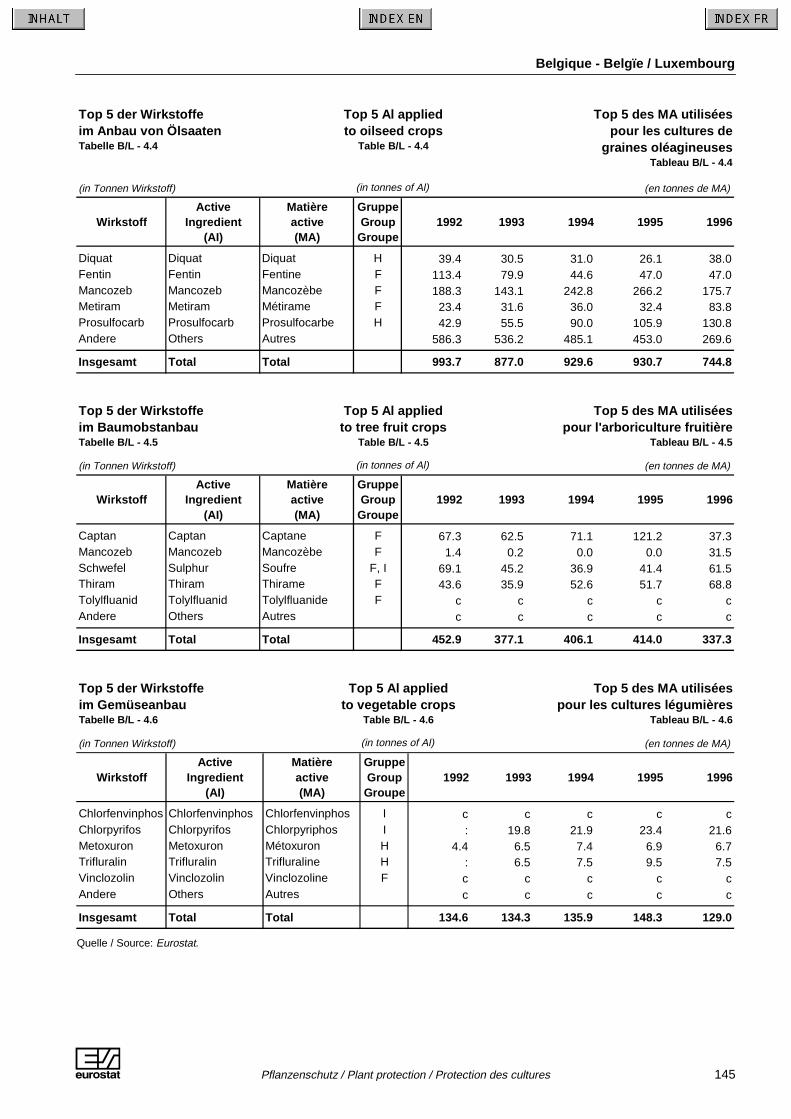
Belgique - Belgïe / Luxembourg
A Pflanzenschutz / Plant protection / Protection des cultures 145
(in Tonnen Wirkstoff) (en tonnes de MA)
WirkstoffActive
Ingredient(AI)
Matièreactive(MA)
GruppeGroup
Groupe1992 1993 1994 1995 1996
Diquat Diquat Diquat H 39.4 30.5 31.0 26.1 38.0Fentin Fentin Fentine F 113.4 79.9 44.6 47.0 47.0Mancozeb Mancozeb Mancozèbe F 188.3 143.1 242.8 266.2 175.7Metiram Metiram Métirame F 23.4 31.6 36.0 32.4 83.8Prosulfocarb Prosulfocarb Prosulfocarbe H 42.9 55.5 90.0 105.9 130.8Andere Others Autres 586.3 536.2 485.1 453.0 269.6
Insgesamt Total Total 993.7 877.0 929.6 930.7 744.8
Top 5 der Wirkstoffeim Anbau von ÖlsaatenTabelle B/L - 4.4
Top 5 Al appliedto oilseed crops
Table B/L - 4.4
Top 5 des MA utiliséespour les cultures de
graines oléagineusesTableau B/L - 4.4
(in tonnes of Al)
(in Tonnen Wirkstoff) (en tonnes de MA)
WirkstoffActive
Ingredient(AI)
Matièreactive(MA)
GruppeGroup
Groupe1992 1993 1994 1995 1996
Captan Captan Captane F 67.3 62.5 71.1 121.2 37.3Mancozeb Mancozeb Mancozèbe F 1.4 0.2 0.0 0.0 31.5Schwefel Sulphur Soufre F, I 69.1 45.2 36.9 41.4 61.5Thiram Thiram Thirame F 43.6 35.9 52.6 51.7 68.8Tolylfluanid Tolylfluanid Tolylfluanide F c c c c cAndere Others Autres c c c c c
Insgesamt Total Total 452.9 377.1 406.1 414.0 337.3
Top 5 der Wirkstoffeim BaumobstanbauTabelle B/L - 4.5
Top 5 Al appliedto tree fruit crops
Table B/L - 4.5
Top 5 des MA utiliséespour l'arboriculture fruitière
Tableau B/L - 4.5
(in tonnes of Al)
(in Tonnen Wirkstoff) (en tonnes de MA)
WirkstoffActive
Ingredient(AI)
Matièreactive(MA)
GruppeGroupGroupe
1992 1993 1994 1995 1996
Chlorfenvinphos Chlorfenvinphos Chlorfenvinphos I c c c c cChlorpyrifos Chlorpyrifos Chlorpyriphos I : 19.8 21.9 23.4 21.6Metoxuron Metoxuron Métoxuron H 4.4 6.5 7.4 6.9 6.7Trifluralin Trifluralin Trifluraline H : 6.5 7.5 9.5 7.5Vinclozolin Vinclozolin Vinclozoline F c c c c cAndere Others Autres c c c c c
Insgesamt Total Total 134.6 134.3 135.9 148.3 129.0
Top 5 der Wirkstoffeim GemüseanbauTabelle B/L - 4.6
Top 5 Al appliedto vegetable crops
Table B/L - 4.6
Top 5 des MA utiliséespour les cultures légumières
Tableau B/L - 4.6
(in tonnes of Al)
Quelle / Source: Eurostat.

Danmark
146 Pflanzenschutz / Plant protection / Protection des cultures A
1992 1993 1994 1995 1996
Getreide Cereals Céréales 1 493 1 329 1 274 1 327 1 438Zuckerrüben Sugar beets Betteraves à sucre 65 66 66 68 70Mais Maize Maïs 20 26 31 37 42Ölsaat Oilseeds Graines oléagineuses 180 164 170 152 105Kartoffeln Potatoes Pommes de terre 54 47 39 42 43Zitrusfrüchte Citrus Agrumes 0 0 0 0 0Weintrauben Grapes Raisins 0 0 0 0 0Baumobst Tree fruits Fruits du verger 0 4 4 4 3Gemüse Vegetables Légumes 0 14 14 14 6
Insgesamt Total Total 1 812 1 650 1 598 1 645 1 707
Gesamte Anbau-fläche für Acker-und Dauerkulturen
Total arable andpermanent croparea
Superficie totaledes cultures de terres arables etcultures perman.
2 548 2 518 2 517 2 508 2 553
AnbauflächeTabelle DK - 1
Crop areaTable DK - 1
(1 000 ha)
Superficie cultivéeTableau DK - 1
(kg Wirkstoff / ha) (kg de MA / ha)
1992 1993 1994 1995 1996
Getreide Cereals Céréales 1.5 1.7 2.0 1.9 1.8Zuckerrüben Sugar beets Betteraves à sucre 6.8 5.7 5.3 4.6 4.3Mais Maize Maïs 0.7 0.2 0.3 0.3 0.3Ölsaat Oilseeds Graines oléagineuses 0.6 0.4 0.3 0.4 0.9Kartoffeln Potatoes Pommes de terre 3.1 4.3 4.8 4.5 3.6Zitrusfrüchte Citrus Agrumes - - - - -Weintrauben Grapes Raisins - - - - -Baumobst Tree fruits Fruits du verger : 4.1 6.4 18.2 14.4Gemüse Vegetables Légumes : 59.7 39.3 47.2 65.9
Insgesamt Total Total 2.2 2.3 2.3 2.3 2.1
Dosierung der eingesetztenPflanzenschutzmittelTabelle DK - 2
Dosage of PPP useTable DK - 2
(kg AI / ha)
Dose de PPP utiliséTableau DK - 2
Quelle / Source: Eurostat.

Danmark
A Pflanzenschutz / Plant protection / Protection des cultures 147
(in Tonnen Wirkstoff) (en tonnes de MA)
1992 1993 1994 1995 1996
Getreide Cereals Céréales 2 261 2 249 2 537 2 458 2 636Zuckerrüben Sugar beets Betteraves à sucre 443 377 351 315 297Mais Maize Maïs 15 6 10 11 14Ölsaat Oilseeds Graines oléagineuses 107 64 56 68 98Kartoffeln Potatoes Pommes de terre 165 202 187 190 156Zitrusfrüchte Citrus Agrumes 0 0 0 0 0Weintrauben Grapes Raisins 0 0 0 0 0Baumobst Tree fruits Fruits du verger 0 18 27 77 45Gemüse Vegetables Légumes 940 857 564 677 408
Insgesamt Total Total 3 932 3 772 3 732 3 797 3 654
Eingesetzte Mengen anPflanzenschutzmittelnTabelle DK - 3.1
Volume of PPP useTable DK - 3.1
(in tonnes of Al)
Volume de PPP utiliséTableau DK - 3.1
1992 1993 1994 1995 1996
Getreide Cereals Céréales 100 99 112 109 117Zuckerrüben Sugar beets Betteraves à sucre 100 85 79 71 67Mais Maize Maïs 100 40 66 72 91Ölsaat Oilseeds Graines oléagineuses 100 59 52 63 91Kartoffeln Potatoes Pommes de terre 100 122 114 115 95Zitrusfrüchte Citrus Agrumes - - - - -Weintrauben Grapes Raisins - - - - -Baumobst Tree fruits Fruits du verger 100 - - - -Gemüse Vegetables Légumes 100 91 60 72 43
Insgesamt Total Total 100 96 95 97 93
Index der eingesetzten Mengenan PflanzenschutzmittelnTabelle DK - 3.2
Index of volume of PPP usedTable DK - 3.2
(1992 = 100)
Indice de volumede PPP utiliséTableau DK - 3.2
1992 1993 1994 1995 1996
Getreide Cereals Céréales 58 60 68 65 72Zuckerrüben Sugar beets Betteraves à sucre 11 10 9 8 8Mais Maize Maïs 0 0 0 0 0Ölsaat Oilseeds Graines oléagineuses 3 2 1 2 3Kartoffeln Potatoes Pommes de terre 4 5 5 5 4Zitrusfrüchte Citrus Agrumes 0 0 0 0 0Weintrauben Grapes Raisins 0 0 0 0 0Baumobst Tree fruits Fruits du verger 0 0 1 2 1Gemüse Vegetables Légumes 24 23 15 18 11
Insgesamt Total Total 100 100 100 100 100
Anteil an den eingesetzten Mengen an PflanzenschutzmittelnTabelle DK - 3.3
Share of PPPvolume usedTable DK - 3.3
(%)
Pourcentage du volumede PPP utiliséTableau DK - 3.3
Quelle / Source: Eurostat.

Danmark
148 Pflanzenschutz / Plant protection / Protection des cultures A
(in Tonnen Wirkstoff) (en tonnes de MA)
WirkstoffActive
Ingredient(AI)
Matièreactive(MA)
GruppeGroup
Groupe1992 1993 1994 1995 1996
Fenpropimorph Fenpropimorph Fenpropimorphe F 512.1 520.8 547.0 407.5 452.6Glyphosat Glyphosate Glyphosate H 334.4 286.0 377.0 397.4 314.5Mancozeb Mancozeb Mancozèbe F : : : : 255.3Pendimethalin Pendimethalin Pendiméthaline H 92.0 98.0 110.0 196.0 225.0Propiconazol Propiconazole Propiconazole F 530.7 520.6 497.6 408.3 430.8Andere Others Autres 746.3 693.9 869.0 826.3 741.1
Insgesamt Total Total 2 215.6 2 119.3 2 400.7 2 235.4 2 419.2
Top 5 der Wirkstoffeim GetreideanbauTabelle DK - 4.1
Top 5 Al appliedto cereal crops
Table DK - 4.1
(in tonnes of Al)
Top 5 des MA utiliséespour les cultures céréalières
Tableau DK - 4.1
(in Tonnen Wirkstoff) (en tonnes de MA)
WirkstoffActive
Ingredient(AI)
Matièreactive(MA)
GruppeGroup
Groupe1992 1993 1994 1995 1996
Chloridazone Chloridazone Chloridazone H 16.6 21.1 22.7 11.5 10.7Deltamethrin Deltamethrin Deltaméthrine I c c c c cEthofumesate Ethofumesate Ethofumesate H : : 19.7 9.7 15.6Glyphosate Glyphosate Glyphosate H 17.6 15.1 19.8 20.9 16.6Metamitron Metamitron Métamitrone H 284.0 244.1 244.7 232.3 224.0Andere Others Autres c c c c c
Insgesamt Total Total 427.8 368.8 343.9 307.3 291.9
Top 5 der Wirkstoffeim ZuckerrübenanbauTabelle DK - 4.2
Top 5 Al appliedto sugar beet crops
Table DK - 4.2
(in tonnes of Al)
Top 5 des MA utiliséespour les cultures de
betteraves à sucreTableau DK - 4.2
(in Tonnen Wirkstoff) (en tonnes de MA)
WirkstoffActive
Ingredient(AI)
Matièreactive(MA)
GruppeGroupGroupe
1992 1993 1994 1995 1996
Clopyralid Clopyralid Clopyralide H : 7.2 6.8 7.5 17.1Fluazifop Fluazifop Fluazifop H 0.0 8.7 6.8 7.5 5.8Napropamid Napropamide Napropamide H 2.8 0.0 3.7 5.7 5.2Propyzamid Propyzamide Propyzamide H : : : : 10.4Schwefel Sulphur Soufre F, I 59.0 0.0 0.0 0.0 36.1Andere Others Autres 39.3 35.4 25.2 31.0 9.9
Insgesamt Total Total 101.0 51.3 42.4 51.7 84.5
Top 5 der Wirkstoffeim Anbau von ÖlsaatenTabelle DK - 4.3
Top 5 Al appliedto oilseed crops
Table DK - 4.3
(in tonnes of Al)
Top 5 des MA utiliséespour les cultures de
graines oléagineusesTableau DK - 4.3
Quelle / Source: Eurostat.

Danmark
A Pflanzenschutz / Plant protection / Protection des cultures 149
(in Tonnen Wirkstoff) (en tonnes de MA)
WirkstoffActive
Ingredient(AI)
Matièreactive(MA)
GruppeGroup
Groupe1992 1993 1994 1995 1996
Diquat Diquat Diquat H 29.6 33.3 29.1 26.3 21.9Mancozeb Mancozeb Mancozèbe F 37.2 44.2 35.3 29.7 10.8Metalaxyl Metalaxyl Métalaxyl F c c c c cProsulfocarb Prosulfocarb Prosulfocarbe H 0.0 3.8 3.3 6.4 18.0Sulfosat Sulfosate Sulfosate H c c c c cAndere Others Autres c c c c c
Insgesamt Total Total 131.6 155.0 142.7 139.6 102.3
Top 5 der Wirkstoffeim KartoffelanbauTabelle DK - 4.4
Top 5 AI appliedto potato crops
Table DK - 4.4
(in tonnes of Al)
Top 5 des MA utiliséespour les cultures de
pommes de terreTableau DK - 4.4
(in Tonnen Wirkstoff) (en tonnes de MA)
WirkstoffActive
Ingredient(AI)
Matièreactive(MA)
GruppeGroup
Groupe1992 1993 1994 1995 1996
Captan Captan Captane F 0.0 10.5 15.0 43.8 32.1Propineb Propineb Propinèbe F c c c c cSchwefel Sulphur Soufre F, I : : 2.4 3.9 2.6Thiram Thiram Thirame F : : 1.0 1.7 1.1Tolylfluanid Tolylfluanid Tolylfluanide F c c c c cAndere Others Autres c c c c c
Insgesamt Total Total 0.1 17.6 27.1 62.1 45.0
Top 5 der Wirkstoffeim BaumobstanbauTabelle DK - 4.5
Top 5 Al appliedto tree fruit crops
Table DK - 4.5
(in tonnes of Al)
Top 5 des MA utiliséespour l'arboriculture fruitière
Tableau DK - 4.5
(in Tonnen Wirkstoff) (en tonnes de MA)
WirkstoffActive
Ingredient(AI)
Matièreactive(MA)
GruppeGroupGroupe
1992 1993 1994 1995 1996
Bentazon Bentazone Bentazone H 69.8 83.5 38.1 48.8 55.9Chlorothalonil Chlorothalonil Chlorothalonil F 11.8 6.6 6.9 12.9 9.9MCPA MCPA MCPA H 57.3 67.7 5.1 7.3 17.3Propachlor Propachlor Propachlore H c c c c cSulfosat Sulfosate Sulfosate H c c c c cAndere Others Autres c c c c c
Insgesamt Total Total 910.7 794.5 498.8 570.4 322.2
Top 5 der Wirkstoffeim GemüseanbauTabelle DK - 4.6
Top 5 Al appliedto vegetable crops
Table DK - 4.6
(in tonnes of Al)
Top 5 des MA utiliséespour les cultures légumières
Tableau DK - 4.6
Quelle / Source: Eurostat.

Deutschland
150 Pflanzenschutz / Plant protection / Protection des cultures A
1992 1993 1994 1995 1996
Getreide Cereals Céréales 5 006 4 595 4 504 4 687 4 803Zuckerrüben Sugar beets Betteraves à sucre 534 522 500 513 515Mais Maize Maïs 1 538 1 595 1 550 1 577 1 699Ölsaat Oilseeds Graines oléagineuses 1 066 1 088 1 246 1 026 897Kartoffeln Potatoes Pommes de terre 361 312 293 315 336Zitrusfrüchte Citrus Agrumes 0 0 0 0 0Weintrauben Grapes Raisins 100 103 104 103 102Baumobst Tree fruits Fruits du verger 55 55 55 55 55Gemüse Vegetables Légumes 82 77 78 84 90
Insgesamt Total Total 8 743 8 348 8 331 8 361 8 498
Gesamte Anbau-fläche für Acker-und Dauerkulturen
Total arable andpermanent croparea
Superficie totaledes cultures de terres arables etcultures perman.
11 678 11 883 12 014 12 043 12 042
AnbauflächeTabelle D - 1
Crop areaTable D - 1
(1 000 ha)
Superficie cultivéeTableau D - 1
(kg Wirkstoff / ha) (kg de MA / ha)
1992 1993 1994 1995 1996
Getreide Cereals Céréales 2.4 2.5 2.4 2.7 2.6Zuckerrüben Sugar beets Betteraves à sucre 3.9 3.7 3.6 3.7 3.9Mais Maize Maïs 2.9 2.1 2.6 2.4 3.5Ölsaat Oilseeds Graines oléagineuses 1.1 0.7 0.8 1.2 1.3Kartoffeln Potatoes Pommes de terre 6.4 6.5 5.3 5.5 5.6Zitrusfrüchte Citrus Agrumes - - - - -Weintrauben Grapes Raisins 13.0 16.0 18.8 27.6 27.3Baumobst Tree fruits Fruits du verger 15.4 13.3 9.8 18.2 12.5Gemüse Vegetables Légumes 1.4 2.2 2.4 3.3 3.1
Insgesamt Total Total 2.8 2.6 2.6 3.1 3.2
Dosierung der eingesetztenPflanzenschutzmittelTabelle D - 2
Dosage of PPP useTable D - 2
(kg AI / ha)
Dose de PPP utiliséTableau D - 2
Quelle / Source: Eurostat.

Deutschland
A Pflanzenschutz / Plant protection / Protection des cultures 151
(in Tonnen Wirkstoff) (en tonnes de MA)
1992 1993 1994 1995 1996
Getreide Cereals Céréales 12 082 11 401 10 853 12 760 12 291Zuckerrüben Sugar beets Betteraves à sucre 2 098 1 914 1 807 1 893 2 013Mais Maize Maïs 4 424 3 288 3 973 3 790 5 975Ölsaat Oilseeds Graines oléagineuses 1 200 773 992 1 181 1 164Kartoffeln Potatoes Pommes de terre 2 314 2 020 1 548 1 746 1 871Zitrusfrüchte Citrus Agrumes 0 0 0 0 0Weintrauben Grapes Raisins 1 302 1 644 1 953 2 854 2 795Baumobst Tree fruits Fruits du verger 848 733 540 1 002 691Gemüse Vegetables Légumes 115 171 186 279 282
Insgesamt Total Total 24 383 21 944 21 851 25 506 27 082
Eingesetzte Mengen anPflanzenschutzmittelnTabelle D - 3.1
Volume of PPP useTable D - 3.1
(in tonnes of Al)
Volume de PPP utiliséTableau D - 3.1
1992 1993 1994 1995 1996
Getreide Cereals Céréales 100 94 90 106 102Zuckerrüben Sugar beets Betteraves à sucre 100 91 86 90 96Mais Maize Maïs 100 74 90 86 135Ölsaat Oilseeds Graines oléagineuses 100 64 83 98 97Kartoffeln Potatoes Pommes de terre 100 87 67 75 81Zitrusfrüchte Citrus Agrumes - - - - -Weintrauben Grapes Raisins 100 126 150 219 215Baumobst Tree fruits Fruits du verger 100 86 64 118 81Gemüse Vegetables Légumes 100 148 161 242 245
Insgesamt Total Total 100 90 90 105 111
Index der eingesetzten Mengenan PflanzenschutzmittelnTabelle D - 3.2
Index of volume of PPP used
Table D - 3.2
(1992 = 100)
Indice de volumede PPP utilisé
Tableau D - 3.2
1992 1993 1994 1995 1996
Getreide Cereals Céréales 50 52 50 50 45Zuckerrüben Sugar beets Betteraves à sucre 9 9 8 7 7Mais Maize Maïs 18 15 18 15 22Ölsaat Oilseeds Graines oléagineuses 5 4 5 5 4Kartoffeln Potatoes Pommes de terre 9 9 7 7 7Zitrusfrüchte Citrus Agrumes 0 0 0 0 0Weintrauben Grapes Raisins 5 7 9 11 10Baumobst Tree fruits Fruits du verger 3 3 2 4 3Gemüse Vegetables Légumes 0 1 1 1 1
Insgesamt Total Total 100 100 100 100 100
Anteil an den eingesetzten Mengen an PflanzenschutzmittelnTabelle D - 3.3
Share of PPPvolume used
Table D - 3.3
(%)
Pourcentage du volumede PPP utilisé
Tableau D - 3.3
Quelle / Source: Eurostat.

Deutschland
152 Pflanzenschutz / Plant protection / Protection des cultures A
(in Tonnen Wirkstoff) (en tonnes de MA)
WirkstoffActive
Ingredient(AI)
Matièreactive(MA)
GruppeGroup
Groupe1992 1993 1994 1995 1996
Chloridazon Chlorotoluron Chlortoluron H 333.6 347.2 414.7 614.1 577.1Difenoconazol Fenpropimorph Fenpropimorphe F 1 165.1 783.4 831.7 1 189.3 984.7Ethofumesat Glyphosate Glyphosate H 460.8 772.1 566.8 722.2 991.3Metamitron Isoproturon Isoproturon H 2 647.1 2 465.1 2 607.4 2 890.7 2 756.9Phenmedipham Pendimethalin Pendiméthaline H 334.7 368.6 526.2 827.4 741.3Andere Others Autres 7 140.3 6 664.2 5 906.2 6 516.7 6 239.5
Insgesamt Total Total 12 081.7 11 400.5 10 853.0 12 760.4 12 290.9
Top 5 der Wirkstoffeim GetreideanbauTabelle D - 4.1
Top 5 A. appliedto cereal crops
Table D - 4.1
(in tonnes of Al)
Top 5 des MA utiliséespour les cultures céréalières
Tableau D - 4.1
(in Tonnen Wirkstoff) (en tonnes de MA)
WirkstoffActive
Ingredient(AI)
Matièreactive(MA)
GruppeGroupGroupe
1992 1993 1994 1995 1996
Chloridazon Chloridazone Chloridazone H 204.0 180.6 185.1 176.3 184.1Difenoconazol Difenoconazole Difénoconazole F c c c c cEthofumesat Ethofumesate Ethofumesate H 253.1 232.4 203.2 210.8 195.5Metamitron Metamitron Métamitrone H 1 180.9 1 079.6 896.9 1 009.7 1 147.8Phenmedipham Phenmedipham Phenmédiphame H 154.2 113.4 119.2 121.8 108.6Andere Others Autres c c c c c
Insgesamt Total Total 2 097.6 1 914.1 1 807.3 1 892.8 2 012.6
Top 5 der Wirkstoffeim ZuckerrübenanbauTabelle D - 4.2
Top 5 for Al appliedin sugar beet crops
Table D - 4.2
(in tonnes of Al)
Top 5 des MA utiliséesdans les cultures de
betteraves à sucreTableau D - 4.2
(in Tonnen Wirkstoff) (en tonnes de MA)
WirkstoffActive
Ingredient(AI)
Matièreactive(MA)
GruppeGroupGroupe
1992 1993 1994 1995 1996
Bromoxynil Bromoxynil Bromoxynil H 496.5 314.1 336.3 222.1 189.4Metolachlor Metolachlor Metolachlore H 647.8 544.1 702.1 677.8 1 351.9Pyridat Pyridate Pyridate H 827.8 674.1 796.8 1 055.8 1 829.2Sulcotrion Sulcotrione Sulcotrione H c c c c cTerbuthylazin Terbuthylazine Terbuthylazine H 1 546.6 1 199.6 1 409.9 1 283.6 2 169.7Andere Others Autres c c c c c
Insgesamt Total Total 4 424.4 3 288.5 3 972.8 3 789.8 5 974.8
Top 5 der Wirkstoffeim MaisanbauTabelle D - 4.3
Top 5 Al appliedto maize crops
Table D - 4.3
(in tonnes of Al)
Top 5 des MA utiliséespour les cultures de maïs
Tableau D - 4.3
Quelle / Source: Eurostat.

Deutschland
A Pflanzenschutz / Plant protection / Protection des cultures 153
(in Tonnen Wirkstoff) (en tonnes de MA)
WirkstoffActive
Ingredient(AI)
Matièreactive(MA)
GruppeGroup
Groupe1992 1993 1994 1995 1996
Metazachlor Metazachlor Métazachlore H 500.7 458.2 413.1 577.9 595.9Napropamid Napropamide Napropamide H 126.3 18.0 146.6 111.0 80.4Propaquizafop Propaquizafop Propaquizafop H c c c c cQuinmerac Quinmerac Quinmerac H c c c c cTrifluralin Trifluralin Trifluraline H : 50.0 120.0 70.0 56.0Andere Others Autres c c c c c
Insgesamt Total Total 1 200.2 773.4 991.8 1 180.8 1 164.1
Top 5 der Wirkstoffeim Anbau von ÖlsaatenTabelle D - 4.4
Top 5 Al appliedto oilseed crops
Table D - 4.4
(in tonnes of Al)
Top 5 des MA utiliséespour les cultures de
graines oléagineusesTableau D - 4.4
(in Tonnen Wirkstoff) (en tonnes de MA)
WirkstoffActive
Ingredient(AI)
Matièreactive(MA)
GruppeGroup
Groupe1992 1993 1994 1995 1996
Mancozeb Mancozeb Mancozèbe F 325.1 310.6 294.5 339.0 392.9Metalaxyl Metalaxyl Métalaxyl F c c c c cMetiram Metiram Métirame F 256.0 258.4 97.4 107.7 154.1Propamocarb Propamocarb Propamocarbe F c c c c cProsulfocarb Prosulfocarb Prosulfocarbe H 635.0 344.3 294.0 292.0 447.9Andere Others Autres c c c c c
Insgesamt Total Total 2 313.6 2 020.2 1 548.0 1 746.4 1 871.3
Top 5 der Wirkstoffeim KartoffelanbauTabelle D - 4.5
Top 5 Al appliedto potato crops
Table D - 4.5
(in tonnes of Al)
Top 5 des MA utiliséespour les cultures de
pommes de terreTableau D - 4.5
(in Tonnen Wirkstoff) (en tonnes de MA)
WirkstoffActive
Ingredient(AI)
Matièreactive(MA)
GruppeGroupGroupe
1992 1993 1994 1995 1996
Kupfer Copper Cuivre F 67.8 157.8 153.2 195.3 250.9Dichlofluanid Dichlofluanid Dichlofluanide F 140.8 140.8 134.9 167.7 183.7Metiram Metiram Métirame F : : 245.5 271.5 298.5Propineb Propineb Propinèbe F c c c c cSchwefel Sulphur Soufre F, I 604.9 862.9 1 006.2 1 446.9 1 505.5Andere Others Autres c c c c c
Insgesamt Total Total 1 301.6 1 643.9 1 952.6 2 854.4 2 795.2
Top 5 der Wirkstoffeim WeinanbauTabelle D - 4.6
Top 5 Al appliedto grape crops
Table D - 4.6
(in tonnes of Al)
Top 5 des MA utiliséespour la viticulture
Tableau D - 4.6
Quelle / Source: Eurostat.

Deutschland
154 Pflanzenschutz / Plant protection / Protection des cultures A
(in Tonnen Wirkstoff) (en tonnes de MA)
WirkstoffActive
Ingredient(AI)
Matièreactive(MA)
GruppeGroupGroupe
1992 1993 1994 1995 1996
Captan Captan Captane F 446.0 289.6 34.0 21.6 89.1Dichlofluanid Dichlofluanid Dichlofluanide F 55.1 67.5 44.7 104.7 126.0Dithianon Dithianon Dithianon F 49.1 44.3 14.4 28.0 30.3Metiram Metiram Métirame F 28.7 0.0 50.7 56.0 28.9Schwefel Sulphur Soufre F, I 127.9 132.8 227.0 310.9 251.3Andere Others Autres 141.5 198.8 168.8 481.2 165.4
Insgesamt Total Total 848.3 732.9 539.6 1 002.4 691.0
Top 5 der Wirkstoffeim BaumobstanbauTabelle D - 4.7
Top 5 Al appliedto tree fruit crops
Table D - 4.7
(in tonnes of Al)
Top 5 des MA utiliséespour l'arboriculture fruitière
Tableau D - 4.7
(in Tonnen Wirkstoff) (en tonnes de MA)
WirkstoffActive
Ingredient(AI)
Matièreactive(MA)
GruppeGroupGroupe
1992 1993 1994 1995 1996
Bentazon Bentazone Bentazone H 20.0 28.3 : : 39.2Fosetyl Fosetyl Fosetyl F 57.0 73.0 86.0 111.0 93.0Mancozeb Mancozeb Mancozèbe F 0.0 0.0 0.0 22.8 25.7Metalaxyl Metalaxyl Métalaxyl F c c c c cPendimethalin Pendimethalin Pendiméthaline H 9.5 10.0 37.3 84.5 78.8Andere Others Autres c c c c c
Insgesamt Total Total 115.1 170.8 185.6 278.9 282.0
Top 5 der Wirkstoffeim GemüseanbauTabelle D - 4.8
Top 5 Al appliedto vegetable crops
Table D - 4.8
(in tonnes of Al)
Top 5 des MA utiliséespour les cultures légumières
Tableau D - 4.8
Quelle / Source: Eurostat.

Ellada
A Pflanzenschutz / Plant protection / Protection des cultures 155
1992 1993 1994 1995 1996
Getreide Cereals Céréales 1 119 1 079 1 065 990 1 003Zuckerrüben Sugar beets Betteraves à sucre 50 46 40 42 40Mais Maize Maïs 214 198 198 163 213Ölsaat Oilseeds Graines oléagineuses 14 18 20 22 24Kartoffeln Potatoes Pommes de terre 51 40 47 52 50Zitrusfrüchte Citrus Agrumes 57 58 58 58 58Weintrauben Grapes Raisins 147 144 138 136 132Baumobst Tree fruits Fruits du verger 85 86 87 86 79Gemüse Vegetables Légumes 132 129 130 133 134
Insgesamt Total Total 1 869 1 798 1 783 1 683 1 734
Gesamte Anbau-fläche für Acker-und Dauerkulturen
Total arable andpermanent croparea
Superficie totaledes cultures de terres arables etcultures perman.
3 391 3 372 3 326 3 326 3 320
AnbauflächeTabelle EL - 1
Crop areaTable EL - 1
(1 000 ha)
Superficie cultivéeTableau EL - 1
(kg Wirkstoff / ha) (kg de MA / ha)
1992 1993 1994 1995 1996
Getreide Cereals Céréales 0.0 0.0 0.1 0.1 0.1Zuckerrüben Sugar beets Betteraves à sucre 5.5 5.6 6.0 10.9 12.3Mais Maize Maïs 2.4 2.7 2.4 2.4 2.3Ölsaat Oilseeds Graines oléagineuses 0.0 0.0 0.0 0.0 0.0Kartoffeln Potatoes Pommes de terre 4.3 4.5 4.1 3.7 4.3Zitrusfrüchte Citrus Agrumes 2.4 2.2 2.2 2.4 2.3Weintrauben Grapes Raisins 53.5 55.5 57.9 58.9 60.8Baumobst Tree fruits Fruits du verger 7.1 6.6 7.3 6.8 7.6Gemüse Vegetables Légumes 1.7 1.6 1.6 1.6 1.9
Insgesamt Total Total 5.3 5.5 5.6 6.0 6.0
Dosierung der eingesetztenPflanzenschutzmittelTabelle EL - 2
Dosage of PPP useTable EL - 2
(kg AI / ha)
Dose de PPP utiliséTableau EL - 2
Quelle / Source: Eurostat.

Ellada
156 Pflanzenschutz / Plant protection / Protection des cultures A
(in Tonnen Wirkstoff) (en tonnes de MA)
1992 1993 1994 1995 1996
Getreide Cereals Céréales 53 52 80 119 133Zuckerrüben Sugar beets Betteraves à sucre 276 257 243 464 497Mais Maize Maïs 525 529 481 397 495Ölsaat Oilseeds Graines oléagineuses 0 0 1 0 0Kartoffeln Potatoes Pommes de terre 221 179 191 189 215Zitrusfrüchte Citrus Agrumes 139 126 130 137 136Weintrauben Grapes Raisins 7 853 8 006 8 005 8 007 8 042Baumobst Tree fruits Fruits du verger 599 564 629 590 603Gemüse Vegetables Légumes 222 210 208 219 250
Insgesamt Total Total 9 888 9 922 9 968 10 121 10 371
Eingesetzte Mengen anPflanzenschutzmittelnTabelle EL - 3.1
Volume of PPP useTable EL - 3.1
(in tonnes of Al)
Volume de PPP utiliséTableau EL - 3.1
1992 1993 1994 1995 1996
Getreide Cereals Céréales 100 97 149 223 249Zuckerrüben Sugar beets Betteraves à sucre 100 93 88 168 180Mais Maize Maïs 100 101 92 76 94Ölsaat Oilseeds Graines oléagineuses - - - - -Kartoffeln Potatoes Pommes de terre 100 81 87 85 97Zitrusfrüchte Citrus Agrumes 100 90 94 99 98Weintrauben Grapes Raisins 100 102 102 102 102Baumobst Tree fruits Fruits du verger 100 94 105 98 101Gemüse Vegetables Légumes 100 95 94 98 113
Insgesamt Total Total 100 100 101 102 105
Index der eingesetzten Mengenan PflanzenschutzmittelnTabelle EL - 3.2
Index of volume of PPP usedTable EL - 3.2
(1992 = 100)
Indice de volumede PPP utilisé
Tableau EL - 3.2
1992 1993 1994 1995 1996
Getreide Cereals Céréales 1 1 1 1 1Zuckerrüben Sugar beets Betteraves à sucre 3 3 2 5 5Mais Maize Maïs 5 5 5 4 5Ölsaat Oilseeds Graines oléagineuses 0 0 0 0 0Kartoffeln Potatoes Pommes de terre 2 2 2 2 2Zitrusfrüchte Citrus Agrumes 1 1 1 1 1Weintrauben Grapes Raisins 79 81 80 79 78Baumobst Tree fruits Fruits du verger 6 6 6 6 6Gemüse Vegetables Légumes 2 2 2 2 2
Insgesamt Total Total 100 100 100 100 100
Anteil an den eingesetzten Mengen an PflanzenschutzmittelnTabelle EL - 3.3
Share of PPPvolume used
Table EL - 3.3
(%)
Pourcentage du volumede PPP utilisé
Tableau EL - 3.3
Quelle / Source: Eurostat.

Ellada
A Pflanzenschutz / Plant protection / Protection des cultures 157
(in Tonnen Wirkstoff) (en tonnes de MA)
WirkstoffActive
Ingredient(AI)
Matièreactive(MA)
GruppeGroup
Groupe1992 1993 1994 1995 1996
Clodinafop Clodinafop Clodinafop H c c c c cCloquintocet Cloquintocet Cloquintocet H c c c c cDiclofop Diclofop Diclofop H c c c c cGlyphosate Glyphosate Glyphosate H 27.6 31.7 39.1 51.0 47.3Tralkoxydim Tralkoxydim Tralkoxydime H c c c c cAndere Others Autres 14.9 8.7 8.9 12.6 8.6
Insgesamt Total Total 53.4 51.6 79.6 119.2 133.0
Top 5 der Wirkstoffeim GetreideanbauTabelle EL - 4.1
Top 5 Al appliedto cereal crops
Table EL - 4.1
(in tonnes of Al)
Top 5 des MA utiliséespour les cultures céréalières
Tableau EL - 4.1
(in Tonnen Wirkstoff) (en tonnes de MA)
WirkstoffActive
Ingredient(AI)
Matièreactive(MA)
GruppeGroupGroupe
1992 1993 1994 1995 1996
Chlorothalonil Chlorothalonil Chlorothalonil F 0.0 0.0 0.0 0.0 53.5Difenoconazol Difenoconazole Difénoconazole F c c c c cMetamitron Metamitron Métamitrone H 52.7 43.8 43.8 32.1 36.1Metolachlor Metolachlor Metolachlore H 26.4 32.3 27.2 24.3 27.9Schwefel Sulphur Soufre F, I 112.5 112.5 112.5 337.5 332.3Andere Others Autres c c c c c
Insgesamt Total Total 275.7 257.0 243.0 463.5 497.3
Top 5 der Wirkstoffeim ZuckerrübenanbauTabelle EL - 4.2
Top 5 Al appliedto sugar beet crops
Table EL - 4.2
(in tonnes of Al)
Top 5 des MA utiliséespour les cultures de
betteraves à sucreTableau EL - 4.2
(in Tonnen Wirkstoff) (en tonnes de MA)
WirkstoffActive
Ingredient(AI)
Matièreactive(MA)
GruppeGroupGroupe
1992 1993 1994 1995 1996
Alachlor Alachlor Alachlore H 95.0 73.9 54.9 52.9 85.8Atrazine Atrazine Atrazine H 233.3 248.3 248.7 207.0 238.4Chlorpyrifos Chlorpyrifos Chlorpyriphos I 6.0 6.0 6.0 6.0 6.0EPTC EPTC EPTC H 5.6 2.7 3.7 6.1 25.3Metolachlor Metolachlor Metolachlor H 178.5 191.3 160.2 118.2 129.9Andere Others Autres 6.2 6.4 7.1 6.4 9.5
Insgesamt Total Total 524.6 528.5 480.6 396.5 494.8
Top 5 der Wirkstoffeim MaisanbauTabelle EL - 4.3
Top 5 Al appliedto maize crops
Table EL - 4.3
(in tonnes of Al)
Top 5 des MA utiliséespour les cultures de maïs
Tableau EL - 4.3
Quelle / Source: Eurostat.

Ellada
158 Pflanzenschutz / Plant protection / Protection des cultures A
(in Tonnen Wirkstoff) (en tonnes de MA)
WirkstoffActive
Ingredient(AI)
Matièreactive(MA)
GruppeGroup
Groupe1992 1993 1994 1995 1996
Mancozeb Mancozeb Mancozèbe F 22.5 15.8 20.3 15.0 18.8Maneb Maneb Manèbe F 42.8 35.1 37.0 33.7 40.5Metalaxyl Metalaxyl Métalaxyl F c c c c cParaquat Paraquat Paraquat H c c c c cPropineb Propineb Propinèbe F c c c c cAndere Others Autres 73.0 69.2 66.5 76.4 82.9
Insgesamt Total Total 220.6 178.8 191.4 188.5 215.0
Top 5 der Wirkstoffeim KartoffelanbauTabelle EL - 4.4
Top 5 Al appliedto potato crops
Table EL - 4.4
(in tonnes of Al)
Top 5 des MA utiliséespour les cultures de
pommes de terreTableau EL - 4.4
(in Tonnen Wirkstoff) (en tonnes de MA)
WirkstoffActive
Ingredient(AI)
Matièreactive(MA)
GruppeGroup
Groupe1992 1993 1994 1995 1996
Kupfer Copper Cuivre F 14.9 11.3 7.6 9.7 16.4Glyphosate Glyphosate Glyphosate H 34.6 39.8 50.3 68.6 61.1Mancozeb Mancozeb Mancozèbe F : : : : 4.7Methidathion Methidathion Méthidathion I c c c c cSulfosate Sulfosate Sulfosate H c c c c cAndere Others Autres c c c c c
Insgesamt Total Total 139.1 125.7 130.2 137.2 135.9
Top 5 der Wirkstoffe imAnbau von ZitrusfrüchtenTabelle EL - 4.5
Top 5 Al appliedto citrus crops
Table EL - 4.5
(in tonnes of Al)
Top 5 des MA utiliséespour les cultures d'agrumes
Tableau EL - 4.5
(in Tonnen Wirkstoff) (en tonnes de MA)
WirkstoffActive
Ingredient(AI)
Matièreactive(MA)
GruppeGroupGroupe
1992 1993 1994 1995 1996
Atrazin Atrazine Atrazine H 91.1 43.5 41.6 36.0 36.0Glyphosat Glyphosate Glyphosate H 54.2 58.0 74.9 99.8 87.4Paraquat Paraquat Paraquat H c c c c cPropineb Propineb Propinèbe F c c c c cSchwefel Sulphur Soufre F, I 7 256.7 7 554.6 7 563.2 7 568.1 7 571.5Andere Others Autres c c c c c
Insgesamt Total Total 7 853.2 8 006.3 8 004.9 8 007.1 8 041.6
Top 5 der Wirkstoffeim WeinanbauTabelle EL - 4.6
Top 5 Al appliedto grape crops
Table EL - 4.6
(in tonnes of Al)
Top 5 des MA utiliséespour la viticulture
Tableau EL - 4.6
Quelle / Source: Eurostat.

Ellada
A Pflanzenschutz / Plant protection / Protection des cultures 159
(in Tonnen Wirkstoff) (en tonnes de MA)
WirkstoffActive
Ingredient(AI)
Matièreactive(MA)
GruppeGroupGroupe
1992 1993 1994 1995 1996
Diazinon Diazinon Diazinon I c c c c cMethidathion Methidathion Méthidathion I c c c c cMineralöl Mineral oil Huile minérale I c c c c cSchwefel Sulphur Soufre F, I 70.0 84.1 88.6 82.2 73.4Ziram Ziram Zirame F 73.0 75.4 75.4 55.6 49.5Andere Others Autres 296.3 249.4 283.8 284.7 312.5
Insgesamt Total Total 599.3 564.1 629.3 589.7 602.9
Top 5 der Wirkstoffeim BaumobstanbauTabelle EL - 4.7
Top 5 Al appliedto tree fruit crops
Table EL - 4.7
(in tonnes of Al)
Top 5 des MA utiliséespour l'arboriculture fruitière
Tableau EL - 4.7
(in Tonnen Wirkstoff) (en tonnes de MA)
WirkstoffActive
Ingredient(AI)
Matièreactive(MA)
GruppeGroupGroupe
1992 1993 1994 1995 1996
Chlorothalonil Chlorothalonil Chlorothalonil F 0.0 18.8 18.5 20.6 24.0Mancozeb Mancozeb Mancozèbe F 9.8 9.0 8.3 8.7 17.1Maneb Maneb Manèbe F 13.8 11.0 12.1 10.7 13.0Paraquat Paraquat Paraquat H c c c c cPropineb Propineb Propinèbe F c c c c cAndere Others Autres c c c c c
Insgesamt Total Total 222.2 210.3 208.0 218.8 250.0
Top 5 der Wirkstoffeim GemüseanbauTabelle EL - 4.8
Top 5 Al appliedto vegetable crops
Table EL - 4.8
(in tonnes of Al)
Top 5 des MA utiliséespour les cultures légumières
Tableau EL - 4.8
Quelle / Source: Eurostat.

España
160 Pflanzenschutz / Plant protection / Protection des cultures A
1992 1993 1994 1995 1996
Getreide Cereals Céréales 6 355 5 571 5 510 5 682 5 584Zuckerrüben Sugar beets Betteraves à sucre 163 180 183 172 157Mais Maize Maïs 512 386 457 462 545Ölsaat Oilseeds Graines oléagineuses 1 465 2 154 1 424 1 199 1 196Kartoffeln Potatoes Pommes de terre 257 208 201 206 180Zitrusfrüchte Citrus Agrumes 268 270 268 272 261Weintrauben Grapes Raisins 1 405 1 280 1 233 1 196 1 172Baumobst Tree fruits Fruits du verger 233 234 234 231 225Gemüse Vegetables Légumes 454 426 423 391 390
Insgesamt Total Total 11 112 10 710 9 933 9 811 9 710
Gesamte Anbau-fläche für Acker-und Dauerkulturen
Total arable andpermanent croparea
Superficie totaledes cultures de terres arables etcultures perman.
19 831 19 522 18 236 18 604 18 555
AnbauflächeTabelle E - 1
Crop areaTable E - 1
(1 000 ha)
Superficie cultivéeTableau E - 1
(kg Wirkstoff / ha) (kg de MA / ha)
1992 1993 1994 1995 1996
Getreide Cereals Céréales 0.4 0.4 0.5 0.5 0.5Zuckerrüben Sugar beets Betteraves à sucre 2.3 2.4 2.8 3.4 4.3Mais Maize Maïs 2.0 1.6 2.2 2.2 2.6Ölsaat Oilseeds Graines oléagineuses 0.2 0.2 0.3 0.3 0.2Kartoffeln Potatoes Pommes de terre 1.8 1.8 2.3 2.9 3.8Zitrusfrüchte Citrus Agrumes 8.4 7.5 12.7 11.3 10.9Weintrauben Grapes Raisins 11.7 12.1 11.5 10.8 11.3Baumobst Tree fruits Fruits du verger 9.4 9.1 9.5 9.8 9.9Gemüse Vegetables Légumes 5.6 5.9 4.9 5.7 6.3
Insgesamt Total Total 2.6 2.5 2.7 2.6 2.7
Dosierung der eingesetztenPflanzenschutzmittelTabelle E - 2
Dosage of PPP useTable E - 2
(kg AI / ha)
Dose de PPP utiliséTableau E - 2
Quelle / Source: Eurostat.
España
A Pflanzenschutz / Plant protection / Protection des cultures 161
(in Tonnen Wirkstoff) (en tonnes de MA)
1992 1993 1994 1995 1996
Getreide Cereals Céréales 2 711 2 338 2 587 2 602 2 788Zuckerrüben Sugar beets Betteraves à sucre 372 424 506 587 676Mais Maize Maïs 1 006 628 988 1 022 1 398Ölsaat Oilseeds Graines oléagineuses 347 447 434 325 280Kartoffeln Potatoes Pommes de terre 470 381 461 601 691Zitrusfrüchte Citrus Agrumes 2 245 2 040 3 393 3 071 2 836Weintrauben Grapes Raisins 16 454 15 556 14 152 12 946 13 305Baumobst Tree fruits Fruits du verger 2 203 2 137 2 212 2 252 2 222Gemüse Vegetables Légumes 2 539 2 503 2 081 2 229 2 465
Insgesamt Total Total 28 348 26 454 26 814 25 634 26 662
Eingesetzte Mengen anPflanzenschutzmittelnTabelle E - 3.1
Volume of PPP useTable E - 3.1
(in tonnes of Al)
Volume de PPP utiliséTableau E - 3.1
1992 1993 1994 1995 1996
Getreide Cereals Céréales 100 86 95 96 103Zuckerrüben Sugar beets Betteraves à sucre 100 114 136 158 182Mais Maize Maïs 100 62 98 102 139Ölsaat Oilseeds Graines oléagineuses 100 129 125 94 81Kartoffeln Potatoes Pommes de terre 100 81 98 128 147Zitrusfrüchte Citrus Agrumes 100 91 151 137 126Weintrauben Grapes Raisins 100 95 86 79 81Baumobst Tree fruits Fruits du verger 100 97 100 102 101Gemüse Vegetables Légumes 100 99 82 88 97
Insgesamt Total Total 100 93 95 90 94
Index der eingesetzten Mengenan PflanzenschutzmittelnTabelle E - 3.2
Index of volume of PPP used
Table E - 3.2
(1992 = 100)
Indice de volumede PPP utilisé
Tableau E - 3.2
1992 1993 1994 1995 1996
Getreide Cereals Céréales 10 9 10 10 10Zuckerrüben Sugar beets Betteraves à sucre 1 2 2 2 3Mais Maize Maïs 4 2 4 4 5Ölsaat Oilseeds Graines oléagineuses 1 2 2 1 1Kartoffeln Potatoes Pommes de terre 2 1 2 2 3Zitrusfrüchte Citrus Agrumes 8 8 13 12 11Weintrauben Grapes Raisins 58 59 53 51 50Baumobst Tree fruits Fruits du verger 8 8 8 9 8Gemüse Vegetables Légumes 9 9 8 9 9
Insgesamt Total Total 100 100 100 100 100
Anteil an den eingesetzten Mengen an PflanzenschutzmittelnTabelle E - 3.3
Share of PPPvolume used
Table E - 3.3
(%)
Pourcentage du volumede PPP utilisé
Tableau E - 3.3
Quelle / Source: Eurostat.

España
162 Pflanzenschutz / Plant protection / Protection des cultures A
(in Tonnen Wirkstoff) (en tonnes de MA)
WirkstoffActive
Ingredient(AI)
Matièreactive(MA)
GruppeGroup
Groupe1992 1993 1994 1995 1996
2,4-D 2.4-D 2,4-D H 94.8 171.4 163.0 161.5 244.0Chlorotoluron Chlorotoluron Chlortoluron H 987.7 832.1 858.5 812.6 803.4Glyphosat Glyphosate Glyphosate H 178.3 202.3 210.4 217.5 287.0Terbutryn Terbutryn Terbutryne H c c c c cTriasulfuron Triasulfuron Triasulfuron H c c c c cAndere Others Autres c c c c c
Insgesamt Total Total 2 711.2 2 337.9 2 587.0 2 602.0 2 788.4
Top 5 der Wirkstoffeim GetreideanbauTabelle E - 4.1
Top 5 Al appliedto cereal crops
Table E - 4.1
(in tonnes of Al)
Top 5 des MA utiliséespour les cultures céréalières
Tableau E - 4.1
(in Tonnen Wirkstoff) (en tonnes de MA)
WirkstoffActive
Ingredient(AI)
Matièreactive(MA)
GruppeGroupGroupe
1992 1993 1994 1995 1996
Chloridazon Chloridazone Chloridazone H 41.5 46.2 48.0 45.2 45.6Ethofumesat Ethofumesate Ethofumesate H 30.7 31.5 33.7 25.1 34.4Metamitron Metamitron Métamitrone H 83.8 103.6 118.9 121.8 122.6Metolachlor Metolachlor Metolachlor H 22.2 27.8 30.9 28.9 29.2Schwefel Sulphur Soufre F, I 67.4 74.9 107.2 211.1 289.7Andere Others Autres 126.2 139.8 167.2 155.0 154.4
Insgesamt Total Total 371.8 423.8 505.9 587.2 675.8
Top 5 der Wirkstoffeim ZuckerrübenanbauTabelle E - 4.2
Top 5 Al appliedto sugar beet crops
Table E - 4.2
(in tonnes of Al)
Top 5 des MA utiliséespour les cultures de
betteraves à sucreTableau E - 4.2
(in Tonnen Wirkstoff) (en tonnes de MA)
WirkstoffActive
Ingredient(AI)
Matièreactive(MA)
GruppeGroupGroupe
1992 1993 1994 1995 1996
Atrazin Atrazine Atrazine H 483.4 317.1 492.6 535.1 740.8Diazinon Diazinon Diazinon I c c c c cEPTC EPTC EPTC H 72.4 27.5 32.8 26.2 29.2Metolachlor Metolachlor Metolachlor H 259.9 188.8 291.8 354.3 419.9Simazin Simazine Simazine H 54.8 36.0 37.0 38.6 41.4Andere Others Autres c c c c c
Insgesamt Total Total 1 006.4 628.5 988.1 1 022.0 1 397.8
Top 5 der Wirkstoffeim MaisanbauTabelle E - 4.3
Top 5 Al appliedto maize crops
Table E - 4.3
(in tonnes of Al)
Top 5 des MA utiliséespour les cultures de maïs
Tableau E - 4.3
Quelle / Source: Eurostat.
España
A Pflanzenschutz / Plant protection / Protection des cultures 163
(in Tonnen Wirkstoff) (en tonnes de MA)
WirkstoffActive
Ingredient(AI)
Matièreactive(MA)
GruppeGroup
Groupe1992 1993 1994 1995 1996
Captan Captan Captane F 38.6 29.8 34.8 68.1 26.5Metolachlor Metolachlor Metolachlor H 69.2 94.1 84.2 42.6 38.8Prometryn Prometryn Prométryne H c c c c cTerbutryn Terbutryn Terbutryne H c c c c cTrifluralin Trifluralin Trifluraline F : 53.0 57.0 52.9 41.6Andere Others Autres c c c c c
Insgesamt Total Total 346.9 447.0 434.5 324.5 280.5
Top 5 der Wirkstoffeim Anbau von ÖlsaatenTabelle E - 4.4
Top 5 Al appliedto oilseed crops
Table E - 4.4
(in tonnes of Al)
Top 5 des MA utiliséespour les cultures de
graines oléagineusesTableau E - 4.4
(in Tonnen Wirkstoff) (en tonnes de MA)
WirkstoffActive
Ingredient(AI)
Matièreactive(MA)
GruppeGroup
Groupe1992 1993 1994 1995 1996
Kupfer Copper Cuivre F 20.5 22.5 22.4 35.2 47.9Disulfoton Disulfoton Disulfoton I c c c c cMancozeb Mancozeb Mancozèbe F 122.2 92.0 144.1 178.4 217.6Metalaxyl Metalaxyl Métalaxyl F c c c c cTerbutryn Terbutryn Terbutryne H c c c c cAndere Others Autres 204.1 168.5 198.2 258.0 257.9
Insgesamt Total Total 469.8 380.6 460.9 600.7 691.4
Top 5 der Wirkstoffeim KartoffelanbauTabelle E - 4.5
Top 5 Al appliedto potato crops
Table E - 4.5
(in tonnes of Al)
Top 5 des MA utiliséespour les cultures de
pommes de terreTableau E - 4.5
(in Tonnen Wirkstoff) (en tonnes de MA)
WirkstoffActive
Ingredient(AI)
Matièreactive(MA)
GruppeGroupGroupe
1992 1993 1994 1995 1996
Kupfer Copper Cuivre F 66.0 75.9 100.7 52.2 107.7Glyphosat Glyphosate Glyphosate H 312.8 380.7 405.8 392.9 492.3Methidathion Methidathion Méthidathion I c c c c cMineralöl Mineral oil Huile minérale I c c c c cTerbuthylazin Terbuthylazine Terbuthylazine H 126.8 125.9 126.8 106.7 139.8Andere Others Autres c c c c c
Insgesamt Total Total 2 245.1 2 040.0 3 393.0 3 070.5 2 836.3
Top 5 der Wirkstoffe im Anbau von ZitrusfrüchtenTabelle E - 4.6
Top 5 Al appliedto citrus crops
Table E - 4.6
(in tonnes of Al)
Top 5 des MA utiliséespour la culture d'agrumes
Tableau E - 4.6
Quelle / Source: Eurostat.

España
164 Pflanzenschutz / Plant protection / Protection des cultures A
(in Tonnen Wirkstoff) (en tonnes de MA)
WirkstoffActive
Ingredient(AI)
Matièreactive(MA)
GruppeGroupGroupe
1992 1993 1994 1995 1996
Kupfer Copper Cuivre F 374.1 377.2 251.2 203.0 360.2Folpet Folpet Folpel F 175.0 150.8 113.0 110.4 93.9Glyphosat Glyphosate Glyphosate H 104.3 128.5 155.7 145.3 171.7Metalaxyl Metalaxyl Métalaxyl F c c c c cSchwefel Sulphur Soufre F, I 14 920.9 14 087.1 12 844.1 11 737.5 11 788.7Andere Others Autres c c c c c
Insgesamt Total Total 16 454.4 15 556.1 14 151.7 12 946.5 13 304.7
Top 5 der Wirkstoffeim WeinanbauTabelle E - 4.7
Top 5 Al appliedto grape crops
Table E - 4.7
(in tonnes of Al)
Top 5 des MA utiliséespour la viticulture
Tableau E - 4.7
(in Tonnen Wirkstoff) (en tonnes de MA)
WirkstoffActive
Ingredient(AI)
Matièreactive(MA)
Gruppe
GroupGro p
1992 1993 1994 1995 1996
Captan Captan Captane F 162.4 150.8 144.7 229.0 117.1Kupfer Copper Cuivre F 604.4 607.2 587.4 513.9 542.6Mineralöl Mineral oil Huile minérale I c c c c cSulfosat Sulfosate Sulfosate H c c c c cSchwefel Sulphur Soufre F, I 500.3 568.0 615.9 578.7 573.2Andere Others Autres c c c c c
Insgesamt Total Total 2 203.0 2 137.0 2 212.4 2 251.8 2 221.8
Top 5 der Wirkstoffeim BaumobstanbauTabelle E - 4.8
Top 5 Al appliedto tree fruit crops
Table E - 4.8
(in tonnes of Al)
Top 5 des MA utiliséespour l'arboriculture fruitière
Tableau E - 4.8
(in Tonnen Wirkstoff) (en tonnes de MA)
WirkstoffActive
Ingredient(AI)
Matièreactive(MA)
GruppeGroupGroupe
1992 1993 1994 1995 1996
Chlorothalonil Chlorothalonil Chlorothalonil F 0.0 0.0 0.0 0.0 98.4Cypermethrin Cypermethrin Cyperméthrine I 10.4 9.4 9.3 68.9 85.5Mancozeb Mancozeb Mancozèbe F 125.4 106.1 114.6 121.9 175.2Metalaxyl Metalaxyl Métalaxyl F c c c c cSchwefel Sulphur Soufre F, I 1 711.0 1 715.4 1 167.0 1 126.6 1 116.8Andere Others Autres c c c c c
Insgesamt Total Total 2 539.4 2 503.3 2 080.8 2 228.6 2 465.4
Top 5 der Wirkstoffeim GemüseanbauTabelle E - 4.9
Top 5 Al appliedto vegetable crops
Table E - 4.9
(in tonnes of Al)
Top 5 des MA utiliséespour les cultures légumières
Tableau E - 4.9
Quelle / Source: Eurostat.

France
A Pflanzenschutz / Plant protection / Protection des cultures 165
1992 1993 1994 1995 1996
Getreide Cereals Céréales 6 882 6 136 5 980 6 132 6 573Zuckerrüben Sugar beets Betteraves à sucre 461 441 437 458 461Mais Maize Maïs 3 392 3 333 3 138 3 207 3 307Ölsaat Oilseeds Graines oléagineuses 1 644 1 336 1 657 1 827 1 766Kartoffeln Potatoes Pommes de terre 184 164 166 172 175Zitrusfrüchte Citrus Agrumes 3 3 3 3 3Weintrauben Grapes Raisins 948 940 933 927 917Baumobst Tree fruits Fruits du verger 182 182 180 172 168Gemüse Vegetables Légumes 331 314 317 325 321
Insgesamt Total Total 14 026 12 850 12 811 13 223 13 691
Gesamte Anbau-fläche für Acker-und Dauerkulturen
Total arable andpermanent croparea
Superficie totaledes cultures de terres arables etcultures perman.
19 010 19 153 19 251 19 308 19 282
AnbauflächeTabelle F - 1
Crop areaTable F - 1
(1 000 ha)
Superficie cultivéeTableau F - 1
(kg Wirkstoff / ha) (kg de MA / ha)
1992 1993 1994 1995 1996
Getreide Cereals Céréales 3.0 2.6 2.4 2.5 2.4Zuckerrüben Sugar beets Betteraves à sucre 4.8 5.0 4.6 5.2 5.7Mais Maize Maïs 2.9 2.6 2.8 3.5 3.4Ölsaat Oilseeds Graines oléagineuses 1.8 1.4 1.6 2.2 2.5Kartoffeln Potatoes Pommes de terre 15.4 15.9 14.6 14.5 13.9Zitrusfrüchte Citrus Agrumes 2.6 2.6 3.1 3.6 3.7Weintrauben Grapes Raisins 42.4 47.7 38.9 50.1 50.5Baumobst Tree fruits Fruits du verger 30.0 34.5 33.9 39.4 36.0Gemüse Vegetables Légumes 8.4 8.1 7.5 7.6 8.1
Insgesamt Total Total 6.2 6.6 5.8 6.9 6.7
Dosierung der eingesetztenPflanzenschutzmittelTabelle F - 2
Dosage of PPP useTable F - 2
(kg AI / ha)
Dose de PPP utiliséTableau F - 2
Quelle / Source: Eurostat.

France
166 Pflanzenschutz / Plant protection / Protection des cultures A
(in Tonnen Wirkstoff) (en tonnes de MA)
1992 1993 1994 1995 1996
Getreide Cereals Céréales 20 607 16 089 14 181 15 181 15 514Zuckerrüben Sugar beets Betteraves à sucre 2 199 2 205 2 010 2 388 2 637Mais Maize Maïs 9 668 8 579 8 831 11 148 11 178Ölsaat Oilseeds Graines oléagineuses 2 987 1 877 2 731 4 016 4 477Kartoffeln Potatoes Pommes de terre 2 830 2 616 2 419 2 493 2 437Zitrusfrüchte Citrus Agrumes 7 7 9 10 11Weintrauben Grapes Raisins 40 165 44 892 36 278 46 403 46 341Baumobst Tree fruits Fruits du verger 5 438 6 285 6 105 6 776 6 047Gemüse Vegetables Légumes 2 784 2 540 2 377 2 465 2 591
Insgesamt Total Total 86 686 85 091 74 941 90 881 91 233
Eingesetzte Mengen anPflanzenschutzmittelnTabelle F - 3.1
Volume of PPP useTable F - 3.1
(in tonnes of Al)
Volume de PPP utiliséTableau F - 3.1
1992 1993 1994 1995 1996
Getreide Cereals Céréales 100 78 69 74 75Zuckerrüben Sugar beets Betteraves à sucre 100 100 91 109 120Mais Maize Maïs 100 89 91 115 116Ölsaat Oilseeds Graines oléagineuses 100 63 91 134 150Kartoffeln Potatoes Pommes de terre 100 92 85 88 86Zitrusfrüchte Citrus Agrumes 100 104 119 144 156Weintrauben Grapes Raisins 100 112 90 116 115Baumobst Tree fruits Fruits du verger 100 116 112 125 111Gemüse Vegetables Légumes 100 91 85 89 93
Insgesamt Total Total 100 98 86 105 105
Index der eingesetzten Mengenan PflanzenschutzmittelnTabelle F - 3.2
Index of volume of PPP used
Table F - 3.2
(1992 = 100)
Indice de volumede PPP utilisé
Tableau F - 3.2
1992 1993 1994 1995 1996
Getreide Cereals Céréales 24 19 19 17 17Zuckerrüben Sugar beets Betteraves à sucre 3 3 3 3 3Mais Maize Maïs 11 10 12 12 12Ölsaat Oilseeds Graines oléagineuses 3 2 4 4 5Kartoffeln Potatoes Pommes de terre 3 3 3 3 3Zitrusfrüchte Citrus Agrumes 0 0 0 0 0Weintrauben Grapes Raisins 46 53 48 51 51Baumobst Tree fruits Fruits du verger 6 7 8 7 7Gemüse Vegetables Légumes 3 3 3 3 3
Insgesamt Total Total 100 100 100 100 100
Anteil an den eingesetzten Mengen an PflanzenschutzmittelnTabelle F - 3.3
Share of PPPvolume used
Table F - 3.3
(%)
Pourcentage du volumede PPP utilisé
Tableau F - 3.3
Quelle / Source: Eurostat.
France
A Pflanzenschutz / Plant protection / Protection des cultures 167
(in Tonnen Wirkstoff) (en tonnes de MA)
WirkstoffActive
Ingredient(AI)
Matièreactive(MA)
GruppeGroup
Groupe1992 1993 1994 1995 1996
Fenpropidin Fenpropidin Fenpropidine F 1 314.7 1 078.9 1 127.4 892.5 882.0Fenpropimorph Fenpropimorph Fenpropimorphe F 2 128.6 1 461.9 1 009.4 866.0 953.6Glyphosat Glyphosate Glyphosate H 1 026.0 1 102.1 1 313.8 1 645.0 1 844.9Isoproturon Isoproturon Isoproturon H 1 277.1 1 004.9 879.0 865.1 1 055.8Mecoprop Mecoprop Mécoprop H 991.6 823.3 878.5 778.6 791.0Andere Others Autres 13 869.4 10 617.7 8 972.6 10 133.7 9 986.5
Insgesamt Total Total 20 607.3 16 088.8 14 180.7 15 180.8 15 513.8
Top 5 der Wirkstoffeim GetreideanbauTabelle F - 4.1
Top 5 Al appliedto cereal crops
Table F - 4.1
(in tonnes of Al)
Top 5 des MA utiliséespour les cultures céréalières
Tableau F - 4.1
(in Tonnen Wirkstoff) (en tonnes de MA)
WirkstoffActive
Ingredient(AI)
Matièreactive(MA)
GruppeGroupGroupe
1992 1993 1994 1995 1996
Chloridazon Chloridazone Chloridazone H 209.3 165.8 185.9 203.3 272.4Cyproconazol Cyproconazole Cyproconazole F 86.3 196.4 198.0 229.3 246.2Fentin Fentin Fentine F 90.4 200.1 200.6 231.0 247.3Metamitron Metamitron Métamitrone H 662.3 590.4 480.6 492.1 490.5Schwefel Sulphur Soufre F, I 403.8 402.8 353.4 483.0 646.1Andere Others Autres 747.3 649.1 591.3 749.0 734.1
Insgesamt Total Total 2 199.3 2 204.6 2 009.8 2 387.7 2 636.6
Top 5 der Wirkstoffeim ZuckerrübenanbauTabelle F - 4.2
Top 5 Al appliedto sugar beet crops
Table F - 4.2
(in tonnes of Al)
Top 5 des MA utiliséespour les cultures de
betteraves à sucreTableau F - 4.2
(in Tonnen Wirkstoff) (en tonnes de MA)
WirkstoffActive
Ingredient(AI)
Matièreactive(MA)
GruppeGroupGroupe
1992 1993 1994 1995 1996
Atrazin Atrazine Atrazine H 4 996.9 4 525.3 4 527.9 6 149.1 5 525.9Benoxacor Benoxacor Benoxacor H c c c c cMetolachlor Metolachlor Metolachlor H 1 198.7 880.7 998.1 1 307.7 1 686.7Pyridate Pyridate Pyridate H 6.8 6.8 0.0 363.4 353.4Simazin Simazine Simazine H 372.8 273.8 273.3 296.7 337.4Andere Others Autres c c c c c
Insgesamt Total Total 9 668.2 8 578.9 8 831.2 11 148.3 11 178.0
Top 5 der Wirkstoffeim MaisanbauTabelle F - 4.3
Top 5 Al appliedto maize crops
Table F - 4.3
(in tonnes of Al)
Top 5 des MA utiliséespour les cultures de maïs
Tableau F - 4.3
Quelle / Source: Eurostat.

France
168 Pflanzenschutz / Plant protection / Protection des cultures A
(in Tonnen Wirkstoff) (en tonnes de MA)
WirkstoffActive
Ingredient(AI)
Matièreactive(MA)
GruppeGroup
Groupe1992 1993 1994 1995 1996
Carbendazim Carbendazim Carbendazime F 275.3 214.7 325.5 480.9 510.0Clomazone Clomazone Clomazone H c c c c cDifenoconazole Difenoconazole Difénoconazole F c c c c cFenpropimorph Fenpropimorph Fenpropimorphe F 7.0 18.7 119.2 160.7 220.9Tebutam Tebutam Tébutame H c c c c cAndere Others Autres 968.1 550.2 680.5 885.2 871.4
Insgesamt Total Total 2 987.4 1 877.4 2 731.2 4 016.3 4 477.4
Top 5 der Wirkstoffeim Anbau von ÖlsaatenTabelle F - 4.4
Top 5 Al appliedto oilseed crops
Table F - 4.4
(in tonnes of Al)
Top 5 des MA utiliséespour les cultures de
graines oléagineusesTableau F - 4.4
(in Tonnen Wirkstoff) (en tonnes de MA)
WirkstoffActive
Ingredient(AI)
Matièreactive(MA)
GruppeGroup
Groupe1992 1993 1994 1995 1996
Cymoxanil Cymoxanil Cymoxanil F 580.0 480.7 354.8 361.8 284.5Flurochloridone Flurochloridone Flurochloridone H c c c c cMancozeb Mancozeb Mancozèbe F 1 340.7 1 096.1 1 018.8 938.2 925.6Maneb Maneb Manèbe F 79.0 180.1 170.0 159.7 156.4Prosulfocarb Prosulfocarb Prosulfocarbe H 189.5 171.7 240.0 414.9 367.5Andere Others Autres c c c c c
Insgesamt Total Total 2 830.2 2 616.1 2 419.3 2 492.8 2 437.3
Top 5 der Wirkstoffeim KartoffelanbauTabelle F - 4.5
Top 5 Al appliedto potato crops
Table F - 4.5
(in tonnes of Al)
Top 5 des MA utiliséespour les cultures de
pommes de terreTableau F - 4.5
(in Tonnen Wirkstoff) (en tonnes de MA)
WirkstoffActive
Ingredient(AI)
Matièreactive(MA)
GruppeGroupGroupe
1992 1993 1994 1995 1996
Kupfer Copper Cuivre F 2 576.1 2 270.5 1 708.0 1 702.4 2 305.8Folpet Folpet Folpel F 2 026.8 2 522.5 2 382.2 2 045.3 2 068.8Fosetyl Fosetyl Fosetyl F 1 249.0 2 319.0 2 378.0 2 484.0 2 213.5Mancozeb Mancozeb Mancozèbe F 3 623.4 3 585.2 2 558.0 2 889.3 3 114.0Schwefel Sulphur Soufre F, I 19 426.9 23 081.7 16 693.5 25 168.7 24 352.6Andere Others Autres 11 262.3 11 113.5 10 558.2 12 113.7 12 285.8
Insgesamt Total Total 40 164.6 44 892.4 36 277.9 46 403.4 46 340.6
Top 5 der Wirkstoffeim WeinanbauTabelle F - 4.6
Top 5 Al appliedto grape crops
Table F - 4.6
(in tonnes of Al)
Top 5 des MA utiliséespour la viticulture
Tableau F - 4.6
Quelle / Source: Eurostat.

France
A Pflanzenschutz / Plant protection / Protection des cultures 169
(in Tonnen Wirkstoff) (en tonnes de MA)
WirkstoffActive
Ingredient(AI)
Matièreactive(MA)
GruppeGroupGroupe
1992 1993 1994 1995 1996
Captan Captan Captane F 369.0 545.5 623.4 824.0 606.5Metazachlor Metazachlor Métazachlore H 172.0 192.9 269.8 319.9 367.0Metiram Metiram Métirame F 280.2 385.8 331.3 388.5 366.7Mineralöl Mineral oil Huile minérale I c c c c cSchwefel Sulphur Soufre F, I 2 257.3 2 452.0 2 238.9 2 419.3 2 316.9Andere Others Autres c c c c c
Insgesamt Total Total 5 438.2 6 284.8 6 105.2 6 776.3 6 046.7
Top 5 der Wirkstoffeim BaumobstanbauTabelle F - 4.7
Top 5 Al appliedto tree fruit crops
Table F - 4.7
(in tonnes of Al)
Top 5 des MA utiliséespour l'arboriculture fruitière
Tableau F - 4.7
(in Tonnen Wirkstoff) (en tonnes de MA)
WirkstoffActive
Ingredient(AI)
Matièreactive(MA)
GruppeGroupGroupe
1992 1993 1994 1995 1996
Bentazon Bentazone Bentazone H 170.8 140.3 91.1 101.9 220.0Chlorothalonil Chlorothalonil Chlorothalonil F 132.8 171.9 222.8 158.0 114.3Schwefel Sulphur Soufre F, I 1 287.4 1 471.9 1 290.7 1 479.6 1 466.3Tridemorph Tridemorph Tridémorphe F 91.3 41.1 19.6 115.6 96.5Vinclozolin Vinclozolin Vinchlozoline F c c c c cAndere Others Autres c c c c c
Insgesamt Total Total 2 783.9 2 540.4 2 376.7 2 464.9 2 591.1
Top 5 der Wirkstoffeim GemüseanbauTabelle F - 4.8
Top 5 Al appliedto vegetable crops
Table F - 4.8
(in tonnes of Al)
Top 5 des MA utiliséespour les cultures légumières
Tableau F - 4.8
Quelle / Source: Eurostat.

Ireland
170 Pflanzenschutz / Plant protection / Protection des cultures A
1992 1993 1994 1995 1996
Getreide Cereals Céréales 275 260 244 249 267Zuckerrüben Sugar beets Betteraves à sucre 31 32 35 35 32Mais Maize Maïs 0 0 0 0 0Ölsaat Oilseeds Graines oléagineuses 6 3 6 4 3Kartoffeln Potatoes Pommes de terre 22 22 21 22 24Zitrusfrüchte Citrus Agrumes 0 0 0 0 0Weintrauben Grapes Raisins 0 0 0 0 0Baumobst Tree fruits Fruits du verger 0 0 0 0 0Gemüse Vegetables Légumes 7 0 0 0 0
Insgesamt Total Total 341 317 307 311 327
Gesamte Anbau-fläche für Acker-und Dauerkulturen
Total arable andpermanent croparea
Superficie totaledes cultures de terres arables etcultures perman.
798 959 1 097 1 055 1 102
AnbauflächeTabelle IRL - 1
Crop areaTable IRL - 1
(1 000 ha)
Superficie cultivéeTableau IRL - 1
(kg Wirkstoff / ha) (kg de MA / ha)
1992 1993 1994 1995 1996
Getreide Cereals Céréales 1.2 1.0 1.1 1.4 1.3Zuckerrüben Sugar beets Betteraves à sucre 1.8 0.4 0.5 0.5 0.5Mais Maize Maïs - - - - -Ölsaat Oilseeds Graines oléagineuses 1.1 2.3 0.8 1.1 1.4Kartoffeln Potatoes Pommes de terre 4.3 3.6 3.8 2.9 2.7Zitrusfrüchte Citrus Agrumes - - - - -Weintrauben Grapes Raisins - - - - -Baumobst Tree fruits Fruits du verger - - - - -Gemüse Vegetables Légumes 9.8 : : : :
Insgesamt Total Total 1.6 1.4 1.5 1.7 1.6
Dosierung der eingesetztenPflanzenschutzmittelTabelle IRL - 2
Dosage of PPP useTable IRL - 2
(kg AI / ha)
Dose de PPP utiliséTableau IRL - 2
Quelle / Source: Eurostat.

Ireland
A Pflanzenschutz / Plant protection / Protection des cultures 171
(in Tonnen Wirkstoff) (en tonnes de MA)
1992 1993 1994 1995 1996
Getreide Cereals Céréales 330 261 270 349 344Zuckerrüben Sugar beets Betteraves à sucre 56 14 19 19 17Mais Maize Maïs 0 0 0 8 9Ölsaat Oilseeds Graines oléagineuses 7 8 5 4 5Kartoffeln Potatoes Pommes de terre 96 79 81 65 65Zitrusfrüchte Citrus Agrumes 0 0 0 0 0Weintrauben Grapes Raisins 0 0 0 0 0Baumobst Tree fruits Fruits du verger 2 2 4 3 3Gemüse Vegetables Légumes 70 76 83 83 86
Insgesamt Total Total 561 439 463 531 529
Eingesetzte Mengen anPflanzenschutzmittelnTabelle IRL - 3.1
Volume of PPP useTable IRL - 3.1
(in tonnes of Al)
Volume de PPP utiliséTableau IRL - 3.1
1992 1993 1994 1995 1996
Getreide Cereals Céréales 100 79 82 106 104Zuckerrüben Sugar beets Betteraves à sucre 100 25 34 34 31Mais Maize Maïs - - - - -Ölsaat Oilseeds Graines oléagineuses 100 121 81 67 76Kartoffeln Potatoes Pommes de terre 100 82 85 68 68Zitrusfrüchte Citrus Agrumes - - - - -Weintrauben Grapes Raisins - - - - -Baumobst Tree fruits Fruits du verger 100 81 160 148 130Gemüse Vegetables Légumes 100 108 118 118 122
Insgesamt Total Total 100 78 83 95 94
Index der eingesetzten Mengenan PflanzenschutzmittelnTabelle IRL - 3.2
Index of volume of PPP usedTable IRL - 3.2
(1992 = 100)
Indice de volumede PPP utiliséTableau IRL - 3.2
1992 1993 1994 1995 1996
Getreide Cereals Céréales 59 59 58 66 65Zuckerrüben Sugar beets Betteraves à sucre 10 3 4 4 3Mais Maize Maïs 0 0 0 1 2Ölsaat Oilseeds Graines oléagineuses 1 2 1 1 1Kartoffeln Potatoes Pommes de terre 17 18 18 12 12Zitrusfrüchte Citrus Agrumes 0 0 0 0 0Weintrauben Grapes Raisins 0 0 0 0 0Baumobst Tree fruits Fruits du verger 0 0 1 1 1Gemüse Vegetables Légumes 13 17 18 16 16
Insgesamt Total Total 100 100 100 100 100
Anteil an den eingesetzten Mengen an PflanzenschutzmittelnTabelle IRL - 3.3
Share of PPPvolume usedTable IRL - 3.3
(%)
Pourcentage du volumede PPP utiliséTableau IRL - 3.3
Quelle / Source: Eurostat.

Ireland
172 Pflanzenschutz / Plant protection / Protection des cultures A
(in Tonnen Wirkstoff) (en tonnes de MA)
WirkstoffActive
Ingredient(AI)
Matièreactive(MA)
GruppeGroup
Groupe1992 1993 1994 1995 1996
Chlorothalonil Chlorothalonil Chlorothalonil F 33.9 36.9 36.0 34.8 25.2Fenpropidin Fenpropidin Fenpropidine F 49.5 42.8 20.3 45.4 35.9Fenpropimorph Fenpropimorph Fenpropimorphe F 17.0 15.8 7.8 18.8 38.2Glyphosat Glyphosate Glyphosate H 50.4 60.5 56.3 58.7 62.7Propiconazol Propiconazole Propiconazole F 30.7 28.7 25.5 29.5 30.0Andere Others Autres 148.4 76.1 124.6 161.7 152.1
Insgesamt Total Total 329.9 260.8 270.4 348.8 344.1
Top 5 der Wirkstoffeim GetreideanbauTabelle IRL - 4.1
Top 5 Al appliedto cereal crops
Table IRL - 4.1
(in tonnes of Al)
Top 5 des MA utiliséespour les cultures céréalières
Tableau IRL - 4.1
(in Tonnen Wirkstoff) (en tonnes de MA)
WirkstoffActive
Ingredient(AI)
Matièreactive(MA)
GruppeGroupGroupe
1992 1993 1994 1995 1996
Clopyralid Clopyralid Clopyralid H 1.6 1.4 1.4 1.4 1.4Fluazifop Fluazifop Fluazifop H 0.0 1.1 1.1 1.0 0.7Flusilazol Flusilazole Flusilazole F 0.8 0.7 0.8 0.8 0.9Lenacil Lenacil Lenacile H 8.8 9.6 9.6 11.7 9.7Sulfosat Sulfosate Sulfosate H c c c c cAndere Others Autres c c c c c
Insgesamt Total Total 56.1 14.3 19.3 19.2 17.3
Top 5 der Wirkstoffeim ZuckerrübenanbauTabelle IRL - 4.2
Top 5 Al appliedto sugar beet crops
Table IRL - 4.2
(in tonnes of Al)
Top 5 des MA utiliséespour les cultures de
betteraves à sucreTableau IRL - 4.2
(in Tonnen Wirkstoff) (en tonnes de MA)
WirkstoffActive
Ingredient(AI)
Matièreactive(MA)
GruppeGroupGroupe
1992 1993 1994 1995 1996
Dimethomorph Dimethomorph Diméthomorphe F c c c c cDiquat Diquat Diquat H 16.4 0.0 13.5 10.3 10.0Mancozeb Mancozeb Mancozèbe F 40.1 42.0 37.6 29.9 34.3Metalaxyl Metalaxyl Métalaxyl F c c c c cSimazin Simazine Simazine H 7.9 5.6 5.7 3.4 3.6Andere Others Autres c c c c c
Insgesamt Total Total 95.7 78.6 81.5 65.3 65.3
Top 5 der Wirkstoffeim KartoffelanbauTabelle IRL - 4.3
Top 5 Al appliedto potato crops
Table IRL - 4.3
(in tonnes of Al)
Top 5 des MA utiliséespour les cultures de
pommes de terreTableau IRL - 4.3
Quelle / Source: Eurostat.

Ireland
A Pflanzenschutz / Plant protection / Protection des cultures 173
(in Tonnen Wirkstoff) (en tonnes de MA)
WirkstoffActive
Ingredient(AI)
Matièreactive(MA)
GruppeGroup
Groupe1992 1993 1994 1995 1996
Chlorothalonil Chlorothalonil Chlorothalonil F 8.6 9.8 11.7 6.1 5.6Paraquat Paraquat Paraquat H c c c c cPropachlor Propachlor Propachlore H c c c c cTerbuthylazin Terbuthylazine Terbuthylazine H 3.2 3.7 4.0 3.8 4.7Terbutryn Terbutryn Terbutryne H c c c c cAndere Others Autres 15.8 16.2 17.2 15.3 13.5
Insgesamt Total Total 70.1 75.6 83.1 82.7 85.8
Top 5 der Wirkstoffeim GemüseanbauTableau IRL - 4.4
Top 5 Al appliedto vegetable crops
Table IRL - 4.4
(in tonnes of Al)
Top 5 des MA utiliséespour les cultures légumières
Tableau IRL - 4.4
Quelle / Source: Eurostat.
Italia
174 Pflanzenschutz / Plant protection / Protection des cultures A
1992 1993 1994 1995 1996
Getreide Cereals Céréales 2 968 2 724 2 764 2 864 2 818Zuckerrüben Sugar beets Betteraves à sucre 296 280 282 284 250Mais Maize Maïs 1 173 1 251 1 219 1 244 1 314Ölsaat Oilseeds Graines oléagineuses 125 125 238 276 318Kartoffeln Potatoes Pommes de terre 106 93 86 89 91Zitrusfrüchte Citrus Agrumes 0 0 0 185 184Weintrauben Grapes Raisins 1 005 979 946 926 916Baumobst Tree fruits Fruits du verger 304 300 301 294 289Gemüse Vegetables Légumes 503 494 487 481 0
Insgesamt Total Total 6 480 6 247 6 322 6 644 6 180
Gesamte Anbau-fläche für Acker-und Dauerkulturen
Total arable andpermanent croparea
Superficie totaledes cultures de terres arables etcultures perman.
12 353 13 374 12 784 12 617 11 403
AnbauflächeTabelle I - 1
Crop areaTable I - 1
(1 000 ha)
Superficie cultivéeTableau I - 1
(kg Wirkstoff / ha) (kg de MA / ha)
1992 1993 1994 1995 1996
Getreide Cereals Céréales 0.4 0.4 0.5 0.5 0.4Zuckerrüben Sugar beets Betteraves à sucre 5.5 5.3 5.7 5.7 5.5Mais Maize Maïs 4.7 4.1 4.4 4.4 3.8Ölsaat Oilseeds Graines oléagineuses 1.2 2.1 1.7 1.7 1.0Kartoffeln Potatoes Pommes de terre 5.1 6.3 7.0 7.3 6.1Zitrusfrüchte Citrus Agrumes : : : 6.6 6.6Weintrauben Grapes Raisins 27.3 37.3 37.6 38.7 41.0Baumobst Tree fruits Fruits du verger 32.1 34.6 33.9 34.4 27.6Gemüse Vegetables Légumes 3.0 3.2 3.5 4.2 :
Insgesamt Total Total 7.5 9.3 9.2 8.8 9.3
Dosierung der eingesetztenPflanzenschutzmittelTabelle I - 2
Dosage of PPP useTable I - 2
(kg AI / ha)
Dose de PPP utiliséTableau I - 2
Quelle / Source: Eurostat.

Italia
A Pflanzenschutz / Plant protection / Protection des cultures 175
(in Tonnen Wirkstoff) (en tonnes de MA)
1992 1993 1994 1995 1996
Getreide Cereals Céréales 1 040 1 087 1 314 1 294 1 188Zuckerrüben Sugar beets Betteraves à sucre 1 619 1 499 1 622 1 624 1 365Mais Maize Maïs 5 542 5 181 5 372 5 535 4 936Ölsaat Oilseeds Graines oléagineuses 147 264 411 458 312Kartoffeln Potatoes Pommes de terre 545 581 604 648 556Zitrusfrüchte Citrus Agrumes 1 206 1 165 1 138 1 216 1 220Weintrauben Grapes Raisins 27 494 36 555 35 543 35 829 37 528Baumobst Tree fruits Fruits du verger 9 746 10 390 10 208 10 127 7 976Gemüse Vegetables Légumes 1 532 1 580 1 716 2 031 2 115
Insgesamt Total Total 48 869 58 301 57 927 58 763 57 195
Eingesetzte Mengen anPflanzenschutzmittelnTabelle I - 3.1
Volume of PPP useTable I - 3.1
(in tonnes of Al)
Volume de PPP utiliséTableau I - 3.1
1992 1993 1994 1995 1996
Getreide Cereals Céréales 100 105 126 124 114Zuckerrüben Sugar beets Betteraves à sucre 100 93 100 100 84Mais Maize Maïs 100 93 97 100 89Ölsaat Oilseeds Graines oléagineuses 100 180 280 312 213Kartoffeln Potatoes Pommes de terre 100 107 111 119 102Zitrusfrüchte Citrus Agrumes 100 97 94 101 101Weintrauben Grapes Raisins 100 133 129 130 136Baumobst Tree fruits Fruits du verger 100 107 105 104 82Gemüse Vegetables Légumes 100 103 112 133 138
Insgesamt Total Total 100 119 119 120 117
Index der eingesetzten Mengenan PflanzenschutzmittelnTabelle I - 3.2
Index of volume of PPP used
Table I - 3.2
(1992 = 100)
Indice de volumede PPP utilisé
Tableau I - 3.2
1992 1993 1994 1995 1996
Getreide Cereals Céréales 2 2 2 2 2Zuckerrüben Sugar beets Betteraves à sucre 3 3 3 3 2Mais Maize Maïs 11 9 9 9 9Ölsaat Oilseeds Graines oléagineuses 0 0 1 1 1Kartoffeln Potatoes Pommes de terre 1 1 1 1 1Zitrusfrüchte Citrus Agrumes 2 2 2 2 2Weintrauben Grapes Raisins 56 63 61 61 66Baumobst Tree fruits Fruits du verger 20 18 18 17 14Gemüse Vegetables Légumes 3 3 3 3 4
Insgesamt Total Total 100 100 100 100 100
Anteil an den eingesetztenMengen an PflanzenschutzmittelnTabelle I - 3.3
Share of PPPvolume used
Table I - 3.3
(%)
Pourcentage du volumede PPP utilisé
Tableau I - 3.3
Quelle / Source: Eurostat.

Italia
176 Pflanzenschutz / Plant protection / Protection des cultures A
(in Tonnen Wirkstoff) (en tonnes de MA)
WirkstoffActive
Ingredient(AI)
Matièreactive(MA)
GruppeGroup
Groupe1992 1993 1994 1995 1996
Chlorotoluron Chlorotoluron Chlortoluron H 101.5 116.1 122.4 127.6 68.3Dicamba Dicamba Dicamba H 238.8 225.7 227.1 229.3 227.5Glyphosat Glyphosate Glyphosate H 197.6 211.8 234.3 271.7 299.9Pendimethalin Pendimethalin Pendiméthaline H 57.1 60.7 76.3 74.9 76.8Tralkoxydim Tralkoxydim Tralkoxydime H c c c c cAndere Others Autres c c c c c
Insgesamt Total Total 1 039.7 1 087.1 1 314.4 1 294.1 1 188.1
Top 5 der Wirkstoffeim GetreideanbauTabelle I - 4.1
Top 5 Al appliedto cereal crops
Table I - 4.1
(in tonnes of Al)
Top 5 des MA utiliséespour les cultures céréalières
Tableau I - 4.1
(in Tonnen Wirkstoff) (en tonnes de MA)
WirkstoffActive
Ingredient(AI)
Matièreactive(MA)
GruppeGroupGroupe
1992 1993 1994 1995 1996
Chloridazon Chloridazone Chloridazone H 371.3 269.5 255.4 223.1 152.0Kupfer Copper Cuivre F 397.9 289.4 291.6 310.0 285.3Fentin Fentin Fentine F 51.0 55.4 64.5 79.3 60.9Furathiocarb Furathiocarb Furathiocarbe I c c c c cMetamitron Metamitron Métamitrone H 337.4 316.1 338.6 341.5 278.9Andere Others Autres c c c c c
Insgesamt Total Total 1 618.9 1 498.5 1 621.8 1 624.2 1 364.6
Top 5 der Wirkstoffeim ZuckerrübenanbauTabelle I - 4.2
Top 5 Al appliedto sugar beet crops
Table I - 4.2
(in tonnes of Al)
Top 5 des MA utiliséesdans les cultures de
betteraves à sucreTableau I - 4.2
(in Tonnen Wirkstoff) (en tonnes de MA)
WirkstoffActive
Ingredient(AI)
Matièreactive(MA)
GruppeGroupGroupe
1992 1993 1994 1995 1996
Aclonifen Aclonifen Aclonifen H c c c c cFurathiocarb Furathiocarb Furathiocarbe I c c c c cMetolachlor Metolachlor Metolachlor H 1 970.6 1 845.2 1 922.8 1 890.9 1 705.1Pendimethalin Pendimethalin Pendiméthaline H 211.6 193.5 225.4 258.1 249.9Terbuthylazin Terbuthylazine Terbuthylazine H 1 988.4 1 882.5 1 961.7 1 925.4 1 744.6Andere Others Autres c c c c c
Insgesamt Total Total 5 542.4 5 181.1 5 372.5 5 534.9 4 936.1
Top 5 der Wirkstoffeim MaisanbauTabelle I - 4.3
Top 5 Al appliedto maize crops
Table I - 4.3
(in tonnes of Al)
Top 5 des MA utiliséespour les cultures de maïs
Tableau I - 4.3
Quelle / Source: Eurostat.

Italia
A Pflanzenschutz / Plant protection / Protection des cultures 177
(in Tonnen Wirkstoff) (en tonnes de MA)
WirkstoffActive
Ingredient(AI)
Matièreactive(MA)
GruppeGroup
Groupe1992 1993 1994 1995 1996
Diazinon Diazinon Diazinon I c c c c cMetazachlor Metazachlor Métazachlore H : 6.2 16.1 31.2 22.3Metobromuron Metobromuron Métobromuron H 15.0 25.3 42.5 79.4 67.1Metolachlor Metolachlor Metolachlor H 13.3 19.2 35.4 66.9 52.5Pendimethalin Pendimethalin Pendiméthaline H 19.9 25.9 62.6 61.8 33.3Andere Others Autres c c c c c
Insgesamt Total Total 146.6 263.7 410.8 457.7 312.4
Top 5 der Wirkstoffeim Anbau von ÖlsaatenTabelle I - 4.4
Top 5 Al appliedto oilseed crops
Table I - 4.4
(in tonnes of Al)
Top 5 des MA utiliséespour les cultures de
graines oléagineusesTableau I - 4.4
(in Tonnen Wirkstoff) (en tonnes de MA)
WirkstoffActive
Ingredient(AI)
Matièreactive(MA)
GruppeGroup
Groupe1992 1993 1994 1995 1996
Kupfer Copper Cuivre F 303.9 311.8 315.8 327.3 353.7Cymoxanil Cymoxanil Cymoxanil F 9.6 10.2 11.0 10.9 15.0Furathiocarb Furathiocarb Furathiocarbe I c c c c cMetalaxyl Metalaxyl Métalaxyl F c c c c cOxadixyl Oxadixyl Oxadixyl F 16.1 15.7 15.7 16.3 17.3Andere Others Autres c c c c c
Insgesamt Total Total 545.2 581.1 603.7 647.8 555.8
Top 5 der Wirkstoffeim KartoffelanbauTabelle I - 4.5
Top 5 Al appliedto potato crops
Table I - 4.5
(in tonnes of Al)
Top 5 des MA utiliséespour les cultures de
pommes de terreTableau I - 4.5
(in Tonnen Wirkstoff) (en tonnes de MA)
WirkstoffActive
Ingredient(AI)
Matièreactive(MA)
GruppeGroupGroupe
1992 1993 1994 1995 1996
Kupfer Copper Cuivre F 122.2 123.6 128.6 124.8 143.4Fosetyl Fosetyl Fosetyl F 151.2 110.6 92.4 147.0 159.6Glyphosat Glyphosate Glyphosate H 98.6 129.1 137.9 159.1 167.4Methidathion Methidathion Méthidathion I c c c c cMineralöl Mineral oil Huile minérale I c c c c cAndere Others Autres c c c c c
Insgesamt Total Total 1 205.7 1 164.8 1 137.5 1 216.4 1 220.3
Top 5 der Wirkstoffe imAnbau von ZitrusfrüchtenTabelle I - 4.6
Top 5 Al appliedto citrus crops
Table I - 4.6
(in tonnes of Al)
Top 5 des MA utiliséespour les cultures d'agrumes
Tableau I - 4.6
Quelle / Source: Eurostat.

Italia
178 Pflanzenschutz / Plant protection / Protection des cultures A
(in Tonnen Wirkstoff) (en tonnes de MA)
WirkstoffActive
Ingredient(AI)
Matièreactive(MA)
GruppeGroupGroupe
1992 1993 1994 1995 1996
Kupfer Copper Cuivre F 4 558.4 3 945.8 3 876.3 4 002.7 4 188.0Mancozeb Mancozeb Mancozèbe F 1 320.6 1 892.3 1 027.1 1 563.7 1 215.0Metalaxyl Metalaxyl Métalaxyl F c c c c cMetiram Metiram Métirame F 2.7 537.9 545.9 546.8 589.8Schwefel Sulphur Soufre F, I 18 741.7 27 171.3 27 258.0 26 712.1 28 822.6Andere Others Autres c c c c c
Insgesamt Total Total 27 493.7 36 555.2 35 542.6 35 829.3 37 527.8
Top 5 der Wirkstoffeim WeinanbauTabelle I - 4.7
Top 5 Al appliedto grape crops
Table I - 4.7
(in tonnes of Al)
Top 5 des MA utiliséespour la viticulture
Tableau I - 4.7
(in Tonnen Wirkstoff) (en tonnes de MA)
WirkstoffActive
Ingredient(AI)
Matièreactive(MA)
GruppeGroupGroupe
1992 1993 1994 1995 1996
Captan Captan Captane F 254.0 262.6 277.9 278.6 484.2Kupfer Copper Cuivre F 794.9 541.4 545.4 558.9 587.3Mineralöl Mineral oil Huile minérale I c c c c cSchwefel Sulphur Soufre F, I 4 335.4 4 457.7 4 413.6 4 345.4 2 281.3Ziram Ziram Zirame F 1 141.1 1 062.0 1 056.0 1 089.6 1 008.3Andere Others Autres c c c c c
Insgesamt Total Total 9 720.6 10 362.8 10 182.0 10 103.7 7 953.2
Top 5 der Wirkstoffeim BaumobstanbauTabelle I - 4.8
Top 5 Al appliedto tree fruit crops
Table I - 4.8
(in tonnes of Al)
Top 5 des MA utiliséespour l'arboriculture fruitière
Tableau I - 4.8
(in Tonnen Wirkstoff) (en tonnes de MA)
WirkstoffActive
Ingredient(AI)
Matièreactive(MA)
GruppeGroupGroupe
1992 1993 1994 1995 1996
Chlorothalonil Chlorothalonil Chlorothalonil F 53.9 48.9 61.6 199.3 188.0Kupfer Copper Cuivre F 620.4 600.8 609.4 698.5 832.6Furathiocarb Furathiocarb Furathiocarbe I c c c c cMetalaxyl Metalaxyl Métalaxyl F c c c c cSchwefel Sulphur Soufre F, I 69.4 97.5 91.5 96.7 97.3Andere Others Autres c c c c c
Insgesamt Total Total 1 531.8 1 580.0 1 716.2 2 031.3 2 114.6
Top 5 der Wirkstoffeim GemüseanbauTabelle I - 4.9
Top 5 Al appliedto vegetable crops
Table I - 4.9
(in tonnes of Al)
Top 5 des MA utiliséespour les cultures légumières
Tableau I - 4.9
Quelle / Source: Eurostat.

Nederland
A Pflanzenschutz / Plant protection / Protection des cultures 179
1992 1993 1994 1995 1996
Getreide Cereals Céréales 161 158 165 170 177Zuckerrüben Sugar beets Betteraves à sucre 121 117 115 116 117Mais Maize Maïs 225 225 240 228 234Ölsaat Oilseeds Graines oléagineuses 4 2 1 1 0Kartoffeln Potatoes Pommes de terre 187 166 170 179 185Zitrusfrüchte Citrus Agrumes 0 0 0 0 0Weintrauben Grapes Raisins 0 0 0 0 0Baumobst Tree fruits Fruits du verger 24 23 23 22 21Gemüse Vegetables Légumes 76 74 76 75 76
Insgesamt Total Total 798 765 791 793 810
Gesamte Anbau-fläche für Acker-und Dauerkulturen
Total arable andpermanent croparea
Superficie totaledes cultures de terres arables etcultures perman.
928 930 932 953 839
AnbauflächeTabelle NL - 1
Crop areaTable NL - 1
(1 000 ha)
Superficie cultivéeTableau NL - 1
(kg Wirkstoff / ha) (kg de MA / ha)
1992 1993 1994 1995 1996
Getreide Cereals Céréales 4.0 4.6 3.2 3.6 4.2Zuckerrüben Sugar beets Betteraves à sucre 2.5 2.5 2.3 2.5 2.2Mais Maize Maïs 2.3 2.0 2.0 2.1 2.5Ölsaat Oilseeds Graines oléagineuses 0.0 0.0 0.0 0.0 :Kartoffeln Potatoes Pommes de terre 10.6 10.9 12.5 11.0 10.3Zitrusfrüchte Citrus Agrumes - - - - -Weintrauben Grapes Raisins - - - - -Baumobst Tree fruits Fruits du verger 20.2 18.2 21.2 29.9 26.1Gemüse Vegetables Légumes 1.6 1.7 1.6 1.7 2.9
Insgesamt Total Total 5.1 5.0 5.1 5.3 5.3
Dosierung der eingesetztenPflanzenschutzmittelTabelle NL - 2
Dosage of PPP useTable NL - 2
(kg AI / ha)
Dose de PPP utiliséTableau NL - 2
Quelle / Source: Eurostat.

Nederland
180 Pflanzenschutz / Plant protection / Protection des cultures A
(in Tonnen Wirkstoff) (en tonnes de MA)
1992 1993 1994 1995 1996
Getreide Cereals Céréales 641 731 534 620 743Zuckerrüben Sugar beets Betteraves à sucre 304 297 264 292 260Mais Maize Maïs 507 457 486 489 574Ölsaat Oilseeds Graines oléagineuses 0 0 0 0 0Kartoffeln Potatoes Pommes de terre 1 982 1 807 2 121 1 978 1 909Zitrusfrüchte Citrus Agrumes 0 0 0 0 0Weintrauben Grapes Raisins 0 0 0 0 0Baumobst Tree fruits Fruits du verger 477 426 496 665 549Gemüse Vegetables Légumes 122 129 123 125 222
Insgesamt Total Total 4 034 3 846 4 024 4 168 4 259
Eingesetzte Mengen anPflanzenschutzmittelnTabelle NL - 3.1
Volume of PPP useTable NL - 3.1
(in tonnes of Al)
Volume de PPP utiliséTableau NL - 3.1
1992 1993 1994 1995 1996
Getreide Cereals Céréales 100 114 83 97 116Zuckerrüben Sugar beets Betteraves à sucre 100 98 87 96 86Mais Maize Maïs 100 90 96 96 113Ölsaat Oilseeds Graines oléagineuses 100 53 0 0 0Kartoffeln Potatoes Pommes de terre 100 91 107 100 96Zitrusfrüchte Citrus Agrumes - - - - -Weintrauben Grapes Raisins - - - - -Baumobst Tree fruits Fruits du verger 100 89 104 139 115Gemüse Vegetables Légumes 100 106 100 102 182
Insgesamt Total Total 100 95 100 103 106
Index der eingesetzten Mengenan PflanzenschutzmittelnTabelle NL - 3.2
Index of volume of PPP usedTable NL - 3.2
(1992 = 100)
Indice de volumede PPP utiliséTableau NL - 3.2
1992 1993 1994 1995 1996
Getreide Cereals Céréales 16 19 13 15 17Zuckerrüben Sugar beets Betteraves à sucre 8 8 7 7 6Mais Maize Maïs 13 12 12 12 13Ölsaat Oilseeds Graines oléagineuses 0 0 0 0 0Kartoffeln Potatoes Pommes de terre 49 47 53 47 45Zitrusfrüchte Citrus Agrumes 0 0 0 0 0Weintrauben Grapes Raisins 0 0 0 0 0Baumobst Tree fruits Fruits du verger 12 11 12 16 13Gemüse Vegetables Légumes 3 3 3 3 5
Insgesamt Total Total 100 100 100 100 100
Anteil an den eingesetzten Mengen an PflanzenschutzmittelnTabelle NL - 3.3
Share of PPPvolume usedTable NL - 3.3
(%)
Pourcentage du volumede PPP utiliséTableau NL - 3.3
Quelle / Source: Eurostat.

Nederland
A Pflanzenschutz / Plant protection / Protection des cultures 181
(in Tonnen Wirkstoff) (en tonnes de MA)
WirkstoffActive
Ingredient(AI)
Matièreactive(MA)
GruppeGroup
Groupe1992 1993 1994 1995 1996
Fenpropimorph Fenpropimorph Fenpropimorphe F 26.1 17.5 34.7 60.5 101.7Glyphosat Glyphosate Glyphosate H 99.9 81.6 71.0 119.0 127.9MCPA MCPA MCPA H 112.5 108.0 113.5 78.5 175.9Mecoprop-p Mecoprop-p Mécoprop-p H 108.1 248.2 117.4 129.5 103.3Prosulfocarb Prosulfocarb Prosulfocarbe H 1.8 20.9 26.3 31.8 37.4Andere Others Autres 293.2 254.4 171.5 201.1 197.1
Insgesamt Total Total 641.5 730.6 534.3 620.3 743.4
Top 5 der Wirkstoffeim GetreideanbauTabelle NL - 4.1
Top 5 Al appliedto cereal crops
Table NL - 4.1
(in tonnes of Al)
Top 5 des MA utiliséesdans les cultures céréalières
Tableau NL - 4.1
(in Tonnen Wirkstoff) (en tonnes de MA)
WirkstoffActive
Ingredient(AI)
Matièreactive(MA)
GruppeGroupGroupe
1992 1993 1994 1995 1996
Chloridazone Chloridazone Chloridazone H 86.6 80.5 78.4 100.9 116.0Ethofumesat Ethofumesate Ethofumesate H : 0.7 12.8 16.3 12.7Glyphosat Glyphosate Glyphosate H 11.8 9.6 8.4 14.0 15.1Metamitron Metamitron Métamitrone H 158.2 155.1 99.4 112.5 45.5Triallat Triallate Triallate H 20.0 27.6 28.5 20.0 23.8Andere Others Autres 27.6 23.7 37.0 28.1 47.4
Insgesamt Total Total 304.0 297.0 264.5 291.7 260.4
Top 5 der Wirkstoffeim ZuckerrübenanbauTabelle NL - 4.2
Top 5 Al appliedto sugar beet crops
Table NL - 4.2
(in tonnes of Al)
Top 5 des MA utiliséesdans les cultures de
betteraves à sucreTableau NL - 4.2
(in Tonnen Wirkstoff) (en tonnes de MA)
WirkstoffActive
Ingredient(AI)
Matièreactive(MA)
GruppeGroupGroupe
1992 1993 1994 1995 1996
Atrazin Atrazine Atrazine H 266.3 222.7 231.5 228.1 209.4Bentazon Bentazone Bentazone H 154.9 138.2 125.7 121.3 92.1Metolachlor Metolachlor Metolachlor H 44.0 50.9 65.0 74.7 105.0Mineralöl Mineral oil Huile minérale I c c c c cPyridat Pyridate Pyridate H 0.7 0.0 1.6 2.1 80.9Andere Others Autres c c c c c
Insgesamt Total Total 507.1 456.7 485.7 488.5 574.3
Top 5 der Wirkstoffeim MaisanbauTabelle NL - 4.3
Top 5 Al appliedto maize crops
Table NL - 4.3
(in tonnes of Al)
Top 5 des MA utiliséesdans les cultures de maïs
Tableau NL - 4.3
Quelle / Source: Eurostat.
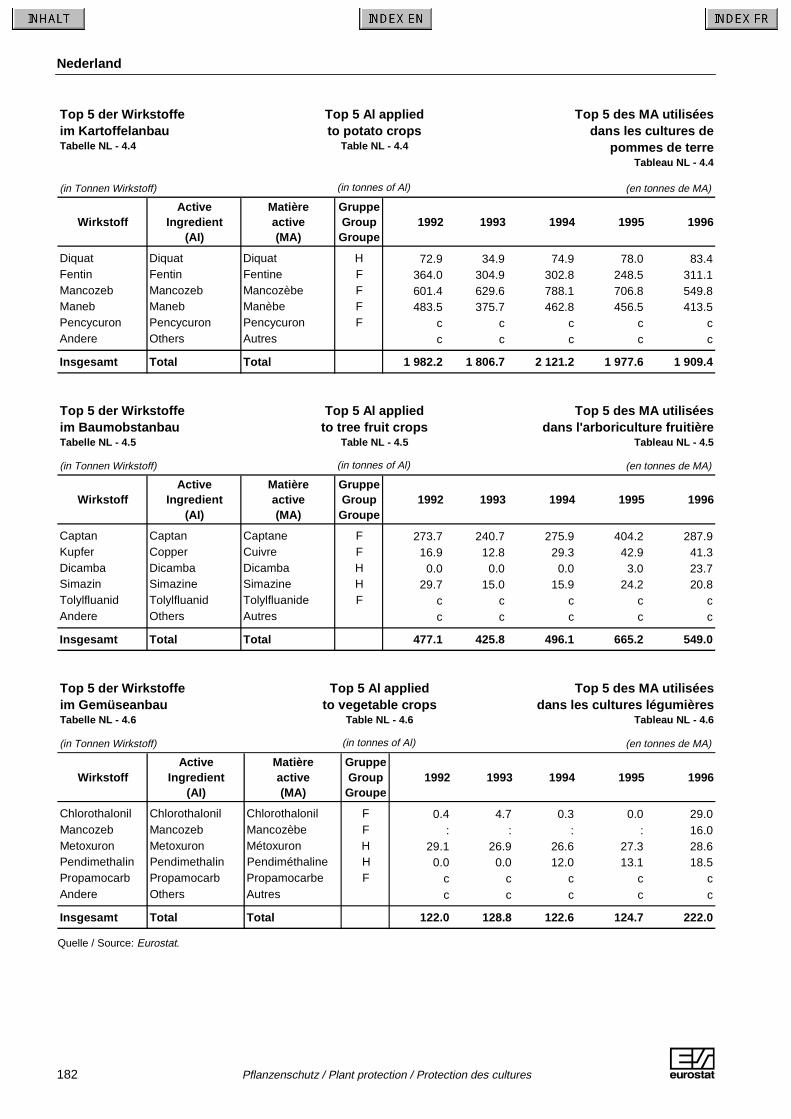
Nederland
182 Pflanzenschutz / Plant protection / Protection des cultures A
(in Tonnen Wirkstoff) (en tonnes de MA)
WirkstoffActive
Ingredient(AI)
Matièreactive(MA)
GruppeGroup
Groupe1992 1993 1994 1995 1996
Diquat Diquat Diquat H 72.9 34.9 74.9 78.0 83.4Fentin Fentin Fentine F 364.0 304.9 302.8 248.5 311.1Mancozeb Mancozeb Mancozèbe F 601.4 629.6 788.1 706.8 549.8Maneb Maneb Manèbe F 483.5 375.7 462.8 456.5 413.5Pencycuron Pencycuron Pencycuron F c c c c cAndere Others Autres c c c c c
Insgesamt Total Total 1 982.2 1 806.7 2 121.2 1 977.6 1 909.4
Top 5 der Wirkstoffeim KartoffelanbauTabelle NL - 4.4
Top 5 Al appliedto potato crops
Table NL - 4.4
(in tonnes of Al)
Top 5 des MA utiliséesdans les cultures de
pommes de terreTableau NL - 4.4
(in Tonnen Wirkstoff) (en tonnes de MA)
WirkstoffActive
Ingredient(AI)
Matièreactive(MA)
GruppeGroup
Groupe1992 1993 1994 1995 1996
Captan Captan Captane F 273.7 240.7 275.9 404.2 287.9Kupfer Copper Cuivre F 16.9 12.8 29.3 42.9 41.3Dicamba Dicamba Dicamba H 0.0 0.0 0.0 3.0 23.7Simazin Simazine Simazine H 29.7 15.0 15.9 24.2 20.8Tolylfluanid Tolylfluanid Tolylfluanide F c c c c cAndere Others Autres c c c c c
Insgesamt Total Total 477.1 425.8 496.1 665.2 549.0
Top 5 der Wirkstoffeim BaumobstanbauTabelle NL - 4.5
Top 5 Al appliedto tree fruit crops
Table NL - 4.5
(in tonnes of Al)
Top 5 des MA utiliséesdans l'arboriculture fruitière
Tableau NL - 4.5
(in Tonnen Wirkstoff) (en tonnes de MA)
WirkstoffActive
Ingredient(AI)
Matièreactive(MA)
GruppeGroupGroupe
1992 1993 1994 1995 1996
Chlorothalonil Chlorothalonil Chlorothalonil F 0.4 4.7 0.3 0.0 29.0Mancozeb Mancozeb Mancozèbe F : : : : 16.0Metoxuron Metoxuron Métoxuron H 29.1 26.9 26.6 27.3 28.6Pendimethalin Pendimethalin Pendiméthaline H 0.0 0.0 12.0 13.1 18.5Propamocarb Propamocarb Propamocarbe F c c c c cAndere Others Autres c c c c c
Insgesamt Total Total 122.0 128.8 122.6 124.7 222.0
Top 5 der Wirkstoffeim GemüseanbauTabelle NL - 4.6
Top 5 Al appliedto vegetable crops
Table NL - 4.6
(in tonnes of Al)
Top 5 des MA utiliséesdans les cultures légumières
Tableau NL - 4.6
Quelle / Source: Eurostat.

Österreich
A Pflanzenschutz / Plant protection / Protection des cultures 183
1992 1993 1994 1995 1996
Getreide Cereals Céréales 530 516 503 485 507Zuckerrüben Sugar beets Betteraves à sucre 54 53 52 52 53Mais Maize Maïs 274 271 273 211 264Ölsaat Oilseeds Graines oléagineuses 83 95 111 118 84Kartoffeln Potatoes Pommes de terre 33 31 30 27 26Zitrusfrüchte Citrus Agrumes 0 0 0 0 0Weintrauben Grapes Raisins 54 50 49 49 49Baumobst Tree fruits Fruits du verger 5 5 5 5 6Gemüse Vegetables Légumes 9 8 8 12 12
Insgesamt Total Total 1 042 1 030 1 032 959 1 002
Gesamte Anbau-fläche für Acker-und Dauerkulturen
Total arable andpermanent croparea
Superficie totaledes cultures de terres arables etcultures perman.
1 497 1 478 1 479 1 480 1 479
Superficie cultivéeTableau A - 1
AnbauflächeTabelle A - 1
Crop areaTable A - 1
(1 000 ha)
(kg Wirkstoff / ha) (kg de MA / ha)
1992 1993 1994 1995 1996
Getreide Cereals Céréales 1.5 1.5 1.7 2.0 1.0Zuckerrüben Sugar beets Betteraves à sucre 5.6 5.6 4.6 5.1 7.0Mais Maize Maïs 2.2 3.0 1.4 1.7 1.4Ölsaat Oilseeds Graines oléagineuses 1.3 1.3 1.0 0.7 0.7Kartoffeln Potatoes Pommes de terre 5.9 5.8 5.5 5.5 6.8Zitrusfrüchte Citrus Agrumes - - - - -Weintrauben Grapes Raisins 14.3 15.2 13.5 13.8 12.3Baumobst Tree fruits Fruits du verger 9.1 13.3 14.9 8.1 16.1Gemüse Vegetables Légumes 4.3 4.6 5.0 3.9 3.6
Insgesamt Total Total 2.7 3.0 2.5 2.7 2.2
Dose de PPP utiliséTableau A - 2
Dosierung der eingesetztenPflanzenschutzmittelTabelle A - 2
Dosage of PPP useTable A - 2
(kg AI / ha)
Quelle / Source: Eurostat.

Österreich
184 Pflanzenschutz / Plant protection / Protection des cultures A
(in Tonnen Wirkstoff) (en tonnes de MA)
1992 1993 1994 1995 1996
Getreide Cereals Céréales 794 759 853 975 531Zuckerrüben Sugar beets Betteraves à sucre 300 301 239 265 370Mais Maize Maïs 595 813 389 353 376Ölsaat Oilseeds Graines oléagineuses 111 122 106 82 62Kartoffeln Potatoes Pommes de terre 196 181 163 148 180Zitrusfrüchte Citrus Agrumes 0 0 0 1 1Weintrauben Grapes Raisins 768 768 667 679 597Baumobst Tree fruits Fruits du verger 50 72 81 44 93Gemüse Vegetables Légumes 40 38 42 49 44
Insgesamt Total Total 2 853 3 055 2 541 2 594 2 254
Volume de PPP utiliséTableau A - 3.1
Eingesetzte Mengen anPflanzenschutzmittelnTabelle A - 3.1
(in tonnes of Al)
Volume of PPP useTable A - 3.1
1992 1993 1994 1995 1996
Getreide Cereals Céréales 100 96 107 123 67Zuckerrüben Sugar beets Betteraves à sucre 100 100 80 88 123Mais Maize Maïs 100 137 65 59 63Ölsaat Oilseeds Graines oléagineuses 100 110 96 73 56Kartoffeln Potatoes Pommes de terre 100 92 83 76 92Zitrusfrüchte Citrus Agrumes - - - - -Weintrauben Grapes Raisins 100 100 87 88 78Baumobst Tree fruits Fruits du verger 100 146 164 88 187Gemüse Vegetables Légumes 100 97 107 124 112
Insgesamt Total Total 100 107 89 91 79
Indice de volumede PPP utilisé
Tableau A - 3.2
Index der eingesetzten Mengenan PflanzenschutzmittelnTabelle A - 3.2
Index of volume of PPP used
Table A - 3.2
(1992 = 100)
1992 1993 1994 1995 1996
Getreide Cereals Céréales 28 25 34 38 24Zuckerrüben Sugar beets Betteraves à sucre 11 10 9 10 16Mais Maize Maïs 21 27 15 14 17Ölsaat Oilseeds Graines oléagineuses 4 4 4 3 3Kartoffeln Potatoes Pommes de terre 7 6 6 6 8Zitrusfrüchte Citrus Agrumes 0 0 0 0 0Weintrauben Grapes Raisins 27 25 26 26 26Baumobst Tree fruits Fruits du verger 2 2 3 2 4Gemüse Vegetables Légumes 1 1 2 2 2
Insgesamt Total Total 100 100 100 100 100
Pourcentage du volumede PPP utilisé
Tableau A - 3.3
Anteil an den eingesetzten Mengen an PflanzenschutzmittelnTabelle A - 3.3
Share of PPPvolume used
Table A - 3.3
(%)
Quelle / Source: Eurostat.

Österreich
A Pflanzenschutz / Plant protection / Protection des cultures 185
(in Tonnen Wirkstoff) (en tonnes de MA)
WirkstoffActive
Ingredient(AI)
Matièreactive(MA)
GruppeGroup
Groupe1992 1993 1994 1995 1996
Bromoxynil Bromoxynil Bromoxynil H 59.1 70.2 71.4 79.6 48.7Dicamba Dicamba Dicamba H 225.4 225.3 150.4 142.9 48.1Ioxynil Ioxynil Ioxynil H 59.6 70.7 73.2 79.9 52.3MCPA MCPA MCPA H 29.7 21.5 14.6 0.0 48.0Mecoprop Mecoprop Mécoprop H 45.9 31.9 173.7 341.0 62.9Andere Others Autres 374.0 339.1 369.8 331.4 271.4
Ingesamt Total Total 793.8 758.8 853.1 974.9 531.4
Top 5 des MA utiliséespour les cultures céréalières
Tableau A - 4.1
(in tonnes of Al)
Top 5 der Wirkstoffeim GetreideanbauTabelle A - 4.1
Top 5 Al appliedto cereal crops
Table A - 4.1
(in Tonnen Wirkstoff) (en tonnes de MA)
WirkstoffActive
Ingredient(AI)
Matièreactive(MA)
GruppeGroupGroupe
1992 1993 1994 1995 1996
Chloridazon Chloridazone Chloridazone H 10.5 11.6 10.9 11.0 11.0Cyproconazol Cyproconazole Cyproconazole F 0.0 0.0 3.8 4.5 10.4Metamitron Metamitron Métamitrone H 55.3 55.3 55.3 52.0 52.0Schwefel Sulphur Soufre F, I 184.3 189.7 118.7 162.2 266.7Triallat Triallate Triallate H 23.6 19.6 19.6 12.6 10.6Andere Others Autres 26.4 25.1 30.8 22.2 18.8
Ingesamt Total Total 300.1 301.3 239.0 264.6 369.5
Top 5 des MA utiliséespour les cultures de
betteraves à sucreTableau A - 4.2
Top 5 der Wirkstoffeim ZuckerrübenanbauTabelle A - 4.2
Top 5 Al appliedto sugar beet crops
Table A - 4.2
(in tonnes of Al)
(in Tonnen Wirkstoff) (en tonnes de MA)
WirkstoffActive
Ingredient(AI)
Matièreactive(MA)
GruppeGroupGroupe
1992 1993 1994 1995 1996
Bromoxynil Bromoxynil Bromoxynil H 16.0 12.0 25.3 42.5 47.3Metolachlor Metolachlor Metolachlor H 82.1 198.8 96.8 82.5 76.3Pendimethalin Pendimethalin Pendiméthaline H 0.0 0.0 25.2 40.8 55.2Pyridat Pyridate Pyridate H 97.0 117.8 121.3 91.3 90.3Terbuthylazin Terbuthylazine Terbuthylazine H 1.4 1.4 16.2 48.8 59.2Andere Others Autres 398.6 482.9 104.4 46.8 47.7
Ingesamt Total Total 595.0 812.8 389.0 352.7 376.0
Top 5 des MA utiliséespour les cultures de maïs
Tableau A - 4.3
Top 5 der Wirkstoffeim MaisanbauTabelle A - 4.3
Top 5 Al appliedto maize crops
Table A - 4.3
(in tonnes of Al)
Quelle / Source: Eurostat.

Österreich
186 Pflanzenschutz / Plant protection / Protection des cultures A
(in Tonnen Wirkstoff) (en tonnes de MA)
WirkstoffActive
Ingredient(AI)
Matièreactive(MA)
GruppeGroup
Groupe1992 1993 1994 1995 1996
Cyanazin Cyanazine Cyanazine H 14.1 16.3 13.7 9.2 3.7Flurochloridon Flurochloridone Flurochloridone H c c c c cMetazachlor Metazachlor Métazachlore H 46.5 54.1 45.3 35.7 27.3Napropamid Napropamide Napropamide H 22.0 16.7 13.3 16.2 12.2Pyridat Pyridate Pyridate H 0.0 0.0 4.5 5.3 3.0Andere Others Autres c c c c c
Ingesamt Total Total 111.2 122.2 106.4 81.6 62.5
Top 5 des MA utiliséespour les cultures de
graines oléagineusesTableau A - 4.4
Top 5 der Wirkstoffeim Anbau von ÖlsaatenTabelle A - 4.4
Top 5 Al appliedto oilseed crops
Table A - 4.4
(in tonnes of Al)
(in Tonnen Wirkstoff) (en tonnes de MA)
WirkstoffActive
Ingredient(AI)
Matièreactive(MA)
GruppeGroup
Groupe1992 1993 1994 1995 1996
Mancozeb Mancozeb Mancozèbe F 73.8 67.4 62.3 56.2 75.5Metalaxyl Metalaxyl Métalaxyl F c c c c cMetobromuron Metobromuron Métobromuron H 13.9 13.6 9.9 10.3 9.5Prosulfocarb Prosulfocarb Prosulfocarbe H 0.0 0.0 0.0 0.0 12.1Terbutryn Terbutryn Terbutryne H c c c c cAndere Others Autres c c c c c
Ingesamt Total Total 195.9 181.1 163.3 148.3 180.2
Top 5 des MA utiliséespour les cultures de
pommes de terreTableau A - 4.5
Top 5 der Wirkstoffeim KartoffelanbauTabelle A - 4.5
Top 5 Al appliedto potato crops
Table A - 4.5
(in tonnes of Al)
(in Tonnen Wirkstoff) (en tonnes de MA)
WirkstoffActive
Ingredient(AI)
Matièreactive(MA)
GruppeGroupGroupe
1992 1993 1994 1995 1996
Kupfer Copper Cuivre F 44.7 35.7 25.2 19.5 22.5Mancozeb Mancozeb Mancozèbe F 81.1 69.8 57.3 28.4 27.1Metiram Metiram Métirame F 54.6 32.2 28.0 42.4 18.9Penconazol Penconazole Penconazole F c c c c cSchwefel Sulphur Soufre F, I 365.4 415.9 339.3 438.8 435.0Andere Others Autres c c c c c
Ingesamt Total Total 768.1 768.3 666.7 678.6 596.8
Top 5 des MA utiliséespour la viticulture
Tableau A - 4.6
Top 5 der Wirkstoffeim WeinanbauTabelle A - 4.6
Top 5 Al appliedto grape crops
Table A - 4.6
(in tonnes of Al)
Quelle / Source: Eurostat.

Österreich
A Pflanzenschutz / Plant protection / Protection des cultures 187
(in Tonnen Wirkstoff) (en tonnes de MA)
WirkstoffActive
Ingredient(AI)
Matièreactive(MA)
GruppeGroupGroupe
1992 1993 1994 1995 1996
Captan Captan Captane F 7.4 32.7 41.6 17.3 29.9Dithianon Dithianon Dithianon F 17.6 12.7 14.8 3.1 7.4Fenoxycarb Fenoxycarb Fénoxycarbe I c c c c cSchwefel Sulphur Soufre F, I 0.0 0.0 0.0 0.0 30.0Thiram Thiram Thirame F 4.3 4.3 4.3 4.3 4.3Andere Others Autres c c c c c
Ingesamt Total Total 49.6 72.2 81.3 43.6 92.6
Top 5 des MA utiliséespour l'arboriculture fruitière
Tableau A - 4.7
Top 5 der Wirkstoffeim BaumobstanbauTabelle A - 4.7
Top 5 Al appliedto tree fruit crops
Table A - 4.7
(in tonnes of Al)
(in Tonnen Wirkstoff) (en tonnes de MA)
WirkstoffActive
Ingredient(AI)
Matièreactive(MA)
GruppeGroupGroupe
1992 1993 1994 1995 1996
Bentazon Bentazone Bentazone H : : : : 3.1Iprodion Iprodione Iprodione F 5.2 3.9 3.0 7.1 4.4Mancozeb Mancozeb Mancozèbe F 7.5 8.3 9.0 11.3 9.4Metalaxyl Metalaxyl Métalaxyl F c c c c cPendimethalin Pendimethalin Pendiméthaline H 0.0 0.0 3.6 5.8 7.9Andere Others Autres c c c c c
Ingesamt Total Total 39.5 38.2 42.3 49.1 44.4
Top 5 des MA utiliséespour les cultures légumières
Tableau A - 4.8
Top 5 der Wirkstoffeim GemüseanbauTabelle A - 4.8
Top 5 Al appliedto vegetable crops
Table A - 4.8
(in tonnes of Al)
Quelle / Source: Eurostat.

Portugal
188 Pflanzenschutz / Plant protection / Protection des cultures A
1992 1993 1994 1995 1996
Getreide Cereals Céréales 347 312 289 311 283Zuckerrüben Sugar beets Betteraves à sucre 0 0 1 1 0Mais Maize Maïs 287 292 299 299 307Ölsaat Oilseeds Graines oléagineuses 77 95 133 94 101Kartoffeln Potatoes Pommes de terre 109 88 85 96 89Zitrusfrüchte Citrus Agrumes 27 26 26 26 27Weintrauben Grapes Raisins 273 272 267 265 263Baumobst Tree fruits Fruits du verger 67 61 58 56 55Gemüse Vegetables Légumes 0 0 0 68 70
Insgesamt Total Total 1 188 1 146 1 157 1 216 1 194
Gesamte Anbau-fläche für Acker-und Dauerkulturen
Total arable andpermanent croparea
Superficie totaledes cultures de terres arables etcultures perman.
3 148 3 134 3 145 3 092 3 072
AnbauflächeTabelle P - 1
Crop areaTable P - 1
(1 000 ha)
Superficie cultivéeTableau P - 1
(kg Wirkstoff / ha) (kg de MA / ha)
1992 1993 1994 1995 1996
Getreide Cereals Céréales 0.4 1.3 2.0 2.7 3.2Zuckerrüben Sugar beets Betteraves à sucre : : 0.1 0.1 :Mais Maize Maïs 0.9 0.9 1.1 1.3 1.5Ölsaat Oilseeds Graines oléagineuses 0.2 0.1 0.3 0.4 0.3Kartoffeln Potatoes Pommes de terre 3.3 5.4 8.3 6.7 7.0Zitrusfrüchte Citrus Agrumes 2.5 3.0 2.9 2.4 3.3Weintrauben Grapes Raisins 17.6 22.2 25.2 25.7 27.4Baumobst Tree fruits Fruits du verger 6.0 7.1 8.5 7.2 7.6Gemüse Vegetables Légumes : : : 4.8 5.3
Insgesamt Total Total 5.3 6.9 8.0 7.8 8.4
Dosierung der eingesetztenPflanzenschutzmittelTabelle P - 2
Dosage of PPP useTable P - 2
(kg AI / ha)
Dose de PPP utiliséTableau P - 2
Quelle / Source: Eurostat.
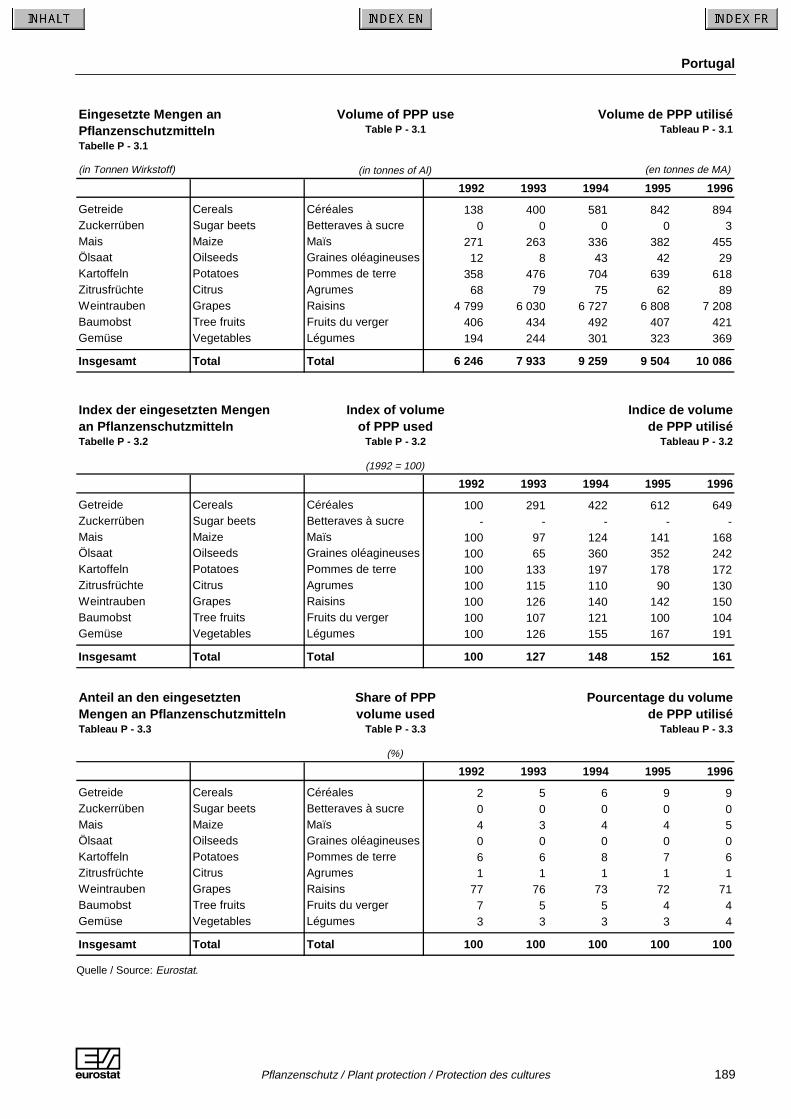
Portugal
A Pflanzenschutz / Plant protection / Protection des cultures 189
(in Tonnen Wirkstoff) (en tonnes de MA)
1992 1993 1994 1995 1996
Getreide Cereals Céréales 138 400 581 842 894Zuckerrüben Sugar beets Betteraves à sucre 0 0 0 0 3Mais Maize Maïs 271 263 336 382 455Ölsaat Oilseeds Graines oléagineuses 12 8 43 42 29Kartoffeln Potatoes Pommes de terre 358 476 704 639 618Zitrusfrüchte Citrus Agrumes 68 79 75 62 89Weintrauben Grapes Raisins 4 799 6 030 6 727 6 808 7 208Baumobst Tree fruits Fruits du verger 406 434 492 407 421Gemüse Vegetables Légumes 194 244 301 323 369
Insgesamt Total Total 6 246 7 933 9 259 9 504 10 086
Eingesetzte Mengen anPflanzenschutzmittelnTabelle P - 3.1
Volume of PPP useTable P - 3.1
(in tonnes of Al)
Volume de PPP utiliséTableau P - 3.1
1992 1993 1994 1995 1996
Getreide Cereals Céréales 100 291 422 612 649Zuckerrüben Sugar beets Betteraves à sucre - - - - -Mais Maize Maïs 100 97 124 141 168Ölsaat Oilseeds Graines oléagineuses 100 65 360 352 242Kartoffeln Potatoes Pommes de terre 100 133 197 178 172Zitrusfrüchte Citrus Agrumes 100 115 110 90 130Weintrauben Grapes Raisins 100 126 140 142 150Baumobst Tree fruits Fruits du verger 100 107 121 100 104Gemüse Vegetables Légumes 100 126 155 167 191
Insgesamt Total Total 100 127 148 152 161
Index der eingesetzten Mengenan PflanzenschutzmittelnTabelle P - 3.2
Index of volume of PPP used
Table P - 3.2
(1992 = 100)
Indice de volumede PPP utilisé
Tableau P - 3.2
1992 1993 1994 1995 1996
Getreide Cereals Céréales 2 5 6 9 9Zuckerrüben Sugar beets Betteraves à sucre 0 0 0 0 0Mais Maize Maïs 4 3 4 4 5Ölsaat Oilseeds Graines oléagineuses 0 0 0 0 0Kartoffeln Potatoes Pommes de terre 6 6 8 7 6Zitrusfrüchte Citrus Agrumes 1 1 1 1 1Weintrauben Grapes Raisins 77 76 73 72 71Baumobst Tree fruits Fruits du verger 7 5 5 4 4Gemüse Vegetables Légumes 3 3 3 3 4
Insgesamt Total Total 100 100 100 100 100
Anteil an den eingesetzten Mengen an PflanzenschutzmittelnTableau P - 3.3
Share of PPPvolume used
Table P - 3.3
(%)
Pourcentage du volumede PPP utilisé
Tableau P - 3.3
Quelle / Source: Eurostat.

Portugal
190 Pflanzenschutz / Plant protection / Protection des cultures A
(in Tonnen Wirkstoff) (en tonnes de MA)
WirkstoffActive
Ingredient(AI)
Matièreactive(MA)
GruppeGroup
Groupe1992 1993 1994 1995 1996
Chlorotoluron Chlorotoluron Chlortoluron H 59.9 54.9 51.2 47.7 54.5Difenzoquat Difenzoquat Difenzoquat H c c c c cIsoproturon Isoproturon Isoproturon H 9.9 47.0 99.2 150.4 145.5Pendimethalin Pendimethalin Pendiméthaline H 0.0 176.8 284.6 455.7 523.2Triasulfuron Triasulfuron Triasulfuron H c c c c cAndere Others Autres c c c c c
Insgesamt Total Total 137.7 400.5 581.1 842.2 893.5
Top 5 der Wirkstoffeim GetreideanbauTabelle P - 4.1
Top 5 Al appliedto cereal crops
Table P - 4.1
(in tonnes of Al)
Top 5 des MA utiliséespour les cultures céréalières
Tableau P - 4.1
(in Tonnen Wirkstoff) (en tonnes de MA)
WirkstoffActive
Ingredient(AI)
Matièreactive(MA)
GruppeGroupGroupe
1992 1993 1994 1995 1996
Alachlor Alachlor Alachlore H 66.1 38.5 52.9 56.8 75.4Atrazin Atrazine Atrazine H 112.2 122.8 162.6 191.6 218.9EPTC EPTC EPTC H 10.3 10.0 6.9 3.6 6.9Furathiocarb Furathiocarb Furathiocarbe I c c c c cMetolachlor Metolachlor Metolachlor H 64.6 76.7 94.8 97.5 122.8Andere Others Autres c c c c c
Insgesamt Total Total 271.1 262.7 335.9 382.4 454.8
Top 5 der Wirkstoffeim MaisanbauTabelle P - 4.2
Top 5 Al appliedto maize crops
Table P - 4.2
(in tonnes of Al)
Top 5 des MA utiliséespour les cultures de maïs
Tableau P - 4.2
(in Tonnen Wirkstoff) (en tonnes de MA)
WirkstoffActive
Ingredient(AI)
Matièreactive(MA)
GruppeGroupGroupe
1992 1993 1994 1995 1996
Alpha-cypermethrin
Alpha-cypermethrin
Alpha-cyperméthrine I 0.0 0.0 2.2 2.4 2.5
Cyanazin Cyanazine Cyanazine H 0.0 0.0 20.0 20.0 15.0Metolachlor Metolachlor Metolachlor H 3.9 2.1 2.7 1.4 0.5Prometryn Prometryn Prométryne H c c c c cPropaquizafop Propaquizafop Propaquizafop H c c c c cAndere Others Autres c c c c c
Insgesamt Total Total 11.8 7.6 42.6 41.6 28.5
Top 5 der Wirkstoffeim Anbau von ÖlsaatenTabelle P - 4.3
Top 5 Al appliedto oilseed crops
Table P - 4.3
(in tonnes of Al)
Top 5 des MA utiliséespour les cultures de
graines oléagineusesTableau P - 4.3
Quelle / Source: Eurostat.

Portugal
A Pflanzenschutz / Plant protection / Protection des cultures 191
(in Tonnen Wirkstoff) (en tonnes de MA)
WirkstoffActive
Ingredient(AI)
Matièreactive(MA)
GruppeGroup
Groupe1992 1993 1994 1995 1996
Cymoxanil Cymoxanil Cymoxanil F 48.1 56.8 78.7 82.1 75.5EPTC EPTC EPTC H 41.1 40.2 27.6 14.4 27.6Mancozeb Mancozeb Mancozèbe F 73.9 119.1 278.2 234.0 225.2Metalaxyl Metalaxyl Métalaxyl F c c c c cPropineb Propineb Propinèbe F c c c c cAndere Others Autres c c c c c
Insgesamt Total Total 358.4 475.7 704.4 638.5 618.0
Top 5 der Wirkstoffeim KartoffelanbauTabelle P - 4.4
Top 5 Al appliedto potato crops
Table P - 4.4
(in tonnes of Al)
Top 5 des MA utiliséespour les cultures de
pommes de terreTableau P - 4.4
(in Tonnen Wirkstoff) (en tonnes de MA)
WirkstoffActive
Ingredient(AI)
Matièreactive(MA)
GruppeGroup
Groupe1992 1993 1994 1995 1996
Aldicarb Aldicarb Aldicarbe I c c c c cKupfer Copper Cuivre F 5.1 6.2 6.5 6.8 23.7Diuron Diuron Diuron H 2.1 6.0 4.2 4.9 4.4Glyphosate Glyphosate Glyphosate H 10.0 14.0 16.7 15.1 14.5Mineralöl Mineral oil Huile minérale I c c c c cAndere Others Autres c c c c c
Insgesamt Total Total 68.4 78.9 75.4 61.9 88.8
Top 5 der Wirkstoffe imAnbau von ZitrusfrüchtenTabelle P - 4.5
Top 5 Al appliedto citrus crops
Table P - 4.5
(in tonnes of Al)
Top 5 des MA utiliséespour les cultures d'agrumes
Tableau P - 4.5
(in Tonnen Wirkstoff) (en tonnes de MA)
WirkstoffActive
Ingredient(AI)
Matièreactive(MA)
GruppeGroupGroupe
1992 1993 1994 1995 1996
Kupfer Copper Cuivre F 223.6 409.9 447.9 428.3 493.1Glyphosat Glyphosate Glyphosate H 115.5 188.9 220.3 292.2 251.7Propineb Propineb Propinèbe F c c c c cSimazin Simazine Simazine H 319.1 341.2 442.9 326.4 337.9Schwefel Sulphur Soufre F, I 2 964.6 3 538.1 3 932.8 4 238.5 4 727.8Andere Others Autres c c c c c
Insgesamt Total Total 4 798.8 6 029.7 6 726.9 6 807.6 7 208.5
Top 5 der Wirkstoffeim WeinanbauTabelle P - 4.6
Top 5 Al appliedto grape crops
Table P - 4.6
(in tonnes of Al)
Top 5 des MA utiliséespour la viticulture
Tableau P - 4.6
Quelle / Source: Eurostat.

Portugal
192 Pflanzenschutz / Plant protection / Protection des cultures A
(in Tonnen Wirkstoff) (en tonnes de MA)
WirkstoffActive
Ingredient(AI)
Matièreactive(MA)
GruppeGroupGroupe
1992 1993 1994 1995 1996
Captan Captan Captane F 13.3 20.5 44.2 35.2 38.6Kupfer Copper Cuivre F 70.3 87.3 74.5 86.7 105.5Parathion Parathion Parathion I 13.3 11.7 6.6 : 23.2Simazin Simazine Simazine H 21.7 22.9 27.7 21.4 22.8Thiram Thiram Thirame F 46.1 46.4 41.6 36.8 32.9Andere Others Autres 241.8 244.7 297.6 227.1 197.9
Insgesamt Total Total 406.4 433.5 492.2 407.3 420.9
Top 5 der Wirkstoffeim BaumobstanbauTabelle P - 4.7
Top 5 Al appliedto tree fruit crops
Table P - 4.7
(in tonnes of Al)
Top 5 des MA utiliséespour l'arboriculture fruitière
Tableau P - 4.7
(in Tonnen Wirkstoff) (en tonnes de MA)
WirkstoffActive
Ingredient(AI)
Matièreactive(MA)
GruppeGroupGroupe
1992 1993 1994 1995 1996
Cyanazin Cyanazine Cyanazine H 0.0 0.0 23.1 38.1 25.9Endosulfan Endosulfan Endosulfan I : : 16.3 17.4 21.8Mancozeb Mancozeb Mancozèbe F 21.1 24.6 26.6 31.5 45.3Propachlor Propachlor Propachlore H c c c c cSchwefel Sulphur Soufre F, I 40.3 21.8 26.2 28.6 32.6Andere Others Autres c c c c c
Insgesamt Total Total 193.7 244.1 300.6 322.6 369.4
Top 5 der Wirkstoffeim GemüseanbauTabelle P - 4.8
Top 5 Al appliedto vegetable crops
Table P - 4.8
(in tonnes of Al)
Top 5 des MA utiliséespour les cultures légumières
Tableau P - 4.8
Quelle / Source: Eurostat.

Finland
A Pflanzenschutz / Plant protection / Protection des cultures 193
1992 1993 1994 1995 1996
Getreide Cereals Céréales 561 558 594 617 655Zuckerrüben Sugar beets Betteraves à sucre 32 33 34 35 35Mais Maize Maïs 0 0 0 0 0Ölsaat Oilseeds Graines oléagineuses 3 3 3 1 0Kartoffeln Potatoes Pommes de terre 35 36 37 36 35Zitrusfrüchte Citrus Agrumes 0 0 0 0 0Weintrauben Grapes Raisins 0 0 0 0 0Baumobst Tree fruits Fruits du verger 0 0 0 0 0Gemüse Vegetables Légumes 7 7 8 10 11
Insgesamt Total Total 638 637 675 699 735
Gesamte Anbau-fläche für Acker-und Dauerkulturen
Total arable andpermanent croparea
Superficie totaledes cultures de terres arables etcultures perman.
2 513 2 277 2 301 2 145 2 125
AnbauflächeTabelle FIN - 1
Crop areaTable FIN - 1
(1 000 ha)
Superficie cultivéeTableau FIN - 1
(kg Wirkstoff / ha) (kg de MA / ha)
1992 1993 1994 1995 1996
Getreide Cereals Céréales 0.4 0.3 0.3 0.5 0.5Zuckerrüben Sugar beets Betteraves à sucre 3.0 2.8 2.3 2.7 2.5Mais Maize Maïs - - - - -Ölsaat Oilseeds Graines oléagineuses 6.5 6.0 3.1 9.3 :Kartoffeln Potatoes Pommes de terre 1.7 1.7 1.2 1.8 1.9Zitrusfrüchte Citrus Agrumes - - - - -Weintrauben Grapes Raisins - - - - -Baumobst Tree fruits Fruits du verger - - - - -Gemüse Vegetables Légumes 1.6 2.5 2.0 2.3 2.1
Insgesamt Total Total 0.6 0.6 0.5 0.8 0.7
Dosierung der eingesetztenPflanzenschutzmittelTabelle FIN - 2
Dosage of PPP useTable FIN - 2
(kg AI / ha)
Dose de PPP utiliséTableau FIN - 2
Quelle / Source: Eurostat.

Finland
194 Pflanzenschutz / Plant protection / Protection des cultures A
(in Tonnen Wirkstoff) (en tonnes de MA)
1992 1993 1994 1995 1996
Getreide Cereals Céréales 205 167 180 336 345Zuckerrüben Sugar beets Betteraves à sucre 97 94 78 95 86Mais Maize Maïs 1 0 0 0 0Ölsaat Oilseeds Graines oléagineuses 16 17 8 10 11Kartoffeln Potatoes Pommes de terre 59 63 46 64 68Zitrusfrüchte Citrus Agrumes 0 0 0 0 0Weintrauben Grapes Raisins 0 0 0 0 0Baumobst Tree fruits Fruits du verger 0 0 0 2 0Gemüse Vegetables Légumes 12 18 16 23 22
Insgesamt Total Total 390 359 327 531 533
Eingesetzte Mengen anPflanzenschutzmittelnTabelle FIN - 3.1
Volume of PPP useTable FIN - 3.1
(in tonnes of Al)
Volume de PPP utiliséTableau FIN - 3.1
1992 1993 1994 1995 1996
Getreide Cereals Céréales 100 81 88 164 169Zuckerrüben Sugar beets Betteraves à sucre 100 96 80 97 88Mais Maize Maïs 100 0 37 53 0Ölsaat Oilseeds Graines oléagineuses 100 106 47 63 70Kartoffeln Potatoes Pommes de terre 100 106 77 108 114Zitrusfrüchte Citrus Agrumes - - - - -Weintrauben Grapes Raisins - - - - -Baumobst Tree fruits Fruits du verger - - - - -Gemüse Vegetables Légumes 100 157 138 195 192
Insgesamt Total Total 100 92 84 136 136
Index der eingesetzten Mengenan PflanzenschutzmittelnTabelle FIN - 3.2
Index of volume of PPP usedTable FIN - 3.2
(1992 = 100)
Indice de volumede PPP utiliséTableau FIN - 3.2
1992 1993 1994 1995 1996
Getreide Cereals Céréales 52 47 55 63 65Zuckerrüben Sugar beets Betteraves à sucre 25 26 24 18 16Mais Maize Maïs 0 0 0 0 0Ölsaat Oilseeds Graines oléagineuses 4 5 2 2 2Kartoffeln Potatoes Pommes de terre 15 18 14 12 13Zitrusfrüchte Citrus Agrumes 0 0 0 0 0Weintrauben Grapes Raisins 0 0 0 0 0Baumobst Tree fruits Fruits du verger 0 0 0 0 0Gemüse Vegetables Légumes 3 5 5 4 4
Insgesamt Total Total 100 100 100 100 100
Anteil an den eingesetzten Mengen an PflanzenschutzmittelnTabelle FIN - 3.3
Share of PPPvolume usedTable FIN - 3.3
(%)
Pourcentage du volumede PPP utiliséTableau FIN - 3.3
Quelle / Source: Eurostat.
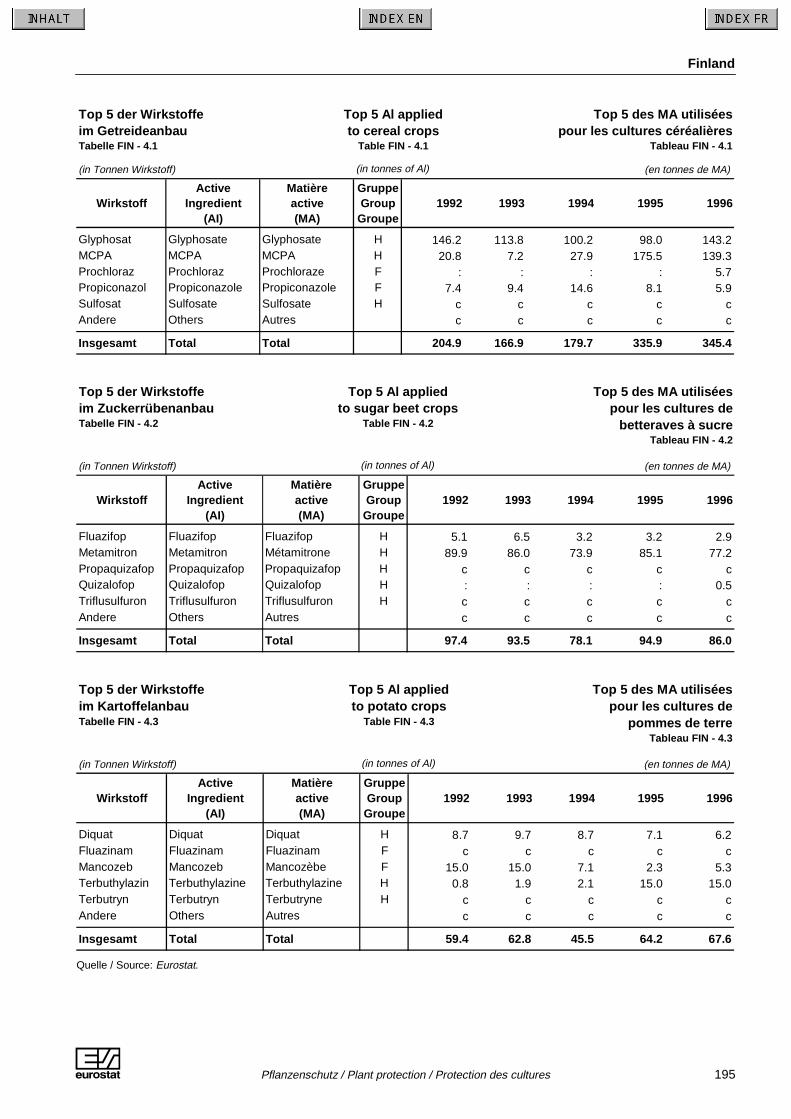
Finland
A Pflanzenschutz / Plant protection / Protection des cultures 195
(in Tonnen Wirkstoff) (en tonnes de MA)
WirkstoffActive
Ingredient(AI)
Matièreactive(MA)
GruppeGroup
Groupe1992 1993 1994 1995 1996
Glyphosat Glyphosate Glyphosate H 146.2 113.8 100.2 98.0 143.2MCPA MCPA MCPA H 20.8 7.2 27.9 175.5 139.3Prochloraz Prochloraz Prochloraze F : : : : 5.7Propiconazol Propiconazole Propiconazole F 7.4 9.4 14.6 8.1 5.9Sulfosat Sulfosate Sulfosate H c c c c cAndere Others Autres c c c c c
Insgesamt Total Total 204.9 166.9 179.7 335.9 345.4
Top 5 der Wirkstoffeim GetreideanbauTabelle FIN - 4.1
Top 5 Al appliedto cereal crops
Table FIN - 4.1
(in tonnes of Al)
Top 5 des MA utiliséespour les cultures céréalières
Tableau FIN - 4.1
(in Tonnen Wirkstoff) (en tonnes de MA)
WirkstoffActive
Ingredient(AI)
Matièreactive(MA)
GruppeGroupGroupe
1992 1993 1994 1995 1996
Fluazifop Fluazifop Fluazifop H 5.1 6.5 3.2 3.2 2.9Metamitron Metamitron Métamitrone H 89.9 86.0 73.9 85.1 77.2Propaquizafop Propaquizafop Propaquizafop H c c c c cQuizalofop Quizalofop Quizalofop H : : : : 0.5Triflusulfuron Triflusulfuron Triflusulfuron H c c c c cAndere Others Autres c c c c c
Insgesamt Total Total 97.4 93.5 78.1 94.9 86.0
Top 5 der Wirkstoffeim ZuckerrübenanbauTabelle FIN - 4.2
Top 5 Al appliedto sugar beet crops
Table FIN - 4.2
(in tonnes of Al)
Top 5 des MA utiliséespour les cultures de
betteraves à sucreTableau FIN - 4.2
(in Tonnen Wirkstoff) (en tonnes de MA)
WirkstoffActive
Ingredient(AI)
Matièreactive(MA)
GruppeGroupGroupe
1992 1993 1994 1995 1996
Diquat Diquat Diquat H 8.7 9.7 8.7 7.1 6.2Fluazinam Fluazinam Fluazinam F c c c c cMancozeb Mancozeb Mancozèbe F 15.0 15.0 7.1 2.3 5.3Terbuthylazin Terbuthylazine Terbuthylazine H 0.8 1.9 2.1 15.0 15.0Terbutryn Terbutryn Terbutryne H c c c c cAndere Others Autres c c c c c
Insgesamt Total Total 59.4 62.8 45.5 64.2 67.6
Top 5 der Wirkstoffeim KartoffelanbauTabelle FIN - 4.3
Top 5 Al appliedto potato crops
Table FIN - 4.3
(in tonnes of Al)
Top 5 des MA utiliséespour les cultures de
pommes de terreTableau FIN - 4.3
Quelle / Source: Eurostat.

Finland
196 Pflanzenschutz / Plant protection / Protection des cultures A
(in Tonnen Wirkstoff) (en tonnes de MA)
WirkstoffActive
Ingredient(AI)
Matièreactive(MA)
GruppeGroup
Groupe1992 1993 1994 1995 1996
Bentazon Bentazone Bentazone H : : : : 2.3Iprodion Iprodione Iprodione F : 1.0 1.0 1.0 1.0Metoxuron Metoxuron Métoxuron H 0.0 3.6 1.7 2.3 2.3Prometryn Prometryn Prométryne H c c c c cSulfosat Sulfosate Sulfosate H c c c c cAndere Others Autres c c c c c
Insgesamt Total Total 11.6 18.2 16.0 22.6 22.3
Top 5 der Wirkstoffeim GemüseanbauTabelle FIN - 4.4
Top 5 Al appliedto vegetable crops
Table FIN - 4.4
(in tonnes of Al)
Top 5 des MA utiliséespour les cultures légumières
Tableau FIN - 4.4
Quelle / Source: Eurostat.

Sverige
A Pflanzenschutz / Plant protection / Protection des cultures 197
1992 1993 1994 1995 1996
Getreide Cereals Céréales 718 716 725 715 803Zuckerrüben Sugar beets Betteraves à sucre 48 52 53 58 59Mais Maize Maïs 0 0 0 0 0Ölsaat Oilseeds Graines oléagineuses 138 145 128 79 41Kartoffeln Potatoes Pommes de terre 39 36 33 35 37Zitrusfrüchte Citrus Agrumes 0 0 0 0 0Weintrauben Grapes Raisins 0 0 0 0 0Baumobst Tree fruits Fruits du verger 2 2 2 2 2Gemüse Vegetables Légumes 5 6 6 6 7
Insgesamt Total Total 950 958 947 895 948
Gesamte Anbau-fläche für Acker-und Dauerkulturen
Total arable andpermanent croparea
Superficie totaledes cultures de terres arables etcultures perman.
2 771 2 783 2 783 2 650 2 692
AnbauflächeTabelle S - 1
Crop areaTable S - 1
(1 000 ha)
Superficie cultivéeTableau S - 1
(kg Wirkstoff / ha) (kg de MA / ha)
1992 1993 1994 1995 1996
Getreide Cereals Céréales 0.5 0.5 0.6 0.7 0.7Zuckerrüben Sugar beets Betteraves à sucre 2.6 2.4 2.8 2.6 2.2Mais Maize Maïs - - - - -Ölsaat Oilseeds Graines oléagineuses 0.1 0.1 0.1 0.3 0.4Kartoffeln Potatoes Pommes de terre 2.1 1.3 1.5 1.6 2.3Zitrusfrüchte Citrus Agrumes - - - - -Weintrauben Grapes Raisins - - - - -Baumobst Tree fruits Fruits du verger 5.1 3.8 4.9 9.0 7.7Gemüse Vegetables Légumes 14.1 13.9 17.2 17.5 18.9
Insgesamt Total Total 0.7 0.6 0.8 1.0 1.0
Dosierung der eingesetztenPflanzenschutzmittelTabelle S - 2
Dosage of PPP useTable S - 2
(kg AI / ha)
Dose de PPP utiliséTableau S - 2
Quelle / Source: Eurostat.

Sverige
198 Pflanzenschutz / Plant protection / Protection des cultures A
(in Tonnen Wirkstoff) (en tonnes de MA)
1992 1993 1994 1995 1996
Getreide Cereals Céréales 363 333 458 504 584Zuckerrüben Sugar beets Betteraves à sucre 126 126 151 150 128Mais Maize Maïs 1 0 0 1 0Ölsaat Oilseeds Graines oléagineuses 18 13 10 25 16Kartoffeln Potatoes Pommes de terre 82 45 48 56 84Zitrusfrüchte Citrus Agrumes 0 0 0 0 0Weintrauben Grapes Raisins 0 0 0 0 0Baumobst Tree fruits Fruits du verger 10 7 9 16 13Gemüse Vegetables Légumes 69 90 111 113 125
Insgesamt Total Total 670 614 787 865 950
Eingesetzte Mengen anPflanzenschutzmittelnTabelle S - 3.1
Volume of PPP useTable S - 3.1
(in tonnes of Al)
Volume de PPP utiliséTableau S - 3.1
1992 1993 1994 1995 1996
Getreide Cereals Céréales 100 92 126 139 161Zuckerrüben Sugar beets Betteraves à sucre 100 100 120 119 102Mais Maize Maïs 100 0 37 53 1Ölsaat Oilseeds Graines oléagineuses 100 69 56 137 86Kartoffeln Potatoes Pommes de terre 100 55 58 69 102Zitrusfrüchte Citrus Agrumes - - - - -Weintrauben Grapes Raisins - - - - -Baumobst Tree fruits Fruits du verger 100 69 89 163 128Gemüse Vegetables Légumes 100 130 161 164 181
Insgesamt Total Total 100 92 117 129 142
Index der eingesetzten Mengenan PflanzenschutzmittelnTabelle S - 3.2
Index of volume of PPP used
Table S - 3.2
(1992 = 100)
Indice de volumede PPP utilisé
Tableau S - 3.2
1992 1993 1994 1995 1996
Getreide Cereals Céréales 54 54 58 58 61Zuckerrüben Sugar beets Betteraves à sucre 19 21 19 17 14Mais Maize Maïs 0 0 0 0 0Ölsaat Oilseeds Graines oléagineuses 3 2 1 3 2Kartoffeln Potatoes Pommes de terre 12 7 6 7 9Zitrusfrüchte Citrus Agrumes 0 0 0 0 0Weintrauben Grapes Raisins 0 0 0 0 0Baumobst Tree fruits Fruits du verger 1 1 1 2 1Gemüse Vegetables Légumes 10 15 14 13 13
Insgesamt Total Total 100 100 100 100 100
Anteil an den eingesetzten Mengen an PflanzenschutzmittelnTabelle S - 3.3
Share of PPPvolume used
Table S - 3.3
(%)
Pourcentage du volumede PPP utilisé
Tableau S - 3.3
Quelle / Source: Eurostat.

Sverige
A Pflanzenschutz / Plant protection / Protection des cultures 199
(in Tonnen Wirkstoff) (en tonnes de MA)
WirkstoffActive
Ingredient(AI)
Matièreactive(MA)
GruppeGroup
Groupe1992 1993 1994 1995 1996
Fenpropimorph Fenpropimorph Fenpropimorphe F 66.5 27.8 66.5 67.4 85.9Flamprop Flamprop Flamprop H 4.9 6.0 8.1 16.1 22.6Glyphosat Glyphosate Glyphosate H 120.1 191.1 209.3 219.3 282.1Propiconazol Propiconazole Propiconazole F 71.8 34.5 72.5 71.3 92.6Sulfosat Sulfosate Sulfosate H c c c c cAndere Others Autres c c c c c
Insgesamt Total Total 363.3 333.4 457.7 504.0 583.8
Top 5 der Wirkstoffeim GetreideanbauTabelle S - 4.1
Top 5 Al appliedto cereal crops
Table S - 4.1
(in tonnes of Al)
Top 5 des MA utiliséespour les cultures céréalières
Tableau S - 4.1
(in Tonnen Wirkstoff) (en tonnes de MA)
WirkstoffActive
Ingredient(AI)
Matièreactive(MA)
GruppeGroupGroupe
1992 1993 1994 1995 1996
Esfenvalerat Esfenvalerate Esfenvalerate I c c c c cMetamitron Metamitron Métamitrone H 102.9 112.0 128.6 124.3 124.3Pirimicarb Pirimicarb Pyrimicarbe I 3.2 1.6 1.4 1.5 0.7Sethoxydim Sethoxydim Sethoxydime H c c c c cThiram Thiram Thirame F 0.2 0.2 0.5 0.5 0.5Andere Others Autres c c c c c
Insgesamt Total Total 125.6 125.8 150.8 149.6 128.3
Top 5 der Wirkstoffeim ZuckerrübenanbauTabelle S - 4.2
Top 5 Al appliedto sugar beet crops
Table S - 4.2
(in tonnes of Al)
Top 5 des MA utiliséespour les cultures de
betteraves à sucreTableau S - 4.2
(in Tonnen Wirkstoff) (en tonnes de MA)
WirkstoffActive
Ingredient(AI)
Matièreactive(MA)
GruppeGroupGroupe
1992 1993 1994 1995 1996
Diquat Diquat Diquat H 8.6 9.7 8.4 7.6 6.3Mancozeb Mancozeb Mancozèbe F 20.1 9.8 11.2 15.0 27.5Metalaxyl Metalaxyl Métalaxyl F c c c c cMetribuzin Metribuzin Métribuzine H 6.5 5.6 5.7 6.6 6.6Prosulfocarb Prosulfocarb Prosulfocarbe H 0.0 1.1 1.0 1.9 5.2Andere Others Autres c c c c c
Insgesamt Total Total 82.4 45.0 48.0 56.5 84.1
Top 5 der Wirkstoffeim KartoffelanbauTabelle S - 4.3
Top 5 Al appliedto potato crops
Table S - 4.3
(in tonnes of Al)
Top 5 des MA utiliséespour les cultures de
pommes de terreTableau S - 4.3
Quelle / Source: Eurostat.

Sverige
200 Pflanzenschutz / Plant protection / Protection des cultures A
(in Tonnen Wirkstoff) (en tonnes de MA)
WirkstoffActive
Ingredient(AI)
Matièreactive(MA)
GruppeGroup
Groupe1992 1993 1994 1995 1996
Fluazifop Fluazifop Fluazifop H 0.0 1.2 0.9 1.0 0.8Mancozeb Mancozeb Mancozèbe F 0.0 0.0 0.6 0.8 0.5Pirimicarb Pirimicarb Pyrimicarbe I 3.8 1.3 1.2 1.3 0.6Propachlor Propachlor Propachlore H c c c c cSulfosat Sulfosate Sulfosate H c c c c cAndere Others Autres c c c c c
Insgesamt Total Total 69.0 89.8 110.9 112.8 124.6
Top 5 der Wirkstoffeim GemüseanbauTabelle S - 4.4
Top 5 Al appliedto vegetable crops
Table S - 4.4
(in tonnes of Al)
Top 5 des MA utiliséespour les cultures légumières
Tableau S - 4.4
Quelle / Source: Eurostat.

United Kingdom
A Pflanzenschutz / Plant protection / Protection des cultures 201
1992 1993 1994 1995 1996
Getreide Cereals Céréales 3 364 2 926 2 919 3 052 3 245Zuckerrüben Sugar beets Betteraves à sucre 197 197 195 196 199Mais Maize Maïs 51 73 94 106 111Ölsaat Oilseeds Graines oléagineuses 421 377 404 354 356Kartoffeln Potatoes Pommes de terre 181 170 164 172 178Zitrusfrüchte Citrus Agrumes 0 0 0 0 0Weintrauben Grapes Raisins 0 0 0 0 0Baumobst Tree fruits Fruits du verger 24 23 22 20 18Gemüse Vegetables Légumes 151 143 141 149 147
Insgesamt Total Total 4 388 3 908 3 939 4 047 4 254
Gesamte Anbau-fläche für Acker-und Dauerkulturen
Total arable andpermanent croparea
Superficie totaledes cultures de terres arables etcultures perman.
6 599 6 175 5 994 6 018 6 180
AnbauflächeTabelle UK - 1
Crop areaTable UK - 1
(1 000 ha)
Superficie cultivéeTableau UK - 1
(kg Wirkstoff / ha) (kg de MA / ha)
1992 1993 1994 1995 1996
Getreide Cereals Céréales 2.5 2.6 2.8 2.8 2.6Zuckerrüben Sugar beets Betteraves à sucre 2.7 3.8 3.9 4.2 4.2Mais Maize Maïs 2.1 1.7 2.0 2.2 2.3Ölsaat Oilseeds Graines oléagineuses 0.8 1.0 1.0 1.3 1.4Kartoffeln Potatoes Pommes de terre 5.4 5.9 7.2 6.7 6.1Zitrusfrüchte Citrus Agrumes - - - - -Weintrauben Grapes Raisins - - - - -Baumobst Tree fruits Fruits du verger 8.4 9.2 11.9 11.3 10.8Gemüse Vegetables Légumes 3.4 5.8 4.8 4.3 3.9
Insgesamt Total Total 2.5 2.8 2.9 3.0 2.8
Dosierung der eingesetztenPflanzenschutzmittelTabelle UK - 2
Dosage of PPP useTable UK - 2
(kg AI / ha)
Dose de PPP utiliséTableau UK - 2
Quelle / Source: Eurostat.

United Kingdom
202 Pflanzenschutz / Plant protection / Protection des cultures A
(in Tonnen Wirkstoff) (en tonnes de MA)
1992 1993 1994 1995 1996
Getreide Cereals Céréales 8 539 7 540 8 115 8 573 8 480Zuckerrüben Sugar beets Betteraves à sucre 524 752 759 828 833Mais Maize Maïs 108 123 190 229 260Ölsaat Oilseeds Graines oléagineuses 322 383 423 459 488Kartoffeln Potatoes Pommes de terre 983 999 1 178 1 149 1 078Zitrusfrüchte Citrus Agrumes 0 0 0 0 0Weintrauben Grapes Raisins 0 0 0 0 0Baumobst Tree fruits Fruits du verger 197 208 256 222 200Gemüse Vegetables Légumes 508 833 684 643 568
Insgesamt Total Total 11 181 10 837 11 605 12 102 11 906
Eingesetzte Mengen anPflanzenschutzmittelnTabelle UK - 3.1
Volume of PPP useTable UK - 3.1
(in tonnes of Al)
Volume de PPP utiliséTableau UK - 3.1
1992 1993 1994 1995 1996
Getreide Cereals Céréales 100 88 95 100 99Zuckerrüben Sugar beets Betteraves à sucre 100 144 145 158 159Mais Maize Maïs 100 114 176 212 241Ölsaat Oilseeds Graines oléagineuses 100 119 131 142 151Kartoffeln Potatoes Pommes de terre 100 102 120 117 110Zitrusfrüchte Citrus Agrumes - - - - -Weintrauben Grapes Raisins - - - - -Baumobst Tree fruits Fruits du verger 100 106 130 113 102Gemüse Vegetables Légumes 100 164 135 126 112
Insgesamt Total Total 100 97 104 108 106
Index der eingesetzten Mengenan PflanzenschutzmittelnTabelle UK - 3.2
Index of volume of PPP usedTable UK - 3.2
(1992 = 100)
Indice de volumede PPP utiliséTableau UK - 3.2
1992 1993 1994 1995 1996
Getreide Cereals Céréales 76 70 70 71 71Zuckerrüben Sugar beets Betteraves à sucre 5 7 7 7 7Mais Maize Maïs 1 1 2 2 2Ölsaat Oilseeds Graines oléagineuses 3 4 4 4 4Kartoffeln Potatoes Pommes de terre 9 9 10 9 9Zitrusfrüchte Citrus Agrumes 0 0 0 0 0Weintrauben Grapes Raisins 0 0 0 0 0Baumobst Tree fruits Fruits du verger 2 2 2 2 2Gemüse Vegetables Légumes 5 8 6 5 5
Insgesamt Total Total 100 100 100 100 100
Anteil an den eingesetzten Mengen an PflanzenschutzmittelnTabelle UK - 3.3
Share of PPPvolume usedTable UK - 3.3
(%)
Pourcentage du volumede PPP utiliséTableau UK - 3.3
Quelle / Source: Eurostat.

United Kingdom
A Pflanzenschutz / Plant protection / Protection des cultures 203
(in Tonnen Wirkstoff) (en tonnes de MA)
WirkstoffActive
Ingredient(AI)
Matièreactive(MA)
GruppeGroup
Groupe1992 1993 1994 1995 1996
Fenpropimorph Fenpropimorph Fenpropimorphe F 400.2 367.6 278.0 339.3 390.4Glyphosat Glyphosate Glyphosate H 571.0 719.5 742.6 657.9 747.2Isoproturon Isoproturon Isoproturon H 1 524.6 1 372.8 1 413.8 1 247.6 1 072.3Pendimethalin Pendimethalin Pendiméthaline H 0.0 176.8 284.6 455.7 523.2Triallat Triallate Triallate H 223.6 218.5 260.1 402.1 585.7Andere Others Autres 5 819.3 4 684.9 5 136.3 5 470.6 5 160.9
Insgesamt Total Total 8 538.7 7 539.9 8 115.4 8 573.2 8 479.6
Top 5 der Wirkstoffeim GetreideanbauTabelle UK - 4.1
Top 5 Al appliedto cereal crops
Table UK - 4.1
Top 5 des MA utiliséespour les cultures céréalières
Tableau UK - 4.1
(in tonnes of Al)
(in Tonnen Wirkstoff) (en tonnes de MA)
WirkstoffActive
Ingredient(AI)
Matièreactive(MA)
GruppeGroupGroupe
1992 1993 1994 1995 1996
Chloridazon Chloridazone Chloridazone H 43.8 54.8 20.5 65.7 71.8Ethofumesat Ethofumesate Ethofumesate H 26.1 56.6 60.1 56.0 50.2Metamitron Metamitron Métamitrone H 186.2 225.4 217.8 214.8 254.9Schwefel Sulphur Soufre F, I 121.4 221.0 252.6 259.0 181.0Triallat Triallate Triallate H 39.5 38.6 45.9 71.0 103.4Andere Others Autres 106.7 155.2 162.1 161.1 171.4
Insgesamt Total Total 523.6 751.5 759.1 827.6 832.7
Top 5 der Wirkstoffeim ZuckerrübenanbauTabelle UK - 4.2
Top 5 Al appliedto sugar beet crops
Table UK - 4.2
Top 5 des MA utiliséespour les cultures de
betteraves à sucreTableau UK - 4.2
(in tonnes of Al)
(in Tonnen Wirkstoff) (en tonnes de MA)
WirkstoffActive
Ingredient(AI)
Matièreactive(MA)
GruppeGroupGroupe
1992 1993 1994 1995 1996
Atrazin Atrazine Atrazine H 75.9 104.1 163.0 202.5 232.4Chlorpyrifos Chlorpyrifos Chlorpyrifos I 1.3 1.3 0.9 1.0 1.6Fluroxypyr Fluroxypyr Fluroxypyr H 1.2 1.2 1.4 1.3 1.3Flutriafol Flutriafol Flutriafol F c c c c cPyridat Pyridate Pyridate H 27.0 13.4 23.7 23.7 23.7Andere Others Autres c c c c c
Insgesamt Total Total 107.8 122.6 190.0 229.1 259.7
Top 5 der Wirkstoffeim MaisanbauTabelle UK - 4.3
Top 5 Al appliedto maize crops
Table UK - 4.3
Top 5 des MA utiliséespour les cultures de maïs
Tableau UK - 4.3
(in tonnes of Al)
Quelle / Source: Eurostat.

United Kingdom
204 Pflanzenschutz / Plant protection / Protection des cultures A
(in Tonnen Wirkstoff) (en tonnes de MA)
WirkstoffActive
Ingredient(AI)
Matièreactive(MA)
GruppeGroup
Groupe1992 1993 1994 1995 1996
Carbendazim Carbendazim Carbendazime F 24.5 28.4 42.7 42.2 46.3Metazachlor Metazachlor Métazachlore H 63.3 88.1 97.5 134.6 156.1Prochloraz Prochloraz Prochloraze F 19.1 16.3 16.2 29.3 22.3Schwefel Sulphur Soufre F, I 44.6 59.0 56.8 47.9 73.7Vinclozolin Vinclozolin Vinclozoline F c c c c cAndere Others Autres c c c c c
Insgesamt Total Total 322.5 383.1 422.8 459.0 487.9
Top 5 der Wirkstoffeim Anbau von ÖlsaatenTabelle UK - 4.4
Top 5 Al appliedto oilseed crops
Table - 4.4
Top 5 des MA utiliséespour les cultures de
graines oléagineusesTableau UK - 4.4
(in tonnes of Al)
(in Tonnen Wirkstoff) (en tonnes de MA)
WirkstoffActive
Ingredient(AI)
Matièreactive(MA)
GruppeGroup
Groupe1992 1993 1994 1995 1996
Cymoxanil Cymoxanil Cymoxanil F 45.5 55.7 79.9 69.0 57.0Mancozeb Mancozeb Mancozèbe F 425.6 440.0 586.8 591.1 570.7Metalaxyl Metalaxyl Métalaxyl F c c c c cOxadixyl Oxadixyl Oxadixyl F 40.7 46.2 79.9 61.9 51.5Paraquat Paraquat Paraquat H c c c c cAndere Others Autres c c c c c
Insgesamt Total Total 983.2 998.7 1 178.0 1 149.1 1 077.6
Top 5 der Wirkstoffeim KartoffelanbauTabelle UK - 4.5
Top 5 Al appliedto potato crops
Table UK - 4.5
Top 5 des MA utiliséespour les cultures de
pommes de terreTableau UK - 4.5
(in tonnes of Al)
(in Tonnen Wirkstoff) (en tonnes de MA)
WirkstoffActive
Ingredient(AI)
Matièreactive(MA)
GruppeGroupGroupe
1992 1993 1994 1995 1996
Captan Captan Captane F 25.9 46.0 53.6 46.1 49.4Chlorpyrifos Chlorpyrifos Chlorpyrifos I 16.0 16.0 37.6 23.8 20.0Dithianon Dithianon Dithianon F 9.7 11.5 40.8 35.1 19.1Penconazol Penconazole Penconazole F c c c c cSimazin Simazine Simazine H 35.7 35.7 35.7 35.7 35.7Andere Others Autres c c c c c
Insgesamt Total Total 196.7 207.9 255.9 221.6 200.2
Top 5 der Wirkstoffeim BaumobstanbauTabelle UK - 4.6
Top 5 Al appliedto tree fruit crops
Table UK - 4.6
Top 5 des MA utiliséespour l'arboriculture fruitière
Tableau UK - 4.6
(in tonnes of Al)
Quelle / Source: Eurostat.

United Kingdom
A Pflanzenschutz / Plant protection / Protection des cultures 205
(in Tonnen Wirkstoff) (en tonnes de MA)
WirkstoffActive
Ingredient(AI)
Matièreactive(MA)
GruppeGroupGroupe
1992 1993 1994 1995 1996
Bentazon Bentazone Bentazone H 71.9 191.8 72.4 72.7 59.7Chlorothalonil Chlorothalonil Chlorothalonil F 15.2 138.5 94.2 85.0 82.8Disulfoton Disulfoton Disulfoton I c c c c cMCPB MCPB MCPB H 27.6 37.3 43.4 50.2 51.5Terbuthylazin Terbuthylazine Terbuthylazine H 61.2 56.6 71.5 50.9 52.2Andere Others Autres c c c c c
Insgesamt Total Total 508.2 833.1 684.0 642.7 568.1
Top 5 der Wirkstoffeim GemüseanbauTabelle UK - 4.7
Top 5 Al appliedto vegetable crops
Table UK - 4.7
Top 5 des MA utiliséespour les cultures légumières
Tableau UK - 4.7
(in tonnes of Al)
Quelle / Source: Eurostat.

ANHANG
ANNEXES
ANNEXES

Annex A
A Pflanzenschutz / Plant protection / Protection des cultures 209
From common name of AI to chemical class
AI in italics : used in 1992, but not in 1996AI in bold : new since 1992
ACTION:
F = Fungicide / H = Herbicide / I = Insecticide
Common Name Chemical class Action
2,3,6-TBA PHENOXY CARBONIC ACID H
2,4,5-T PHENOXY CARBONIC ACID H
2,4-D PHENOXY CARBONIC ACID H
2,4-DB PHENOXY CARBONIC ACID H
AABAMECTIN ZZ-OTHER-ORGANIC-INSECTICIDES I
ACEPHATE MORPHOLINES I
ACETOCHLOR CHLOROACETANILIDES H
ACIBENZOLAR ZZ-OTHER-ORGANIC-FUNGICIDES F
ACIFLUORFEN DIPHENYL-ETHERS H
ACLONIFEN DIPHENYL-ETHERS H
ACRINATHRIN PYRETHROIDS I
ALACHLOR CHLOROACETANILIDES H
ALDICARB OXIME-CARBAMATES I
ALDIMORPH MORPHOLINES F
ALLOXYDIM CYCLOHEXANE DIONE H
ALPHA-CYPERMETHRIN PYRETHROIDS I
AMETRYNE TRIAZINES H
AMIDOSULFURON SULFONYLUREAS H
AMINOTRIAZOLE TRIAZOLES H
AMITRAZ AMIDINES I/A
AMITROLE TRIAZOLES H
AMMONIUM THIOCYANATE INORGANIC-H H
ANILAZINE TRIAZINES F
ASULAM CARBAMATES H
ATRAZINE TRIAZINES H
AZACONAZOLE AZOLES F
AZINPHOS MORPHOLINES I
AZINPHOS-E MORPHOLINES I
AZINPHOS-ETHYL MORPHOLINES I
AZINPHOS-M MORPHOLINES I
AZINPHOS-METHYL MORPHOLINES I
AZIPROTRYN TRIAZINES H
AZOCYCLOTIN ORGANOTINS I
BBACILLUS THURINGIENSIS BIOLOGICALS I
BARBAN ZZ-OTHER-ORGANIC-HERBICIDES H
BENALAXYL ACYLALANINES F

Annex A
210 Pflanzenschutz / Plant protection / Protection des cultures A
BENAZOLIN BENZOTHIAZOLES H
BENDIOCARB CARBAMATES I
BENFLURALIN DINITROANILINES H
BENFURACARB CARBAMATES I
BENFURESATE BENZOFURANES H
BENODANIL ZZ-OTHER-ORGANIC-FUNGICIDES F
BENOMYL BENZIMIDAZOLES F
BENOXACOR BENZOXAZINES H
BENSULFURON SULFONYLUREAS H
BENTAZONE THIADIAZINES H
BENZOXIMATE ZZ-OTHER-ORGANIC-INSECTICIDES I
BENZOYLPROP ZZ-OTHER-ORGANIC-HERBICIDES H
BENZTHIAZURON UREAS H
BETACYFLUTHRIN PYRETHROIDS I
BETA-CYFLUTHRIN PYRETHROIDS I
BIFENOX DIPHENYL-ETHERS H
BIFENTHRIN PYRETHROIDS I
BIORESMETHRIN PYRETHROIDS I
BITERTANOL AZOLES F
BROMACIL URACILS H
BROMOFENOXIM HYDROXYBENZONITRILES H
BROMOPHOS MORPHOLINES I
BROMOPROPYLATE BENZILATES I
BROMOXYNIL HYDROXYBENZONITRILES H
BROMUCONAZOLE AZOLES F
BUPIRIMATE PYRIMIDINES F
BUPROFEZIN ZZ-OTHER-ORGANIC-INSECTICIDES I
BUTOCARBOXIM OXIME-CARBAMATES I
BUTRALIN DINITROANILINES H
BUTYLATE THIOCARBAMATES H
CCA CYANAMIDE INORGANIC-H H
CADUSAFOS MORPHOLINES I
CAPTAFOL PHTHALIC ACIDS F
CAPTAN PHTHALIC ACIDS F
CARBARYL CARBAMATES I
CARBENDAZIM BENZIMIDAZOLES F
CARBETAMIDE CARBAMATES H
CARBOFURAN CARBAMATES I
CARBOPHENOTHION MORPHOLINES I
CARBOSULFAN CARBAMATES I
CARBOXIN OXIME-CARBAMATES F
CARTAP CARBAMATES I
CHLOMETHOXYFEN DIPHENYL-ETHERS H
CHLORBROMURON UREAS H
CHLORBUFAM CARBAMATES H
CHLORFENVINPHOS MORPHOLINES I
CHLORFLUAZURON BENZOYLUREAS I
CHLORIDAZONE PYRIDAZINONES H
CHLORMEPHOS MORPHOLINES I
CHLOROTHALONIL ZZ-OTHER-ORGANIC-FUNGICIDES F

Annex A
A Pflanzenschutz / Plant protection / Protection des cultures 211
CHLOROTOLURON UREAS H
CHLOROXURON UREAS H
CHLORPROPHAM CARBAMATES H
CHLORPYRIFOS MORPHOLINES I
CHLORSULFURON SULFONYLUREAS H
CHLORTHAL BENZOIC-ACIDS (AUXINS) H
CHLORTHIAMID BENZONITRILES H
CHLOZOLINATE DICARBOXIMIDES F
CINOSULFURON SULFONYLUREAS H
CLETHODIM CYCLOHEXANE DIONE H
CLODINAFOP ARYLOXYPHENOXY-CARBONIC-ACIDS H
CLOFENTEZINE TETRAZINES I
CLOMAZONE ZZ-OTHER-ORGANIC-HERBICIDES H
CLOPYRALID PYRIDINECARBOXYLIC-ACIDS H
CLOQUINTOCET ZZ-OTHER-ORGANIC-HERBICIDES H
COPPER INORGANIC-COPPERS F
COPPER AMMONIUM INORGANIC-COPPERS F
COPPER HYDROXIDE INORGANIC-COPPERS F
COPPER OXIDE INORGANIC-COPPERS F
COPPER OXYCHLORIDE INORGANIC-COPPERS F
COPPER SULPHATE INORGANIC-COPPERS F
CYANAZINE TRIAZINES H
CYCLOATE THIOCARBAMATES H
CYCLOXYDIM CYCLOHEXANE DIONE H
CYCLURON UREAS H
CYFLUTHRIN PYRETHROIDS I
CYHALOTHRIN PYRETHROIDS I
CYHEXATIN ORGANOTINS I
CYMOXANIL UREAS F
CYPERMETHRIN PYRETHROIDS I
CYPERMETHRIN HIGHCIS PYRETHROIDS I
CYPROCONAZOLE AZOLES F
CYPRODINIL ANILINOPYRIMIDILS F
CYROMAZINE ZZ-OTHER-ORGANIC-INSECTICIDES I
DDALAPON HALOGENATED ALKANOIC ACIDS H
DAZOMET METHYL-ISOTHIOCYANATE I
DELTAMETHRIN PYRETHROIDS I
DEMETON-S-METHYL MORPHOLINES I
DESMEDIPHAM BIS-CARBAMATES H
DESMETRYN TRIAZINES H
DIAFENTHIURON UREAS I
DIALIFOS MORPHOLINES I
DIALLATE THIOCARBAMATES H
DI-ALLATE THIOCARBAMATES H
DIAZINON MORPHOLINES I
DICAMBA BENZOIC-ACIDS (AUXINS) H
DICHLOBENIL BENZONITRILES H
DICHLOFLUANID ANILINES F
DICHLORMID CHLOROAMIDES H
DICHLOROPHEN CHLOROPHENOLS H

Annex A
212 Pflanzenschutz / Plant protection / Protection des cultures A
DICHLOROPROPENE ZZ-OTHER-ORGANIC-INSECTICIDES I
DICHLORPROP PHENOXY CARBONIC ACID H
DICHLORPROP-P PHENOXY CARBONIC ACID H
DICHLORVOS MORPHOLINES I
DICLOBUTRAZOL AZOLES F
DICLOFOP ARYLOXYPHENOXY-CARBONIC-ACIDS H
DICOFOL ORGANOCHLORINES I
DIENOCHLOR ORGANOCHLORINES I
DIETHOFENCARB PHENYL-CARBAMATES F
DIFENOCONAZOLE AZOLES F
DIFENOXURON UREAS H
DIFENZOQUAT PYRAZOLES H
DIFLUBENZURON BENZOYLUREAS I
DIFLUFENICAN PHENOXY NICOTINEANILIDES H
DIKEGULAC ZZ-OTHER-ORGANIC-HERBICIDES H
DIMEFURON UREAS H
DIMEPIPERATE THIOCARBAMATES H
DIMETHACHLOR CHLOROACETANILIDES H
DIMETHENAMIDE AMIDES H
DIMETHOATE MORPHOLINES I
DIMETHOMORPH MORPHOLINES F
DINICONAZOLE AZOLES F
DINITRAMINE DINITROANILINES H
DINOBUTON ZZ-OTHER-ORGANIC-INSECTICIDES I
DINOCAP DINITROPHENOLS F
DINOSEB ZZ-OTHER-ORGANIC-HERBICIDES H
DINOTERB DINITROPHENOLS H
DIOXATHION MORPHOLINES I
DIPHENAMID ALKANAMIDE H
DIQUAT BIPYRIDYLIUMS H
DISULFOTON MORPHOLINES I
DITHIANON ANTHRACHINONES F
DITHIOCARBAMATE DITHIOCARBAMATES F
DIURON UREAS H
DNOC DINITROPHENOLS F
DODEMORPH MORPHOLINES F
DODINE GUANIDINES F
EENDOSULFAN CYCLODIENE ORGANOCHLORINES I
EPOXYCONAZOLE AZOLES F
EPTAM ZZ-OTHER-ORGANIC-HERBICIDES H
EPTC THIOCARBAMATES H
ESFENVALERATE PYRETHROIDS I
ETHALFLURALIN DINITROANILINES H
ETHIOFENCARB CARBAMATES I
ETHION ORGANOPHOSPHATES I
ETHIRIMOL PYRIMIDINES F
ETHOFUMESATE BENZOFURANES H
ETHOPROPHOS ORGANOPHOSPHATES I
ETRIDIAZOLE AZOLES F
ETRIMFOS ORGANOPHOSPHATES I

Annex A
A Pflanzenschutz / Plant protection / Protection des cultures 213
FFENAMINOSULF ZZ-OTHER-ORGANIC-FUNGICIDES F
FENAMIPHOS ORGANOPHOSPHATES I
FENARIMOL PYRIMIDINYL-CARBINOLS F
FENAZAQUIN ZZ-OTHER-ORGANIC-INSECTICIDES I
FENBUCONAZOLE AZOLES F
FENBUTATIN-OXIDE ORGANOTINS F
FENCHLORAZOLE AZOLES H
FENCLORIM PYRIMIDINES H
FENITROTHION ORGANOPHOSPHATES I
FENOTHIOCARB CARBAMATES I
FENOXAPROP ARYLOXYPHENOXY-CARBONIC-ACIDS H
FENOXAPROP-P ARYLOXYPHENOXY-CARBONIC-ACIDS H
FENOXYCARB CARBAMATES I
FENPICLONIL PHENYLPYRROLES F
FENPROPATHRIN PYRETHROIDS I
FENPROPIDIN MORPHOLINES F
FENPROPIMORPH MORPHOLINES F
FENPYRAD PYRAZOLES I
FENPYROXIMATE PYRAZOLES I
FENQUINCONAZOLE AZOLES F
FENTHION ORGANOPHOSPHATES I
FENTIN ORGANOTINS F
FENTIN ACETATE ORGANOTINS F
FENTIN HYDROXIDE ORGANOTINS F
FENURON UREAS H
FENVALERATE PYRETHROIDS I
FERBAM DITHIOCARBAMATES F
FLAMPROP ARYLALANINES H
FLAMPROP-ISOPROPYL ARYLALANINES H
FLAMPROP-METHYL ARYLALANINES H
FLUAZIFOP OXYPHENOXY-DERIVATIVES H
FLUAZIFOP-P OXYPHENOXY-DERIVATIVES H
FLUAZINAM DINITROANILINES F
FLUBENZIMINE ZZ-OTHER-ORGANIC-INSECTICIDES I
FLUCYCLOXURON BENZOYLUREAS I
FLUCYTHRINATE PYRETHROIDS I
FLUDIOXONIL PHENYLPYRROLES F
FLUFENOXURON BENZOYLUREAS I
FLUMETRALIN DINITROANILINES H
FLUOMETURON UREAS H
FLUORODIFEN ZZ-OTHER-ORGANIC-HERBICIDES H
FLUOROGLYCOFEN DIPHENYL-ETHERS H
FLUPOXAM ZZ-OTHER-ORGANIC-HERBICIDES H
FLUQUINCONAZOLE AZOLES F
FLURENOL MORPHACTINS H
FLUROCHLORIDONE ZZ-OTHER-ORGANIC-HERBICIDES H
FLUROXYPYR PYRIDYLOXY ACETIC ACID H
FLUSILAZOLE AZOLES F
FLUTOLANIL CARBOXAMIDES F
FLUTRIAFOL AZOLES F

Annex A
214 Pflanzenschutz / Plant protection / Protection des cultures A
FLUVALINATE PYRETHROIDS I
FOLPET PHTHALIC ACIDS F
FOMESAFEN DIPHENYL-ETHERS H
FONOFOS ORGANOPHOSPHATES I
FORMETANATE CARBAMATES I
FORMOTHION ORGANOPHOSPHATES I
FOSETYL ETHYLPHOSPHATE F
FUBERIDAZOLE BENZIMIDAZOLES F
FURALAXYL ACYLALANINES F
FURATHIOCARB CARBAMATES I
GGAMMA-BHC ORGANOCHLORINES I
GLUFOSINATE PHOSPHINICO-AMINO-ACIDS H
GLYPHOSATE AMINO-PHOSPHORIC-ACIDS H
GUAZATINE GUANIDINES F
HHALFENPROX PYRETHROIDS I
HALOXYFOP OXYPHENOXY-DERIVATIVES H
HALOXYFOP-E OXYPHENOXY-DERIVATIVES H
HALOXYFOP-M OXYPHENOXY-DERIVATIVES H
HALOXYFOP-R-METHYL OXYPHENOXY-DERIVATIVES H
HEPTENOPHOS ORGANOPHOSPHATES I
HEXACONAZOLE AZOLES F
HEXAFLUMURON BENZOYLUREAS I
HEXAZINONE TRIAZINONES H
HEXYTHIAZOX ZZ-OTHER-ORGANIC-INSECTICIDES I
HYDROGEN CYANIDE CYANIDE I
HYMEXAZOLE AZOLES F
IIMAZALIL AZOLES F
IMAZAMETHABENZ IMIDAZOLINONES H
IMAZAPYR IMIDAZOLINONES H
IMAZETHAPYR IMIDAZOLINONES H
IMIDACLOPRID ZZ-OTHER-ORGANIC-INSECTICIDES I
IOXYNIL HYDROXYBENZONITRILES H
IPRODIONE DICARBOXIMIDES F
ISOFENPHOS ORGANOPHOSPHATES I
ISOPROPALIN ZZ-OTHER-ORGANIC-HERBICIDES H
ISOPROTURON UREAS H
ISOXABEN AMIDES H
ISOXATHION ORGANOPHOSPHATES I
KKASUGAMYCIN BIOLOGICALS F
KRESOXIM-METHYL STROBILURINES F

Annex A
A Pflanzenschutz / Plant protection / Protection des cultures 215
LLAMBDA-CYHALOTHRIN PYRETHROIDS I
LENACIL URACILS H
LINDANE ORGANOCHLORINES I
LINURON UREAS H
LUFENURON BENZOYLUREAS I
MMALATHION ORGANOPHOSPHATES I
MANCOZEB DITHIOCARBAMATES F
MANEB DITHIOCARBAMATES F
MCPA PHENOXY CARBONIC ACID H
MCPB PHENOXY CARBONIC ACID H
MECARBAM ORGANOPHOSPHATES I
MECOPROP PHENOXY CARBONIC ACID H
MECOPROP-P PHENOXY CARBONIC ACID H
MEFENACET OXYACETAMIDES H
MEPHOSFOLAN ORGANOPHOSPHATES I
MEPRONIL CARBOXAMIDES F
METALAXYL ACYLALANINES F
METALDEHYDE ZZ-OTHER-ORGANIC-INSECTICIDES I
METAMITRON TRIAZINONES H
METAZACHLOR CHLOROACETANILIDES H
METCONAZOLE AZOLES F
METHABENZTHIAZURON UREAS H
METHAMIDOPHOS ORGANOPHOSPHATES I
METHAZOLE ZZ-OTHER-ORGANIC-HERBICIDES H
METHIDATHION ORGANOPHOSPHATES I
METHIOCARB CARBAMATES I
METHOMYL OXIME-CARBAMATES I
METHOPROTRYNE ZZ-OTHER-ORGANIC-HERBICIDES H
METHOXYCHLOR ORGANOCHLORINES I
METIRAM DITHIOCARBAMATES F
METOBROMURON UREAS H
METOLACHLOR CHLOROACETANILIDES H
METOMECLAN ZZ-OTHER-ORGANIC-FUNGICIDES F
METOSULAM ZZ-OTHER-ORGANIC-HERBICIDES H
METOXURON UREAS H
METRIBUZIN TRIAZINONES H
METSULFURON-METHYL SULFONYLUREAS H
MEVINPHOS ORGANOPHOSPHATES I
MINERAL OIL OIL, MINERAL I
MOLINATE THIOCARBAMATES H
MONALIDE ZZ-OTHER-ORGANIC-HERBICIDES H
MONOCROTOPHOS ORGANOPHOSPHATES I
MONOLINURON UREAS H
MYCLOBUTANIL AZOLES F
NNA ARSENATE ARSENICS F
NA CHLORATE INORGANIC-H H

Annex A
216 Pflanzenschutz / Plant protection / Protection des cultures A
NA MONOCHLOROACETATE INORGANIC-H H
NA PROPIONATE ZZ-OTHER-ORGANIC-FUNGICIDES F
NALED ORGANOPHOSPHATES I
NA-M-BISULFITE ZZ-OTHER-ORGANIC-FUNGICIDES F
NAPROPAMIDE ALKANAMIDE H
NAPTALAM ZZ-OTHER-ORGANIC-HERBICIDES H
NEBURON UREAS H
NEMATODES BIOLOGICALS I
NICOSULFURON SULFONYLUREAS H
NICOTINE BIOLOGICALS I
NITROFEN ZZ-OTHER-ORGANIC-HERBICIDES H
NITROTHAL-ISOPROPYL ZZ-OTHER-ORGANIC-FUNGICIDES F
NORFLURAZON PYRIDAZINONES H
NUARIMOL PYRIMIDINYL-CARBINOLS F
OOFURACE PHENYLAMIDES F
OMETHOATE ORGANOPHOSPHATES I
ORBENCARB THIOCARBAMATES H
ORYZALIN DINITROANILINES H
OXADIAZON ZZ-OTHER-ORGANIC-HERBICIDES H
OXADIXYL PHENYLAMIDES F
OXAMYL OXIME-CARBAMATES I
OXINE-COPPER INORGANIC-COPPERS F
OXYCARBOXIN CARBOXAMIDES F
OXYDEMETON-M ORGANOPHOSPHATES I
OXYDEMETON-METHYL ORGANOPHOSPHATES I
OXYFLUORFEN DIPHENYL-ETHERS H
PPARAQUAT BIPYRIDYLIUMS H
PARATHION ORGANOPHOSPHATES I
PARATHION-ETHYL ORGANOPHOSPHATES I
PARATHION-METHYL ORGANOPHOSPHATES I
PEBULATE THIOCARBAMATES H
PENCONAZOLE AZOLES F
PENCYCURON UREAS F
PENDIMETHALIN DINITROANILINES H
PENTANOCHLOR ANILIDES H
PERMETHRIN PYRETHROIDS I
PHENMEDIPHAM BIS-CARBAMATES H
PHENTHOATE ORGANOPHOSPHATES I
PHEROMONES ZZ-OTHER-ORGANIC-INSECTICIDES I
PHORATE ORGANOPHOSPHATES I
PHOSALONE ORGANOPHOSPHATES I
PHOSMET ORGANOPHOSPHATES I
PHOSPHAMIDON ORGANOPHOSPHATES I
PHOXIM ORGANOPHOSPHATES I
PICLORAM PYRIDINECARBOXYLIC-ACIDS H
PIRIMICARB CARBAMATES I
PIRIMIPHOS ORGANOPHOSPHATES I
PIRIMIPHOS-E ORGANOPHOSPHATES I
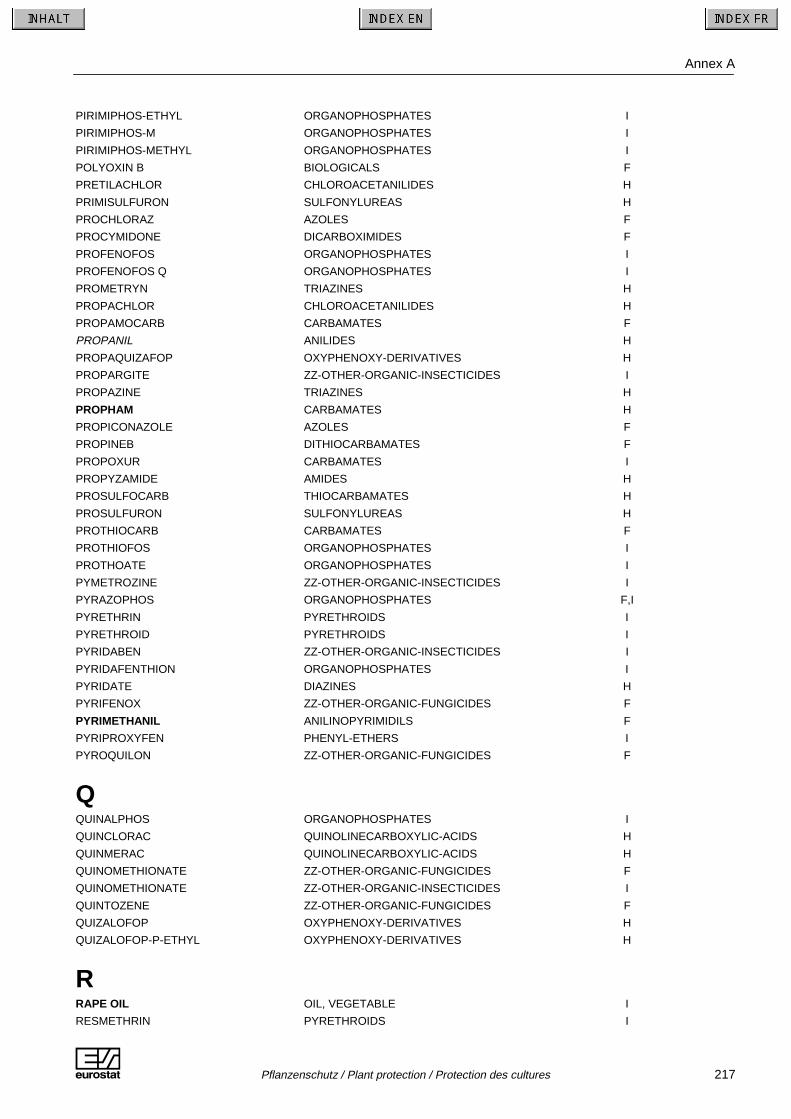
Annex A
A Pflanzenschutz / Plant protection / Protection des cultures 217
PIRIMIPHOS-ETHYL ORGANOPHOSPHATES I
PIRIMIPHOS-M ORGANOPHOSPHATES I
PIRIMIPHOS-METHYL ORGANOPHOSPHATES I
POLYOXIN B BIOLOGICALS F
PRETILACHLOR CHLOROACETANILIDES H
PRIMISULFURON SULFONYLUREAS H
PROCHLORAZ AZOLES F
PROCYMIDONE DICARBOXIMIDES F
PROFENOFOS ORGANOPHOSPHATES I
PROFENOFOS Q ORGANOPHOSPHATES I
PROMETRYN TRIAZINES H
PROPACHLOR CHLOROACETANILIDES H
PROPAMOCARB CARBAMATES F
PROPANIL ANILIDES H
PROPAQUIZAFOP OXYPHENOXY-DERIVATIVES H
PROPARGITE ZZ-OTHER-ORGANIC-INSECTICIDES I
PROPAZINE TRIAZINES H
PROPHAM CARBAMATES H
PROPICONAZOLE AZOLES F
PROPINEB DITHIOCARBAMATES F
PROPOXUR CARBAMATES I
PROPYZAMIDE AMIDES H
PROSULFOCARB THIOCARBAMATES H
PROSULFURON SULFONYLUREAS H
PROTHIOCARB CARBAMATES F
PROTHIOFOS ORGANOPHOSPHATES I
PROTHOATE ORGANOPHOSPHATES I
PYMETROZINE ZZ-OTHER-ORGANIC-INSECTICIDES I
PYRAZOPHOS ORGANOPHOSPHATES F,I
PYRETHRIN PYRETHROIDS I
PYRETHROID PYRETHROIDS I
PYRIDABEN ZZ-OTHER-ORGANIC-INSECTICIDES I
PYRIDAFENTHION ORGANOPHOSPHATES I
PYRIDATE DIAZINES H
PYRIFENOX ZZ-OTHER-ORGANIC-FUNGICIDES F
PYRIMETHANIL ANILINOPYRIMIDILS F
PYRIPROXYFEN PHENYL-ETHERS I
PYROQUILON ZZ-OTHER-ORGANIC-FUNGICIDES F
QQUINALPHOS ORGANOPHOSPHATES I
QUINCLORAC QUINOLINECARBOXYLIC-ACIDS H
QUINMERAC QUINOLINECARBOXYLIC-ACIDS H
QUINOMETHIONATE ZZ-OTHER-ORGANIC-FUNGICIDES F
QUINOMETHIONATE ZZ-OTHER-ORGANIC-INSECTICIDES I
QUINTOZENE ZZ-OTHER-ORGANIC-FUNGICIDES F
QUIZALOFOP OXYPHENOXY-DERIVATIVES H
QUIZALOFOP-P-ETHYL OXYPHENOXY-DERIVATIVES H
RRAPE OIL OIL, VEGETABLE I
RESMETHRIN PYRETHROIDS I

Annex A
218 Pflanzenschutz / Plant protection / Protection des cultures A
RIMSULFURON SULFONYLUREAS H
SSECBUMETON ZZ-OTHER-ORGANIC-HERBICIDES H
SETHOXYDIM CYCLOHEXANE DIONE H
SIMAZINE TRIAZINES H
SIMETRYNE TRIAZINES H
SODIUM-ARSENITE INORGANIC-H H
SPIROXAMINE STROBILURINES F
STREPTOMYCIN BIOLOGICALS F
SULCOTRIONE TRIKETONES H
SULFOSATE AMINO-PHOSPHORIC-ACIDS H
SULFOSATE-TRIMESIUM AMINO-PHOSPHORIC-ACIDS H
SULFOTEP ORGANOPHOSPHATES I
SULPHUR INORGANIC-SULPHUR F,I
TTAU-FLUVALINATE PYRETHROIDS I
TCA HALOGENATED ALKANOIC ACIDS H
TCMTB ZZ-OTHER-ORGANIC-FUNGICIDES F
TEBUCONAZOLE AZOLES F
TEBUFENOZIDE DIAZYLHYDRAZINES I
TEBUFENPYRAD PYRAZOLES I
TEBUTAM AMIDES H
TEFLUBENZURON BENZOYLUREAS I
TEFLUTHRIN PYRETHROIDS I
TEMEPHOS ORGANOPHOSPHATES I
TERBACIL URACILS H
TERBUFOS ORGANOPHOSPHATES I
TERBUMETON TRIAZINES H
TERBUTHYLAZINE TRIAZINES H
TERBUTRYN TRIAZINES H
TETRACHLORVINPHOS ORGANOPHOSPHATES I
TETRACONAZOLE AZOLES F
TETRADIFON ZZ-OTHER-ORGANIC-INSECTICIDES I
TETRASUL ZZ-OTHER-ORGANIC-INSECTICIDES I
THIABENDAZOLE BENZIMIDAZOLES F
THIFENSULFURON SULFONYLUREAS H
THIOBENCARB THIOCARBAMATES H
THIOCARBAZIL THIOCARBAMATES H
THIOCYCLAM ZZ-OTHER-ORGANIC-INSECTICIDES I
THIODICARB OXIME-CARBAMATES I
THIOFANOX OXIME-CARBAMATES I
THIOMETON ORGANOPHOSPHATES I
THIOPHANATE-METHYL BENZIMIDAZOLES F
THIRAM DITHIOCARBAMATES F
TIN ORGANOTINS F
TIN OXIDE ORGANOTINS F
TOLCLOFOS-METHYL ORGANOPHOSPHATES F
TOLYLFLUANID ANILINES F
TRALKOXYDIM CYCLOHEXANE DIONE H
TRALOMETHRIN PYRETHROIDS I

Annex A
A Pflanzenschutz / Plant protection / Protection des cultures 219
TRIADIMEFON AZOLES F
TRIADIMENOL AZOLES F
TRIALLATE THIOCARBAMATES H
TRIAPENTHENOL ZZ-OTHER-ORGANIC-FUNGICIDES F
TRIASULFURON SULFONYLUREAS H
TRIAZAMATE ZZ-OTHER-ORGANIC-INSECTICIDES I
TRIAZOPHOS ORGANOPHOSPHATES I
TRIAZOXIDE AZOLES F
TRIBENURON SULFONYLUREAS H
TRICHLORFON ORGANOPHOSPHATES I
TRICLOPYR PHENOXY CARBONIC ACID H
TRICYCLAZOLE AZOLES F
TRIDEMORPH MORPHOLINES F
TRIETAZINE TRIAZINES H
TRIFLUMIZOLE AZOLES F
TRIFLUMURON BENZOYLUREAS I
TRIFLURALIN DINITROANILINES H
TRIFLUSULFURON SULFONYLUREAS H
TRIFORINE PIPERAZINES F
VVAMIDOTHION ORGANOPHOSPHATES I
VERNOLATE THIOCARBAMATES H
VINCLOZOLIN DICARBOXIMIDES F
ZZETA-CYPERMETHRIN PYRETHROIDS I
ZINEB DITHIOCARBAMATES F
ZIRAM DITHIOCARBAMATES F
ZZ-OTHER-F ZZ-OTHER-ORGANIC-FUNGICIDES F
ZZ-OTHER-H ZZ-OTHER-ORGANIC-HERBICIDES H
ZZ-OTHER-I ZZ-OTHER-ORGANIC-INSECTICIDES I

Annex B
A Pflanzenschutz / Plant protection / Protection des cultures 221
AI by chemical class
AI in italics : used in 1992, but not in 1996AI in bold : new since 1992
ACTION:
F = Fungicide / H = Herbicide / I = Insecticide
Chemical class Common Name Action
ACYLALANINES BENALAXYL F
FURALAXYL F
METALAXYL F
ALKANAMIDE DIPHENAMID H
NAPROPAMIDE H
AMIDES DIMETHENAMIDE H
ISOXABEN H
PROPYZAMIDE H
TEBUTAM H
AMIDINES AMITRAZ I/A
AMINO-PHOSPHORIC-ACIDS GLYPHOSATE H
SULFOSATE H
SULFOSATE-TRIMESIUM H
ANILIDES PENTANOCHLOR H
PROPANIL H
ANILINES DICHLOFLUANID F
TOLYLFLUANID F
ANILINOPYRIMIDILS CYPRODINIL F
PYRIMETHANIL F
ANTHRACHINONES DITHIANON F
ARSENICS NA ARSENATE F
ARYLALANINES FLAMPROP H
FLAMPROP-ISOPROPYL H
FLAMPROP-METHYL H

Annex B
222 Pflanzenschutz / Plant protection / Protection des cultures A
ARYLOXYPHENOXY-CARBONIC-ACIDS CLODINAFOP H
DICLOFOP H
FENOXAPROP H
FENOXAPROP-P H
AZOLES AZACONAZOLE F
BITERTANOL F
BROMUCONAZOLE F
CYPROCONAZOLE F
DICLOBUTRAZOL F
DIFENOCONAZOLE F
DINICONAZOLE F
EPOXYCONAZOLE F
ETRIDIAZOLE F
FENBUCONAZOLE F
FENCHLORAZOLE H
FENQUINCONAZOLE F
FLUQUINCONAZOLE F
FLUSILAZOLE F
FLUTRIAFOL F
HEXACONAZOLE F
HYMEXAZOLE F
IMAZALIL F
METCONAZOLE F
MYCLOBUTANIL F
PENCONAZOLE F
PROCHLORAZ F
PROPICONAZOLE F
TEBUCONAZOLE F
TETRACONAZOLE F
TRIADIMEFON F
TRIADIMENOL F
TRIAZOXIDE F
TRICYCLAZOLE F
TRIFLUMIZOLE F
BENZILATES BROMOPROPYLATE I
BENZIMIDAZOLES BENOMYL F
CARBENDAZIM F
FUBERIDAZOLE F
THIABENDAZOLE F
THIOPHANATE-METHYL F
BENZOFURANES BENFURESATE H
ETHOFUMESATE H
BENZOIC-ACIDS (AUXINS) CHLORTHAL H
DICAMBA H
BENZONITRILES CHLORTHIAMID H
DICHLOBENIL H

Annex B
A Pflanzenschutz / Plant protection / Protection des cultures 223
BENZOTHIAZOLES BENAZOLIN H
BENZOXAZINES BENOXACOR H
BENZOYLUREAS CHLORFLUAZURON I
DIFLUBENZURON I
FLUCYCLOXURON I
FLUFENOXURON I
HEXAFLUMURON I
LUFENURON I
TEFLUBENZURON I
TRIFLUMURON I
BIOLOGICALS BACILLUS THURINGIENSIS I
KASUGAMYCIN F
NEMATODES I
NICOTINE I
POLYOXIN B F
STREPTOMYCIN F
BIPYRIDYLIUMS DIQUAT H
PARAQUAT H
BIS-CARBAMATES DESMEDIPHAM H
PHENMEDIPHAM H
CARBAMATES ASULAM H
BENDIOCARB I
BENFURACARB I
CARBARYL I
CARBETAMIDE H
CARBOFURAN I
CARBOSULFAN I
CARTAP I
CHLORBUFAM H
CHLORPROPHAM H
ETHIOFENCARB I
FENOTHIOCARB I
FENOXYCARB I
FORMETANATE I
FURATHIOCARB I
METHIOCARB I
PIRIMICARB I
PROPAMOCARB F
PROPHAM H
PROPOXUR I
PROTHIOCARB F
CARBOXAMIDES FLUTOLANIL F
MEPRONIL F
OXYCARBOXIN F

Annex B
224 Pflanzenschutz / Plant protection / Protection des cultures A
CHLOROACETANILIDES ACETOCHLOR H
ALACHLOR H
DIMETHACHLOR H
METAZACHLOR H
METOLACHLOR H
PRETILACHLOR H
PROPACHLOR H
CHLOROAMIDES DICHLORMID H
CHLOROPHENOLS DICHLOROPHEN H
CYANIDE HYDROGEN CYANIDE I
CYCLODIENE ORGANOCHLORINES ENDOSULFAN I
CYCLOHEXANE DIONE ALLOXYDIM H
CLETHODIM H
CYCLOXYDIM H
SETHOXYDIM H
TRALKOXYDIM H
DIAZINES PYRIDATE H
DIAZYLHYDRAZINES TEBUFENOZIDE I
DICARBOXIMIDES CHLOZOLINATE F
IPRODIONE F
PROCYMIDONE F
VINCLOZOLIN F
DINITROANILINES BENFLURALIN H
BUTRALIN H
DINITRAMINE H
ETHALFLURALIN H
FLUAZINAM F
FLUMETRALIN H
ORYZALIN H
PENDIMETHALIN H
TRIFLURALIN H
DINITROPHENOLS DINOCAP F
DINOTERB H
DNOC F
DIPHENYL-ETHERS ACIFLUORFEN H
ACLONIFEN H
BIFENOX H
CHLOMETHOXYFEN H
FLUOROGLYCOFEN H
FOMESAFEN H
OXYFLUORFEN H

Annex B
A Pflanzenschutz / Plant protection / Protection des cultures 225
DITHIOCARBAMATES DITHIOCARBAMATE F
FERBAM F
MANCOZEB F
MANEB F
METIRAM F
PROPINEB F
THIRAM F
ZINEB F
ZIRAM F
ETHYLPHOSPHATE FOSETYL F
GUANIDINES DODINE F
GUAZATINE F
HALOGENATED ALKANOIC ACIDS DALAPON H
TCA H
HYDROXYBENZONITRILES BROMOFENOXIM H
BROMOXYNIL H
IOXYNIL H
IMIDAZOLINONES IMAZAMETHABENZ H
IMAZAPYR H
IMAZETHAPYR H
INORGANIC-COPPERS COPPER F
COPPER AMMONIUM F
COPPER HYDROXIDE F
COPPER OXIDE F
COPPER OXYCHLORIDE F
COPPER SULPHATE F
OXINE-COPPER F
INORGANIC-H AMMONIUM THIOCYANATE H
CA CYANAMIDE H
NA CHLORATE H
NA MONOCHLOROACETATE H
SODIUM-ARSENITE H
INORGANIC-SULPHUR SULPHUR F,I
METHYL-ISOTHIOCYANATE DAZOMET I
MORPHACTINS FLURENOL H

Annex B
226 Pflanzenschutz / Plant protection / Protection des cultures A
MORPHOLINES ALDIMORPH F
DIMETHOMORPH F
DODEMORPH F
FENPROPIDIN F
FENPROPIMORPH F
TRIDEMORPH F
ACEPHATE I
AZINPHOS I
AZINPHOS-E I
AZINPHOS-ETHYL I
AZINPHOS-M I
AZINPHOS-METHYL I
BROMOPHOS I
CADUSAFOS I
CARBOPHENOTHION I
CHLORFENVINPHOS I
CHLORMEPHOS I
CHLORPYRIFOS I
DEMETON-S-METHYL I
DIALIFOS I
DIAZINON I
DICHLORVOS I
DIMETHOATE I
DIOXATHION I
DISULFOTON I
OIL, MINERAL MINERAL OIL I
OIL, VEGETABLE RAPE OIL I
ORGANOCHLORINES DICOFOL I
DIENOCHLOR I
GAMMA-BHC I
LINDANE I
METHOXYCHLOR I
ORGANOPHOSPHATES ETHION I
ETHOPROPHOS I
ETRIMFOS I
FENAMIPHOS I
FENITROTHION I
FENTHION I
FONOFOS I
FORMOTHION I
HEPTENOPHOS I
ISOFENPHOS I
ISOXATHION I
MALATHION I
MECARBAM I
MEPHOSFOLAN I
METHAMIDOPHOS I
METHIDATHION I

Annex B
A Pflanzenschutz / Plant protection / Protection des cultures 227
MEVINPHOS I
MONOCROTOPHOS I
NALED I
OMETHOATE I
OXYDEMETON-M I
OXYDEMETON-METHYL I
PARATHION I
PARATHION-ETHYL I
PARATHION-METHYL I
PHENTHOATE I
PHORATE I
PHOSALONE I
PHOSMET I
PHOSPHAMIDON I
PHOXIM I
PIRIMIPHOS I
PIRIMIPHOS-E I
PIRIMIPHOS-ETHYL I
PIRIMIPHOS-M I
PIRIMIPHOS-METHYL I
PROFENOFOS I
PROFENOFOS Q I
PROTHIOFOS I
PROTHOATE I
PYRAZOPHOS F,I
PYRIDAFENTHION I
QUINALPHOS I
SULFOTEP I
TEMEPHOS I
TERBUFOS I
TETRACHLORVINPHOS I
THIOMETON I
TOLCLOFOS-METHYL F
TRIAZOPHOS I
TRICHLORFON I
VAMIDOTHION I
ORGANOTINS AZOCYCLOTIN I
CYHEXATIN I
FENBUTATIN-OXIDE F
FENTIN F
FENTIN ACETATE F
FENTIN HYDROXIDE F
TIN F
TIN OXIDE F
OXIME-CARBAMATES ALDICARB I
BUTOCARBOXIM I
CARBOXIN F
METHOMYL I
OXAMYL I
THIODICARB I
THIOFANOX I

Annex B
228 Pflanzenschutz / Plant protection / Protection des cultures A
OXYACETAMIDES MEFENACET H
OXYPHENOXY-DERIVATIVES FLUAZIFOP H
FLUAZIFOP-P H
HALOXYFOP H
HALOXYFOP-E H
HALOXYFOP-M H
HALOXYFOP-R-METHYL H
PROPAQUIZAFOP H
QUIZALOFOP H
QUIZALOFOP-P-ETHYL H
PHENOXY CARBONIC ACID 2,3,6-TBA H
2,4,5-T H
2,4-D H
2,4-DB H
DICHLORPROP H
DICHLORPROP-P H
MCPA H
MCPB H
MECOPROP H
MECOPROP-P H
TRICLOPYR H
PHENOXY NICOTINEANILIDES DIFLUFENICAN H
PHENYLAMIDES OFURACE F
OXADIXYL F
PHENYL-CARBAMATES DIETHOFENCARB F
PHENYL-ETHERS PYRIPROXYFEN I
PHENYLPYRROLES FENPICLONIL F
FLUDIOXONIL F
PHOSPHINICO-AMINO-ACIDS GLUFOSINATE H
PHTHALIC ACIDS CAPTAFOL F
CAPTAN F
FOLPET F
PIPERAZINES TRIFORINE F
PYRAZOLES DIFENZOQUAT H
FENPYRAD I
FENPYROXIMATE I
TEBUFENPYRAD I
PYRETHROIDS ACRINATHRIN I
ALPHA-CYPERMETHRIN I

Annex B
A Pflanzenschutz / Plant protection / Protection des cultures 229
BETACYFLUTHRIN I
BETA-CYFLUTHRIN I
BIFENTHRIN I
BIORESMETHRIN I
CYFLUTHRIN I
CYHALOTHRIN I
CYPERMETHRIN I
CYPERMETHRIN HIGHCIS I
DELTAMETHRIN I
ESFENVALERATE I
FENPROPATHRIN I
FENVALERATE I
FLUCYTHRINATE I
FLUVALINATE I
HALFENPROX I
LAMBDA-CYHALOTHRIN I
PERMETHRIN I
PYRETHRIN I
PYRETHROID I
RESMETHRIN I
TAU-FLUVALINATE I
TEFLUTHRIN I
TRALOMETHRIN I
ZETA-CYPERMETHRIN I
PYRIDAZINONES CHLORIDAZONE H
NORFLURAZON H
PYRIDINECARBOXYLIC-ACIDS CLOPYRALID H
PICLORAM H
PYRIDYLOXY ACETIC ACID FLUROXYPYR H
PYRIMIDINES BUPIRIMATE F
ETHIRIMOL F
FENCLORIM H
PYRIMIDINYL-CARBINOLS FENARIMOL F
NUARIMOL F
QUINOLINECARBOXYLIC-ACIDS QUINCLORAC H
QUINMERAC H
STROBILURINES KRESOXIM-METHYL F
SPIROXAMINE F
SULFONYLUREAS AMIDOSULFURON H
BENSULFURON H
CHLORSULFURON H
CINOSULFURON H
METSULFURON-METHYL H
NICOSULFURON H

Annex B
230 Pflanzenschutz / Plant protection / Protection des cultures A
PRIMISULFURON H
PROSULFURON H
RIMSULFURON H
THIFENSULFURON H
TRIASULFURON H
TRIBENURON H
TRIFLUSULFURON H
TETRAZINES CLOFENTEZINE I
THIADIAZINES BENTAZONE H
THIOCARBAMATES BUTYLATE H
CYCLOATE H
DIALLATE H
DI-ALLATE H
DIMEPIPERATE H
EPTC H
MOLINATE H
ORBENCARB H
PEBULATE H
PROSULFOCARB H
THIOBENCARB H
THIOCARBAZIL H
TRIALLATE H
VERNOLATE H
TRIAZINES AMETRYNE H
ANILAZINE F
ATRAZINE H
AZIPROTRYN H
CYANAZINE H
DESMETRYN H
PROMETRYN H
PROPAZINE H
SIMAZINE H
SIMETRYNE H
TERBUMETON H
TERBUTHYLAZINE H
TERBUTRYN H
TRIETAZINE H
TRIAZINONES HEXAZINONE H
METAMITRON H
METRIBUZIN H
TRIAZOLES AMINOTRIAZOLE H
AMITROLE H
TRIKETONES SULCOTRIONE H

Annex B
A Pflanzenschutz / Plant protection / Protection des cultures 231
URACILS BROMACIL H
LENACIL H
TERBACIL H
UREAS BENZTHIAZURON H
CHLORBROMURON H
CHLOROTOLURON H
CHLOROXURON H
CYCLURON H
CYMOXANIL F
DIAFENTHIURON I
DIFENOXURON H
DIMEFURON H
DIURON H
FENURON H
FLUOMETURON H
ISOPROTURON H
LINURON H
METHABENZTHIAZURON H
METOBROMURON H
METOXURON H
MONOLINURON H
NEBURON H
PENCYCURON F
ZZ-OTHER-ORGANIC-FUNGICIDES ACIBENZOLAR F
BENODANIL F
CHLOROTHALONIL F
FENAMINOSULF F
METOMECLAN F
NA PROPIONATE F
NA-M-BISULFITE F
NITROTHAL-ISOPROPYL F
PYRIFENOX F
PYROQUILON F
QUINOMETHIONATE F
QUINTOZENE F
TCMTB F
TRIAPENTHENOL F
ZZ-OTHER-F F
ZZ-OTHER-ORGANIC-HERBICIDES BARBAN H
BENZOYLPROP H
CLOMAZONE H
CLOQUINTOCET H
DIKEGULAC H
DINOSEB H
EPTAM H
FLUORODIFEN H
FLUPOXAM H
FLUROCHLORIDONE H
ISOPROPALIN H

Annex B
232 Pflanzenschutz / Plant protection / Protection des cultures A
METHAZOLE H
METHOPROTRYNE H
METOSULAM H
MONALIDE H
NAPTALAM H
NITROFEN H
OXADIAZON H
SECBUMETON H
ZZ-OTHER-H H
ZZ-OTHER-ORGANIC-INSECTICIDES ABAMECTIN I
BENZOXIMATE I
BUPROFEZIN I
CYROMAZINE I
DICHLOROPROPENE I
DINOBUTON I
FENAZAQUIN I
FLUBENZIMINE I
HEXYTHIAZOX I
IMIDACLOPRID I
METALDEHYDE I
PHEROMONES I
PROPARGITE I
PYMETROZINE I
PYRIDABEN I
QUINOMETHIONATE I
TETRADIFON I
TETRASUL I
THIOCYCLAM I
TRIAZAMATE I
ZZ-OTHER-I I