data analysis 3data analysis 3 - general-maths - home\documents and...
TRANSCRIPT

C:\Documents and Settings\tracey_h-butters\Desktop\mathematics\year_levels\math_stage6\General\preliminary\notes\statistics\data3\data_analysis3.doc 1
Single Data SetsSingle Data SetsSingle Data SetsSingle Data Sets Data Analysis 3Data Analysis 3Data Analysis 3Data Analysis 3
General Mathematics Preliminary courseGeneral Mathematics Preliminary courseGeneral Mathematics Preliminary courseGeneral Mathematics Preliminary course
Name: Name: Name: Name: ________________________________________________________
C:\Documents and Settings\tracey_h-butters\Desktop\mathematics\year_levels\math_stage6\General\preliminary\notes\statistics\data3\data_analysis3.doc 2
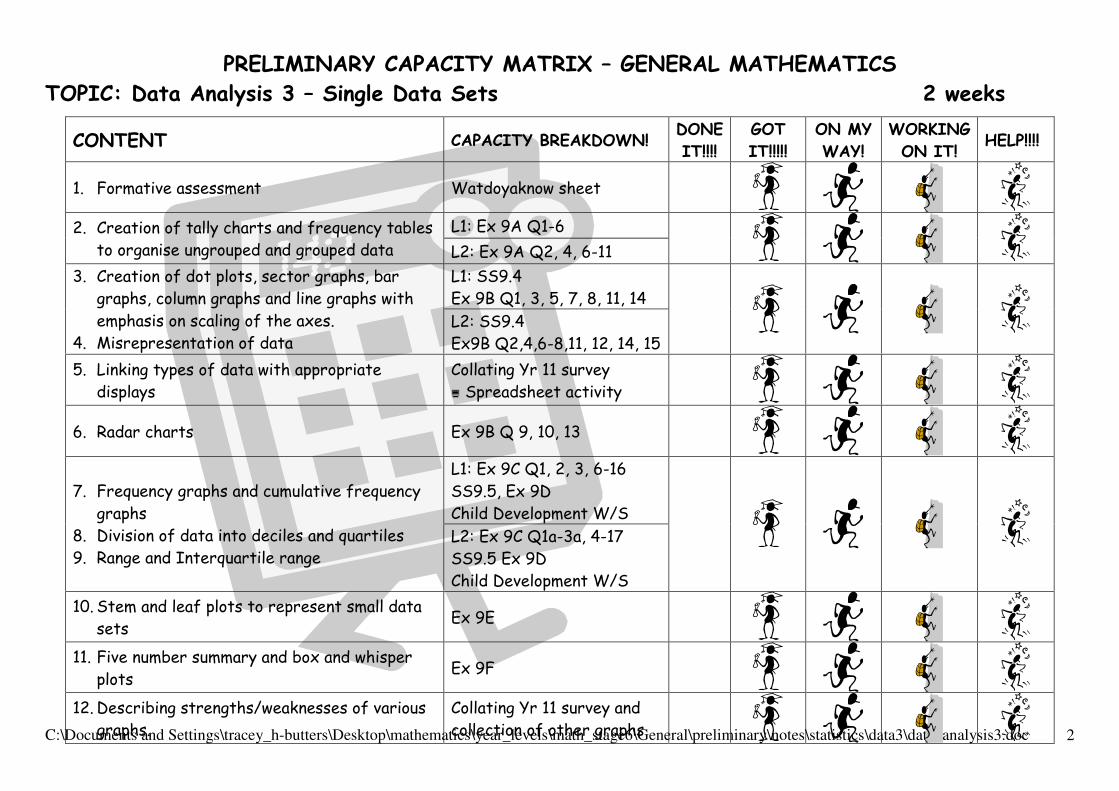
PRELIMINARY CAPACITY MATRIX – GENERAL MATHEMATICS
TOPIC: Data Analysis 3 – Single Data Sets 2 weeks
CONTENT CAPACITY BREAKDOWN! DONE
IT!!!!
GOT
IT!!!!!
ON MY
WAY!
WORKING
ON IT! HELP!!!!
1. Formative assessment Watdoyaknow sheet
L1: Ex 9A Q1-6 2. Creation of tally charts and frequency tables
to organise ungrouped and grouped data L2: Ex 9A Q2, 4, 6-11
L1: SS9.4
Ex 9B Q1, 3, 5, 7, 8, 11, 14
3. Creation of dot plots, sector graphs, bar
graphs, column graphs and line graphs with
emphasis on scaling of the axes.
4. Misrepresentation of data L2: SS9.4
Ex9B Q2,4,6-8,11, 12, 14, 15
5. Linking types of data with appropriate
displays
Collating Yr 11 survey
� Spreadsheet activity
6. Radar charts Ex 9B Q 9, 10, 13
L1: Ex 9C Q1, 2, 3, 6-16
SS9.5, Ex 9D
Child Development W/S
7. Frequency graphs and cumulative frequency
graphs
8. Division of data into deciles and quartiles
9. Range and Interquartile range L2: Ex 9C Q1a-3a, 4-17
SS9.5 Ex 9D
Child Development W/S
10. Stem and leaf plots to represent small data
sets Ex 9E
11. Five number summary and box and whisper
plots Ex 9F
12. Describing strengths/weaknesses of various
graphs.
Collating Yr 11 survey and
collection of other graphs

Oa Tracey Hughes-Butters em Mathtastic Learning © 2011 qm 3
FORMATIVE MATRIX – GENERAL MATHEMATICS
TOPIC: Data Analysis 3 – Single Data Sets
QUESTION & ACCOMPANYING
CONTENT GOT
IT!!!!!
HAD
SOME
HELP!
HELP!!!!
1. Frequency distributions
2. Frequency distributions
3. Interpreting graphs
4. Constructing bar charts
5. Constructing sector graphs
6. Interpreting graphs
7. Constructing a dot plot
8. Constructing frequency histograms and
polygons
9. Constructing cumulative frequency
histograms and polygons (ogive)

Oa Tracey Hughes-Butters em Mathtastic Learning © 2011 qm 4
Frequency tablesFrequency tablesFrequency tablesFrequency tables
A frequency table is used to tabulate statistical data. A well-designed table allows the
person doing the statistical investigation to easily tally up the data. In this topic we are
concerned with the tallying of quantitative data.
eg Fifty people were surveyed and asked the number of DVDs that they had hired from a
Video store in the past month. The results are shown below.
2 4 5 3 3 3 3 0 5 1
1 3 3 0 5 2 2 1 3 1
3 4 4 2 0 1 4 0 3 2
0 1 5 5 1 2 3 5 3 4
0 2 0 4 4 4 2 2 4 5
Enter the information in a frequency table.

Oa Tracey Hughes-Butters em Mathtastic Learning © 2011 qm 5
Sometimes it would be pointless trying to tally the data as individual (ungrouped) scores. It makes
better sense to group the scores.
eg Consider the following data that give the number of nails in each of a sample of 40 boxes:

Oa Tracey Hughes-Butters em Mathtastic Learning © 2011 qm 6
Types of Graphs
Dot plots eg Below are the scores out of 10 achieved by 15 students on a Maths quiz:
7 4 9 7 6 7 4 8 5 2 7 9 5 8 7
Display this information on a dot plot.
Sector graphs are used to compare quantities.
eg A poll was conducted on an issue of justice based on
the statement “Apple has every right to track their
phones and ipads”. The responses were:
Agree 24 Disagree 57 Unsure 9
Present this information in a sector graph.

Oa Tracey Hughes-Butters em Mathtastic Learning © 2011 qm 7
Line graphs are used to compare the change in one quantity with the change in
another. It is suitable for quantitative data.
eg The table below shows the temperature taken in a classroom over a day.
Present this information as a line graph.

Oa Tracey Hughes-Butters em Mathtastic Learning © 2011 qm 8
Bar and Column graphs are used when we want to show a quantity and
compare it to other quantities.
This is suitable for categorical data.
A bar graph has the categories on the vertical axis and
frequency on the horizontal axis. These axes are
reversed for a column graph.
eg The information shown below gives the government
housing rates in various NSW regions:
Hunter 16.5%
Illawarra 23.1%
Mid North Coast 8.4%
Western 10%
Riverina 11.6% Show this information in a bar graph.

Oa Tracey Hughes-Butters em Mathtastic Learning © 2011 qm 9
A Radar chart is similar to a line graph except it is circular. It is particularly suitable
for presenting data trends that repeat.
The ‘radar’ is drawn with the data being measured placed in equal sectors around the circle
and the results having a scale from the centre. The points are then plotted and joined
consecutively.
eg The information below shows the sales in a department store over a year.
Present this as a radar chart.

Oa Tracey Hughes-Butters em Mathtastic Learning © 2011 qm 10
Statistical graphs Frequency graphs:
When displaying statistical or quantitative data, the most appropriate graphs are a frequency
histogram and frequency polygon.
FREQUENCY HISTOGRAMS:
Are similar to column graphs EXCEPT FOR THE FOLLOWING FEATURES:
: Gaps are NEVER left between the columns;
: A half unit space is left BEFORE the 1st column;
: If the chart is coloured or shaded then it is done all in one colour.
: Frequency is ALWAYS plotted on the vertical axis.
: For grouped, data, the score is marked so that the CLASS CENTRE of each class
appears under the centre of the column.
eg The table below shows the number of people living in each house in a street.
Show this information in a frequency histogram.

Oa Tracey Hughes-Butters em Mathtastic Learning © 2011 qm 11
A frequency polygon is a line graph that can be
drawn by joining the centres of the tops of the
columns of the histogram.
: The polygon begins and finished on the
horizontal axis a half column width space
from the group boundary of the first and last
groups.
It is common practice to draw the histogram and
the polygon on the same set of axes.
eg The frequency distribution below shows a class set of marks on an exam. Construct a
frequency histogram and polygon on the same set of axes.

Oa Tracey Hughes-Butters em Mathtastic Learning © 2011 qm 12
Reversing…
Creating a frequency distribution from a frequency Histogram.
Follow these steps:
Z Construct a table with Score and Frequency; Z Copy the scores from the horizontal axis into the Score column; Z The frequency is given by the height of the column above the score.

Oa Tracey Hughes-Butters em Mathtastic Learning © 2011 qm 13
Cumulative graphs The cumulative frequency is a progressive total of the frequency column.
Complete the following table:
eg The frequency table below shows the heights of people in a basketball squad.
a) Add a cumulative frequency column to the table.
b) Construct a frequency histogram and ogive.

Oa Tracey Hughes-Butters em Mathtastic Learning © 2011 qm 14

Oa Tracey Hughes-Butters em Mathtastic Learning © 2011 qm 15
Range and Interquartile Range The range and interquartile range are used to measure the spread of a set of scores.
Range
Range =
eg There are 15 players in the squad for a State Hockey match. The number of State level
matches played by each member of the squad is shown below:
2 6 4 12 3 4 0 15 6 3 7 10 7 3 2
What is the range of this distribution? _____________
When calculating the range from a frequency distribution, we calculate the range using the
score column.
If the data is presented in grouped form, use the highest score from the highest class and
lowest score from the lowest class.
eg Find the range of these data:
The range however, is often not a good indicator of the overall spread of scores. Consider the
two sets of scores showing the marks of two students:
A: 24, 24, 24, 24.5, 25, 25, 26, 80
B: 18, 20, 24, 29, 35, 40, 50, 60

Oa Tracey Hughes-Butters em Mathtastic Learning © 2011 qm 16
Interquartile Range
1 The quartiles are found by dividing the data into quarters. The lower quartile (Q1) is the
lowest 25% of scores; the upper quartile (Q3) is the highest 25% of scores.
2 The median is the middle score (for an odd number of scores) or the average of the two
middle scores (for an even number of scores)
eg Calculate the median of:
a) 2, 5, 8, 8, 8, 11, 12
b) 34, 64, 23, 57, 89, 44, 62, 76
3 The interquartile range is the difference of the Upper quartile (Q3) and the lower quartile
(Q1). To find the IQR:
eg Find the interquartile range of the following data:
12, 9, 4, 6, 5, 8, 4, 10, 2

Oa Tracey Hughes-Butters em Mathtastic Learning © 2011 qm 17
eg The cumulative frequency histogram and polygon at below shows the number of
customers who order different volumes of concrete from a readymix concrete company
during a day.
Find the:
a) median;
b) interquartile range for this distribution
A data set can also be divided into deciles. A decile is a band of 10% of all scores, eg the top decile would be found using the 90th percentile.

Oa Tracey Hughes-Butters em Mathtastic Learning © 2011 qm 18
Stem and Leaf plots In a stem and leaf plot, the final digit of each number is shown in the leaf column, while the
preceding digit/s is displayed in the stem column.
The numbers in both stem and leaf columns are ordered from SMALLEST TO LARGEST. The key
on the plot explains how to read the score.

Oa Tracey Hughes-Butters em Mathtastic Learning © 2011 qm 19

Oa Tracey Hughes-Butters em Mathtastic Learning © 2011 qm 20
Five-Number summaries Once we know the median and quartiles, we are able to summarise a data set using 5
numbers. This 5- number summary consists of:
Z minimum score (lower extreme) - the lowest score in the data set;
Z Lower quartile (Q1) – the score at the 25th percentile
Z Median – the middle score
Z Upper Quartile (Q3) - the score in the 75th percentile
Z Maximum score (upper extreme) – the highest score in the data set
Interquartile range = Q3 – Q1
This data is then presented in a Box & Whisker plot.
Z The box portion of the box-and-whisker plot includes 50% of the data
Z The whiskers extend to the minimum and maximum data values
Z More than one box plot can be drawn for the number scale allowing comparison of a
variable by groups

Oa Tracey Hughes-Butters em Mathtastic Learning © 2011 qm 21
eg Find the five point summary, Interquartile range and the sixth decile for the following sets of data:
a) 8 10 18 11 7 12 8 9 8 15 12 13 15 Arrange the scores in ascending order:
Minimum value = ________
Q1 (lower quartile) = ________
Q2 (median) = _______
Q3 (upper quartile) = ________
Maximum range = _________
Interquartile range = _________
b)
Stem Leaf
4 0 1 3
5 2 5 6 7
6 2 8
7 0 3 3 4 7 9
8 3 4 5 6 8
9 0 3 4 5
c)

Oa Tracey Hughes-Butters em Mathtastic Learning © 2011 qm 22
eg a) Determine the Five-Number Summary for the two data sets of raisin counts displayed
below.
b) Construct a box plot for each on the same scale. Based on the box plots, which brand of
raisins would you buy? Justify your decision.
Sunripe Raisins
25 25 25 26 26 26 26 26 27 27
27 28 28 28 28 28 28 28 28 28
29 29 29 30 30 31 32 32
Rockin’ Raisins
23 24 25 25 25 27 27 27 27 27 27
27 27 28 28 29 29 29 29 29 29 30
31 32 32 33 33 33 34 34 35 35 35
36 36 38