data breach quickview - risk based security€¦ · breach breach adobe systems, inc. services co....
TRANSCRIPT
1 | Data Breach Intelligence Copyright © 2013 Risk Based Security, Inc. All rights reserved.
The goal of this report is to provide an executive level summary of the key findings from RBS'
analysis of the data breach incidents reported during 2013. Please contact Risk Based Security for the
complete analysis of the 2013 data breaches and any detailed analysis required.
2013 at a Glance …
There were 2,164 incidents reported through December 31, 2013 exposing 822 million records.
A single hacking incident involving Adobe Systems exposed 152 million names, customer IDs, encrypted
passwords, debit or credit card numbers and other information relating to customer orders.
The Business sector accounted for 53.4% of reported incidents, followed by Government (19.3%),
Medical (11.5%), Education (8.2%), and Unknown (7.6%).
The Business sector accounted for 73.9% of the number of records exposed, followed by Unknown at
24.5%.
59.8% of reported incidents were the result of Hacking which accounted for 72.0% of exposed
records.
4.8% of the reported incidents were the result of Web related attacks which accounted 16.9% of
exposed records.
Breaches involving U.S. entities accounted for 48.7% of the incidents and 66.5% of the exposed records.
51.1% of the incidents exposed between one and 1000 records.
Twenty-seven incidents have exposed more than one million records.
Four 2013 incidents have secured a place on the Top 10 All Time Breach List.
The number of reported exposed records tops 2.5 billion and the number of reported incidents tracked
by Risk Based Security exceeded 11,200.
Data Breach QuickView
An Executive’s Guide to 2013
Data Breach Trends
Sponsored by:
Risk Based Security
Open Security Foundation
February 2014
2 | Data Breach Intelligence Copyright © 2014 Risk Based Security, Inc. All rights reserved.
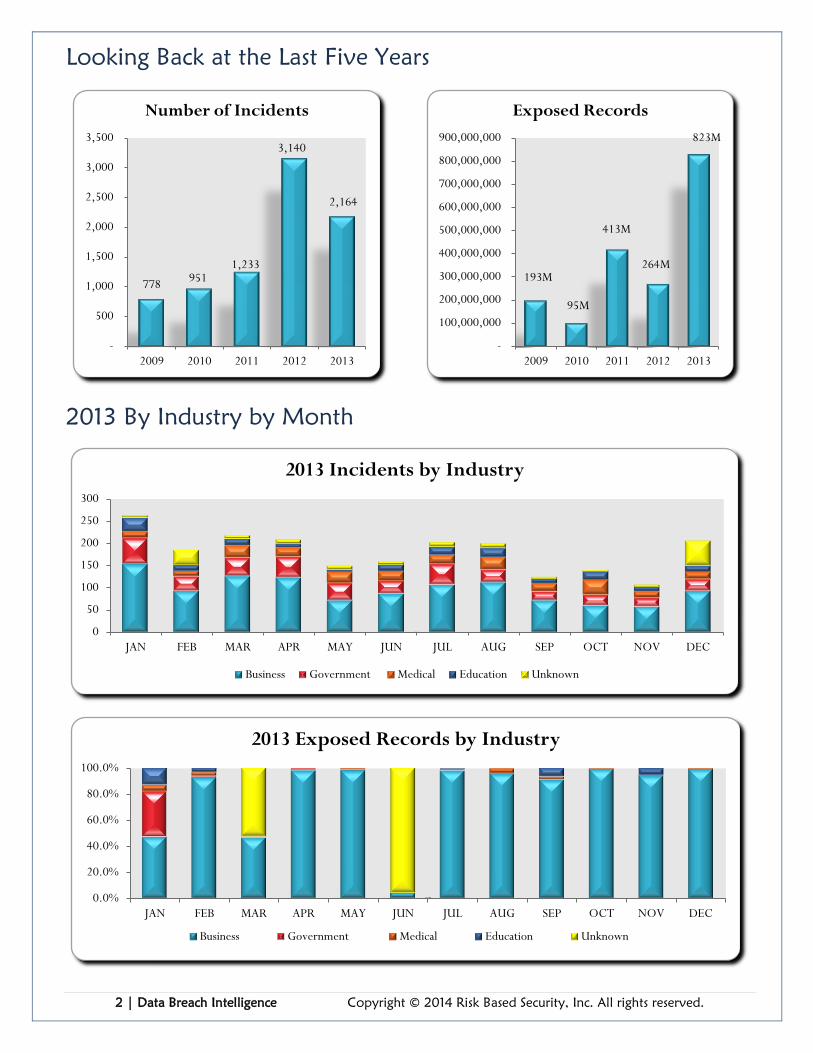
Looking Back at the Last Five Years
2013 By Industry by Month
778 951
1,233
3,140
2,164
-
500
1,000
1,500
2,000
2,500
3,000
3,500
2009 2010 2011 2012 2013
Number of Incidents
193M
95M
823M
413M
264M
-
100,000,000
200,000,000
300,000,000
400,000,000
500,000,000
600,000,000
700,000,000
800,000,000
900,000,000
2009 2010 2011 2012 2013
Exposed Records
0
50
100
150
200
250
300
JAN FEB MAR APR MAY JUN JUL AUG SEP OCT NOV DEC
2013 Incidents by Industry
Business Government Medical Education Unknown
0.0%
20.0%
40.0%
60.0%
80.0%
100.0%
JAN FEB MAR APR MAY JUN JUL AUG SEP OCT NOV DEC
2013 Exposed Records by Industry
Business Government Medical Education Unknown

3 | Data Breach Intelligence Copyright © 2014 Risk Based Security, Inc. All rights reserved.
2013 Analysis by Breach Type
Analysis by Threat Vector – A Deeper look at the Insider Threat
1293
152
122
103
101
69
66
46
44
34
30
104
0 500 1000 1500
Hacking
Fraud Se
Documents
Web
Stolen Laptop
Unknown
Snail Mail
Snooping
Skimming
Stolen Computer
Other
2013 Incidents by Breach Type
72.0%
16.9%
7.3%
1.2%
1.2%
1.4%
0.0% 20.0% 40.0% 60.0% 80.0%
Hacking
Web
Government Seizure
FraudSe
Unknown
Other
2013 Records Exposed by Breach Type
Inside-Unknown
4.2%
Inside-Accidental
11.4%
Inside-Malicious
9.4% Outside 71.2%
Unknown 3.8%
2013 Incidents by Threat Vector
71.2% of incidents
involved outside the
organization activity.
96.8% of exposed records involved
outside the organization activity.
4 | Data Breach Intelligence Copyright © 2014 Risk Based Security, Inc. All rights reserved.
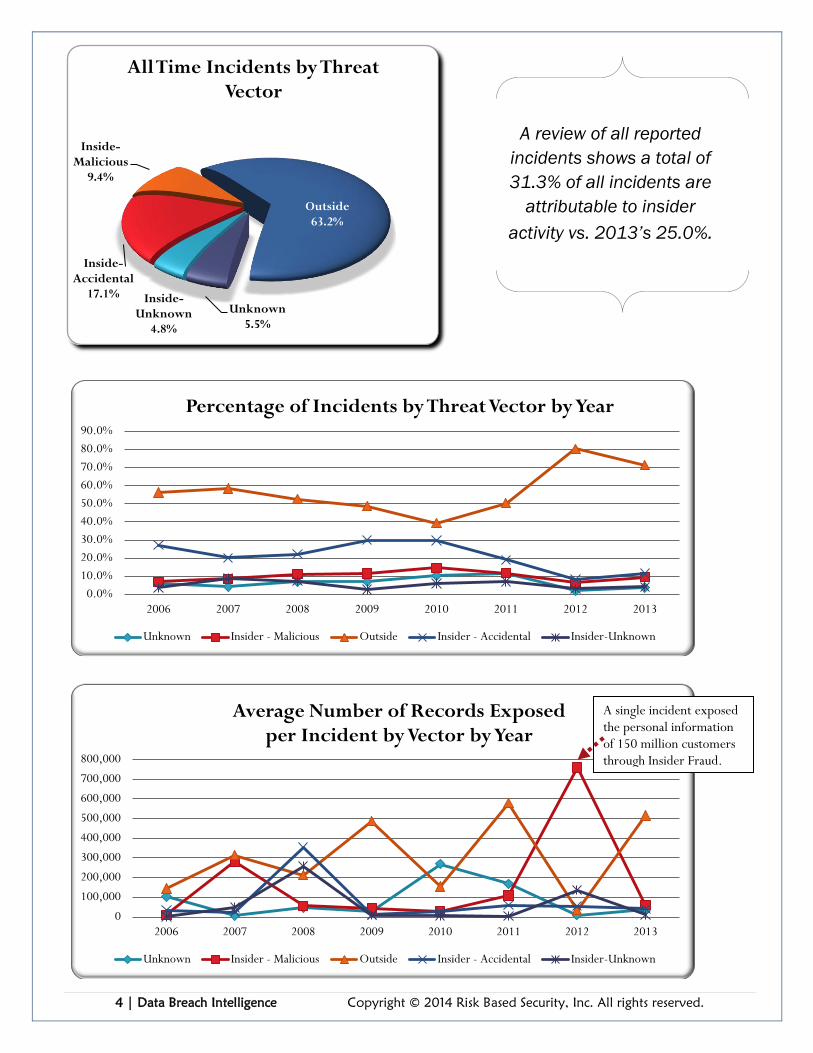
Inside-Unknown
4.8%
Inside-Accidental
17.1%
Inside-Malicious
9.4%
Outside 63.2%
Unknown 5.5%
All Time Incidents by Threat Vector
0.0%
10.0%
20.0%
30.0%
40.0%
50.0%
60.0%
70.0%
80.0%
90.0%
2006 2007 2008 2009 2010 2011 2012 2013
Percentage of Incidents by Threat Vector by Year
Unknown Insider - Malicious Outside Insider - Accidental Insider-Unknown
0
100,000
200,000
300,000
400,000
500,000
600,000
700,000
800,000
2006 2007 2008 2009 2010 2011 2012 2013
Average Number of Records Exposed per Incident by Vector by Year
Unknown Insider - Malicious Outside Insider - Accidental Insider-Unknown
A single incident exposed the personal information of 150 million customers through Insider Fraud.
A review of all reported
incidents shows a total of
31.3% of all incidents are
attributable to insider
activity vs. 2013’s 25.0%.
5 | Data Breach Intelligence Copyright © 2014 Risk Based Security, Inc. All rights reserved.
The Risk from Insiders
Much has been written about the prevalence and severity of the insider threat. The trusted user - the
person with access to systems and data - is often described as one of the most significant risks to the
security of sensitive information. But how substantial is the insider threat and what are the most
common breach methods deployed by the insider? A closer look at breaches over time reveals the risk
from the insider threat is not nearly as significant as attacks from the outside.
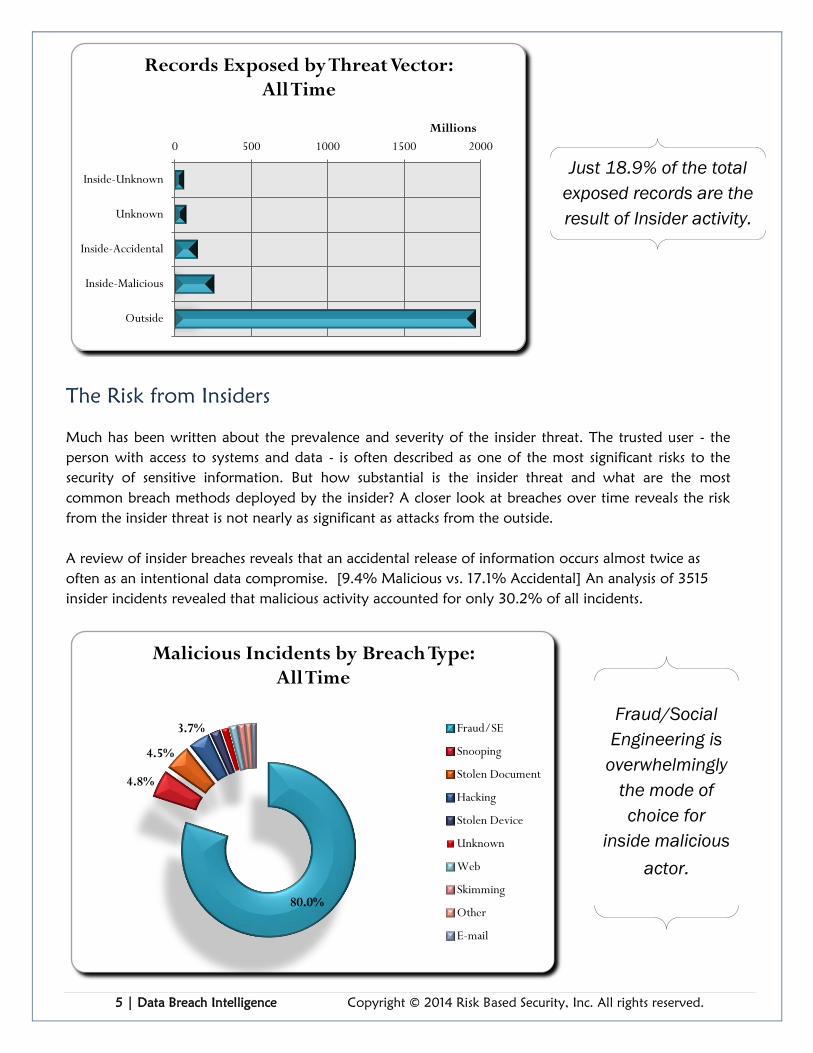
A review of insider breaches reveals that an accidental release of information occurs almost twice as
often as an intentional data compromise. [9.4% Malicious vs. 17.1% Accidental] An analysis of 3515
insider incidents revealed that malicious activity accounted for only 30.2% of all incidents.
0 500 1000 1500 2000
Inside-Unknown
Unknown
Inside-Accidental
Inside-Malicious
Outside
Millions
Records Exposed by Threat Vector: All Time
80.0%
4.8%
4.5%
3.7%
Malicious Incidents by Breach Type: All Time
Fraud/SE
Snooping
Stolen Document
Hacking
Stolen Device
Unknown
Web
Skimming
Other
Just 18.9% of the total
exposed records are the
result of Insider activity.
Fraud/Social
Engineering is
overwhelmingly
the mode of
choice for
inside malicious
actor.
6 | Data Breach Intelligence Copyright © 2014 Risk Based Security, Inc. All rights reserved.
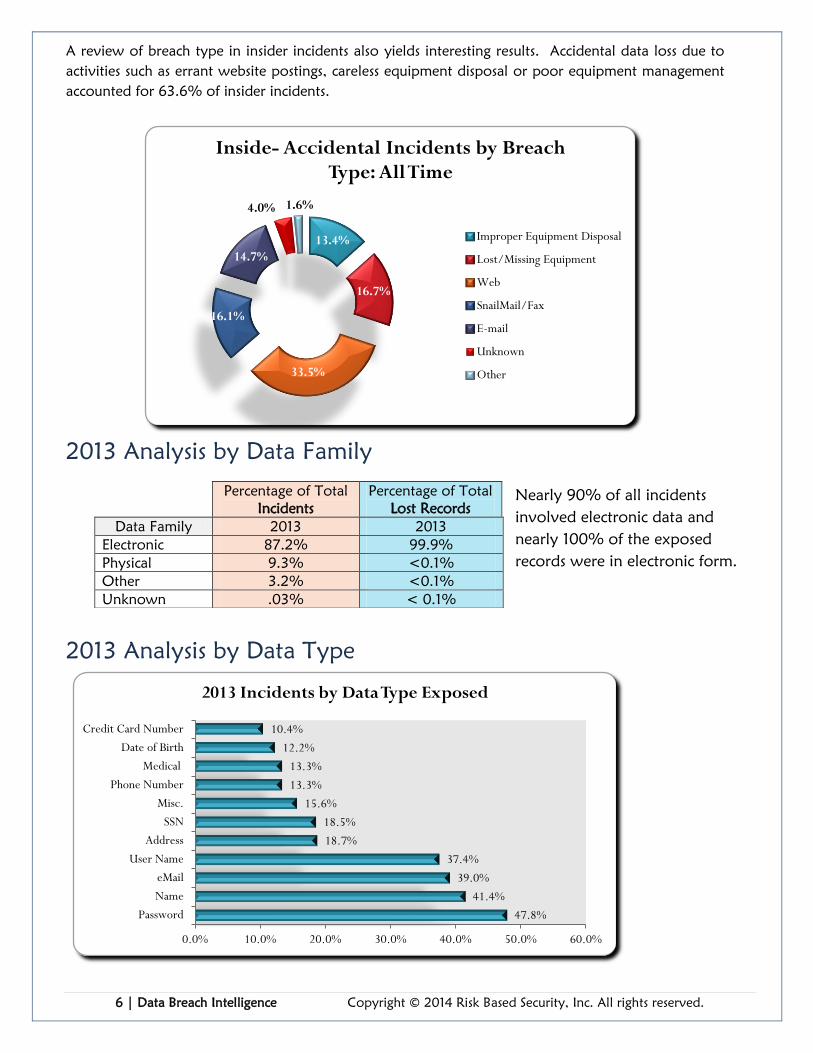
A review of breach type in insider incidents also yields interesting results. Accidental data loss due to
activities such as errant website postings, careless equipment disposal or poor equipment management
accounted for 63.6% of insider incidents.
2013 Analysis by Data Family
Nearly 90% of all incidents
involved electronic data and
nearly 100% of the exposed
records were in electronic form.
2013 Analysis by Data Type
13.4%
16.7%
33.5%
16.1%
14.7%
4.0% 1.6%
Inside- Accidental Incidents by Breach Type: All Time
Improper Equipment Disposal
Lost/Missing Equipment
Web
SnailMail/Fax
Unknown
Other
47.8%
41.4%
39.0%
37.4%
18.7%
18.5%
15.6%
13.3%
13.3%
12.2%
10.4%
0.0% 10.0% 20.0% 30.0% 40.0% 50.0% 60.0%
Password
Name
User Name
Address
SSN
Misc.
Phone Number
Medical
Date of Birth
Credit Card Number
2013 Incidents by Data Type Exposed
Percentage of Total
Incidents
Percentage of Total
Lost Records
Data Family 2013 2013
Electronic 87.2% 99.9%
Physical 9.3% <0.1%
Other 3.2% <0.1%
Unknown .03% < 0.1%
7 | Data Breach Intelligence Copyright © 2014 Risk Based Security, Inc. All rights reserved.
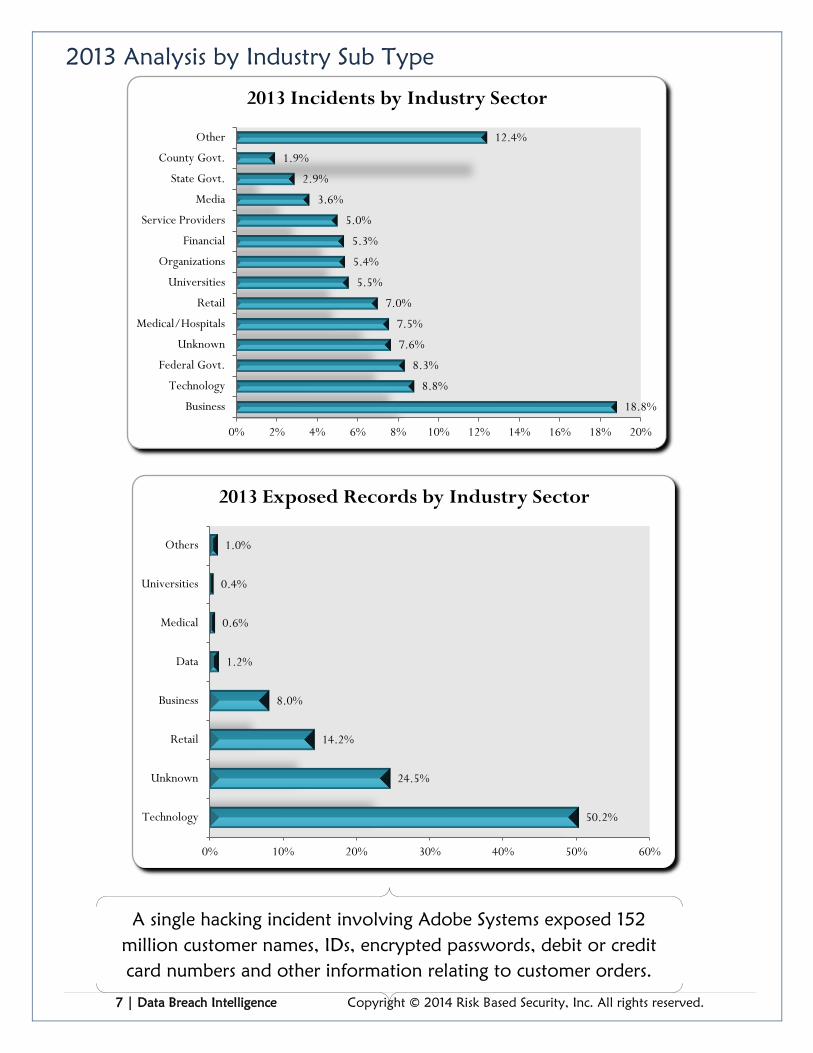
2013 Analysis by Industry Sub Type
18.8%
8.8%
8.3%
7.6%
7.5%
7.0%
5.5%
5.4%
5.3%
5.0%
3.6%
2.9%
1.9%
12.4%
0% 2% 4% 6% 8% 10% 12% 14% 16% 18% 20%
Business
Technology
Federal Govt.
Unknown
Medical/Hospitals
Retail
Universities
Organizations
Financial
Service Providers
Media
State Govt.
County Govt.
Other
2013 Incidents by Industry Sector
50.2%
24.5%
14.2%
8.0%
1.2%
0.6%
0.4%
1.0%
0% 10% 20% 30% 40% 50% 60%
Technology
Unknown
Retail
Business
Data
Medical
Universities
Others
2013 Exposed Records by Industry Sector
A single hacking incident involving Adobe Systems exposed 152
million customer names, IDs, encrypted passwords, debit or credit
card numbers and other information relating to customer orders.
8 | Data Breach Intelligence Copyright © 2014 Risk Based Security, Inc. All rights reserved.
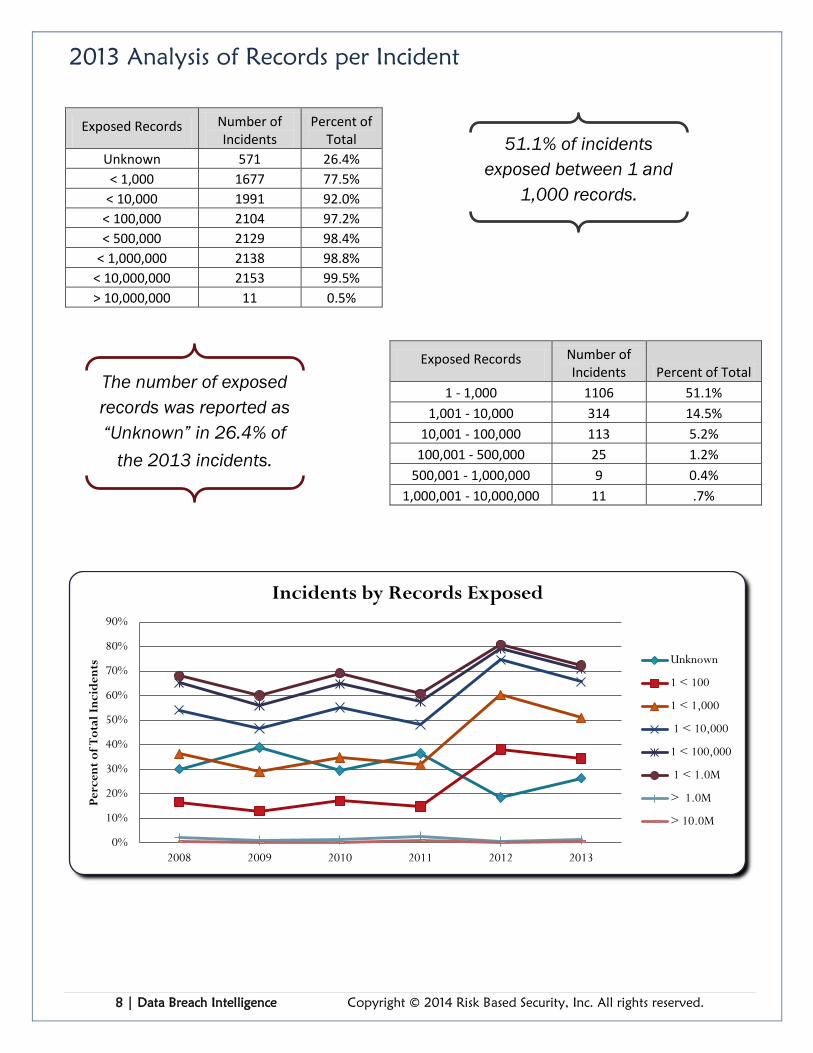
2013 Analysis of Records per Incident
Exposed Records Number of Incidents
Percent of Total
Unknown 571 26.4%
< 1,000 1677 77.5%
< 10,000 1991 92.0%
< 100,000 2104 97.2%
< 500,000 2129 98.4%
< 1,000,000 2138 98.8%
< 10,000,000 2153 99.5%
> 10,000,000 11 0.5%
Exposed Records Number of Incidents Percent of Total
1 - 1,000 1106 51.1%
1,001 - 10,000 314 14.5%
10,001 - 100,000 113 5.2%
100,001 - 500,000 25 1.2%
500,001 - 1,000,000 9 0.4%
1,000,001 - 10,000,000 11 .7%
0%
10%
20%
30%
40%
50%
60%
70%
80%
90%
2008 2009 2010 2011 2012 2013
Pe
rce
nt
of
To
tal
Inc
ide
nts
Incidents by Records Exposed
Unknown
1 < 100
1 < 1,000
1 < 10,000
1 < 100,000
1 < 1.0M
> 1.0M
> 10.0M
51.1% of incidents
exposed between 1 and
1,000 records.
The number of exposed
records was reported as
“Unknown” in 26.4% of
the 2013 incidents.
9 | Data Breach Intelligence Copyright © 2014 Risk Based Security, Inc. All rights reserved.
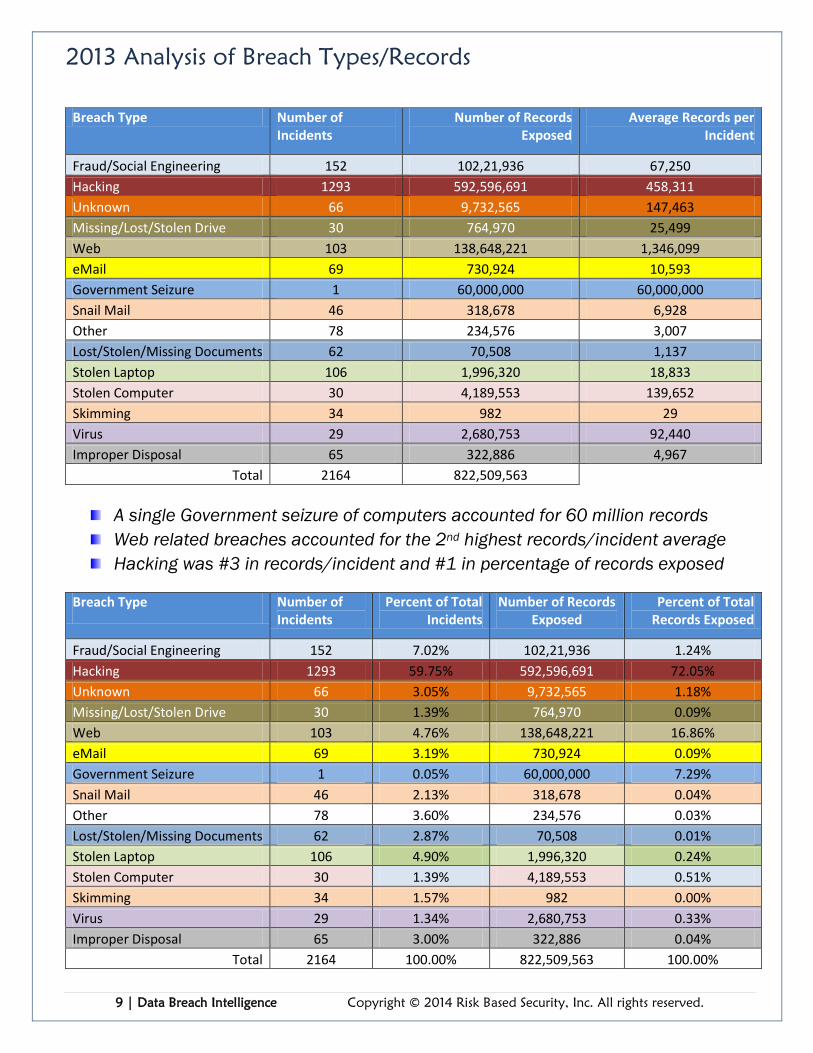
2013 Analysis of Breach Types/Records
Breach Type Number of Incidents
Number of Records Exposed
Average Records per Incident
Fraud/Social Engineering 152 102,21,936 67,250
Hacking 1293 592,596,691 458,311
Unknown 66 9,732,565 147,463
Missing/Lost/Stolen Drive 30 764,970 25,499
Web 103 138,648,221 1,346,099
eMail 69 730,924 10,593
Government Seizure 1 60,000,000 60,000,000
Snail Mail 46 318,678 6,928
Other 78 234,576 3,007
Lost/Stolen/Missing Documents 62 70,508 1,137
Stolen Laptop 106 1,996,320 18,833
Stolen Computer 30 4,189,553 139,652
Skimming 34 982 29
Virus 29 2,680,753 92,440
Improper Disposal 65 322,886 4,967
Total 2164 822,509,563
A single Government seizure of computers accounted for 60 million records
Web related breaches accounted for the 2nd highest records/incident average
Hacking was #3 in records/incident and #1 in percentage of records exposed
Breach Type Number of Incidents
Percent of Total Incidents
Number of Records Exposed
Percent of Total Records Exposed
Fraud/Social Engineering 152 7.02% 102,21,936 1.24%
Hacking 1293 59.75% 592,596,691 72.05%
Unknown 66 3.05% 9,732,565 1.18%
Missing/Lost/Stolen Drive 30 1.39% 764,970 0.09%
Web 103 4.76% 138,648,221 16.86%
eMail 69 3.19% 730,924 0.09%
Government Seizure 1 0.05% 60,000,000 7.29%
Snail Mail 46 2.13% 318,678 0.04%
Other 78 3.60% 234,576 0.03%
Lost/Stolen/Missing Documents 62 2.87% 70,508 0.01%
Stolen Laptop 106 4.90% 1,996,320 0.24%
Stolen Computer 30 1.39% 4,189,553 0.51%
Skimming 34 1.57% 982 0.00%
Virus 29 1.34% 2,680,753 0.33%
Improper Disposal 65 3.00% 322,886 0.04%
Total 2164 100.00% 822,509,563 100.00%
10 | Data Breach Intelligence Copyright © 2014 Risk Based Security, Inc. All rights reserved.
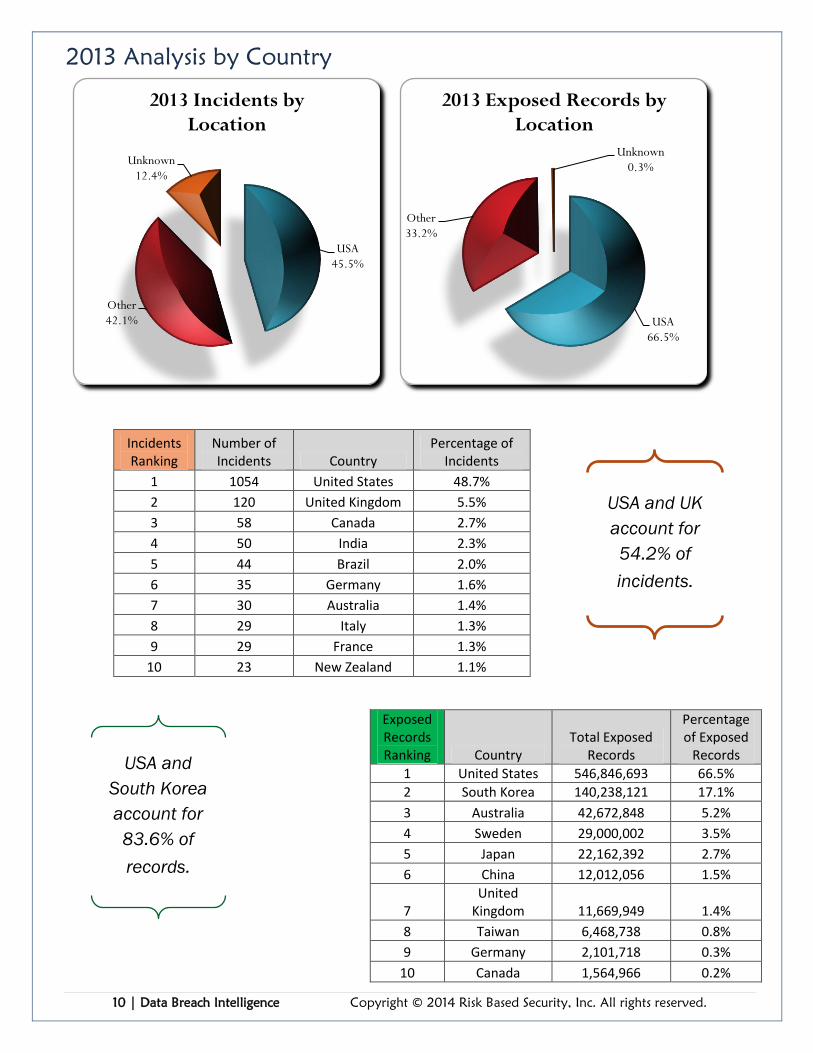
2013 Analysis by Country
Incidents Ranking
Number of Incidents Country
Percentage of Incidents
1 1054 United States 48.7%
2 120 United Kingdom 5.5%
3 58 Canada 2.7%
4 50 India 2.3%
5 44 Brazil 2.0%
6 35 Germany 1.6%
7 30 Australia 1.4%
8 29 Italy 1.3%
9 29 France 1.3%
10 23 New Zealand 1.1%
Exposed Records Ranking Country
Total Exposed Records
Percentage of Exposed
Records
1 United States 546,846,693 66.5%
2 South Korea 140,238,121 17.1%
3 Australia 42,672,848 5.2%
4 Sweden 29,000,002 3.5%
5 Japan 22,162,392 2.7%
6 China 12,012,056 1.5%
7 United
Kingdom 11,669,949 1.4%
8 Taiwan 6,468,738 0.8%
9 Germany 2,101,718 0.3%
10 Canada 1,564,966 0.2%
USA 45.5%
Other 42.1%
Unknown 12.4%
2013 Incidents by Location
USA 66.5%
Other 33.2%
Unknown 0.3%
2013 Exposed Records by Location
USA and UK
account for
54.2% of
incidents.
USA and
South Korea
account for
83.6% of
records.
11 | Data Breach Intelligence Copyright © 2014 Risk Based Security, Inc. All rights reserved.
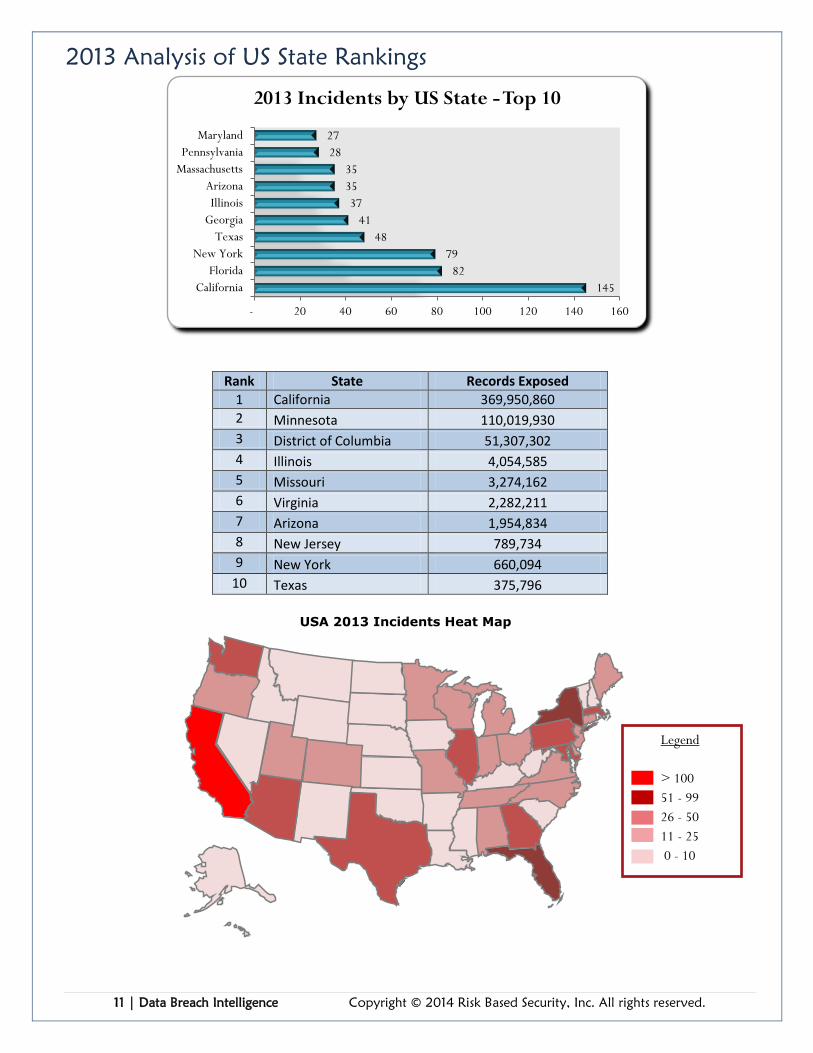
2013 Analysis of US State Rankings
Rank State Records Exposed
1 California 369,950,860
2 Minnesota 110,019,930
3 District of Columbia 51,307,302
4 Illinois 4,054,585
5 Missouri 3,274,162
6 Virginia 2,282,211
7 Arizona 1,954,834
8 New Jersey 789,734
9 New York 660,094
10 Texas 375,796
145
82
79
48
41
37
35
35
28
27
- 20 40 60 80 100 120 140 160
California
Florida
New York
Texas
Georgia
Illinois
Arizona
Massachusetts
Pennsylvania
Maryland
2013 Incidents by US State - Top 10
USA 2013 Incidents Heat Map
Legend
> 100
51 - 99
26 - 50
11 - 25
0 - 10
12 | Data Breach Intelligence Copyright © 2014 Risk Based Security, Inc. All rights reserved.
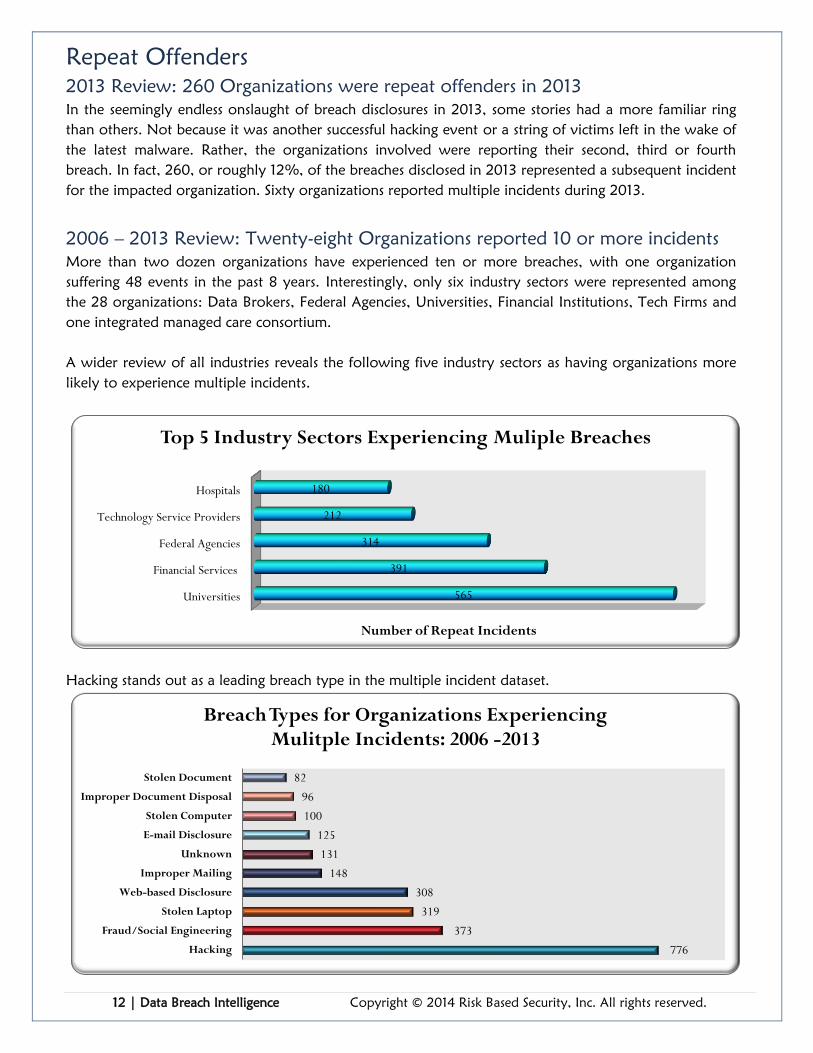
Repeat Offenders
2013 Review: 260 Organizations were repeat offenders in 2013
In the seemingly endless onslaught of breach disclosures in 2013, some stories had a more familiar ring
than others. Not because it was another successful hacking event or a string of victims left in the wake of
the latest malware. Rather, the organizations involved were reporting their second, third or fourth
breach. In fact, 260, or roughly 12%, of the breaches disclosed in 2013 represented a subsequent incident
for the impacted organization. Sixty organizations reported multiple incidents during 2013.
2006 – 2013 Review: Twenty-eight Organizations reported 10 or more incidents
More than two dozen organizations have experienced ten or more breaches, with one organization
suffering 48 events in the past 8 years. Interestingly, only six industry sectors were represented among
the 28 organizations: Data Brokers, Federal Agencies, Universities, Financial Institutions, Tech Firms and
one integrated managed care consortium.
A wider review of all industries reveals the following five industry sectors as having organizations more
likely to experience multiple incidents.
Hacking stands out as a leading breach type in the multiple incident dataset.
Universities
Financial Services
Federal Agencies
Technology Service Providers
Hospitals
565
391
314
212
180
Number of Repeat Incidents
Top 5 Industry Sectors Experiencing Muliple Breaches
776
373
319
308
148
131
125
100
96
82
Hacking
Fraud/Social Engineering
Stolen Laptop
Web-based Disclosure
Improper Mailing
Unknown
E-mail Disclosure
Stolen Computer
Improper Document Disposal
Stolen Document
Breach Types for Organizations Experiencing Mulitple Incidents: 2006 -2013
13 | Data Breach Intelligence Copyright © 2014 Risk Based Security, Inc. All rights reserved.
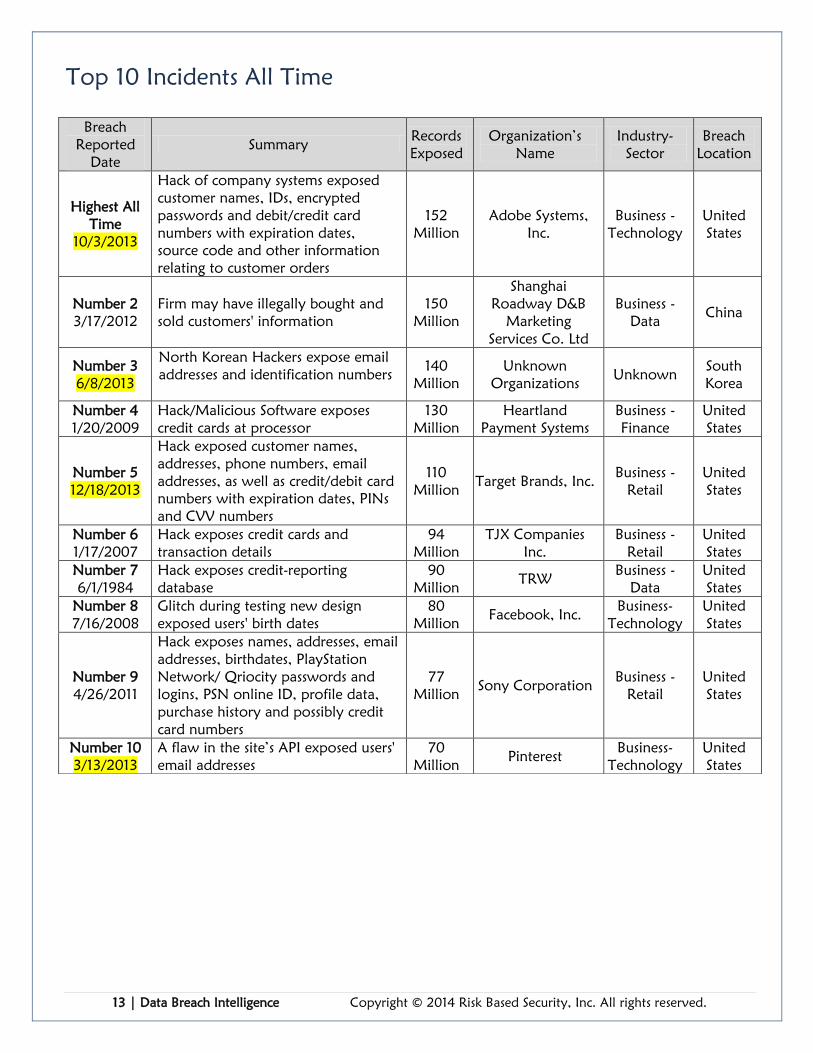
Top 10 Incidents All Time
Breach
Reported
Date
Summary Records
Exposed
Organization’s
Name
Industry-
Sector
Breach
Location
Highest All
Time
10/3/2013
Hack of company systems exposed
customer names, IDs, encrypted
passwords and debit/credit card
numbers with expiration dates,
source code and other information
relating to customer orders
152
Million
Adobe Systems,
Inc.
Business -
Technology
United
States
Number 2
3/17/2012
Firm may have illegally bought and
sold customers' information
150
Million
Shanghai
Roadway D&B
Marketing
Services Co. Ltd
Business -
Data China
Number 3
6/8/2013
North Korean Hackers expose email
addresses and identification numbers
140
Million
Unknown
Organizations Unknown
South
Korea
Number 4
1/20/2009
Hack/Malicious Software exposes
credit cards at processor
130
Million
Heartland
Payment Systems
Business -
Finance
United
States
Number 5
12/18/2013
Hack exposed customer names,
addresses, phone numbers, email
addresses, as well as credit/debit card
numbers with expiration dates, PINs
and CVV numbers
110
Million Target Brands, Inc.
Business -
Retail
United
States
Number 6
1/17/2007
Hack exposes credit cards and
transaction details
94
Million
TJX Companies
Inc.
Business -
Retail
United
States
Number 7
6/1/1984
Hack exposes credit-reporting
database
90
Million TRW
Business -
Data
United
States
Number 8
7/16/2008
Glitch during testing new design
exposed users' birth dates
80
Million Facebook, Inc.
Business-
Technology
United
States
Number 9
4/26/2011
Hack exposes names, addresses, email
addresses, birthdates, PlayStation
Network/ Qriocity passwords and
logins, PSN online ID, profile data,
purchase history and possibly credit
card numbers
77
Million Sony Corporation
Business -
Retail
United
States
Number 10
3/13/2013
A flaw in the site’s API exposed users'
email addresses
70
Million Pinterest
Business-
Technology
United
States
14 | Data Breach Intelligence Copyright © 2014 Risk Based Security, Inc. All rights reserved.
Methodology & Terms
Risk Based Security’s proprietary application crawls the Internet 24x7 to capture and aggregate data breach
incidents for our researchers to analyze. In addition, our researchers, in partnership with the Open Security
Foundation, manually scour news feeds, blogs, and other websites looking for new data breaches as well as
past breaches that requiring updating. The database also includes information obtained through Freedom of
Information Act (FOIA) requests to obtain breach notification documents as a result of state notification
legislation.
Definitions: Primary Industry types/sectors are reported as Business, Educational, Government, Medical and
Unknown.
Each primary industry/sector is further defined by one of the following subtypes: Retail, Financial,
Technology, Medical (Non-Hospital and non Medical Provider), Federal Government, Data
Services/Brokerage, Media, University, Industry, State Government, Not-For-Profit, County Government,
Organization, Hospital, High School, Insurance, City Government, Hotel, Legal, Elementary School,
Educational, Business, Government, Service Provider, and Agriculture.
Data Types: Name, Address, Date of Birth, Email, User Name, Password, Social Security Number, Credit
Card or Debit Card Number, Medical Information, Financial Information, Account Information, Phone
Numbers, Intellectual Property, and Unknown.
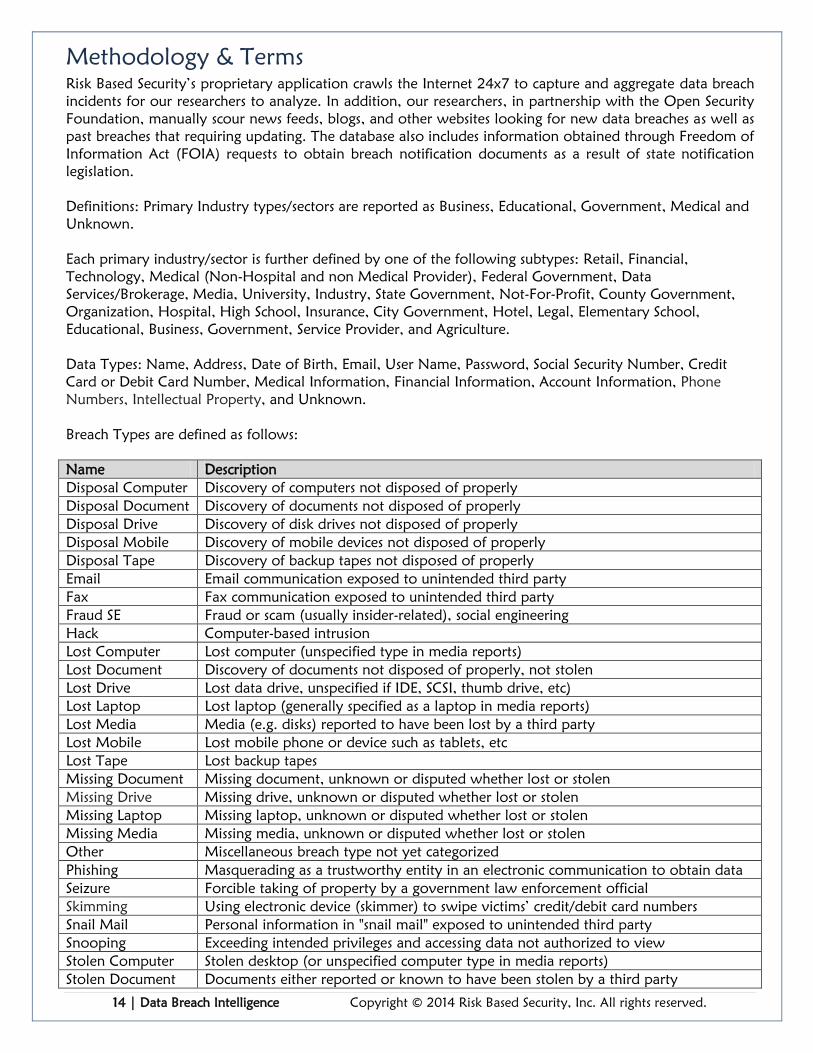
Breach Types are defined as follows:
Name Description
Disposal Computer Discovery of computers not disposed of properly
Disposal Document Discovery of documents not disposed of properly
Disposal Drive Discovery of disk drives not disposed of properly
Disposal Mobile Discovery of mobile devices not disposed of properly
Disposal Tape Discovery of backup tapes not disposed of properly
Email Email communication exposed to unintended third party
Fax Fax communication exposed to unintended third party
Fraud SE Fraud or scam (usually insider-related), social engineering
Hack Computer-based intrusion
Lost Computer Lost computer (unspecified type in media reports)
Lost Document Discovery of documents not disposed of properly, not stolen
Lost Drive Lost data drive, unspecified if IDE, SCSI, thumb drive, etc)
Lost Laptop Lost laptop (generally specified as a laptop in media reports)
Lost Media Media (e.g. disks) reported to have been lost by a third party
Lost Mobile Lost mobile phone or device such as tablets, etc
Lost Tape Lost backup tapes
Missing Document Missing document, unknown or disputed whether lost or stolen
Missing Drive Missing drive, unknown or disputed whether lost or stolen
Missing Laptop Missing laptop, unknown or disputed whether lost or stolen
Missing Media Missing media, unknown or disputed whether lost or stolen
Other Miscellaneous breach type not yet categorized
Phishing Masquerading as a trustworthy entity in an electronic communication to obtain data
Seizure Forcible taking of property by a government law enforcement official
Skimming Using electronic device (skimmer) to swipe victims’ credit/debit card numbers
Snail Mail Personal information in "snail mail" exposed to unintended third party
Snooping Exceeding intended privileges and accessing data not authorized to view
Stolen Computer Stolen desktop (or unspecified computer type in media reports)
Stolen Document Documents either reported or known to have been stolen by a third party
15 | Data Breach Intelligence Copyright © 2014 Risk Based Security, Inc. All rights reserved.
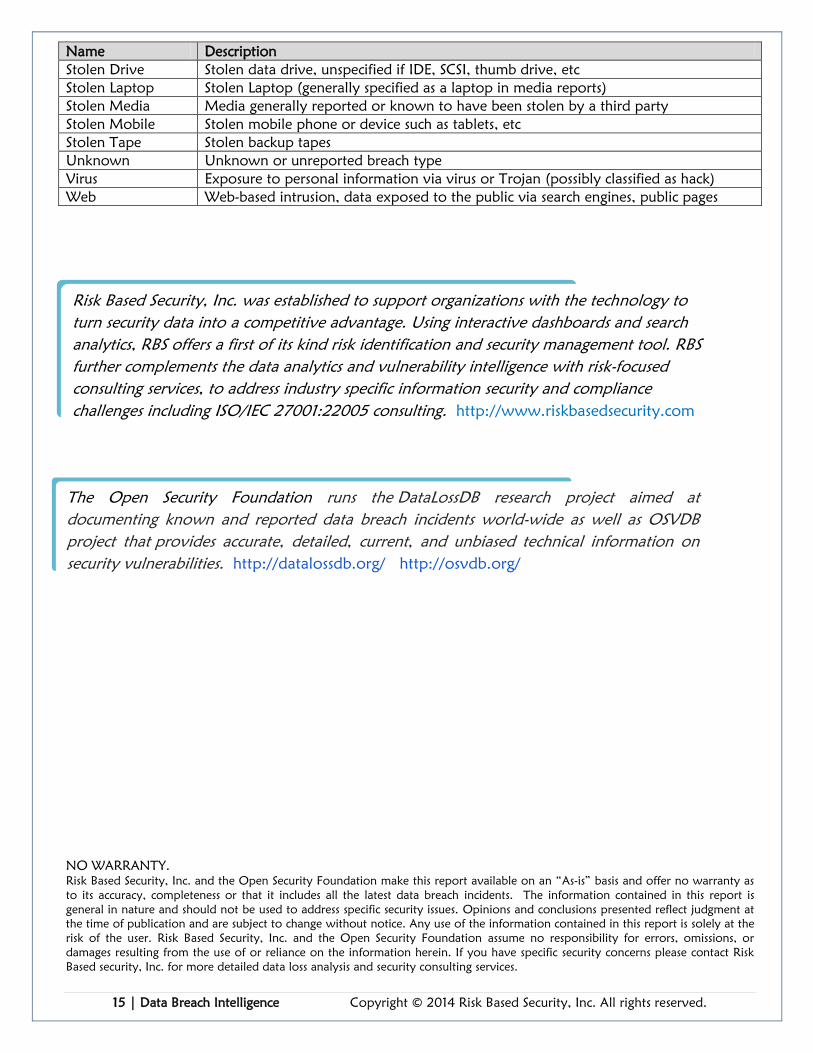
Name Description
Stolen Drive Stolen data drive, unspecified if IDE, SCSI, thumb drive, etc
Stolen Laptop Stolen Laptop (generally specified as a laptop in media reports)
Stolen Media Media generally reported or known to have been stolen by a third party
Stolen Mobile Stolen mobile phone or device such as tablets, etc
Stolen Tape Stolen backup tapes
Unknown Unknown or unreported breach type
Virus Exposure to personal information via virus or Trojan (possibly classified as hack)
Web Web-based intrusion, data exposed to the public via search engines, public pages
NO WARRANTY.
Risk Based Security, Inc. and the Open Security Foundation make this report available on an “As-is” basis and offer no warranty as
to its accuracy, completeness or that it includes all the latest data breach incidents. The information contained in this report is
general in nature and should not be used to address specific security issues. Opinions and conclusions presented reflect judgment at
the time of publication and are subject to change without notice. Any use of the information contained in this report is solely at the
risk of the user. Risk Based Security, Inc. and the Open Security Foundation assume no responsibility for errors, omissions, or
damages resulting from the use of or reliance on the information herein. If you have specific security concerns please contact Risk
Based security, Inc. for more detailed data loss analysis and security consulting services.
Risk Based Security, Inc. was established to support organizations with the technology to
turn security data into a competitive advantage. Using interactive dashboards and search
analytics, RBS offers a first of its kind risk identification and security management tool. RBS
further complements the data analytics and vulnerability intelligence with risk-focused
consulting services, to address industry specific information security and compliance
challenges including ISO/IEC 27001:22005 consulting. http://www.riskbasedsecurity.com
The Open Security Foundation runs the DataLossDB research project aimed at
documenting known and reported data breach incidents world-wide as well as OSVDB
project that provides accurate, detailed, current, and unbiased technical information on
security vulnerabilities. http://datalossdb.org/ http://osvdb.org/
http://osvdb.org/
http://www.opensecurityfoundation.org