data bus diagnostic tool user guide - general motors€¦ · technical information based on factory...
TRANSCRIPT

Data Bus Diagnostic Tool User Guide
1
Data Bus Diagnostic Tool User Guide
© 2014 GM Customer Care and Aftersales
Made in the U.S.A. All rights reserved.
Data Bus Diagnostic Tool User Guide
2
Table of Contents
Table of Contents ............................................................................................................... 2
Introduction ........................................................................................................................ 3
Customer Support Overview............................................................................................... 4
Important PC Hardware Guidelines .................................................................................... 5
Installation .......................................................................................................................... 8
Getting Started ................................................................................................................... 9
Detected State Tab .......................................................................................................... 13
Intermittent Faults ............................................................................................................. 17
Measured Voltage Tab ..................................................................................................... 19
Message Monitor Tab ....................................................................................................... 23
Troubleshooting ................................................................................................................ 25
Feedback ......................................................................................................................... 26

Data Bus Diagnostic Tool User Guide
3
Introduction
The Data Bus Diagnostic Tool User Guide provides a quick reference and overview of the Data Bus Diagnostic Tool (DBDT) system.
Everything contained in this manual is based on the latest production information available at the time of publication. The right is reserved to make changes at any time without notice.
No part of this publication may be reproduced, stored in any retrieval system, or transmitted in any form by any means, including but not limited to electronic, mechanical, photocopying, recording, or otherwise, without the prior written permission of GM Customer Care and Aftersales. This includes all text tables, illustrations and charts.

Data Bus Diagnostic Tool User Guide
4
Customer Support Overview
To obtain assistance with your TIS software, contact the ACDelco Aftermarket Support Center.
Before Calling
Before making a call for ACDelco Aftermarket support, be sure to have the following information ready:
• Business name, address, ACDelco TDS Login ID, and the technician’s Telephone number
• Tell when the problem occurred
• List any error messages
• Give vehicle entry information
Making the Call
The ACDelco Aftermarket Support Center telephone lines operate from 8:00 AM to 8:00 PM (Eastern Standard Time) Monday through Friday.
In the United States and Canada to contact Customer Support, dial:
1-888-212-8959

Data Bus Diagnostic Tool User Guide
5
Important PC Hardware Guidelines
ACDelco provides IT guidelines to help users have a seamless experience when using TIS2Web software applications. To avoid unnecessary compliance issues with TIS2Web, please review and adhere to the stated infrastructure guidelines at the following link: http://www.gmdesolutions.com/services/standards.php
These guidelines for GM Dealers also apply to independent users, Professional Service Centers and Key Fleets using ACDelco Aftermarket subscriptions. For questions on these guidelines, contact 888-212-8959, prompt #2.

Data Bus Diagnostic Tool User Guide
6
General Information
Data Bus Diagnostic Tool Intended Use
The Data Bus Diagnostic Tool is designed for use by trained service personnel to specifically diagnose and repair Data Bus Diagnostic Communications and connecting hardware systems. Every attempt has been made to provide complete and accurate technical information based on factory service information at the time of publication. However, the right is reserved to make changes at any time without notice.
To familiarize yourself with the Data Bus Diagnostic Tool and its capability, and how to use it, please read through the User Guide before putting the Data Bus Diagnostic Tool to use.
Application Scope
This application will assist to diagnose a single wire or 2 wire serial data circuit.
This application is intended to:
Determine what modules are on the serial data circuit, which will help locate an open/high resistance circuit fault.
Determine the physical serial data circuit’s current state (OK, short to voltage, short to ground, open circuit condition, etc.).
Provide a mechanism for passively monitoring Low Speed messages, which may help diagnose battery drain problems.
What is a CAN Bus/Data Bus and how does it work?
A CAN Bus is a Controller Area Network. This is also referred to as a Data Bus which is a two wire vehicle communication network. Bus in itself is an electrical term used to define connections electricity travels through. Serial Data (Message based protocol) is sent down the wires for a fast exchange of information between vehicle control modules. It is exactly what you see when you look at a vehicle control module schematic. Communications go out from module to module and modules return communication. In most all vehicles, it is not a circular Bus route but one that goes out and comes back on the same wires. Interruptions on the Data Bus can be faults, open circuits or grounds preventing the vehicle from functioning as designed.
The Data Bus Diagnostic Tool becomes a smart module in the vehicle Data Bus communications that you control. It inquires how modules, connectors, and wires are working or not working and in conjunction with vehicle schematics, allows the technician to locate areas to investigate.

Data Bus Diagnostic Tool User Guide
7
The Data Bus Capabilities
The Vehicle Data Bus can be analyzed through the interactive use of the MDI / M-VCI, Service Information Schematics, and Vehicle Control Modules.
Use available features in the MDI / M-VCI through the DLC connector to verify Data Bus Connections, and verify a fault is present and attempt to identify (ie open, short, etc).
Identify a diagnostic starting point. Identifying control modules that actively communicate and in conjunction with vehicle schematics identify control modules that are not communicating to define a starting point for repair.
Support all GM developed vehicles equipped with one or more CAN Bus.
The Data Bus Diagnostic Tool does not diagnose individual sensors or vehicle components, it only analyzes serial data communication between vehicle control modules

Data Bus Diagnostic Tool User Guide
8
Installation
The Data Bus Diagnostic Tool installs when GDS2 is launched from TIS2Web. See the GDS2 User Guide for Installation of GDS2.
Uninstallation of the Data Bus Diagnostic Tool
The Data Bus Diagnostic Tool can be uninstalled by using the following steps:
For Windows 7
“Start” (Windows 7 Logo) — Control Panel — Programs and Features — Right click on “Data Bus Diagnostic Tool” and select “Uninstall” from the drop down menu.

Data Bus Diagnostic Tool User Guide
9
Getting Started
Starting the Data Bus Diagnostic Tool
After following the initial Installation procedure, The Data Bus Diagnostic Tool can be started using the desktop short cut installed with GDS2.
The Data Bus Diagnostic Tool may also be started through the Windows Start menu by selecting Start and typing “Data Bus Diagnostic Tool” in the Search Programs and files option. The option is also available by navigating to the General Motors folder, followed by Data Bus Diagnostic Tool Folder.
The first time a session is started, a Language Selection menu will appear. Make an appropriate selection.
Getting familiar with the Data Bus Diagnostic Tool

Data Bus Diagnostic Tool User Guide
10
Testing options and Controls Description
The Data Bus Diagnostic Tool has three navigation tabs.
1. The Detected State tab (1) shows the current state of the Electrical Bus and is used to diagnose Bus conditions. It actively queries control modules and lists what control modules are responding. It also identifies the state of the selected Bus (ie OK, CAN LO Open, etc.).
2. The Measured Voltage tab (2) displays a data stream shown as a voltage graph/trace reading on the screen. The activity on the Bus may be analyzed to determine the nature of Bus conditions. Patterns on the graph may indicate fault or ground conditions.
3. The Message Monitor tab (3) is primarily to identify voltage drain through the analysis of active control modules during a power off state (possibly overnight in duration to simulate customer conditions). It can identify active control modules when vehicle modules should not be actively communicating.
Control Selections
The Control Selections allow for a variety of functions which are listed below.
Data Circuit (1) — This selection allows the technician to select the Data Circuit Bus to be tested in accordance to the DLC pin designation.

Data Bus Diagnostic Tool User Guide
11
Baud Rate (2) — This selection sets the communication rate of serial data characters in correlation with vehicle capability.
The Start/Stop Icon has three status colors which denote the Data Bus Diagnostic Tool availability.
Start/Stop Icon (3) — Displays the state of the Data Bus Diagnostics.
Green Selection — is used to start a test and has a Start icon on it.
Red Selection — is used to stop a test and has an “X” in it.
Grey Selection — lease has expired, you will be unable to run software. Renew the release to activate the software.
Eraser Icon (4) — Click on the eraser to reset the test and erase collected data.
Minus Magnifying Glass (5) — Click on the Minus Magnifying Glass to decrease the size of the text.
Plus Magnifying Glass (6) — Click on the Plus Magnifying Glass to increase the size of the text.
Mute/Unmute Icon (7) — Click on the Speaker icon to turn the sound ON or OFF. This selection will be disabled if the sound is not active. This selection is ONLY available when using the “Detected State” tab.
Settings Icon (8) — Click on Settings icon to select for the application to “Beep on Faults” or to “Beep on OK”.
Help (9) — Click on Help to obtain information on the Data Bus Diagnostics Tool.
Battery Voltage Icon (10) — This item displays current vehicle battery voltage as measured at the DLC. If battery voltage goes below 11.5 volts, connect a battery charger to vehicle battery to maintain operation of software.
Prior to using the Data Bus Diagnostic Tool
It is important to observe the following precautions:
Important: Detailed information regarding Diagnostics is contained in Product Training and GM Service Manuals, please refer to these documents for the most recent information.
Caution:
To help avoid vehicle module damage, only use current versions of MDI / M-
VCI software. The GDS2 and Multiple Diagnostic Interface (MDI) or M-VCI must have the latest software. Failure to update the device with the latest software may result in misdiagnosis of vehicle.

Data Bus Diagnostic Tool User Guide
12
Make sure the vehicle battery is fully charged. Battery voltage for GDS2 and MDI / M-VCI should be between 12–14 volts for a 12-volt vehicle. Due to the time requirements of diagnosing a controller, install EL-49642 SPS Programming Support Tool (North American Usage) or CX Pro 25/CX Pro 50 (European Usage – distributed by SPX) to maintain system voltage. Stable battery voltage is critical during programming. Any fluctuation, spiking, over voltage or loss of voltage will interrupt programming.
If SPS Programming Support Tool EL-49642 or CX Pro 25/CX Pro 50 is not available, DO NOT connect a regular battery charger. Connect a fully charged 12V jumper or booster pack disconnected from AC voltage supply.
Make sure the cable connections are secured.
In using a laptop computer/other display device for GDS2, ensure that the power supply is properly connected. If powered by an AC power cord, ensure computer is receiving power. If the laptop is operating from its internal power source (battery), then make sure it is adequately charged to utilize the GDS2 program.
Important: In order to reduce the potential for signal loss, the MDI / M-VCI should be configured for the most stable communication option at your location. You can choose from USB, Ethernet, or Wireless Ethernet.

Data Bus Diagnostic Tool User Guide
13
Detected State Tab
Detected State Testing
How it Works
The Data Bus Diagnostic Tool connects to the vehicle DLC Connector and acts as an external module that sends messages to the modules on the selected Data Bus to determine which modules are able to communicate. This will help locate a fault. The Data Bus Diagnostic Tool also performs statistical analysis on the selected Data Bus voltage in order to identify if there are any faults with the vehicle wiring (ie opens, shorts etc.).
Setting the Data Circuit
Data Circuit — The Data Circuit input at the top of the screen determines which Data Circuit Bus on the DLC the tool will test.
The first step to using the Detected State tab is to select a Data Circuit. To do this, select the drop down arrow on the Data Circuit input selection to reveal the options.
Detected and Previous State
Detected State (1) — This is the current detected state of the Bus.

Data Bus Diagnostic Tool User Guide
14
Previous State (2) — This is the prior 3 detected states (if available) from 3 previous Start/Stop events. Faults have been simulated on this screen to show potential previous events.
Responded
Responded (3) — A Green check mark indicates that the module responded to the most recent request made by the Data Bus Diagnostic Tool. If a check mark is not present the module has responded at some point in the test, but not to the most recent inquiry.
Longest Response Time
Longest Response Time (4) — The time displayed here is the longest time gap between responses to a sent test message. This provides a history for possible intermittent faults.
Control Module
Control Module (5) — The Control Module name. Modules will not be listed unless the module responds at least once. It is important to compare this list of control modules to the vehicle schematic to determine modules that are not responding.
How to Run a Detected State test
The Detected State tab will record what is specifically taking place in the vehicle’s Bus.
A dual wire Bus will receive a Detected State response of OK, if the Bus is functioning properly. There is one exception, sometimes double open faults are detected as OK. If this occurs there will be Control Modules missing when compared against the vehicle schematic. If the Bus is not functioning properly, a notation in the Detected State output will note the condition, reference #2 above, will be displayed in red. Intermittent states will not be diagnosed, if they don’t present themselves. Consider a wiggle test.
To Begin a Test:
Turn the vehicle ignition Key ON.
Select a Data Circuit.
Select the Green Start/Stop selection with the Start icon to begin the test.
Allow several minutes to transpire to allow all modules a chance to respond to the Detected State inquiry.
Review the Control Module names to the right and using the Bus schematic, check off the control module names that are documented on the screen. Remaining modules on the schematic have not been able to communicate.
Data Bus Diagnostic Tool User Guide
15
Select the Red Start/Stop selection with the “X” to end the test. You may select the Green Start/Stop selection again to start a new test as many times as needed.
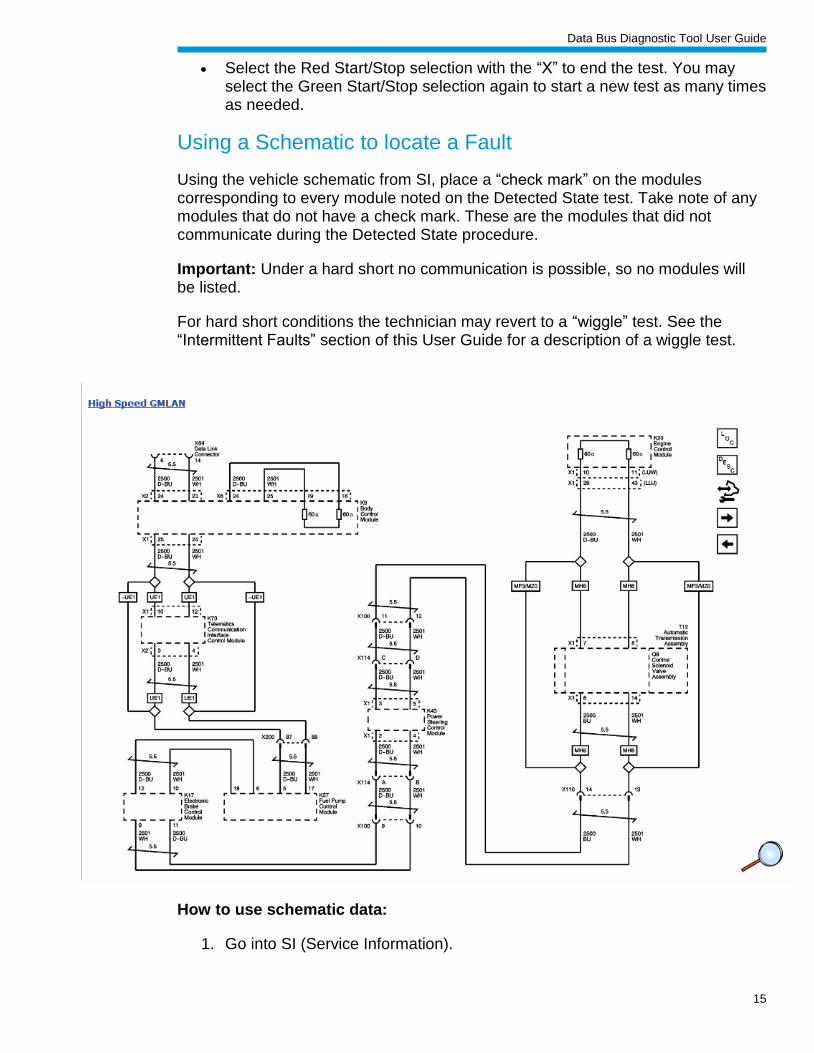
Using a Schematic to locate a Fault
Using the vehicle schematic from SI, place a “check mark” on the modules corresponding to every module noted on the Detected State test. Take note of any modules that do not have a check mark. These are the modules that did not communicate during the Detected State procedure.
Important: Under a hard short no communication is possible, so no modules will be listed.
For hard short conditions the technician may revert to a “wiggle” test. See the “Intermittent Faults” section of this User Guide for a description of a wiggle test.
How to use schematic data:
1. Go into SI (Service Information).

Data Bus Diagnostic Tool User Guide
16
2. Enter vehicle selection criteria.
3. Enter vehicle schematic and verify data circuit.
4. Check off ECU’s on the schematic that are listed on the Detected State test under the Control Module listing.
5. Start by searching in the area on the vehicle after the last responding module on the tool and the first module not responding on the schematic.
6. The problem in many cases can be fixed by looking at the connectors and harness.
Important: The localization of a fault is not possible if the Bus is shorted (short to battery/ground, the speaker, a sensor wire, etc.), since no communication is possible.
Note: Compare vehicle RPO tag to confirm modules not responding on the schematic are present RPO modules on the vehicle.
Note: On the Screen above, SI may identify the same module with a different name then the Data Bus Diagnostic Tool, as a result all the names of possible components are provided on the Data Bus Diagnostic Tool, example: K71 Transmission Control Module, T12 Automatic Transmission Assembly, and Q8 Control Solenoid Valve Assembly, have a single check mark. You will need to check the vehicle schematic to see which component of the three is present.
Characteristics of Detecting Modules
If a Bus has a break point in communication, some modules on the “good” side of the faulted bus will respond very intermittently. Maybe once every 300 seconds as opposed to once every 10 seconds. When diagnosing intermittent faults, it is important to pay attention to the Control Module with the Longest Response Time and use the schematic. Longest Response Time will not help with very brief faults, since all modules will not respond for a period of time when the Bus’s physical condition changes.
Some modules on a non-faulted bus will respond intermittently to diagnostic requests, if the requests are received on a link that the module does not typically use for diagnostics. For example:
The Body Control Module on a 2014 Corvette will not respond to 9 plus request in a row on a single wire, even on a good bus, but responds perfectly on pins 6/14.
Some modules will not respond to all requests on the same bus.
A Green check mark may display a rapidly flashing appearance on some modules, this is a normal response on some modules and can be ignored.

Data Bus Diagnostic Tool User Guide
17
Intermittent Faults
Techniques for identifying Intermittent Faults
Using the Detected State Tab
Concentrate on the Longest Response Time (1).
The Longest Response Time column tracks the amount of time it takes for a module to respond to a request, the longest delay will be displayed. Focus on Control Modules with the longest times.
Control Modules who have responded with short response times may be on the “Good” side of the Bus while Control Modules with the longest response times are more likely to be on the faulted side of an intermittent Bus. Investigate the Longest Response Times.
If the application is started on a faulted Bus and a module responds mid-way through the test, it will appear with a high Longest Response Time, look for this characteristic.
Wiggling the suspect harness can be used to help detect loose and poorly seated connector terminals, bad wire crimps, insulation problems, etc. Use the Beep Settings to help with this detection.

Data Bus Diagnostic Tool User Guide
18
Beep Selection
By selecting the settings function, an audio beep can be toggled to beep continuously when a fault is detected or when the Bus appears electrically OK. This application reacts rapidly to Bus changes.
Activate the “Beep” function by:
Unmute your PC speakers and adjust the volume so Beeps can be readily heard.
Unmute the application by selecting the speaker icon.
Click on Settings icon.
Select “Beep on OK” or “Beep on Faults””
There are two different beep strategies:
In the case where a continual faulted Bus is present, select “Beep on OK” so that the application stops beeping when the Bus is fixed.
In the case where a suspected intermittent Bus fault may be present, select “Beep on Faults” so that the application will beep when the fault presents itself.

Data Bus Diagnostic Tool User Guide
19
Measured Voltage Tab
Measured Voltage Testing
How Measured Voltage Works
The Measured Voltage tab provides a low frequency voltage trace that measures voltage on two pins of a CAN (Controller Area Network) Bus. By recognizing the voltage trace range or signature of a “Good” Bus, a technician may identify a bad Bus condition. The bad Bus voltage trace signature may further be analyzed to identify a ground or a fault condition. The voltage trace may be analyzed by the technician to confirm the output from the Detected State tab.
Measured Voltage Definitions
The Graph information on the Measured Voltage tab can be Stopped or Frozen by selecting “Start/Stop”. Current values for the terminals under test (1) are displayed at the top of the graph.
Up Arrow (2) — Moves the graph up.
Plus (3) — Zooms in the graph.
Minus (4) — Zooms out the graph.
Down Arrow (5) — Moves the graph down.

Data Bus Diagnostic Tool User Guide
20
Gauge (6) — Displays the maximum, minimum, current and average over the last 20 samples (6).
The Speaker function is not active from this tab and has an “X” through it. No beeping will occur with this function.
How to Use Measured Voltage
The primary use of Measured Voltage is to provide the technician with the ability to view low frequency voltage trace data. Identifying faults is difficult using Measured Voltage and it is more of a tab that supports the Detected State tab then a stand alone tool. Voltage patterns that are normal will vary from vehicle to vehicle. Faulted voltage patterns may have a more irregular pattern. Become familiar with voltage patterns and use the examples provided here for future reference.
To Begin a Test:
Turn the vehicle ignition Key ON.
Select the Green Start/Stop selection with the Start Icon to begin the test.
View the Measured Voltage Graph and examine the CAN HI in Red and CAN LOW in Blue for inconsistencies as displayed in examples provided in this document.
Select the Red Start/Stop with the "X” to freeze or stop the test as needed.
Power Fault vs Ground Fault
How to interpret the Measured Voltage Screen
The graph as displayed at the top of the page is a “Good” Bus voltage frequency.

Data Bus Diagnostic Tool User Guide
21
Open Fault
Slight Negative offset.
Tend to stay around 2300 mV or more.

Data Bus Diagnostic Tool User Guide
22
Ground Offset
Slight positive offset.
Greater swings in bus voltage.
Data Bus Diagnostic Tool User Guide
23
Message Monitor Tab
Message Monitor Test
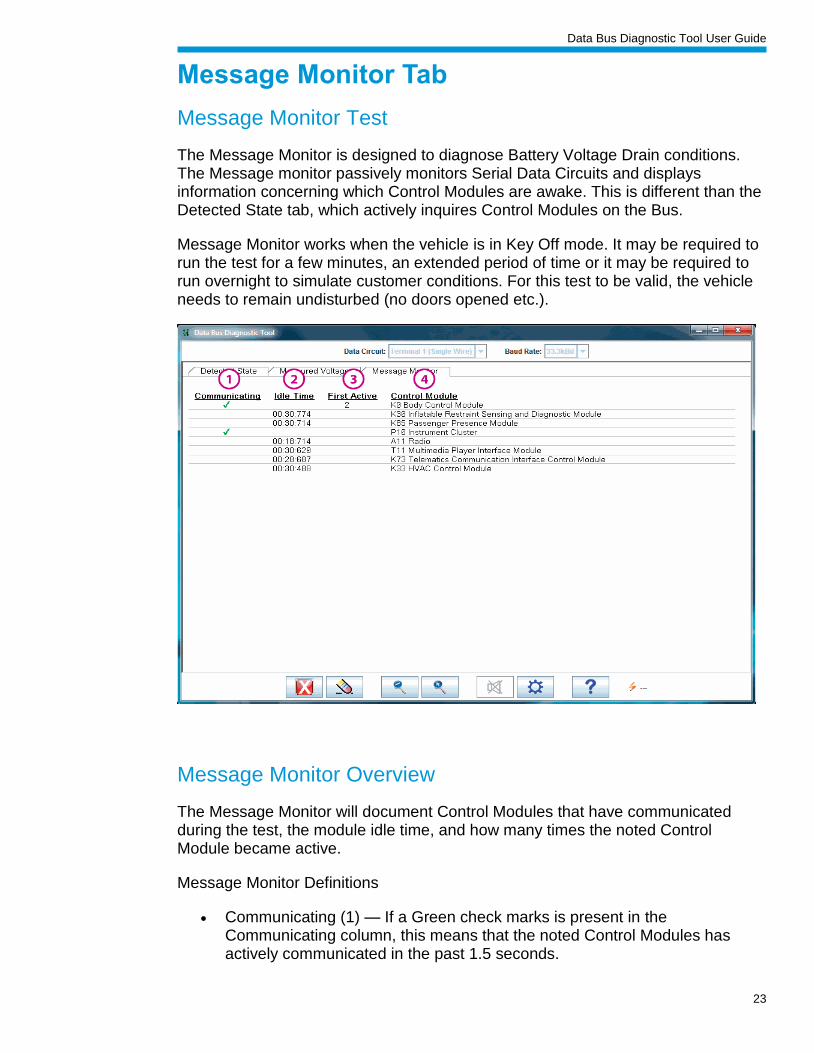
The Message Monitor is designed to diagnose Battery Voltage Drain conditions. The Message monitor passively monitors Serial Data Circuits and displays information concerning which Control Modules are awake. This is different than the Detected State tab, which actively inquires Control Modules on the Bus.
Message Monitor works when the vehicle is in Key Off mode. It may be required to run the test for a few minutes, an extended period of time or it may be required to run overnight to simulate customer conditions. For this test to be valid, the vehicle needs to remain undisturbed (no doors opened etc.).
Message Monitor Overview
The Message Monitor will document Control Modules that have communicated during the test, the module idle time, and how many times the noted Control Module became active.
Message Monitor Definitions
Communicating (1) — If a Green check marks is present in the Communicating column, this means that the noted Control Modules has actively communicated in the past 1.5 seconds.

Data Bus Diagnostic Tool User Guide
24
Idle Time (2) — Displays how long it has been since the Control Module’s most recent communication, if more than 1.5 seconds have elapsed since that Control Module’s last message.
First Active (3) — Counts the number of times each module was the first to communicate. The vehicle will go to sleep after 30 seconds under normal operating conditions, if the same Control Module awakens the vehicle again the count will be 2. If a different Module is the first to awake the vehicle, it will start with a count of 1.
Control Module (4) — The corresponding Control Module’s name.
The Message Monitor will clearly document unintended vehicle Control Module activity.
How to Run a Message Monitor Test
Insure the ignition is in the Key OFF position.
Select the Data Circuit — (Terminal 1 Single Wire).
Select the Green Start/Stop selection with the Start icon on it.
Allow the vehicle to sit undisturbed for a predetermined amount of time.
When complete select the Red Start/Stop selection with the “X” on it.
Analyze the Data.
Under normal conditions the screen should not have any data displayed after the test. Under abnormal conditions, data will be displayed.

Data Bus Diagnostic Tool User Guide
25
Troubleshooting
Detected errors may be resolved using the following chart
Error and Warning Text This Message is displayed when
Could not connect to Vehicle Communication Interface.
The application can’t establish or loses its connection to the MDI / M-VCI.
Could not load DLL. Is the Vehicle Communication Interface software Installed?
The application could not load it JNI layer and/or the MDI / M-VCI’s dll.
No Valid lease found. Launch GDS2 through TIS2Web to renew.
The TIS lease has expired.
The Baud Rate must be specified. Selecting the wrong baud rate may set U-codes. It is suggested to record all DTC’s prior to starting this test.
When terminals 3, 11 are selected, the Data Bus may run at a different Baud Rate dependant on the vehicle. So it is necessary for the user to select a Baud Rate. Choosing the wrong Baud Rate won’t break anything, but it will set U-Codes.
This vehicle is not supported. The application is in message monitor mode and is only detecting messages with 11 bit CAN IDs.
Unknown Control Module ID: $xx will sometimes be displayed under the Control Module headings. This occurs when a Control Module identifies itself with an identifier that does not yet exist in the tool’s definition of module ID’s.

Data Bus Diagnostic Tool User Guide
26
Feedback General Motors and Customer Care and Aftersales are committed to deliver software and hardware solutions that exceed your requirements. To assist us in helping you, please contact your local Customer Support Center with exact conditions, detailed suggestions, comments, or errors. We earn customers for life.