data collection survey on coffee growing and …data collection survey on coffee growing and...
TRANSCRIPT
Data collection Survey on Coffee Growing and
Marketing in the Republic of Rwanda
July 2014
Japan International Cooperation Agency (JICA)
Africa Department
6R
JR
14-011

Table of Contents
Map ............................................................................................................................................................................................ 6
List of Abbreviations ................................................................................................................................................................. 7
Chapter 1 Overview of Survey .......................................................................................................................................... 1
1-1. Background to Dispatch of Survey Team..................................................................................................................... 1
1-2. Description of Survey .................................................................................................................................................. 1
1-3. Survey team members .................................................................................................................................................. 2
1-4. Survey schedule ........................................................................................................................................................... 2
Chapter 2 Coffee Policy, Plans and Administration .............................................................................................................. 3
2-1. Policy and plans ........................................................................................................................................................... 3
2-2. Administrative systems related to coffee industry ....................................................................................................... 5
Chapter 3 Distribution ....................................................................................................................................................... 7
3-1. Distribution trends for coffee grown in Rwanda .......................................................................................................... 7
3-2. Distribution from harvesting through export ............................................................................................................... 9
3-2-1. Distribution of cherries for FWC: from farmers to washing station ................................................................... 10
3-2-2. Distribution of parchment processed as FWC: from washing station to secondary processors and exporters ... 16
3-2-3. Distribution of parchment processed as SWC: from washing station to secondary processors and exporters ... 18
3-2-4. Distribution of FWC and SWC: Export overseas ............................................................................................... 19
3-3. Distribution ................................................................................................................................................................ 24
3-4. Domestic market ........................................................................................................................................................ 26
3-5. Government initiatives related to distribution ............................................................................................................ 30
Chapter 4 Production ....................................................................................................................................................... 32
4-1. Cultivation .................................................................................................................................................................. 32
4-2. Selection ..................................................................................................................................................................... 37
Chapter 5 Quality standards ............................................................................................................................................... 41
5-1. Quality standards for coffee in major producing countries ........................................................................................ 41
5-1-1. Mainstream coffee ............................................................................................................................................... 41
5-1-2. Specialty coffee ................................................................................................................................................... 43
5-2. Current conditions of quality standards for Rwandan coffee ..................................................................................... 43

5-2-1. Fully-washed coffee (coffee processed at washing stations) .............................................................................. 44
5-2-2. Semi-washed coffee (coffee processed by individual small-scale farmers) ........................................................ 44
5-2-3. Indicators for ratings ........................................................................................................................................... 44
5-2-4. Problems with current quality standards ............................................................................................................. 45
5-3. Developing quality standards for coffee in the future in Rwanda .............................................................................. 45
5-4. Other .......................................................................................................................................................................... 46
Supplementary materials ......................................................................................................................................................... 48
I. Survey of coffee farmers’ current conditions .................................................................................................................. 49
II. Reference works ............................................................................................................................................................ 56
List of Tables
Table 2-1: NAEB’s mission, vision, objectives, priority crops and core functions ........................................................... 5
Table 3-1: Export of green coffee bean exports by Rwanda and neighboring countries (2012) ........................................ 7
Table 3-2: Production and export volumes for green coffee beans grown in Rwanda ...................................................... 8
Table 3-3: Export counterparts for green coffee beans grown in Rwanda ......................................................................... 8
Table 3-4: Fluctuations in price of green coffee beans ...................................................................................................... 9
Table 3-5: Fluctuations in number of washing stations (2000-2017) .............................................................................. 10
Table 3-6: Minimum purchase price and average purchase price for cherries and parchment for SWC ......................... 14
Table 3-7: Number of washing stations and utilization rate (by region; 2012) ............................................................... 14
Table 3-8: List of exporters and export volume by operator (fiscal year ending in December 2011) ............................. 20
Table 3-9: Rwanda Trading Company’s green coffee standards...................................................................................... 23
Table 3-10: Container fees from Kigali to Mombasa Port and Dar es Salaam Port ........................................................ 24
Table 3-11: Fluctuations in domestic sales volume of Rwandan-grown coffee (roasted beans) ..................................... 27
Table 3-12: Rwanda’s roasters (2011/12) ........................................................................................................................ 27
Table 3-13: Sales price of roasted coffee in Kigali supermarkets .................................................................................... 29
Table 4-1: Number of coffee farms and trees .................................................................................................................. 32
Table 5-1: Overview of ratings in major coffee-producing countries .............................................................................. 42
Table A1-1: Overview of interviewed farmers and livelihood conditions (interview results) ......................................... 49
Table A1-2: Coffee cultivation (interview results) .......................................................................................................... 51
Table A1-3: Methods for learning coffee growing techniques (interview results) .......................................................... 52
Table A1-4: Support for coffee farmers (interview results) ............................................................................................. 53
Table A1-5: Changes as a result of establishment of washing stations (interview results) .............................................. 53
Table A1-6: Number of households growing coffee and number of households that are cooperative members (2009) . 55

List of Figures
Figure 3-1: Production and export volumes for green coffee beans grown in Rwanda ................................................ 8
Figure 3-2: Production and export volumes for Rwandan coffee ............................................................................. 9
Figure 3-3: Distribution channel for SWC .......................................................................................................... 10
Figure 3-4: Distribution channel for FWC .......................................................................................................... 10
Figure 3-5: Quality inspection sheet for parchment .............................................................................................. 18
Figure 4-1: Agobio (pruning method) ................................................................................................................. 35
Figure 4-2: Parras (pruning method) .................................................................................................................. 35
List of Photographs
Photograph 3-1: Poster showing the color of cherries eligible for purchase ............................................................ 13
Photograph 3-2: Cherry purchase record sheet .................................................................................................... 13
Photograph 3-3: Tags for identifying and managing stored green coffee and parchment ........................................... 17
Photograph 3-4: Small husking machine ............................................................................................................. 18
Photograph 3-5: Sieve divided by screen ............................................................................................................ 18
Photograph 3-6: Small roaster ........................................................................................................................... 18
Photograph 3-7: Cup test .................................................................................................................................. 18
Photograph 3-8: Quality certification issued by NAEB ........................................................................................ 22
Photograph 3-9: Rwandan coffee sold at supermarkets and family-run stores ......................................................... 28
Photograph 3-10: Bourbon Coffee Café .............................................................................................................. 30
Photograph 4-1: Coffee farm on inclined ground (Rwanda) .................................................................................. 33
Photograph 4-2: Trees that have not been pruned (2, Rwanda) .............................................................................. 34
Photograph 4-3: Trees that have not been pruned (1, Rwanda) .............................................................................. 34
Photograph 4-4: Well-managed tree (Hawaii) ...................................................................................................... 34
Photograph 4-5: Ripe beans and immature beans (El Salvador) ............................................................................. 36
Photograph 4-6: Hand-sorting of immature beans (Rwanda) ................................................................................. 37
Photograph 4-7: Water channel to rinse coffee beans after fermentation and sort by gravity (Guatemala) .................. 38
Photograph 4-8: Excessively wide water channel (Rwanda) ................................................................................. 39
Photograph 4-9: Drying area (1, Rwanda) ........................................................................................................... 40
Photograph 4-10: Drying area (2, Rwanda) ......................................................................................................... 40

List of Boxes
Box 3-1: Cherry purchase methods and purchase conditions by company and association ....................................... 11
Box 3-2: Current conditions for coffee farmers (cast Survey)................................................................................ 15
Box 3-3: Maraba Cooperative Association .......................................................................................................... 16
Box 3-4: RWACOF’s parchment quality inspection ............................................................................................. 18
Box 3-5: RWASHOSCCO ................................................................................................................................ 21
Box 3-6: Rwanda Trading Company’s brand ....................................................................................................... 23
Box 3-7: Uses of fair trade-certification premiums .............................................................................................. 23
Box 3-8: Sales of coffee in supermarkets ............................................................................................................ 29

Map
Source: UNOCHA

List of Abbreviations
EDPRS2 Economic Development and Poverty Reduction Strategy 2013–2018
FWC Fully-Washed Coffee
FOB Free on Board
FOT Free on Truck
NAEB National Agricultural Export Development Board
RWF RWF
SCAA Specialty Coffee Association of America
SWC Semi-Washed Coffee
WS Washing Station
― 1 ―
Chapter 1 Introduction
1-1. Background
Agriculture in the Republic of Rwanda (hereafter, “Rwanda”) is a backbone industry that accounts for
over 30% of the national GDP and generates about 90% of employment. Coffee in particular is designated as
one of the priority industries in securing foreign capital in Rwanda’s long-term development plan, “Rwanda
Vision 2020.” Recently, the international price of coffee has risen as global coffee consumption has increased,
and the Rwandan government’s infrastructure development and marketing strategy aimed at the high-end
market coffee have paid off. As a result, coffee has become Rwanda’s biggest agricultural export, accounting
for 24% of total exports in 2010.
Rwanda’s “Strategic Plan for the Transformation of Agriculture in Rwanda Phase II” aims to improve
coffee production and quality by refining production and processing techniques to transform it into an
agri-business. At the same time, the majority of the coffee produced in Rwanda is grown by small-scale
farmers, for whom large-scale investment is difficult. Observers have noted that the insufficient production
volume and delays in improving quality attributable to a lack of technology for everything from cultivation to
pruning, such as fertilizer application, pest prevention and equipment maintenance, has prevented exports
from increasing further.
Even in Japan, coffee produced in Rwanda is recognized as high-quality beans commonly known as
“specialty coffee,” and is imported via Europe and Kenya. Recently, coffee importers have diversified to
include general trading houses, roasters and retailers, and interest in Rwandan coffee has heightened, but this
has not led to a substantial increase in exports, partly due to the aforementioned problems.
Accordingly, the Japan International Cooperation Agency (JICA) conducted a Survey to compile and
verify information (hereafter, “the Survey”) in order to gain a comprehensive understanding of the process
from cultivation to distribution in Rwanda’s coffee industry.
1-2. Description of Survey
The Survey was conducted with the following objectives:
(1) to ascertain the position of the coffee industry in Rwanda’s agricultural policy;
(2) to confirm the current condition of and problems with Rwanda coffee cultivation;
(3) to confirm the current condition of and problems with coffee distribution within and outside of
Rwanda;
(4) to confirm the current condition of and problems with setting quality standards in Rwanda;
In addition to that, survey team provided technical guidance to the Japan Overseas Cooperation
Volunteers and held local workshops.

― 2 ―
1-3. Team members
Assigned area Name Position
Team leader Mitsunori Saito Director, Africa Division 1, Africa
Department, JICA
Coordination and planning Akihiko Kodama
Deputy Assistant Director, Africa
Division 1, Africa Department, JICA
(joined first Survey)
Coordination and planning Hayakazu Yoshida
Staff, Africa Division 1, Africa
Department, JICA
(joined second Survey)
Coffee production Yoshiaki Kawashima Mi Cafeto Co., Ltd.
Coffee quality standards Tomohiro Ishiwaki S. Ishimitsu & Co., Ltd. (joined second
Survey)
Coffee distribution Yoshihiko Matsuda IC Net Limited.
1-4. Survey schedule
First survey in Rwanda: March 19-27, 2013
Second survey in Rwanda: June 16-26, 2013

― 3 ―
Chapter 2 Coffee Policy, Plans and Administration
2-1. Policy and plans
(1) Rwanda Vision 2020
Rwanda Vision 2020 is the highest policy document for economic development in Rwanda. The
paper sets targets of raising the per capita income to US$900 by 2020 and becoming a middle-income country
by 2020, and also designates the following as the six pillars of its development. Revitalizing the coffee
industry is consistent with 5) below.
1) good governance and a capable state
2) human resource development and a knowledge-based economy
3) a private sector-led economy
4) infrastructure development
5) productive and market-oriented agriculture
6) regional and international economic integration
(2) Economic Development and Poverty Reduction Strategy 2013 – 2018 (EDPRS 2)
In 2002-2006, “Poverty Reduction Strategy” and in 2008-2012 the “Economic Development and Poverty
Reduction Strategy” were implemented as medium-term strategic plans to realize the comprehensive Rwanda
Vision 2020. This was followed by the Economic Development and Poverty Reduction Strategy (EDPRS 2) in
2013 – 2018. EDPRS 2 designates 1) economic transformation, 2) rural development, 3) productivity and
youth employment and 4) accountable governance as the four thematic areas, and stipulates priorities in each
area (EDPRS 2, ).
The coffee industry is designated as one of the biggest export-oriented sectors, and one of the priority
areas (“Increasing the external connectivity of Rwanda’s economy and boosting exports”) in the
aforementioned 1) economic transformation states that extension services and capacity building in the coffee
sector will be expanded systematically and on a large scale in order to further promote coffee exports
(paragraph 2.37 of EDPRS 2). Moreover, capacity building and research will be intensified to improve the
coffee industry’s productivity (paragraph 2.41 of EDPRES 2).
(3) National Agricultural Policy
The Ministry of Agriculture and Animal Resources established the National Agricultural Policy in April
2004 based on Rwanda Vision 2020 and its poverty reduction strategy. The vision for the National
Agricultural Policy is based on the following six key areas.
1) Food safety and security by creating an environment suited to income generation
2) Modern, professional, innovative and specialized agriculture
3) Market-oriented agriculture
4) Equitable distribution of profits generated during processing
5) Mixed and diversified agriculture
― 4 ―
6) Environment-friendly agriculture
The overall objectives of the National Agricultural Policy are to ensure national food security, integrate
agriculture and livestock in a market-oriented economy, generate increasing incomes for producers and create
conditions favorable to sustainable development and promotion of agricultural and livestock products. In
order to achieve these overall objectives, the plan stipulates, objectives, strategies and priority products for
each of the three sub-sectors of agriculture, livestock and soil and water management. Strategies in the
agriculture sub-sector, which includes the coffee industry, are to strengthen research and extension,
intensification, agricultural marketing, and diversification and regional specialization.
The National Agricultural Policy identifies coffee as a priority product in the agricultural sub-sector, and
recognizes that coffee quality would improve by setting up washing stations, which would in turn boost the
income of producers and Rwanda overall; that replacing old coffee trees would improve productivity and also
has high potential; and it is important to improve current technology and shift to high-yielding varieties.
(4) Strategic Plan for the Transformation of Agriculture in Rwanda Phase II
The Strategic Plan for the Transformation of Agriculture in Rwanda Phase II was established to cover
2009-2012 as the follow-up plan to the Strategic Plan for the Transformation of Agriculture in Rwanda Phase I,
established in 2005-2008 to implement national agricultural policy. The Strategic Plan for the Transformation
of Agriculture in Rwanda Phase II consists of the following four programs and 20 sub-programs.
Program 1: Intensification and development of sustainable production systems
Sub-program 1.1: Sustainable management of natural resources and water and soil conservation
Sub-program 1.2: Integrated development and intensification of crops and livestock
Sub-program 1.3: Marshland development
Sub-program 1.4: Irrigation development
Sub-program 1.5: Supply and use of agricultural inputs
Sub-program 1.6: Food security and vulnerability management
Program 2: Support for the professionalization of producers
Sub-program 2.1: Promotion of farmer organizations and capacity building for producers
Sub-program 2.2: Restructuring proximity services for producers
Sub-program 2.3: Research for agricultural transformation
Program 3: Promotion of commodity chains and agribusiness development
Sub-program 3.1: Creating a conducive environment for business and entrepreneurship development and
market access
Sub-program 3.2: Promotion and development of traditional exports
Sub-program 3.3: Development of non-traditional high-value export products
Sub-program 3.4: Production and value addition for domestic staple products
Sub-program 3.5: Market-oriented rural infrastructure
Sub-program 3.6: Strengthening rural financial systems

― 5 ―
Program 4: Institutional development
Sub-program 4.1: Institutional strengthening and capacity building
Sub-program 4.2: Policy and regulatory framework for the sector
Sub-program 4.3: Agricultural statistics and ICT
Sub-program 4.4: Monitoring and evaluation systems and coordination of the agricultural sector
Sub-program 4.5: Decentralization program in agriculture
As regards coffee, “Sub-program 3.2: Promotion and development of traditional exports” includes
“Sub-program 3.2.1 Coffee.” This program consists of 1) put in place a system to improve input
distribution and management and monitoring of that distribution for coffee, including seedlings,
plantings, application of inputs and studies to evaluate fertilization strategies (sub-program 3.2.1a); 2)
identify causes of the “potato taste” (sub-program 3.2.1b); 3) implement turnaround programme for
washing stations to improve their productivity and profitability (sub-program 3.2.1c); 4) implement a
programme of control of coffee leaf rust and other diseases that affect this crop (sub-program 3.2.1d);
5) carry out a programme for improved international marketing of coffee to gain higher prices for a
wider number of producers (sub-program 3.2.1e); and 6) continue the programme of rehabilitating and
replacing old coffee plantations with plantings of new varieties that are of better quality and are
more disease-resistant, and develop multiplication centres for new seedlings (sub-program 3.2.1f).
Moreover, “sub-program 2.1 Promotion of farmer organizations and capacity building for producers”
stipulates that coffee growers will be trained in cultivation methods and quality (sub-program 2.1d).
2-2. Administrative systems related to coffee industry
The National Agricultural Export Development Board (NAEB), under the Ministry of Agriculture and
Animal Resources, has jurisdiction over coffee cultivation, processing and sales. NAEB’s mission, vision,
objectives, priority crops and core functions are outlined in Table 2-1.
Table 2-1: NAEB’s mission, vision, objectives, priority crops and core functions
Item Description Mission To support the development of agricultural and animal exports at every stage of the value chain
Vision To develop agricultural and animal products in Rwanda that are recognized worldwide for their high quality
Objectives
Overall objective: To increase output of high value-added agricultural and animal products for export Specific objectives: To increase coffee exports to US$157 million annually by 2017 To increase tea exports to US$147 million annually by 2017 To increase the export of horticultural products to US$335 million annually by 2017 To increase the export of honey and animal products to US$100,270,000 annually by 2017
Priority crops
Black tea, green tea, orthodox tea, green coffee beans, roasted coffee beans, fresh organic fruit and vegetables, dried organic fruit and vegetables, flowers (particularly roses and summer flowers), dried organic red peppers, premium juice, milk and dairy products, meat, leather, essential oils
― 6 ―
Core functions
To participate in the formulation of policy and strategy to promote the export of agricultural and animal products
To implement policy and strategy to promote the spread and develop agricultural and animal products for export
To designate and support research related to the guidance in the dissemination of agricultural and animal products for export
To cooperate with other organizations to designate sites on which to build processing plants for agricultural and animal products for export and to give processing plants operation authorization
To set quality regulations for agricultural and animal products for export and ensure that those quality regulations are observed
To issue certificates of origin for agricultural and animal products for export To supervise, support and guide private operators and cooperative associations involved with
agricultural and animal products for export To work and coordinate with NGOs, private operators and other organizations related to
agricultural and animal products for export To increase industries and infrastructure investments contributing to the added value of
agricultural and animal products for export To collect information on local markets, regional markets and international markets and
familiarize relevant parties with that information To coordinate activities of those involved with agricultural and animal products for export To participate in domestic and overseas international negotiations and trade fairs to promote
the sale of agricultural and animal products To build good relationships with international institutions involved with agricultural and
animal products
Source: NAEB (2012)
― 7 ―
Chapter 3 Distribution
3-1. Distribution trends for coffee grown in Rwanda
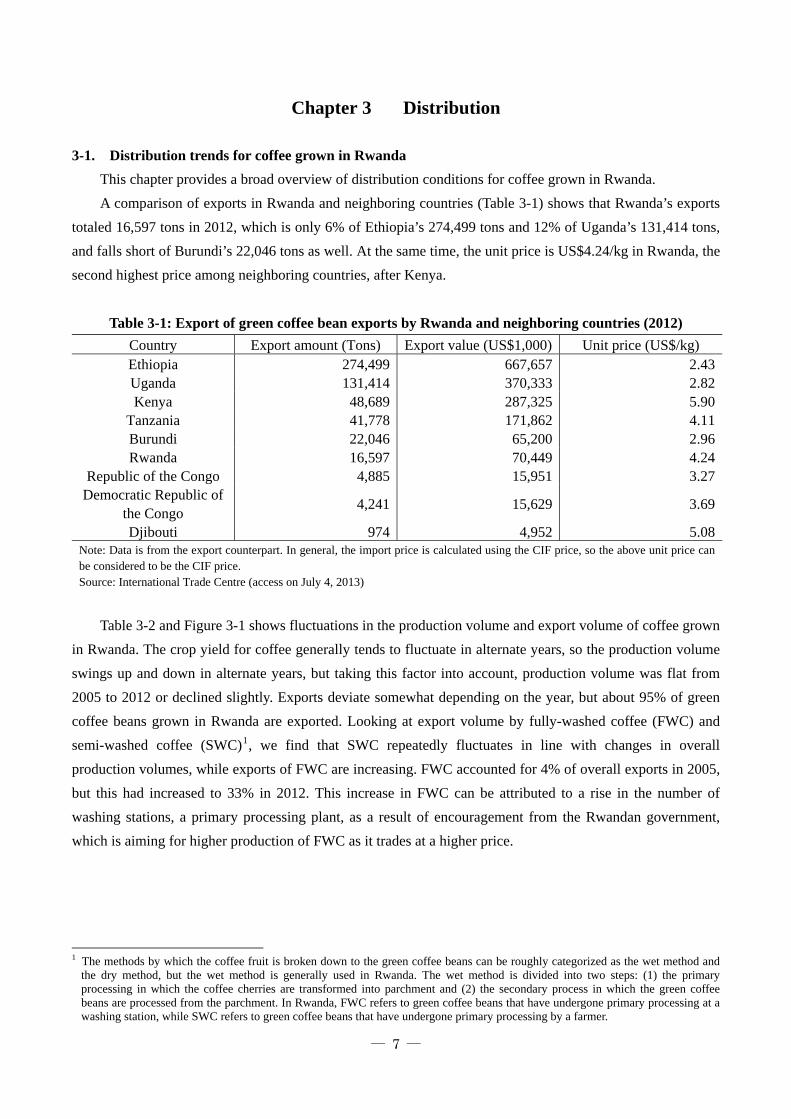
This chapter provides a broad overview of distribution conditions for coffee grown in Rwanda.
A comparison of exports in Rwanda and neighboring countries (Table 3-1) shows that Rwanda’s exports
totaled 16,597 tons in 2012, which is only 6% of Ethiopia’s 274,499 tons and 12% of Uganda’s 131,414 tons,
and falls short of Burundi’s 22,046 tons as well. At the same time, the unit price is US$4.24/kg in Rwanda, the
second highest price among neighboring countries, after Kenya.
Table 3-1: Export of green coffee bean exports by Rwanda and neighboring countries (2012)
Country Export amount (Tons) Export value (US$1,000) Unit price (US$/kg) Ethiopia 274,499 667,657 2.43Uganda 131,414 370,333 2.82Kenya 48,689 287,325 5.90
Tanzania 41,778 171,862 4.11Burundi 22,046 65,200 2.96Rwanda 16,597 70,449 4.24
Republic of the Congo 4,885 15,951 3.27Democratic Republic of
the Congo 4,241 15,629 3.69
Djibouti 974 4,952 5.08Note: Data is from the export counterpart. In general, the import price is calculated using the CIF price, so the above unit price can be considered to be the CIF price. Source: International Trade Centre (access on July 4, 2013)
Table 3-2 and Figure 3-1 shows fluctuations in the production volume and export volume of coffee grown
in Rwanda. The crop yield for coffee generally tends to fluctuate in alternate years, so the production volume
swings up and down in alternate years, but taking this factor into account, production volume was flat from
2005 to 2012 or declined slightly. Exports deviate somewhat depending on the year, but about 95% of green
coffee beans grown in Rwanda are exported. Looking at export volume by fully-washed coffee (FWC) and
semi-washed coffee (SWC)1, we find that SWC repeatedly fluctuates in line with changes in overall
production volumes, while exports of FWC are increasing. FWC accounted for 4% of overall exports in 2005,
but this had increased to 33% in 2012. This increase in FWC can be attributed to a rise in the number of
washing stations, a primary processing plant, as a result of encouragement from the Rwandan government,
which is aiming for higher production of FWC as it trades at a higher price.
1 The methods by which the coffee fruit is broken down to the green coffee beans can be roughly categorized as the wet method and
the dry method, but the wet method is generally used in Rwanda. The wet method is divided into two steps: (1) the primary processing in which the coffee cherries are transformed into parchment and (2) the secondary process in which the green coffee beans are processed from the parchment. In Rwanda, FWC refers to green coffee beans that have undergone primary processing at a washing station, while SWC refers to green coffee beans that have undergone primary processing by a farmer.

― 8 ―
Table 3-2: Production and export volumes for
green coffee beans grown in Rwanda (Unit: tons)
Year Amount
produced
Export volume
FWC SWC Total
2005 18,700 726 17,883 18,609
2006 26,487 1,831 24,321 26,151
2007 14,684 2,232 12,378 14,610
2008 20,724 2,283 17,427 19,711
2009 15,055 3,228 12,158 15,387
2010 19,319 3,957 14,279 18,236
2011 16,371 4,333 11,264 15,597
2012 19,955 5,583 11,407 16,990
Source: NAEB Source: Prepared by Survey team using NAEB materials.
Figure 3-1: Production and export volumes for green
coffee beans grown in Rwanda
The top-three importers of Rwandan coffee are Belgium, the US and Germany, which accounted for over
70% of export volume in 2012. This trend has not changed since 2007, except that exports to Germany have
decreased while exports to the US are on the rise (Table 3-3). Exports to Japan only totaled 329 tons in 2012, a
mere 2% of overall exports, but this represents a steady increase from 5 tons in 2007. In typical years, Japan,
which imports about 400,000 tons of green coffee beans, is an attractive market for Rwanda, and exports to
Japan should be increased going forward. The highest unit price for green coffee beans is for beans for the
Japanese market, which is likely because some Japanese companies buy at high prices from a fair trade
perspective and half of the beans winning the “cup of excellence award” are bought by Japanese companies.
Table 3-3: Export counterparts for green coffee beans grown in Rwanda
Export counterpart
Export volume (tons) Weight (%) Unit price (US$/kg)
2007 2008 2009 2010 2011 2012 2012 2012 Belgium 1,185 4,152 6,198 4,076 3,936 4,316 26.0% 4.56
US 1,756 2,669 3,741 4,750 4,586 4,291 25.9% 5.43Germany 6,980 6,982 5,980 4,771 3,822 3,722 22.4% 3.70
France 1,012 1,221 1,184 977 1,041 1,071 6.5% 4.13Russia 38 234 131 317 461 579 3.5% 4.74Poland 0 340 241 336 363 398 2.4% 4.61Japan 5 46 57 109 149 329 2.0% 6.86UK 97 158 176 146 219 312 1.9% 5.48
Canada 26 78 29 39 158 309 1.9% 5.19Rumania 728 787 612 461 103 307 1.8% 4.28
Total 14,982 18,624 19,317 17,346 16,413 16,597 100.0% 4.66Note: Based on import data for the export counterpart. In general, the CIF price is used in the import data, so the unit price was calculated based on the CIF price. Source: International Trade Centre (http://www.trademap.org/; accessed on July 5, 2013)
0
5,000
10,000
15,000
20,000
25,000
30,000
2005
2006
2007
2008
2009
2010
2011
2012
Production
Exports(Total)
Exports(FWC)
Exports(SWC)
(year)
(tons)

― 9 ―
The price of FWC and SWC stood at US$4.51 and US$3.13 per kilogram, respectively, in 2012 (Table 3-4),
and is closely correlated on the New York “C” contract market price (Figure 3-2). The FWC promoted by the
Rwandan government is always priced lower than the “C” market price, and the difference between FWC and SWC
prices is US$1-2 per kilogram.
Table 3-4: Fluctuations in price of green coffee
beans (Unit: US$/kg)
Year Rwanda* New York “C” contract
market price ** FWC SWC
2005 2.91 2.07 2.46
2006 3.02 1.97 2.48
2007 3.50 1.98 2.69
2008 3.62 2.22 3.01
2009 3.47 2.15 2.83
2010 3.97 2.83 3.64
2011 6.29 4.21 5.65
2012 4.51 3.13 3.95
Note: Green coffee bean prices noted in NAEB data is based on the actual contract amount, so it is essentially the FOT or FOB price. Source: * indicates data provided by NAEB, and ** indicates data provided by International Coffee Organization (http://www.ico.org/new_historical.asp; access on July 5, 2013)
Source: Prepared by Survey team using NAEB data and International Coffee Organization (http://www.ico.org/new_historical.asp; access on July 5, 2013).
Figure 3-2: Production and export volumes for
Rwandan coffee
3-2. Distribution from harvesting through export
This section describes distribution from the time the farmers harvest the cherries through the processing
of the green coffee beans and parchment, and their emergence onto foreign markets.
Figures 3-4 and 3-3 show the distribution channels for FWC and SWC. In the case of FWC, the cherries
harvested by farmers are carried to washing stations run by cooperative associations and private-sector
companies and processed as parchment coffee. The parchment coffee is processed by a secondary processor,
resulting in green coffee beans, and finally it is sold to overseas importers through an exporter. In the case of
SWC, parchment coffee processed by the farmer is sold to a middleman or secondary processor and processed
to produce green coffee beans.
0
1
2
3
4
5
6
7
FWC
SWC
New York"C" contractmarket price
(US$/kg)
(year)

― 10 ―
Source: Prepared by Survey team.
Note 1: Washing stations include those owned by cooperative associations, those owned by secondary processors and those owned by other private companies. Note 2: Some cooperative associations also carry out secondary processing. Source: Prepared by Survey team.
Figure 3-3: Distribution channel for SWC
Figure 3-4: Distribution channel for FWC
About 70% of the green coffee beans exported from Rwanda is SWC (Table 3-2), and SWC accounts for most
distribution. At the same time, the government is constructing washing stations to raise the quality of the coffee.
While there were only two washing stations in 2000, this had increased to 215 by 2012, and the government plans
to increase them further to 349 by 2017. This means that the distribution of FWC has picked up rapidly over the
past 10 years, and is expected to increase even further going forward. In regions where washing stations have been
set up, in order to secure cherries for FWC, the government has banned farmers from processing the cherries into
parchment coffee. This has been enforced by, for example, collecting hand-operated pulping machines. Accordingly,
in regions in which washing stations have been set up, FWC usually accounts for most of the coffee distributed.
Table 3-5: Fluctuations in number of washing stations (2000-2017)
Year 2000 2002 2003 2004 2005 2006 2007 2008 2009 2010 2011 2012 2013 2014 2015 2016 2017
(Actual data) (Target)
No. of WS 2 4 14 31 54 80 103 118 145 187 199 215 249 274 299 324 349
Share of FWC - - - - - - - - - - - - 37% 43% 50% 59% 71%
Note: Data on share of FWC (actual) could not be obtained. Source: NAEB materials
3-2-1. Distribution of cherries for FWC: from farmers to washing station
Harvested cherries must be sent to the washing station promptly since they will deteriorate if they are not
pulped within 12 to 24 hours of harvest. This means that the washing station must be located in the same area
Middleman
Middleman
Secondary processor cum exporter
Green coffee beans
Middleman
Farmer
Overseas importer
Parchment
Parchment
Parchment
Secondary processor cum exporter3
Secondary processor2
Farmer
Washing station1
Green coffee beans
Cherries
Parchment
Overseas importer
Green coffee beans
Exporter
Collector, middleman

― 11 ―
as the area in which the cherries are bought. According to local interviews, washing stations are located within
8-20km of the area in which they will be bought.
The buying practice differs depending on the washing station, but the most common methods are: 1)
farmers bring their cherries to a collection site on the designated date, and the washing station provides a truck
for the purchase and collection of cherries; 2) a middleman buys the cherries that the washing station has
bought and collected from the farmers; and 3) farmers near the washing station bring cherries directly to the
washing station (Box 3-1). The cherries delivered to the washing station all go through the primary processing
together, without being divided by farm or area. However, cherries of particularly high quality are separated
for processing in some cases.
When the cherries are bought, they are looked over to confirm that they meet standards. The typical
standards are that 1) the cherries are not green or black but a vibrant red and 2) the cherries sink when put into
a vessel filled with water. All washing stations check these aspects. Washing stations take different steps in the
event that cherries do not meet conditions. The local Survey confirmed the following three types of responses.
1) Non-standard cherries are bought at a discounted price.
2) Non-standard cherries are not bought, and only cherries meeting standards are bought.
3) If the percentage of non-standard cherries included in the cherries brought to the washing station is below
a certain level, the entire lot, include the non-standard cherries, are bought at the same price; if the
percentage exceeds a certain level, none of them will be bought, including the standard cherries.
Farmers take back the non-standard cherries that are refused for purchase and use hand-powered pulping
machines to make parchment coffee. This parchment coffee is bought by middlemen for use in SWC.2
Cherries that do not meet standards are rejected or bought at a discounted price, so farmers seem to have
a good understanding of the purchase standards for cherries.3 Moreover, posters such as that shown in Figure
3-5 are used to familiarize farmers with the purchase standards, and some working stations provide instruction
at harvest time. Some farmers have in the past sold their cherries too cheaply at the middleman’s offered price
since they didn’t know the purchase standards. However, the washing stations opened a few years ago clarify
the purchase standards and make sure that familiars are familiar with them, so farmers are careful about the
harvest timing and quality and are able to sell their cherries with confidence, according to some we spoke
with.
Box 3-1: Cherry purchase methods and purchase conditions by company and association
Example 1: RWACOF Purchase method: There are three patterns: 1) a collection site is set up and staff are sent to the collection site
to collect the cherries; 2) cherries collected by a middleman are bought; and 3) farmers bring them in directly. The purchase region is within 8km of the washing station.
2 In regions with washing stations, farmers are not allowed to carry out primary processing, so in a region in which we conducted the
local study, farmers secretly carry out primary processing. 3 Nevertheless, as discussed in “Chapter 4 Production,” even if they understand the standards, the standards themselves may be too
lenient compared to other countries.

― 12 ―
Purchase condition and prices: RWACOF does not buy non-standard cherries. The purchase price is the same, regardless of the quality of the cherries. Since the extent of the competition over cherry purchases differs depending on the washing station, purchase prices are adjusted in line with the degree of competition in each region.
Example 2: Rwanda Trading Company Purchase method: A collection site is set up, and a truck is sent on collection days three to four times a week
to buy the cherries. Purchase conditions and prices: Only cherries that meet the standards are bought. Cherries that do not meet
the standards, such as unripe cherries, are not purchased. The price for cherries is updated every week, and applied at all washing stations. However, washing stations that select parchment that will become high-quality green coffee beans every year raise their purchase price.
Example 3: Huye Mountain Coffee Purchase method: Neighboring farmers bring cherries themselves, but the washing stations buy from the
other farmers via18 site collectors. Site collectors collect cherries from the farmers in their assigned area, at which time they check the cherries’ color and whether it will sink in water, and only collect cherries that satisfy the standards. The collected cherries are packed into trucks sent by the washing station, and after arriving at the washing station, a manager at the washing station reconfirms weight and quality. Subsequently, the washing station pays the site collector for the cherries, and the site collector pays the farmers. The site collectors are elected every year from amongst the coffee farmers in discussion. Site collectors earn a per diem of 1,000 RWF per day. Their purchase area is within 10km.
Purchase conditions and prices: Only cherries that meet the standards are bought. Cherries that do not meet the standards are not purchased. The price for cherries is updated every week. In principle, there is a single price, but higher prices are paid in regions that grow cherries that have won the “cup of excellence” award.
Example 4: Maraba Cooperative Purchase method: Trucks are sent to 40 collection sites. Two staff are assigned to each collection site. Purchase conditions and prices: Cherries that do not meet standards (cherries that float in the water, green
cherries that are not ripe) are not bought. There is a single price. Example 5: KZ Noir Purchase methods: There are three patterns: 1) KZ Noir uses its trucks to collect cherries on its own; 2) KZ
Noir buys from middlemen; or 3) neighboring farmers bring them in directly. The purchase area is within 20km of the washing station.
Purchase conditions and prices: There is a single price. Middlemen are given a margin of 10-15 RWF /kg. If more than 10% of the cherries are non-standard cherries, such as unripe cherries, none of them will be bought, including cherries meeting standards. If less than 10% are non-standard, all cherries are bought at a single price, including the non-standard cherries.
Source: Survey team; based on interviews conducted locally.

― 13 ―
Note: Prepared by Rwanda Trading Company; displayed at Huye Mountain Coffee’s washing station. Source: Photograph by Survey team
Photograph 3-1: Poster showing the color of
cherries eligible for purchase
Source: Photograph by Survey team
Photograph 3-2: Cherry purchase record sheet
The cherry purchase prices take into account market trends, the washing station’s operating expenses,
farmers’ cultivation costs, and the purchase price at competing nearby washing stations. The price is updated
every week or every day. In regions where competition over purchases is particularly intense among washing
stations, the purchase price is set at a competitive level. In general, there is a single price, and there are no
price differentials based on factors such as taste and altitude.4 Nevertheless, some operators add on a
premium to the single price in the case of regions in which cherries that win the cup of excellence award are
grown and washing stations that process high-quality parchment.5 Trading at prices below the minimum price
set at the start of the harvest season in discussion by exporters, washing stations, the National Federation of
Coffee Farmers and other related parties is banned.6
4 However, as noted above, some operators buy non-standard cherries at a discounted price. 5 For example, COOPAC adds premiums of 5-20% depending on quality. Quality here refers to whether the cherries are red, or
whether they were grown in a region in which cherries that have won COE are grown (based on an interview with COOPAC on June 18, 2013). In addition, Huye Mountain Coffee pays a higher price than the single price in areas that grow cherries that have won COE (based on interviews with Huye Mountain Coffee on June 19, 2013). Rwanda Trading Company pays a higher purchase price for cherries to washing stations that produce high-quality parchment (based on interviews with Rwanda Trading Company on June 18, 2013).
6 The National Federation of Coffee Farmers is made up of units and the cooperative associations under them.

― 14 ―
Table 3-6: Minimum purchase price and average purchase price for cherries and parchment for SWC
Year 2005 2006 2007 2008 2009 2010 2011 2012Cherry
Minimum purchase price RWF 100 100 120 120 120 145 165 170 US$1 0.17 0.17 0.21 0.22 0.21 0.25 0.27 0.28
Average purchase price RWF 110 110 135 150 160 198 258 187 US$1 0.19 0.19 0.24 0.27 0.28 0.34 0.42 0.31
Parchment picked by farmers Minimum purchase price RWF 500 500 500 500 500 500 1200 600
US$1 0.87 0.87 0.88 0.90 0.86 0.86 1.97 0.98Average purchase price RWF 550 550 625 610 625 750 1350 700
US$1 0.95 0.95 1.10 1.10 1.08 1.28 2.22 1.14Note 1: The US$-denominated price was converted from RWF at the exchange rate on April 1 of that year (http://www.oanda.com/lang/ja/currency/converter/). However, the exchange rate for 2005 could not be obtained, so the figures were converted using the rate on April 1, 2006. Source: NAEB materials
Some washing stations give farmers interest-free advance payments and loans, secondary payments,
instruction on cultivation, and offer nurseries, whether the washing station is owned by a cooperative or a
private operator.7 This kind of farmer services help to strengthen relationships with farmers. Washing station
utilization rates average 61% nationwide, and are only 23% in the Northern Province (Table 3-7), so these
farmer services are likely a means whereby washing stations can strengthen relationships with farmers and
thus ensure a stable source of cherries.
Table 3-7: Number of washing stations and utilization rate (by region; 2012)
Region
No. of WS Selecting and processing
capacity of WS in
operation (converted to
cherries, tons)
Amount of
cherries selected
and processed
(tons)
WS utilization
rate (%) In operation Idle Total
Kigali (capital) 1 3 4 2,500 33 1%
Eastern Province 39 2 41 15,750 11,613 53%
Southern Province 52 6 58 20,450 10,763 74%
Northern Province 20 3 23 12,150 2,663 22%
Western Province 85 4 89 41,950 31,667 70%
Total 197 18 215 92,800 56,739 61%
Source: NAEB (2012)
7 For example, private washing stations offering services to farmers include Huye Mountain Coffee, RWACOF and KZ Noir.
― 15 ―
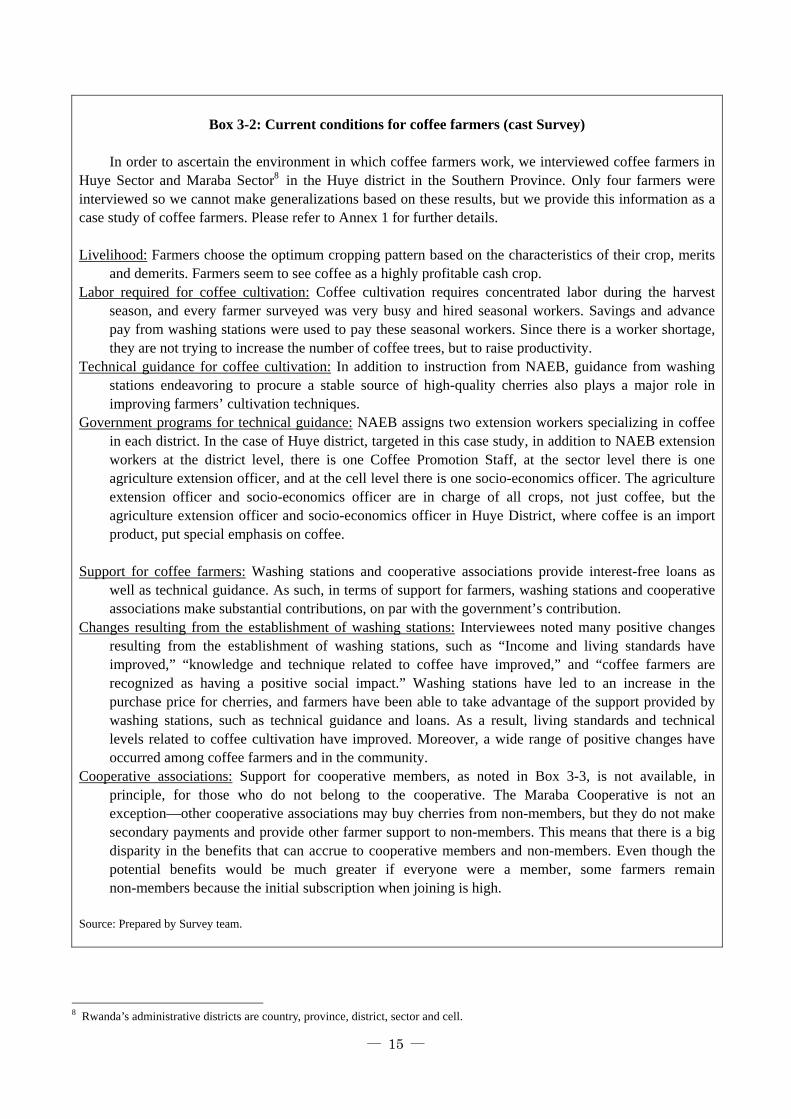
Box 3-2: Current conditions for coffee farmers (cast Survey)
In order to ascertain the environment in which coffee farmers work, we interviewed coffee farmers in
Huye Sector and Maraba Sector8 in the Huye district in the Southern Province. Only four farmers were interviewed so we cannot make generalizations based on these results, but we provide this information as a case study of coffee farmers. Please refer to Annex 1 for further details. Livelihood: Farmers choose the optimum cropping pattern based on the characteristics of their crop, merits
and demerits. Farmers seem to see coffee as a highly profitable cash crop. Labor required for coffee cultivation: Coffee cultivation requires concentrated labor during the harvest
season, and every farmer surveyed was very busy and hired seasonal workers. Savings and advance pay from washing stations were used to pay these seasonal workers. Since there is a worker shortage, they are not trying to increase the number of coffee trees, but to raise productivity.
Technical guidance for coffee cultivation: In addition to instruction from NAEB, guidance from washing stations endeavoring to procure a stable source of high-quality cherries also plays a major role in improving farmers’ cultivation techniques.
Government programs for technical guidance: NAEB assigns two extension workers specializing in coffee in each district. In the case of Huye district, targeted in this case study, in addition to NAEB extension workers at the district level, there is one Coffee Promotion Staff, at the sector level there is one agriculture extension officer, and at the cell level there is one socio-economics officer. The agriculture extension officer and socio-economics officer are in charge of all crops, not just coffee, but the agriculture extension officer and socio-economics officer in Huye District, where coffee is an import product, put special emphasis on coffee.
Support for coffee farmers: Washing stations and cooperative associations provide interest-free loans as
well as technical guidance. As such, in terms of support for farmers, washing stations and cooperative associations make substantial contributions, on par with the government’s contribution.
Changes resulting from the establishment of washing stations: Interviewees noted many positive changes resulting from the establishment of washing stations, such as “Income and living standards have improved,” “knowledge and technique related to coffee have improved,” and “coffee farmers are recognized as having a positive social impact.” Washing stations have led to an increase in the purchase price for cherries, and farmers have been able to take advantage of the support provided by washing stations, such as technical guidance and loans. As a result, living standards and technical levels related to coffee cultivation have improved. Moreover, a wide range of positive changes have occurred among coffee farmers and in the community.
Cooperative associations: Support for cooperative members, as noted in Box 3-3, is not available, in principle, for those who do not belong to the cooperative. The Maraba Cooperative is not an exception—other cooperative associations may buy cherries from non-members, but they do not make secondary payments and provide other farmer support to non-members. This means that there is a big disparity in the benefits that can accrue to cooperative members and non-members. Even though the potential benefits would be much greater if everyone were a member, some farmers remain non-members because the initial subscription when joining is high.
Source: Prepared by Survey team.
8 Rwanda’s administrative districts are country, province, district, sector and cell.

― 16 ―
Box 3-3: Maraba Cooperative Association
Overview: The group began activities in 1999 and became a cooperative association in 2002. There are
currently 1,416 members. The cooperative has 27 full-time employees and hires 300 seasonal workers. It is active in five sectors in Huye District, including the Maraba sector. It received USAID from 2001 to 2006.
Operations: Cherry purchases, primary processing, secondary processing, return of profits to cooperative members
Scale: There are four washing stations and one secondary processing facility. It does not have a coffee farm, but the cooperative members taken together own coffee farms covering a total of 250 ha. Every year, five containers (about 100 tons) are produced. They sell two containers to the UK and two to the US, and occasionally trade with Japan as well.
Organization: Maraba Cooperative has three divisions. 1) General Assembly: Meets twice a year; 140 cooperative members, or 10%, are Assembly members. They are selected in elections. 2) Board of Directors: Made up of five officers, with a business team (accounting, operations, cashier, etc.) consisting of managers and others underneath the Board of Directors. 3) Internal auditor
Support for cooperative members and advantages: 1) Support for various work in coffee cultivation. 2) Distribution of fertilizer at no charge; however, when the cherries are bought, a contribution of 10 RWF/kg is deducted from the payment when cherries are purchased. However, farmers who accept fertilizer cannot be forced to sell their cherries to the Maraba Cooperative, so there are cases in which they sell their cherries to other operators. The amount of fertilizer distributed is determined based on the amount of cherries sold the previous year. Farmers can apply fertilizer to 10 trees with 1kg of fertilizer and 100kg of cherries can be harvested from 10 coffee trees, so farmers who sell 100kg of cherries are given 10kg of fertilizer. 3) Interest-free loans and advance payment. 4) Secondary payments. 5) Support with health insurance premiums at no cost. 6) Training (saving money, health care, HIV, nutrition, hygiene). 7) Training and guidance regarding agriculture.
Method for distribution of net profits: Decided by General Assembly. For example, secondary payments, repair of washing station, purchase of new equipment, purchase of pumps, etc.
Method for access to farmers: Farmers are grouped at the cell level. Communication is taken with farmers through ties between the General Assembly, sectors and cells. Political governing structures and bureaucrats are not involved.
Other: Fair trade certification obtained from 2004 Source: Prepared by Survey team based on interviews with Maraba Cooperative Association (June 20, 2013).
3-2-2. Distribution of parchment processed as FWC: from washing station to secondary processors and
exporters
Parchment selected by the washing station is transported to secondary processing facilities to process into
green coffee beans. Even if the amount of the transported parchment is minimal, the quality is inspected
before it is purchased.9 , 10 In the screening, the parchment is inspected for moisture content, weight
composition ratio, the cup score based on Specialty Coffee Association of America (SCAA) standards, the
physical appearance of the bean and the presence of a fermentation odor. The results are managed by lot unit.
9 However, quality inspections are not carried out in cases such as Maraba Cooperative, which owns both a washing station and a
secondary processing facility. 10 Samples are taken from every bag delivered to RWACOF for inspection.

― 17 ―
Poor-quality parchment is not bought, and the parchment purchase price is adjusted based on the extraction
rate as calculated from the moisture content and the weight composition ratio by size.11
The parchment that is bought is managed and stored by lot in the case of both operators that process the
parchment to produce green coffee and then store it, and the operators who store the parchment until an order
is received.12 Since the respective lots are transported by different washing stations, it could be identified and
managed in terms of washing station units, but they cannot identify the parchment by a smaller unit than the
washing station, such as by farm. In some cases, the parchment and green coffee managed by lot is ultimately
mixed with different lots when the importer places an order.
Photograph 3-3: Tags for identifying and managing stored green coffee and parchment
11 Based on interviews with RWACOF (March 22, 2013) and the Rwanda Trading Company (June 18, 2013). 12 The Rwanda Trading Company saves it in parchment form.

― 18 ―
Box 3-4: RWACOF’s parchment quality inspection
RWACOF’s quality inspection of parchment examines the following aspects in this order: 1) husking,
2) moisture content measurement, 3) calculation of weight composition ratio by size, 4) roasting and 5) cupping. The quality inspection sheet shown in Figure 3-5 is used for this process.
Photograph 3-4: Small husking machine
Figure 3-5: Quality inspection sheet for parchment Photograph 3-5: Sieve divided by screen
Photograph 3-6: Small roaster Photograph 3-7: Cup test Source: Survey team
3-2-3. Distribution of parchment processed as SWC: from washing station to secondary processors and
exporters
The parchment that is the raw material for SWC is processed by farmers using a hand-operated pulping
machine, but this parchment is bought up and collected by the secondary processor via a middleman from all

― 19 ―
over the country. The middleman may have small-scale middlemen working under him in a network that
stretches across the country.13 The secondary processor gives advance payments to the middleman so that the
middleman can buy the parchment.
When the parchment is bought by the secondary processor, the moisture content, weight composition
ratio by size, physical appearance and the presence of a fermentation odor are examined, but unlike parchment
to be processed as FWC, a cup score is not given.14 The purchase price is determined based on market trends
and other factors, but the purchase of parchment for SWC is more competitive than the purchase of cherries
by washing stations, and as a result it seems that the purchase price is the same as that of other companies.15
Nevertheless, the price is adjusted based on the extraction rate.
Parchment for SWC is brought to secondary processors via multiple middlemen from all over the country,
which makes it difficult to specify the growing region, and unlike FWC, SWC can be sold in the broad
category of “commodity class” and thus is generally not managed by lot.
3-2-4. Distribution of FWC and SWC: Export overseas
Green coffee processed by secondary processors is exported by exporters with export licenses.
Many secondary processors hold export licenses and also run export businesses, but secondary processors who
do not have an export license entrust the export process to exporters. Table 3-8 shows exporters and their
export volume.
13 Based on an interview with RWACOF (June 17, 2013). 14 Based on an interview with RWACOF (June 17, 2013). 15 Based on an interview with Rwanda Trading Company (June 18, 2013)

― 20 ―
Table 3-8: List of exporters and export volume by operator (fiscal year ending in December 2011)
Order Exporter
Export
volume
(tons)
Export
shareOrder Exporter
Export
volume
(tons)
Export
share
1 RWACOF 5,360 32.75% 23 KMG GENERAL TRADING 69 0.42%
2 Coffee Business Center (CBC) 3,372 20.60% 24 RWABISINDU 59 0.36%
3 Rwanda Trading Company 1,248 7.63% 25 IMENA 58 0.35%
4 K.A.C.C 915 5.59% 26 COPROFICAG 58 0.35%
5 COOPAC 770 4.70% 27 BUSOZO COFFEE 58 0.35%
6 ENAS 644 3.93% 28 COFFEE VISION COOPERATIVE 38 0.23%
7 RWASHOSCO 593 3.62% 29 MIG 36 0.22%
8 SOPECAF 444 2.71% 30 SAKE COFFEE PLANTATION 33 0.20%
9 MISOZI COFFEE 419 2.56% 31 LAND OF THOUSAND HILLS 30 0.18%
10 CAFERWA 308 1.88% 32 TQ INTER-CROPS 28 0.17%
11 KAYCO 288 1.76% 33 GLOBAL BUSINESS SERVICE 22 0.13%
12 GREENLAND COFFEE CO 285 1.74% 34 IMPEXCOR 22 0.13%
13 SOCOR 189 1.15% 35 SHENGA 20 0.12%
14 GATARE COFFEE 127 0.78% 36 SHINNING COFFEE 19 0.12%
15 A.P.I 121 0.74% 37 COCAM 19 0.12%
16 AGRO-LINK COFFEE 115 0.70% 38 WEST HILLS COFFEE 19 0.12%
17 N.C.M.C 104 0.64% 39 GORILLA MOUNTAIN COFFEE 18 0.11%
18 CMTC 104 0.64% 40 LIFEMATE 12 0.07%
19 RUSIZI SPECIALITY COFFEE 96 0.59% 41 GOLDLEAF RWANDA 10 0.06%
20 DALLAS INVESTMENT 86 0.53% 42 KARENGERA 3 0.02%
21 RWANDA MOUNTAIN COFFEE 77 0.47% 43 BOURBON COFFEE 1 0.01%
22 SACOF 71 0.44% Total 16,369 100.00%
Source: NAEB (2012)
Some exporters and secondary processors provide market and export agent services. This is not a service
whereby another secondary processor buys the green coffee and sells them to an overseas importer for a profit,
but rather is a type of consignment sale whereby the operator takes a fee, markets the coffee in place of the
secondary processor, finds an exporter for the green coffee and serves as the agent for their export. IN addition
to this agent service, some operators process the parchment on consignment.16 There are consignment fees
and agent fees, but in the case of one operator, the parchment consignment processing fee was 35 RWF/kg and
the marketing and export agent service fee was 5% of the contract amount with the buyer. In the event that the
green coffee is transported from Kigali to the port at the seller’s expense, another 14 cents/kg is incurred. The
16 Judging from what could be confirmed in the local study, RWACOF and Rwanda Trading Company, which are the biggest
secondary processors cum exporters, provide consignment processing of parchment and green coffee marketing and export agent services.
― 21 ―
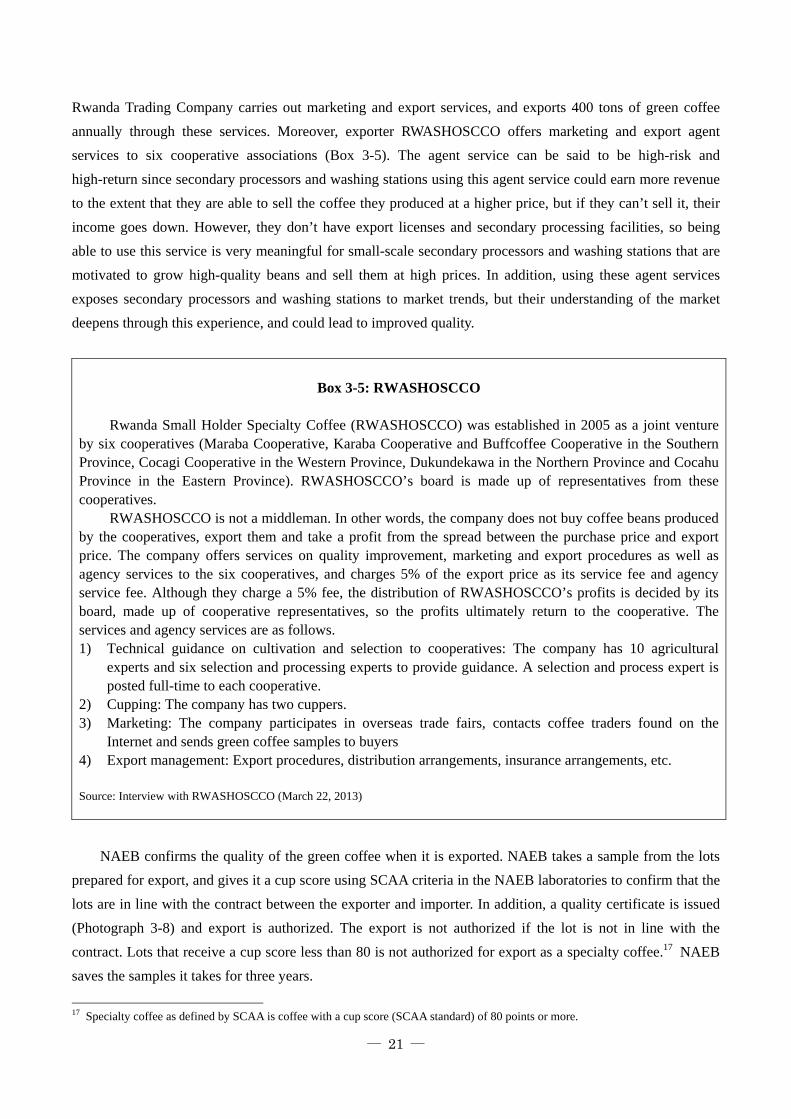
Rwanda Trading Company carries out marketing and export services, and exports 400 tons of green coffee
annually through these services. Moreover, exporter RWASHOSCCO offers marketing and export agent
services to six cooperative associations (Box 3-5). The agent service can be said to be high-risk and
high-return since secondary processors and washing stations using this agent service could earn more revenue
to the extent that they are able to sell the coffee they produced at a higher price, but if they can’t sell it, their
income goes down. However, they don’t have export licenses and secondary processing facilities, so being
able to use this service is very meaningful for small-scale secondary processors and washing stations that are
motivated to grow high-quality beans and sell them at high prices. In addition, using these agent services
exposes secondary processors and washing stations to market trends, but their understanding of the market
deepens through this experience, and could lead to improved quality.
Box 3-5: RWASHOSCCO
Rwanda Small Holder Specialty Coffee (RWASHOSCCO) was established in 2005 as a joint venture
by six cooperatives (Maraba Cooperative, Karaba Cooperative and Buffcoffee Cooperative in the Southern Province, Cocagi Cooperative in the Western Province, Dukundekawa in the Northern Province and Cocahu Province in the Eastern Province). RWASHOSCCO’s board is made up of representatives from these cooperatives.
RWASHOSCCO is not a middleman. In other words, the company does not buy coffee beans produced by the cooperatives, export them and take a profit from the spread between the purchase price and export price. The company offers services on quality improvement, marketing and export procedures as well as agency services to the six cooperatives, and charges 5% of the export price as its service fee and agency service fee. Although they charge a 5% fee, the distribution of RWASHOSCCO’s profits is decided by its board, made up of cooperative representatives, so the profits ultimately return to the cooperative. The services and agency services are as follows. 1) Technical guidance on cultivation and selection to cooperatives: The company has 10 agricultural
experts and six selection and processing experts to provide guidance. A selection and process expert is posted full-time to each cooperative.
2) Cupping: The company has two cuppers. 3) Marketing: The company participates in overseas trade fairs, contacts coffee traders found on the
Internet and sends green coffee samples to buyers 4) Export management: Export procedures, distribution arrangements, insurance arrangements, etc. Source: Interview with RWASHOSCCO (March 22, 2013)
NAEB confirms the quality of the green coffee when it is exported. NAEB takes a sample from the lots
prepared for export, and gives it a cup score using SCAA criteria in the NAEB laboratories to confirm that the
lots are in line with the contract between the exporter and importer. In addition, a quality certificate is issued
(Photograph 3-8) and export is authorized. The export is not authorized if the lot is not in line with the
contract. Lots that receive a cup score less than 80 is not authorized for export as a specialty coffee.17 NAEB
saves the samples it takes for three years.
17 Specialty coffee as defined by SCAA is coffee with a cup score (SCAA standard) of 80 points or more.

― 22 ―
Exporters who carry out marketing
activities participate in overseas trade
fairs and sends samples to previous
buyers, but do not carry out proactive
activities. Its activities amount to simply
selling to buyers who contact them after
learning of the coffee’s reputation. Some
exporters have parent companies that are
international coffee traders or major
overseas roasters. In this case, the parent
company secures buyers for the exporter,
so they may feel they do not need to
actively engage in marketing activities.
In particular, the parent company tends
to have selling channels for SWC, and
usually does not interact directly with
customers.18
As regards product standards and
types, it is most typical for exporters to
sell coffee at the standard required by the
individual buyer rather than to market and
form contracts for coffee with standards
set by the exporter and NAEB and agree
on contracts. For example, one major exporter had many requests for green coffee beans with a size exceeding 13
screens through 2010, so the exporter sold coffee with a 13 or higher screen size, but from 2011 requests were for
screen sizes of 15 or more, so the exporter sold beans at screen sizes of 15 or higher. However, some exporters sell
their own company brand (Box 3-6), while some cooperatives acquire certification and sell their coffee as fair trade
coffee.
18 Based on interviews with RWACOF (March 22, 2013).
Photograph 3-8: Quality certification issued by NAEB

― 23 ―
Box 3-6: Rwanda Trading Company’s brand
Rwanda Trading Company markets coffee unders its own brand name and standards, as shown in Table
3-9. The brand name “Inzovu” means “elephant” and “trustworthy” in the local language. Specialty coffee is bought in bulk so Inzovu includes a mix of green coffee meeting the same standards, with annual exports of almost 1,000 tons. Inzovu Supreme is particularly high-quality, and is managed and sold by lot.
Table 3-9: Rwanda Trading Company’s green coffee standards
Product name Standard
Packaging at exportFWC/SWC Screen size Defective beans Cup score Other
Inzovu Supreme FWC 15 or more Zero 85 points or
higher GrainPro
Inzovu FWC 13 or more 10 or less 80 points or
higher
Packaging similar to
GrainPro
Screen 13/14 F C 13, 14 - 80 points or
higher Clean cup
Packaging similar to
GrainPro
Ordinary SWC 13 or more 30 or less 70 points or
higher
Packaging similar to
GrainPro
FW(B) FWC - - - Triage Jute bag
SW(B) SWC - - - Triage Jute bag
Source: Prepared by Survey team based on interviews.
Box 3-7: Uses of fair trade-certification premiums
Example 1: Maraba Cooperative
Cost of fair trade certification application and inspection, new washing station, expansion of existing washing station (such as setting up drainage treatment facility), secondary payments to cooperative members Example 2: COOPAC
Use of premiums is decided at cooperative meetings. Up until this point, the cooperative has bought 350 cows and 700 goats and built three schools
Source: Survey team, based on local interviews
The business terms for Rwanda-grown coffee is generally Free on Truck (FOT) or Free on Board (FOB).
FOT means that the seller bears the cost until the cargo is loaded onto the truck at the export site, and
subsequent costs and risk is borne by the buyer.19 Once the green coffee is loaded onto the truck in Kigali, all
19 FOT is not a trading condition set in Incoterms as stipulated by the International Chamber of Commerce.
― 24 ―
the responsibility shifts to the importer, so in general FOT is not advantageous for the importer. FOT is typical
in Rwanda-grown coffee transactions because exporters want to include FOT in the terms of their contracts,
but another factor is that the exporter’s capacity regarding export procedures and export arrangements has not
yet been built up enough. According to local interviews, FOT is often used with SWC, and FOB is used with
FWC. This is likely because SWC buyers include a relatively large number of traders with networks in East
Africa who are familiar with the locale in handling large volumes of green coffee.
3-3. Distribution
One of the biggest concerns when importing Rwandan coffee is its distribution.20 In this section, we
summarize the current conditions for distribution.
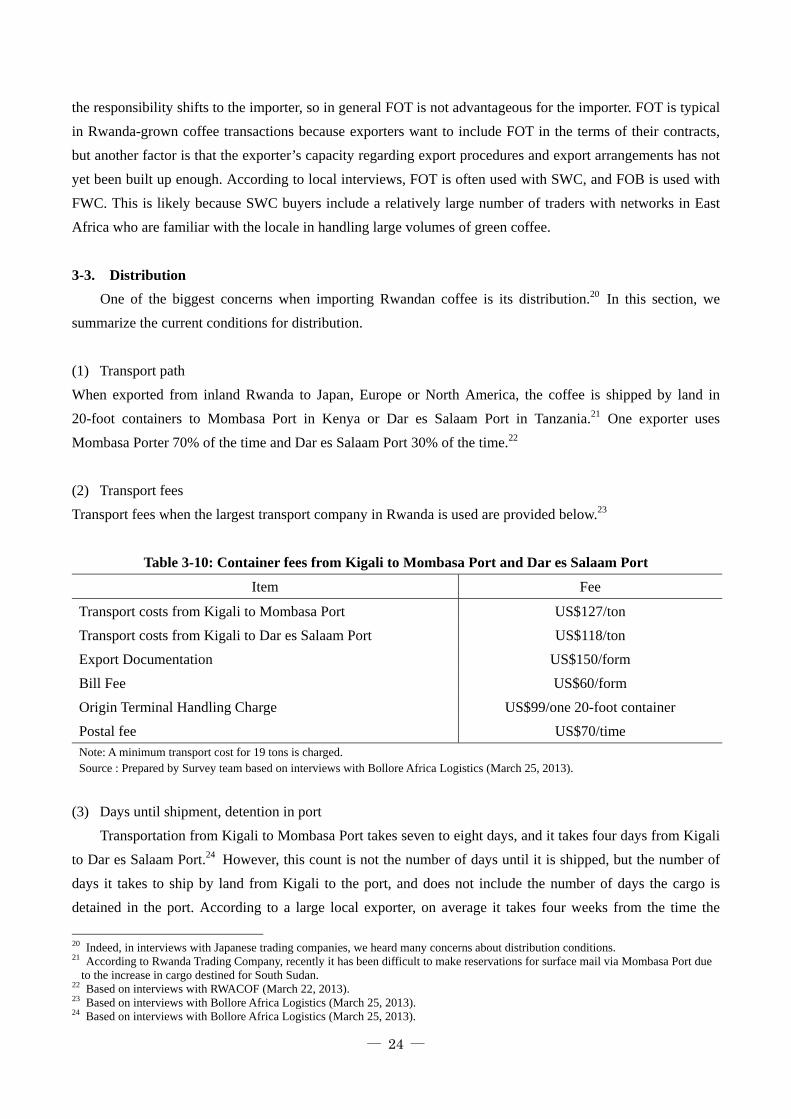
(1) Transport path
When exported from inland Rwanda to Japan, Europe or North America, the coffee is shipped by land in
20-foot containers to Mombasa Port in Kenya or Dar es Salaam Port in Tanzania.21 One exporter uses
Mombasa Porter 70% of the time and Dar es Salaam Port 30% of the time.22
(2) Transport fees
Transport fees when the largest transport company in Rwanda is used are provided below.23
Table 3-10: Container fees from Kigali to Mombasa Port and Dar es Salaam Port
Item Fee
Transport costs from Kigali to Mombasa Port US$127/ton
Transport costs from Kigali to Dar es Salaam Port US$118/ton
Export Documentation US$150/form
Bill Fee US$60/form
Origin Terminal Handling Charge US$99/one 20-foot container
Postal fee US$70/time Note: A minimum transport cost for 19 tons is charged. Source : Prepared by Survey team based on interviews with Bollore Africa Logistics (March 25, 2013).
(3) Days until shipment, detention in port
Transportation from Kigali to Mombasa Port takes seven to eight days, and it takes four days from Kigali
to Dar es Salaam Port.24 However, this count is not the number of days until it is shipped, but the number of
days it takes to ship by land from Kigali to the port, and does not include the number of days the cargo is
detained in the port. According to a large local exporter, on average it takes four weeks from the time the
20 Indeed, in interviews with Japanese trading companies, we heard many concerns about distribution conditions. 21 According to Rwanda Trading Company, recently it has been difficult to make reservations for surface mail via Mombasa Port due
to the increase in cargo destined for South Sudan. 22 Based on interviews with RWACOF (March 22, 2013). 23 Based on interviews with Bollore Africa Logistics (March 25, 2013). 24 Based on interviews with Bollore Africa Logistics (March 25, 2013).

― 25 ―
cargo arrives in Kigaili until it is shipped.25 There were even reports that the cargo was detained several
months in the port, which lowered the quality of the green coffee. Export arrangements by local carriers do
not try to reserve the shipment service so that it is well-timed with the departure from Kigali in order to
shorten the detention period, but rather they reserve the shipment service when the cargo has been loaded into
containers in Kigali, and at the same time leave Kigali so that they are not late for the reserved ship and wait
for the boat to arrive in the port.26 Accordingly, the cargo is detained in the port to the extent that it departs
Kigali with time to spare.
(4) Transshipment of cargo from land transport containers to marine containers
Since imports are more common in Rwanda than exports, return runs of containers used in importation
often exceed the amount that can be used, and these return runs are thus used to export green coffee beans. It
is rare for these return runs to be international maritime transport containers owned by shipping companies
using them from the port. Even if this is the case, they have not been arranged for the transport of green coffee,
which makes it difficult to use the return run containers for international transort. In other words, after the
green coffee is transported by land in return-run containers to Mombasa Port or Dar es Salaam Port, the cargo
is all removed from the return-run container, and transferred to the international maritime transport containers
used by the shipping company.27 Accordingly, when they are loaded in Kigali, the seal affixed to the container
is cut in the port, and a new seal is affixed to the international maritime transport container to which the cargo
is transferred. Opening the container again in the port and moving it to a separate container after it has been
sealed in Kigali carries the risk of loss and theft of the cargo, damage to the cargo, and mixing with other
cargo, among other risks. In particular, in the case of Rwanda, there are many cases in which the green coffee
is traded on an FOT basis, as described above, and the buyer is responsible after the container is loaded in
Kigali, which means that reloading in the port is a major concern for the buyer.
According to a major carrier in Kigali, there is no precedent for containers used by the shipping
companies to be brought empty from the port to Kigali, then fumigated, loaded and sealed, and then the cargo
transported in the same container to the destination port. The carrier was not sure if this could be arranged.28,29
Even if it could be arranged, the round-trip transport costs would have to be covered, which would make the
transport costs much higher. Table 3-10 shows the transport fees if the return-run containers are used, but the
round-trip transport costs would be more than twice as high. Since there are many extra return-run containers
used for imports in Rwanda, where there are more imports than exports, the land transport fees to the port
using the return-run containers would be much less than the land transport fees from the port to Kigali.30 The
round-trip transport costs, including the land transport costs from the port to Kigali, would be about four times
higher than the transport fees shown in Table 3-10, which assume the use of return-run containers, as is the
current practice.31
25 Based on interview with Rwanda Trading Company (March 21, 2013). 26 Based on interviews with Bollore Africa Logistics (March 25, 2013). 27 Return-run containers are used to transport the green coffee by land without fumigating them first. 28 Based on interviews with Bollore Africa Logistics (March 25, 2013). 29 There is a fumigator in Kigali. 30 Based on interviews with Bollore Africa Logistics (March 25, 2013) and Rwanda Trading Company (March 21, 2013). 31 Based on interviews with Bollore Africa Logistics (March 25, 2013).

― 26 ―
(5) Refrigerated containers
In Rwanda, refrigerated containers are not used, including for the transport of products other than coffee.
Refrigerated trucks are used for refrigerated and frozen products. According to a major carrier in Rwanda, this
carrier had not arranged for refrigerated containers before, but it would likely be possible if the costs were
covered.32 However, transport by refrigerated container requires appropriate temperature and power source
management and loading techniques that would not prevent the circulation of cool air, and if there are
mistakes with this, the green coffee could be significantly damaged. Given the sophisticated management
technology required of the carrier, at present it would be difficult to transport green coffee from Rwanda using
refrigerated containers.
(6) Transport capacity of exporters and carriers
Although our information is limited by what we could confirm with relevant people in this Survey, it
seems that there is room for improvement in the transport capacity of local exporters and carriers. Trading
companies that import green coffee from Rwanda have pointed out that local exporters and carriers are not
accustomed to the export procedures and transport arrangements, and thus the process is time-consuming.
Moreover, they are not accustomed to handling green coffee. It was also pointed out that some local exporters
do not communicate and coordinate enough with importers and shippers to ensure that transport procedures
move ahead without delay.
(7) Materials and equipment for transport
GrainpPro33 imported from overseas can be obtained in Rwanda, and is used by Rwandan exporters. NAEB
purchased a vacuum packing machine in 2008, which can be used by all operators. We were not able to
confirm whether nitrogen substitution materials were available, at least judging from interviews with NAEB
and exporters in the local Survey.
3-4. Domestic market
Domestic sales of roasted coffee beans grown in Rwanda totaled 116.8 tons in the 2011/2012 fiscal year
(Table 3-11), which is only 1% of the 19,955 tons of green coffee production in that year (Table 3-2), but this
is four times as high as the 32.2 tons consumed domestically in the 2004/2005 fiscal year and indicates that
domestic sales of Rwandan-grown coffee is growing.
32 Based on interviews with Bollore Africa Logistics (March 25, 2013). 33 This is a special vinyl bag for storage developed by GrainPro Inc. that can preserve freshness.

― 27 ―
Table 3-11: Fluctuations in domestic sales volume of Rwandan-grown coffee (roasted beans) (Unit: tons)
Fiscal year 2004/05 2005/06 2006/07 2007/08 2008/09 2009/10 2010/11 2011/12
Domestic volume sold of roasted
beans 32.2 32.2 65.8 99.4 102.7 328.9 n.a. 116.8
n.a. = not available Source: NAEB (2012)
Table 3-12 shows the main roasters in Rwanda. Many roasters primarily operate washing stations or
export green coffee, with the manufacture and sale of roasted beans given an ancillary role. For example,
RWACOF’s main operations are to market and export the green coffee produced by the cooperative, and Huye
Mountain Coffee and SAKE Coffee’s main operations are the administration of washing stations.
Not all roasting businesses own their own roasting machines and roast the beans themselves; some
outsource the roasting. Rwanda Trading Company, NAEB and Coffee Connection have roasting machines
with a capacity of about 50 kg, the largest capacity in Rwanda, while Bourbon Coffee has a 15 kg-capacity
roasting machine and RWASHOSCCO has a 12 kg-capacity machine, but Huye Mountain Coffee outsources
its roasting. The outsourcing fee for roasting is 20 cents/kg in the case of the Rwanda Trading Company.
Packaging is imported from abroad. Imported products from China are 200 RWF/bag (about 30 cents a
bag). They are packed by hand.
Table 3-12: Rwanda’s roasters (2011/12)
Order Roaster Volume sold
(tons) Share (%) Order Roaster
Volume sold (tons)
Share (%)
1 RWASHOSCCO 50.8 43.5% 6 TORA 5.4 4.6%
2 KINUNU 28.7 24.6% 7 HUYE Mountain
Coffee 1.9 1.6%
3 Bourbon Coffee 11.1 9.5% 8 SAKE Coffee 1.0 0.9%
4 LIFEMATE 8.9 7.6% 9 NAEB 0.9 0.8%
5 SACOF 7.4 6.4% 10 MIG 0.7 0.6%
Source: NAEB (2012)
The roasted beans are distributed to supermarkets, family-run stores, hotels, restaurants and gift shops. In
a large foreign-capital supermarket in Kigali, Rwanda-grown coffee sells better than tea and imported
foreign-grown coffee, and coffee has a shelf space that is two to three times more than tea, with efforts put
into its sale (Box 3-8). Nevertheless, almost all of the buyers are foreigners, and buying by Rwandans has not
increased much over the past few years. Coffee is sold at family-run stores and local supermarkets, where few
foreigners go, but only a few products are available, with a better lineup for tea. In general, Rwandans drink
tea rather than coffee, and coffee availability is limited in stores other than supermarkets for foreigners.
The price of coffee is high. The price of roasted coffee sold in a Kigali supermarket (Table 3-13) was
3,700-4,700 RWF (about US$6.50) for a 500g bag and 2,100-2,600 RWF (about US$4.00) for a 250g bag, and

― 28 ―
expensive Bourbon Coffee costs as much as 6,000 RWF (about US$9.80) for a 340g bag.34 The price for a
cup of coffee is 74-94 RWF35 in the case of a 500g bag, which is two to three times higher than the 32
RWF/cup cost of Rwanda Mountain Tee, a domestically grown high-class brand. Rwandans like to drink tea
and tend not to drink coffee, but one reason for this likely lies in the high cost of coffee, and is not an issue of
custom or preference.
(Upper) Coffee display case at Nakumatt, a large foreign-capital supermarket (Lower left) Small supermarket in Kigali; the middle shelf displays coffee, and the lower shelf displays tea. (Lower right) Family-run store located side-by-side with Kigali’s traditional market; only a few brands of coffee are displayed. Source: Photographs taken by Survey team.
Photograph 3-9: Rwandan coffee sold at supermarkets and family-run stores
34 Sales prices at local supermarkets were about the same and generally do not differ. 35 10 grams of roasted beans are used for one cup of coffee.

― 29 ―
Table 3-13: Sales price of roasted coffee in Kigali supermarkets
Product name, brand Price Product name, brand Price
Maraba 4,700 RWF/500g Bourbon Coffee 6,000 RWF/340g
TORA 4,000 RWF/500g AROMEC 2,600 RWF/250g
Rwanda Coffee (NAEB/OCIR) 3,700 RWF/500g KIVU Bourbon 2,400 RWF/250g
KINUNU 2,100 RWF/250g
[Reference: Price of teabags]
Rwanda Mountain Tee 1,600 RWF/bag of 50 teabags (32 RWF per teabag) Source: Prepared by Survey team; based on visit to supermarket Nakumatt (March 20, 2013).
Box 3-8: Sales of coffee in supermarkets
According to a purchase manager at Nakumatt, a supermarket owned by a South African company,
coffee sales conditions are as follows. Sales trends: Rwanda-grown coffee sells well. The manager’s sense was that sales had doubled compared to
four years ago. The product lineup has also increased, so that a few years ago they only sold four types, and currently sell eight types of coffee. They also sell imported foreign-grown coffee, but Rwanda-grown coffee sells better. Coffee sells much better than tea.
Most popular products: Maraba has the best sales, followed by Rwanda Coffee, KINUNU and KIVU Bourbon. Ground coffee sells about twice as well as coffee beans.
Patron base: Foreigners make up most of the buyers. Buying by Rwandans has not increased much compared to several years ago.
Procurement: There are no particular problems with procurement; products arrive quickly after they are ordered.
Expectations for coffee: A great deal of energy is put into coffee. A large sales floor is set aside for coffee, and the display is also carefully arranged. Prices are high, so the purchase manager felt that it would be good if prices were cheaper.
Source: Prepared by Survey team based on interview on June 24, 2013.
The Bourbon Coffee Café is a famous Rwandan coffee shop (Photograph 3-10). Bourbon Coffee opened
its first store in 2007 and currently has five stores in Kigali and two in the US. In addition to drip coffee,
cappuccino and coffee drinks, they offer fruit-based drinks such as juice and smoothies, but according to the
café, it is these fruit-based drinks that are most popular among Rwandans, and they rarely drink the coffee
drinks. When we visited Bourbon Coffee Café, few Rwandans ordered coffee drinks. Although cafes are
beginning to become more common in Rwanda, customers do not seem to gather in cafes for coffee.
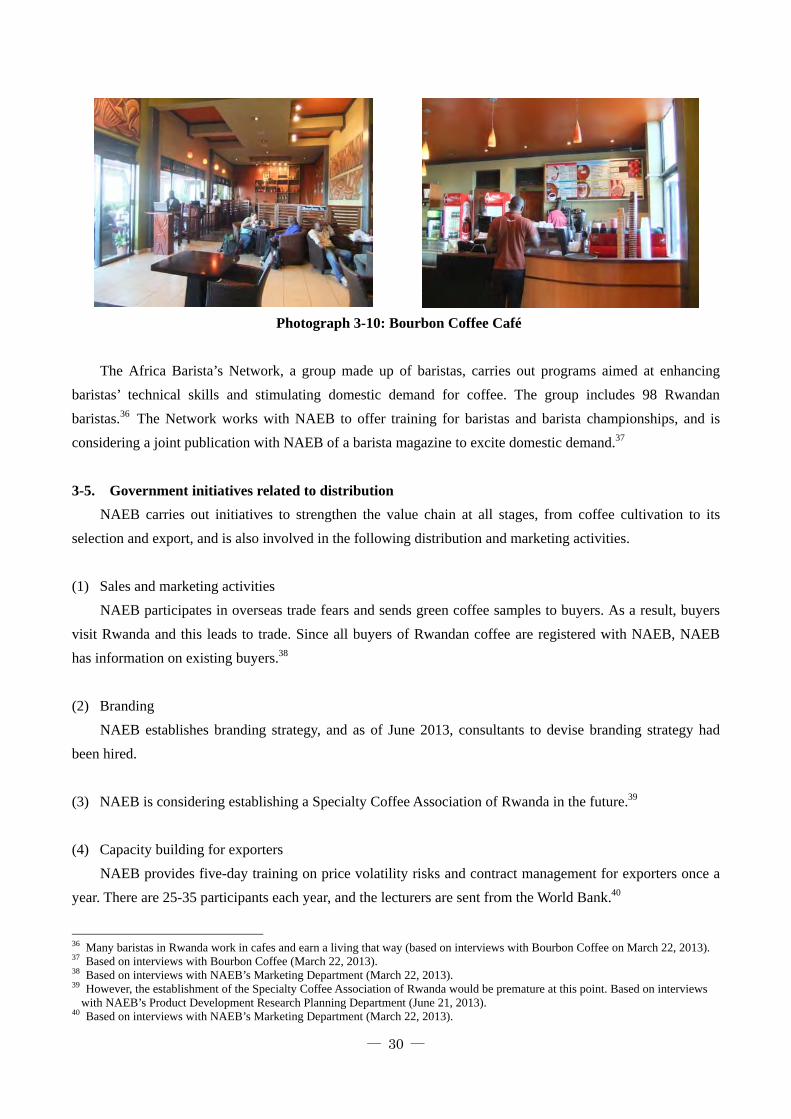
― 30 ―
Photograph 3-10: Bourbon Coffee Café
The Africa Barista’s Network, a group made up of baristas, carries out programs aimed at enhancing
baristas’ technical skills and stimulating domestic demand for coffee. The group includes 98 Rwandan
baristas.36 The Network works with NAEB to offer training for baristas and barista championships, and is
considering a joint publication with NAEB of a barista magazine to excite domestic demand.37
3-5. Government initiatives related to distribution
NAEB carries out initiatives to strengthen the value chain at all stages, from coffee cultivation to its
selection and export, and is also involved in the following distribution and marketing activities.
(1) Sales and marketing activities
NAEB participates in overseas trade fears and sends green coffee samples to buyers. As a result, buyers
visit Rwanda and this leads to trade. Since all buyers of Rwandan coffee are registered with NAEB, NAEB
has information on existing buyers.38
(2) Branding
NAEB establishes branding strategy, and as of June 2013, consultants to devise branding strategy had
been hired.
(3) NAEB is considering establishing a Specialty Coffee Association of Rwanda in the future.39
(4) Capacity building for exporters
NAEB provides five-day training on price volatility risks and contract management for exporters once a
year. There are 25-35 participants each year, and the lecturers are sent from the World Bank.40
36 Many baristas in Rwanda work in cafes and earn a living that way (based on interviews with Bourbon Coffee on March 22, 2013). 37 Based on interviews with Bourbon Coffee (March 22, 2013). 38 Based on interviews with NAEB’s Marketing Department (March 22, 2013). 39 However, the establishment of the Specialty Coffee Association of Rwanda would be premature at this point. Based on interviews
with NAEB’s Product Development Research Planning Department (June 21, 2013). 40 Based on interviews with NAEB’s Marketing Department (March 22, 2013).

― 31 ―
(5) Financial support
NAEB hosts a meeting to mediate between six to seven banks and all exporters. At this meeting, they
discuss conditions for coffee producers, and decisions are made on whether the banks would make loans to the
exporters and what the loan terms and conditions will be. NAEB’s role at this information is to provide
accurate information and ensure that the meeting is transparent.41
(6) Program to improve management of washing stations (turnaround program)
As of the end of 2007, 70% of washing stations were in the red,42 which hindered the government’s
ambition to increase production of FWC. Accordingly, NAEB began implementing a program to improve
washing station management in 2011. This program involves the dispatch of a management adviser to the
washing stations targeted for support for five months. This program targets washing stations run by
cooperatives, and helped 20 stations in 2011, 30 in 2012 and 25 in 2013. According to NAEB, the program
yielded results at some washing stations, with improvements in their management conditions.43
(7) Training to develop Q graders
NAEB brings instructors over from the US to provide training for existing Q graders and training for
those who aspire to become Q graders.
(8) Promotion of domestic consumption.
NAEB sponsors events in all provinces called Coffee Days, in which people drink coffee while enjoying
pleasant talks with each other. There are 1,000-2,000 participants in these events in each province. Coffee is
provided free of charge at domestic events and coffee is exhibited at private-sector trade fairs to stimulate the
domestic consumption of coffee.44
41 Based on interviews with NAEB’s Marketing Department (March 22, 2013). 42 Promar Consulting (2012) 43 Based on interviews with NAEB’s Product Development Research Planning Department (March 23, 2013). 44 Based on interviews with NAEB’s Marketing Department (June 24, 2013).

― 32 ―
Chapter 4 Production
4-1. Cultivation
According to a coffee census carried out in 2009, there are 394,207 coffee farms in Rwanda, and 72
million coffee trees are growing. There are 183 trees per farm, which means that the scale of coffee cultivation
is very small.
Table 4-1: Number of coffee farms and trees
Region No. of coffee farms No. of coffee trees No. of trees per farm
Eastern Province 51,141 16,390,327 320
Northern Province 58,858 8,846,393 150
Western Province 143,150 23,073,520 161
Southern Province 133,781 22,425,292 168
Kigali 7,277 1,328,380 183
Total 394,207 72,063,912 183Source: OCIR Cafe (2009)
(1) Varieties
According to the Rwanda Agricultural Board, the varieties most commonly planted in Rwanda are the
following six.
1) Bourbon Mayaguez 139 (BM 139)
2) Bourbon Mayaguez 71 (BM 71)
3) Bourbon Mibirizi
4) Jackson 2 / 1257 (J2 1257)
5) Harrar
6) Population 3303 (Pop 3303)
Numbers 1) through 4) are Bourbon varieties. NAEB distributes seedlings for varieties 1), 2) and 4),
depending on the region, and does not recommend the other varieties.
(2) Nursery beds
Raising good seedlings is key to cultivating coffee. However, this Survey could not confirm that any
farmers or cooperatives were growing seedlings properly. NAEB distributes varieties for the nursery beds, and
every region has a nursery bed. NAEB posts two coffee managers to each district, who manage the nursery
beds and guide farmers, but these managers need to teach the farmers how to grow seedlings, in cooperation
with washing stations and cooperatives.
(3) Layout of coffee farms
The farm layout is a very important aspect of coffee growing as it has a direct effect on the efficiency of

― 33 ―
farm work and the crop yield. The layout must be determined by taking into account natural conditions such
as the soil, elevation, rainfall and geography, ease of access for carrying farm implements and the harvest, and
the usable workforce, as well as the varieties being grown. However, none of the coffee farms that we visited
had appropriate layout, and there was room for significant improvement in the following areas:
1) The trees are not planted at intervals that are appropriate for their variety, and overall the spacing
between trees is too wide. The average Rwandan planting rate is 2,000-2,500 trees/ha, but it could be
increased to 4,000 trees/ha.
2) Coffee is generally planted along the contour in the case of farms along an incline. This enables the
ridges to track the contour and prevent soil erosion, and work efficiency does not decline even on
inclined ground. However, it is not easy to understand cultivation methods for inclined ground, and
ridges were created one above the other.
3) Few farmers and other stakeholders recognize the importance of layout
Designing an appropriate layout raises yield and working efficiency, and ensures that trees are not missed
when pruning and applying fertilizer and pesticide. However, it is risky to unsystematically change the layout
by adding trees without careful thought on farms where trees have already been planted.
Note: Coffee farm on which trees were planted in 2010. The gap between trees is wide and uneven. Trees are not planted along the contour. Source: Photograph by Survey team
Photograph 4-1: Coffee farm on inclined ground
(Rwanda)
(4) Pruning
Pruning is essential to restore trees that have lost productivity and maintain yield. However, since the
basics about tree growth and harvests are not understood in Rwanda, the trees are let to grow without
intervention, and trees are not restored with pruning. As a result, almost all trees lack fruit anywhere except at
the tip of the branch and there are no branches until about 1.5 meters along the trunk from the ground’s

― 34 ―
surface. Since some farmers believe that cutting the branches would kill the tree or take away their income,
the pruning methods called the “agobio” and “parras” methods, which results in little reduction in yields
between the pruning and the tree’s rejuvenation, would likely be generally accepted in Rwanda. Accordingly,
Accordingly, in the local Survey, we instructed farmers by demonstrating the agobio and parras methods on
actual trees. However, proper management is essential after the pruning, so the farmers must continue to be
instructed on this point.
Note: There are no branches along the lower part of the trunk, so productivity in this area is zero. Source: Photography taken by Survey team
Note: There are no branches along the lower part of the trunk, so productivity is poor, and the tree bends as it cannot handle the heaviness of the upper part. Side branches do grow from the bent part, but if left unattended, the tree will become unmanageable with too many main branches. Source: Photography taken by Survey team
Photograph 4-2: Trees that have not been pruned
(2, Rwanda)
Photograph 4-3: Trees that have not been pruned
(1, Rwanda)
Note: Branches flourish from the lower half to the upper half, and the entire tree is productive. Source: Mi Cafeto
Photograph 4-4: Well-managed tree (Hawaii)

Note: The trewith a wire. Tbent part. AftSource: tecniSalvadoreno d
Figu
(5) Shade-g
Many c
dry period i
leafy growth
coffee farme
bananas and
moisture and
can invite da
grown, tall t
fixation, are
planting soy
and provide
(6) Fertilize
NAEB
compost ma
Moreover, th
fertilizer app
cultivation d
line with the
allows, and a
ee is forcibly bThe following yter the harvest, ticas modernas de Investigacio
ure 4-1: Ago
grown
coffee farms
is prolonged
h is abundan
ers in Rwan
d plantains, w
d nutrients fr
amage from
trees in the le
e preferable.
ybeans and a
farmers with
er applicatio
distributes
ade from the
he soil is ha
plications, it
density and o
e weather and
a fertilizer pr
ent at 45 degreyear, a harvest cthe point of thepara el cultiv
nes del Café
obio (prunin
in Rwanda
d, which ma
nt as shade i
nda are smal
would be w
rom the soil
disease and
egume family
In addition,
azuki beans b
h secondary
n
fertilizer to
e coffee pul
ard, so comp
t would be d
obtain high y
d the trees’ g
rogram devis
ees and held incan be taken fro tree is cut off.
vo del café In
ng method)
are on inclin
akes shade-g
is provided t
ll-scale farm
ell-suited. H
and could ha
harmful inse
y, which hav
, whether th
between tree
food and inc
o farmers vi
lp, but fertil
post must be
difficult to ca
yields throug
growth status
sed based on
― 35 ―
n place om the
nstituto
Note:The mSourcSalva
ned ground
grown cultiva
to limit sun
mers, so shad
However, ban
ave a negativ
ects. Accordi
ve little risk o
he region is c
es is recomm
come.
ia washing
lizer applica
e worked in
arefully plan
gh pruning. R
s, soil and le
n the results o
The trunk is bmethod of bendice: tecnicas madoreno de Inve
Figure 4-
and soil ero
ation approp
exposure, th
de trees that
nana and pla
ve effect on
ingly, in regi
of insect dam
capable of p
mended to en
stations, an
ation is inad
to soften th
n out a layou
Regular ferti
aves should
of this analys
bent in four diing is the same
modernas para stigaciones del
-2: Parras (p
sion is very
priate. On sh
hus stimulati
t could prov
antain trees a
coffee growt
ions where h
mage and also
producing hi
nrich the soil
d some wa
dequate and
he ground. In
ut that would
ilizer applica
be analyzed
sis.
irection to begas for the agobel cultivo del Café
pruning met
common. M
hade-grown
ing photosyn
vide cash cr
absorb vast
th, while citr
high-quality c
o are a sourc
igh-quality c
l due to nitro
ashing statio
malnutrition
n particular,
d create a fie
ations should
once a year
in new growthbio method. l café Instituto
thod)
Moreover, the
coffee trees
nthesis. Mos
rops, such a
quantities o
rus fruit tree
coffee can be
ce of nitrogen
coffee or not
ogen fixation
ns distribute
n is marked
with curren
eld with high
d be made in
if the budge
h.
o
e
s,
st
s
f
s
e
n
t,
n
e
d.
nt
h
n
et
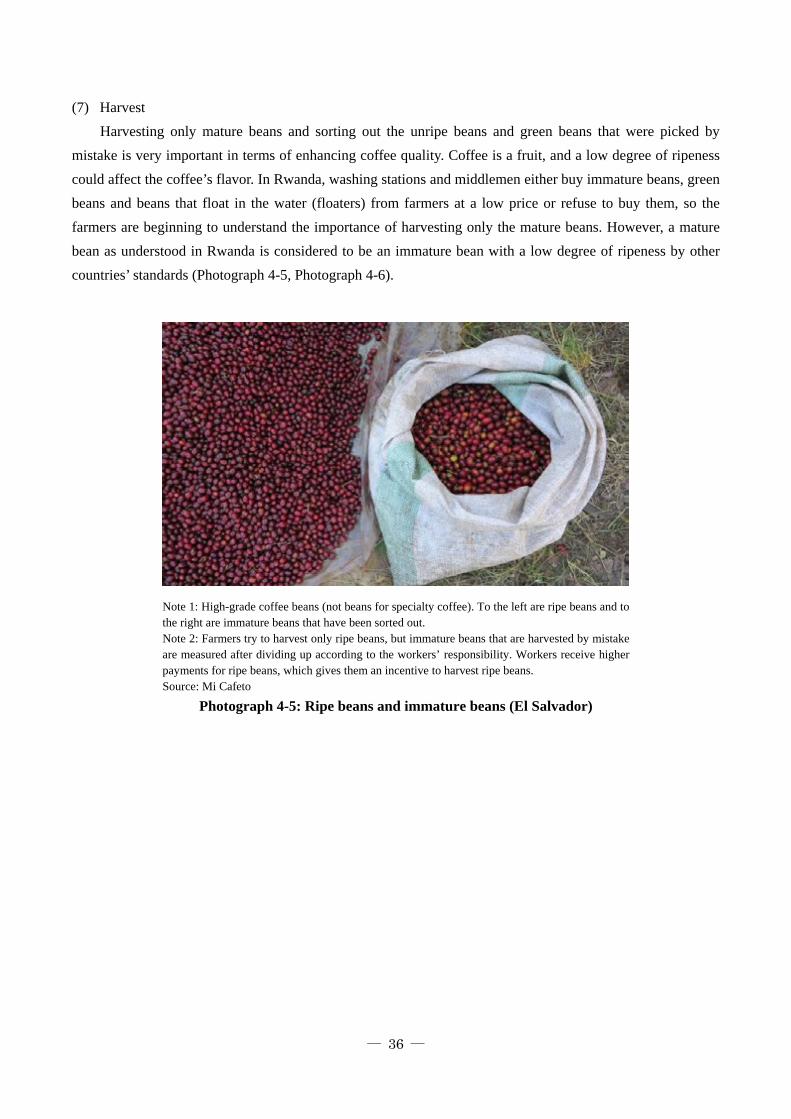
― 36 ―
(7) Harvest
Harvesting only mature beans and sorting out the unripe beans and green beans that were picked by
mistake is very important in terms of enhancing coffee quality. Coffee is a fruit, and a low degree of ripeness
could affect the coffee’s flavor. In Rwanda, washing stations and middlemen either buy immature beans, green
beans and beans that float in the water (floaters) from farmers at a low price or refuse to buy them, so the
farmers are beginning to understand the importance of harvesting only the mature beans. However, a mature
bean as understood in Rwanda is considered to be an immature bean with a low degree of ripeness by other
countries’ standards (Photograph 4-5, Photograph 4-6).
Note 1: High-grade coffee beans (not beans for specialty coffee). To the left are ripe beans and to the right are immature beans that have been sorted out. Note 2: Farmers try to harvest only ripe beans, but immature beans that are harvested by mistake are measured after dividing up according to the workers’ responsibility. Workers receive higher payments for ripe beans, which gives them an incentive to harvest ripe beans. Source: Mi Cafeto
Photograph 4-5: Ripe beans and immature beans (El Salvador)
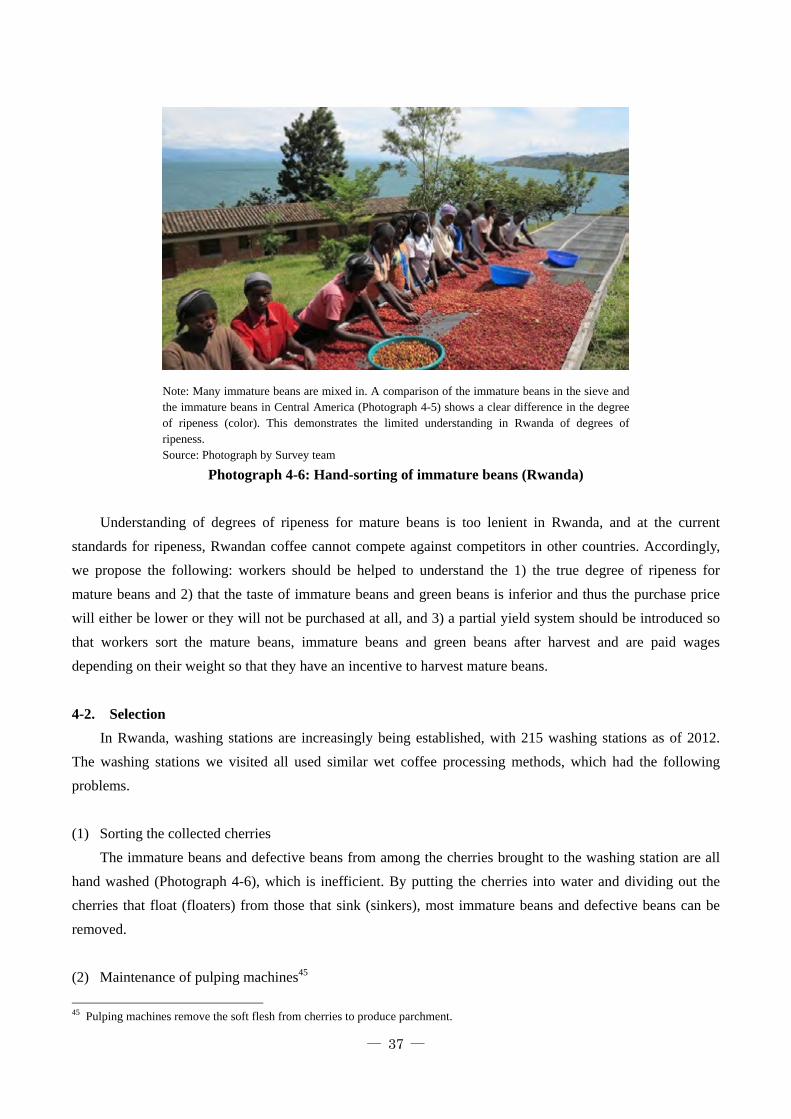
― 37 ―
Note: Many immature beans are mixed in. A comparison of the immature beans in the sieve and the immature beans in Central America (Photograph 4-5) shows a clear difference in the degree of ripeness (color). This demonstrates the limited understanding in Rwanda of degrees of ripeness. Source: Photograph by Survey team
Photograph 4-6: Hand-sorting of immature beans (Rwanda)
Understanding of degrees of ripeness for mature beans is too lenient in Rwanda, and at the current
standards for ripeness, Rwandan coffee cannot compete against competitors in other countries. Accordingly,
we propose the following: workers should be helped to understand the 1) the true degree of ripeness for
mature beans and 2) that the taste of immature beans and green beans is inferior and thus the purchase price
will either be lower or they will not be purchased at all, and 3) a partial yield system should be introduced so
that workers sort the mature beans, immature beans and green beans after harvest and are paid wages
depending on their weight so that they have an incentive to harvest mature beans.
4-2. Selection
In Rwanda, washing stations are increasingly being established, with 215 washing stations as of 2012.
The washing stations we visited all used similar wet coffee processing methods, which had the following
problems.
(1) Sorting the collected cherries
The immature beans and defective beans from among the cherries brought to the washing station are all
hand washed (Photograph 4-6), which is inefficient. By putting the cherries into water and dividing out the
cherries that float (floaters) from those that sink (sinkers), most immature beans and defective beans can be
removed.
(2) Maintenance of pulping machines45
45 Pulping machines remove the soft flesh from cherries to produce parchment.

Most o
residue on th
beans remain
to be replac
adjustments
(3) Use of w
The pro
the parchme
Rwanda. No
the rinsing p
wide and to
volume of w
beans down
of water cha
f the washin
he pulping m
n in the mac
ced every fe
means that t
water channe
ocess of send
ent, but to so
ot only is the
process is no
oo much parc
water is used
the water ch
annels and th
Note: ThchannelspartitionsforefrontSource: M
ng stations w
machines sho
chine and it i
ew years, bu
the pulp is no
els for sortin
ding the parc
rt the parchm
e mechanism
ot even under
chment is se
d (Photograp
hannels. The
he mechanism
he water channe, as the parchms. Lightweight t. Mi Cafeto
Photogra
ferme
we observed
ould be clean
is not cared f
ut many are
ot completely
ng by gravity
hment down
ment by grav
m governing g
rstood. For e
ent through e
ph 4-8). Mor
washing stat
m by which it
el’s width is adment runs throubeans float fas
ph 4-7: Wat
entation and
― 38 ―
did not app
ned every da
for. The corr
e worn. Fail
y removed a
y
n water chann
vity (Photogr
gravity selec
example, at s
each time, s
reover, there
tions need to
t operates.
dequate. If mulugh the water, ster, while heav
ter channel
d sort by gra
propriately m
ay, in princip
rugated meta
ure to care
and the parch
nels after fer
raph 4-7), bu
ction not und
some washin
o that it can
were cases
o be given di
ltiple partitionsthe lightweigh
vy beans remai
to rinse coff
avity (Guate
maintain their
ple, but even
al discs used
for the pulp
hment can be
rmentation is
ut gravity sor
derstood, but
ng stations, th
n’t be sorted
in which sti
rection in the
s are put up in ht beans float ain in the partiti
fee beans aft
emala)
ir pulping m
n after the ha
d to remove t
ping machin
e damaged or
s not done sim
rting does no
t the fact tha
he water cha
d by gravity
icks are used
e gravity sor
the water above the ion in the
fter
machines. The
arvest period
the pulp need
ne and make
r torn.
mply to rinse
ot function in
at it is part o
annels are too
since a large
d to send the
rting function
e
d,
d
e
e
n
f
o
e
e
n
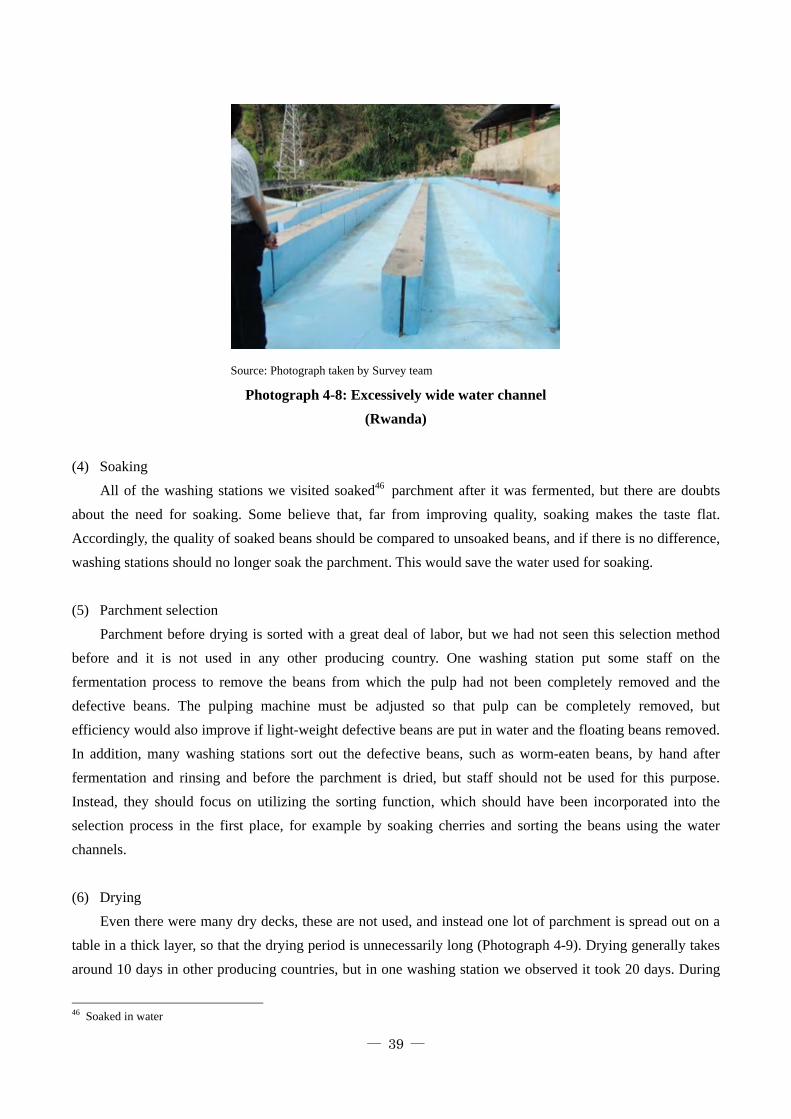
― 39 ―
Source: Photograph taken by Survey team
Photograph 4-8: Excessively wide water channel
(Rwanda)
(4) Soaking
All of the washing stations we visited soaked46 parchment after it was fermented, but there are doubts
about the need for soaking. Some believe that, far from improving quality, soaking makes the taste flat.
Accordingly, the quality of soaked beans should be compared to unsoaked beans, and if there is no difference,
washing stations should no longer soak the parchment. This would save the water used for soaking.
(5) Parchment selection
Parchment before drying is sorted with a great deal of labor, but we had not seen this selection method
before and it is not used in any other producing country. One washing station put some staff on the
fermentation process to remove the beans from which the pulp had not been completely removed and the
defective beans. The pulping machine must be adjusted so that pulp can be completely removed, but
efficiency would also improve if light-weight defective beans are put in water and the floating beans removed.
In addition, many washing stations sort out the defective beans, such as worm-eaten beans, by hand after
fermentation and rinsing and before the parchment is dried, but staff should not be used for this purpose.
Instead, they should focus on utilizing the sorting function, which should have been incorporated into the
selection process in the first place, for example by soaking cherries and sorting the beans using the water
channels.
(6) Drying
Even there were many dry decks, these are not used, and instead one lot of parchment is spread out on a
table in a thick layer, so that the drying period is unnecessarily long (Photograph 4-9). Drying generally takes
around 10 days in other producing countries, but in one washing station we observed it took 20 days. During
46 Soaked in water

― 40 ―
this period there is a good chance that quality would deteriorate due to mold on the beans or that they would
be rained on. Moreover, there are not enough supporting columns for the dry decks, so that when the
parchment is spread out, the surface mesh bends with the weight of the parchment and resembles a hammock.
As a result, the beans do not dry uniformly (Photograph 4-10).
Note: Despite this large number of dry decks, not a single one is being used. Source: Photograph taken by Survey team
Photograph 4-9: Drying area (1, Rwanda)
Source: Photograph taken by Survey team Note: There are not enough supporting columns, so all of the dry decks are bowed. In such conditions, the beans can’t be uniformly dried.
Photograph 4-10: Drying area (2, Rwanda)
Moreover, the dried parchment must be cured to rest it and allow it to mellow, but none of the washing
stations we visited cured the parchment, and did not understand the need for it.

― 41 ―
Chapter 5 Quality standards
5-1. Quality standards for coffee in major producing countries
5-1-1. Mainstream coffee
Quality standards for coffee were first set in Brazil in the 19th century when the New York futures market
was established. Currently, the major producing countries set and apply their own quality standards. These
quality standards are observed in common both by domestic parties, but also by those involved in the
importing country, and are seen as a common yardstick that facilitates trade between countries as well as a
shared language. Quality standards are set based on market value. Quality standards in the individual countries
can be classified roughly into four patterns.
1) Standards based on elevation
2) Standards based on size
3) Standards based on number of defects
4) Standards based on size and number of defects
Taste is assessed through cupping, naturally, but many criteria look at whether the coffee meets the
standard.
Table 5-1 provides an overview of quality standards for coffee in the major producing countries.
The taste is richer in coffee that is harvested in places with a high elevation, and thus it tends to be traded
at higher prices. For this reason, in Mexico and Central American countries, which have dramatic differences
in elevation, coffee is classified according to elevation.
In Colombia, Kenya and Tanzania, coffee is classified by size. Beans that appear large are traded at
higher prices.
Ethiopia and Peru are classified according to the number of defects since the greater the number of
defects, the more likely it is that the appearance of freshly roasted beans will be damaged and it will have a
negative impact on taste.
Many other countries, excluding these, have standards that combine size and the number of defects.

― 42 ―
Table 5-1: Overview of ratings in major coffee-producing countries
1) By elevation
Name of producing country Approximate elevation47 Standard
Mexico 900m ~ 1200m HG (altura) 600m ~ 900m PW (prima lavado)
Guatemala 1300m ~ SHB48 1200m ~ 1300m HB 900m ~ 1050m EPW49
El Salvador 1200m ~ SHG50 900m ~ 1200m HG
Honduras 1200m ~ SHG 900m ~ 1200m HG
Costa Rica (central plateau) 1200m ~ 1700m SHB 800m ~ 1200m HB
2) By screen size
Name of producing country Screen size51 Standard
Colombia S-17~52 Supremo S-14~ Excelso
Tanzania (Arabica) S-18 AA S-15~17 AB
Kenya S-18 AA S-15~17 AB
3) According to number of defects
Name of producing country No. of defects53 Standard
Ethiopia ~ 3 Grade 1 4 ~ 12 Grade 2 13 ~ 27 Grade 3 28 ~ 45 Grade 4 46 ~ 90 Grade 5
Peru54 ~ 15 Grade 1 ~ 23 Grade 2 ~ 30 Grade 3 ~ 35 Grade 4 ~ 40 Grade 5
47 Precise numbers would not be meaningful so the figures have been rounded. 48 Strictly Hard Bean 49 Extra Prime Washed 50 Strictly High Grown 51 The Brazilian 1/64-inch screen is the global standard, with few differences among the producing countries. 52 Excelso beans that are particularly large are graded as Supremo. 53 Per 300g 54 They are also traded under the previous standards of MCM (41-70 defects) and MC (71-100). MCM stands for “Machine Cleaned
Mejorado.”

― 43 ―
4) By screen and number of defects
Name of producing country Screen No. of defects55 Standard
Brazil S-17/18 ~11 Type 2 (No.2) S-14/15/16 ~36~ Type 4/5 (No.4/5)
Indonesia Dry method56 Large 7.5×7.5mm~ ~11 Grade 1 Small 3×3mm~ ~25 Grade 2 Wet method Large 7.5×7.5mm~ ~44 Grade 3 Medium 6.5×6.5mm~ ~80 Grade 4 Small 5.5×5.5mm~ ~150 Grade 5
Vietnam (Canephora) S-12.5/16 ~60 Grade 1 S-12/12.5 ~90 Grade 2
Cuba S-18 ~12 ETL57 S-17 ~19 TL S-16 ~22 AL58
Kona, Hawaii S-19 8 Extra Fancy S-18 12 Fancy S-16 18 No.1
Jamaica S-17/18 ~2% No.1 Blue Mountain S-16/17 ~2% No.2
S-15/16 ~2% No.3 S-16/17 ~4% Triage
5-1-2. Specialty coffee
The specialty coffee area, which is actively praised for its unique taste arising from special geographical
conditions, climate conditions and processing conditions, among other factors, has seen tremendous growth
and now forms its own market. Producing companies and consuming companies have their own specialty
coffee associations and are achieving results. Rather than a cup test that puts more weight on defects, which
originates in Brazil, a cup test that emphasizes a positive assessment of coffee is carried out. The Cup of
Excellence (COE) method and Specialty Coffee Association of America (SCAA) are used for this. The former
is primarily used in auctions held by the Alliance for Cup of Excellence (ACE), while the latter is primarily
used in evaluations such as coffee awarded a Q certificate by the Coffee Quality Institute (CQI).
5-2. Current conditions of quality standards for Rwandan coffee
The quality standards obtained by NAEB can be summarized as followed.59
55 Per 300g 56 Classification by screen size is applied to Canephora varieties. 57 Extra Turquino Lavado 58 Altura 59 Robusta is divided into “fully washed” and “washed,” and this refers only to Arabica.
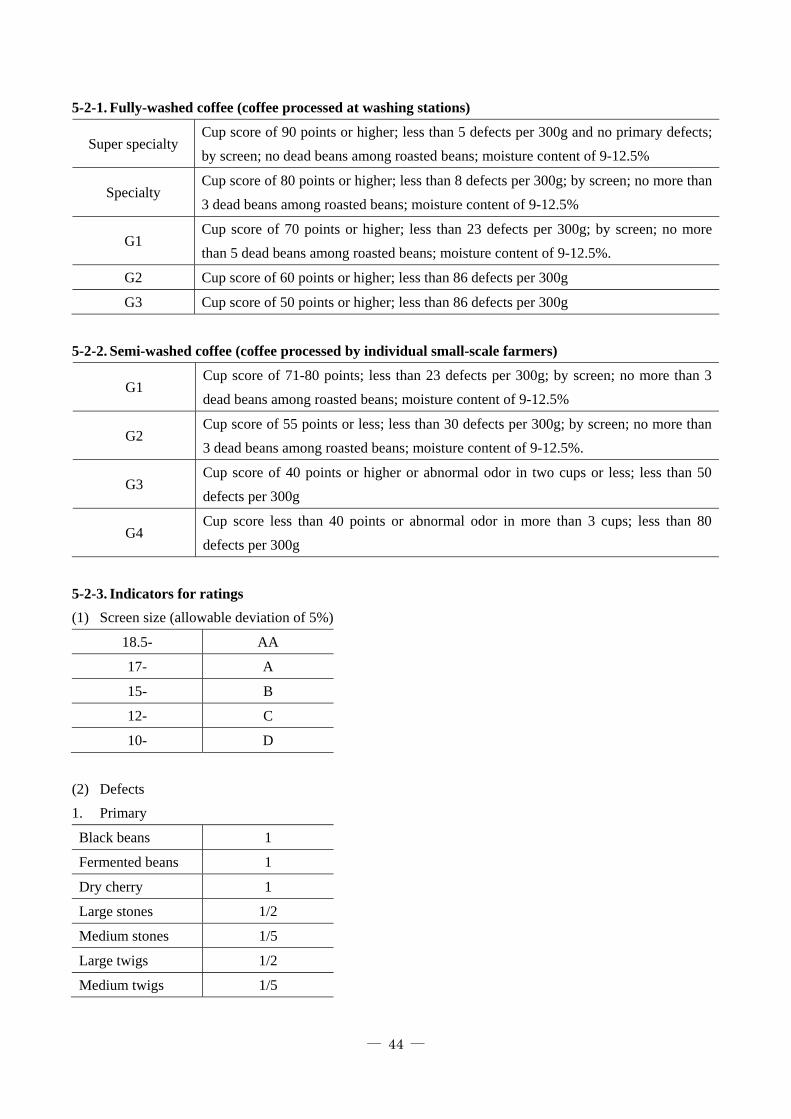
― 44 ―
5-2-1. Fully-washed coffee (coffee processed at washing stations)
Super specialty Cup score of 90 points or higher; less than 5 defects per 300g and no primary defects;
by screen; no dead beans among roasted beans; moisture content of 9-12.5%
Specialty Cup score of 80 points or higher; less than 8 defects per 300g; by screen; no more than
3 dead beans among roasted beans; moisture content of 9-12.5%
G1 Cup score of 70 points or higher; less than 23 defects per 300g; by screen; no more
than 5 dead beans among roasted beans; moisture content of 9-12.5%.
G2 Cup score of 60 points or higher; less than 86 defects per 300g
G3 Cup score of 50 points or higher; less than 86 defects per 300g
5-2-2. Semi-washed coffee (coffee processed by individual small-scale farmers)
G1 Cup score of 71-80 points; less than 23 defects per 300g; by screen; no more than 3
dead beans among roasted beans; moisture content of 9-12.5%
G2 Cup score of 55 points or less; less than 30 defects per 300g; by screen; no more than
3 dead beans among roasted beans; moisture content of 9-12.5%.
G3 Cup score of 40 points or higher or abnormal odor in two cups or less; less than 50
defects per 300g
G4 Cup score less than 40 points or abnormal odor in more than 3 cups; less than 80
defects per 300g
5-2-3. Indicators for ratings
(1) Screen size (allowable deviation of 5%)
18.5- AA
17- A
15- B
12- C
10- D
(2) Defects
1. Primary
Black beans 1
Fermented beans 1
Dry cherry 1
Large stones 1/2
Medium stones 1/5
Large twigs 1/2
Medium twigs 1/5

― 45 ―
2. Secondary
Parchment 1/3-1/2
Dried pulp 1/3-1/2
Broken beans 1/5
Insect-damaged beans 1/5-1/2
Partially black beans 1/3-1/2
Partially fermented beans 1/3-1/2
Beans that float in water 1/5
Shell beans 1/5
Small stones 1
Small twigs 1
Beans with water damage 1/5-1/2
5-2-4. Problems with current quality standards
The current quality standards are extremely clear compared to those in other producing countries. NAEB
samples all lots before they are exported and performs an evaluation based on these standards. At the same
time, exporters and importers in the consuming country do not know that these standards exist, and have set
their own product standards by mutual arrangement. There are many cursory and vague standards, such as
“over S15.” The fact that the same yardstick is not shared by all of those involved with Rwandan coffee stands
in the way of smooth commercial transactions, and cursory classifications results in losses for both the seller
and the buyer.
The current problems are likely because the quality standards that have been set are not very effective.
The problems can be summarized as follows.
Quality standards are not sufficiently recognized.
There are not enough Q graders and exporters cannot give ratings.
These criteria are applied to coffee other than specialty coffee.
The quality standards actually used in commercial trade are cursory.
5-3. Developing quality standards for coffee in the future in Rwanda
The key points when setting quality standards are that they are easy to administer and that they maximize
revenue.
As regards the former, a simplified cupping method must be used for coffee that receives a score of less
than 80 under the Specialty Coffee of America Association (SCAA) protocol.
As regards the former, after ascertaining the needs of consuming countries, we must start by determining
how much coffee of what sizes can be harvested, what differences in quality result from differences in
elevation, the extent of the harvest in each of the different elevation zones, what kind of impact the different
defects have on quality, and to what extent does it occur. Once the standards begin to be applied, the
differences in price for each grade become clear, which provides a clear picture of which grades should be
― 46 ―
increased by what extent to improve revenue. We expect that the quality of Rwandan coffee would be
improved if NAEB, exporters, processors, sorters and formers consider what can be done to realize it and take
action together.
5-4. Other
(1) The analytical equipment support that farmers receive, such as agricultural pesticides, which we
discussed when we visited the Ministry of Agriculture, is essentially meaningless, with the exception of
cases in which Rwanda can differentiate based on analytical capacity. Soil analysis should come first. A
regular soil analysis would enable farmers to apply fertilizer appropriately. This is cheaper than analysis
of pesticides and is also effective.
(2) As regards management of the potato smell, given that it has a strong odor at very low concentrations and
contamination could occur at the level of the individual bean, it is not realistic to risk assessment in
cupping. Eradicating the insects causing the potato smell is the essential issue here.


Supplementary materials
I. Survey of coffee farmers’ current conditions
II. Reference works

Supplementary material I. Study of coffee farmers’ current conditions
― 49 ―
I. Survey of coffee farmers’ current conditions
In order to ascertain coffee farmers’ current conditions and their surrounding environment, we
interviewed coffee farmers. Only four farmers were interviewed, so we cannot make generalizations from the
results, but we have provided the interview results in detail as a case study of coffee farmers.
1. Overview of farmers and livelihood conditions
The target regions were the Huye Sector and the Maraba Sector in Huye District in the Southern Province.
Table A1-1 provides an overview of the targeted farmers.
Table A1-1: Overview of interviewed farmers and livelihood conditions (interview results)
Item Farmer A (woman) Farmer B (man) Farmer C (woman) Farmer D (man)
Region Huye Sector Huye Sector Maraba Sector Maraba Sector Household
makeup
Subject of interview,
husband, five children Subject of interview, wife,
five children Subject of interview and
two children; no husband Subject of interview, wife,
four children Ways of
making a living
Husband is engaged
only in farming. The
interviewee farms and
works as a seasonal
worker at Huye
Mountain Coffee’s
washing station. The
daily wage at the
washing station is
1,700 RWF/day, and
during the
three-month harvest
season, she works
almost every day. 1,220 coffee trees Potatoes, beans,
vegetables (carrots,
onions) 80% of their cash
income comes from
coffee, with the
remainder coming
from other crops
(excluding wage labor
at the washing
station)
Full-time farmer 570 coffee trees Sorghum, beans,
cassava; all for
personal consumption
Only the coffee
provides cash income
Since crops other than
coffee are not very
profitable, the farmer
is gradually
decreasing them. He
plans to buy food
using cash made from
coffee.
Farming and seasonal
labor at Maraba
Cooperative’s
washing station 400 coffee trees Sweet potatoes, maize Cash income is not
only from coffee, but
also from other crops Other crops can be
eaten, which is a plus
Farming and seasonal
labor at Maraba
Cooperative’s washing
station 680 coffee trees Soybeans, cassava,
beans Cash income is not
only from coffee, but
also from other crops Large sums of cash can
be generated once for
coffee, but only once a
year, However, other
crops can generate
income throughout the
year, albeit in small
amounts, and for this
he is grateful.
Cherry buyers She sells cherries to
Huye Mountain
Coffee Since the washing
station is not far, she
He sells cherries to
Huye Mountain
Coffee Previously, he sold to
Maraba Cooperative,
She sells cherries to
Maraba Cooperative. Since it is close, she
brings them herself.
He sells cherries to
Maraba Cooperative. Since it is close, he
brings them herself.

Supplementary material I. Study of coffee farmers’ current conditions
― 50 ―
brings the coffee
herself using a bike. and before that he
processed the beans
into parchment
himself and sold it to
a local trader. Other Producer of cherries that
won the Cup of Excellence
award
Member of Maraba
Cooperative Member of Maraba
Cooperative
Source: Prepared by Survey team.
Farmers A and B sell their cherries to Huye Mountain Coffee and have strong ties to this company.
Farmers C and D are members of the Maraba Cooperative, which owns a washing station and secondary
processing facility, and sell their cherries to the cooperative’s washing station.
All of the farmers grow other crops in addition to coffee for personal consumption, and Farmers A, C and
D work as seasonal laborers at the washing station to which they sell their cherries. The makeup of Farmers C
and D’s cash income is not clear, but coffee makes up a high proportion of Farmers A and B’s cash income,
which suggests that cash income from coffee provides a good part of their livelihood. Coffee is highly
profitable, as suggested by Farmer B, but as pointed out by Farmers C and D, other crops such as potatoes,
beans and corn are used for personal consumption and have the advantage of being convertible into cash
throughout the year. Naturally, the farmers choose the optimal planting pattern based on the features, merits
and demerits of each crop, and coffee is seen by farmers as a highly profitable cash crop.
2. Overview of coffee cultivation: Background, labor amounts and fertilizer
All four farmers have gradually increased the number of coffee trees they grow. However, Farmers C and
D have not yet increased their trees from the current 400 and 680 trees, respectively, due to a labor shortage,
and Farmer A is trying to boost productivity going forward rather than increase the number of trees.
Coffee cultivation requires a concentrated period of labor during the harvest season, and all of the
farmers are very busy and employ seasonal workers. The daily wage is 600-700 RWF (about US$1). Farmers
A and B pay a total of US$50-100 in wages to seasonal laborers throughout the harvest season, using their
savings and advance payments from the washing stations to pay these wages. In the case of Farmer C, who is
a widow, she has employed a manager to oversee the seasonal workers throughout the harvest season for
20,000 RWF (about US$30).
All of the farmers apply fertilizer, and obtain the fertilizer distributed for free by the government from
their washing stations.

Supplementary material I. Study of coffee farmers’ current conditions
― 51 ―
Table A1-2: Coffee cultivation (interview results)
Item Farmer A (woman) Farmer B (man) Farmer C (woman) Farmer D (man)
Experiences in
growing coffee
thus far
When the washing
station was
established, she
began growing coffee
on the assumption
that coffee demand
would increase. She had 600 coffee
trees when Huye
Mountain Coffee was
established, but has
increased this to
1,220 trees. Going forward, she
wants to raise
productivity rather
than just increasing
the number of trees.
He has gradually
increased the number
of coffee trees he has
from 100 to 570. He
wants to buy more
land in the future and
increase this to 1,000
trees.
At first she had 80
coffee trees, but has
gradually increased
this to 400. Due to labor
shortages, it would
be difficult to
increase the number
of trees any more
than this.
He has increased the
number of coffee trees
at a pace of about 50
per year to his current
680 trees. He has not increased
the number of trees in
the past two years due
to a labor shortage, but
he plans to increase the
number of trees further
in the future in order to
boost his income from
coffee.
Labor Coffee does not
require much
attention compared to
other crops other than
at harvest time. However, she is very
busy at harvest time,
and hires seasonal
workers. She pays
600 RWF/day for
96-120 days (4
workers x 3
days/week x 8-10
weeks) She uses savings and
interest-free advance
payments from Huye
Mountain Coffee to
pay the workers.
Coffee requires more
labor than other
crops. It is difficult
because coffee trees
require weeding, pest
control, fertilizer and
other care. He hires seasonal
labor at 600
RWF/day for about
50 days (2 workers x
1-6 days/week x 8
weeks).
She is very busy
during the harvest
period and hires
seasonal workers, at
most six workers.
The daily wage is
600-700 RWF/day.
She also hires a
manager to oversee
the seasonal workers
throughout the
harvest season at
20,000 RWF.
Concentrated labor is
required during the
harvest period, which is
difficult. He hires eight seasonal
workers at most and
pays a daily wage of
600-700 RWF/day.
Fertilizer She uses both organic
fertilizer and chemical
fertilizers. Huye Mountain
Coffee distributes them for
free.
Uses fertilizer She uses fertilizer
distributed by NAEB and
obtained through the
Maraba Cooperative.
He uses fertilizer distributed
by NAEB and obtained
through the Maraba
Cooperative.
Source: Prepared by Survey team.

Supplementary material I. Study of coffee farmers’ current conditions
― 52 ―
3. Technical guidance on coffee growing
When we asked about how they learned about coffee growing (Table A1-3), we learned that guidance
from washing stations plays a major role in improving farmers’ cultivation techniques. Farmers A, B and D
answered that they learned coffee growing techniques through technical guidance provided by washing
stations, and Farmers A and D felt that instruction from washing stations was more helpful than guidance from
the government extension workers. Of course, the government’s technical guidance has also boosted results,
and Farmer B had high price for training received from the National Agricultural Export Development Board
(NAEB) in Kigali, while Farmer C learned cultivation techniques from the sector’s agricultural instructor.
Although not part of the interview results, coffee farmers interviewed in the Southern Province learned
about coffee cultivation through technical guidance from washing stations and NAEB. In addition to
government guidance in the form of the NAEB, there is no doubt that guidance from the washing stations,
which want a stable source of good-quality cherries, plays an important role in enhancing farmers’ cultivation
techniques.
As part of the government’s technical guidance system, NAEB appoints two extension workers
specializing in coffee to each district. In the case of Huye District, a target region in the case study, in addition
to the NAEB extension workers, there was one coffee promotion staff at the district level, one agricultural
extension worker at the sector level and one socio-economic official at the cell level. Agricultural extension
workers and socio-economic officials are in charge of all crops, not just coffee, but the agricultural extension
workers and socio-economic officials in Huye District, where coffee is an important agricultural product,
coffee is given priority.
Table A1-3: Methods for learning coffee growing techniques (interview results)
Farmer A Huye Mountain Coffee taught me. I learned about conditions for good-quality cherries and all topics from
planting to harvest. I received educational materials and training. I received technical guidance from government extension workers, but this was minimal in extent compared to
the instruction from Huye Mountain Coffee. Farmer B My father grew coffee, so I learned the basics from him.
When coffee prices increased, I recognized the importance of quality, and learned from Maraba Cooperative’s
washing station. Training from NAEB two years ago in Kigali has been helpful. This training included quality, fertilizer
applications, mulching and how to raise added value. Farmer C The sector agricultural instructor taught me about coffee growing. Farmer D Before the washing station was established, I relied on my own knowledge and experience. Once the
cooperative set up the washing station, the washing station provided guidance. NAEB (at that time OCIR Café)
extension workers also provided instruction, but the washing station gives more practical instruction that I can
actually use. Source: Prepared by Survey team.

Supplementary material I. Study of coffee farmers’ current conditions
― 53 ―
4. Support for coffee farmers
While the government’s support amounts solely to training on coffee cultivation,60 washing stations and
cooperatives provide interest-free loans in addition to technical training. The farmers are very grateful for
these loans. Not only the government, but also washing stations and cooperatives make a large contribution in
supporting farmers.
Table A1-4: Support for coffee farmers (interview results)
Farmer A I received interest-free loans from Huye Mountain Coffee for daily expenditures (children’s school tuition,
health insurance premiums [3,000 RWF/per person per year], house repairs). Repayments can be made in
instalments.
Farmer B Huye Mountain Coffee provides financial support and technical support.
Farmer C Maraba Cooperative gave me an interest-free loan so that I could pay my children’s tuition.
The government provides support in the form of training.
Farmer D Maraba Cooperative makes secondary payments and gives loans for illness and home construction.
The government provides support in the form of training.
Source: Prepared by Survey team.
5. Changes as a result of establishment of washing stations
When asked about changes resulting from the establishment of washing stations, the interviewees spoke
of many positive changes (Table A1-5).
Table A1-5: Changes as a result of establishment of washing stations (interview results)
Farmer A The changes resulting from Huye Mountain Coffee’s establishment of a washing station are as follows. 1) Previously, I processed the cherries into parchment myself, which was very difficult work. 2) Previously I did not understand quality, so I sold at whatever cheap price the buyer would name. Now I
understand good and bad quality. 3) My income has increased 10-fold. This is mainly because previously, I did not know about coffee prices and
sold it cheaply. 4) I don’t have to depend on my husband. Now I have income from coffee, so when I want to buy something, I
don’t have to ask my husband. The following are changes at the community level.
5) Interest in coffee has been heightened. 6) Employment in the village has increased. 7) Women’s position and strength have improved. 8) If coffee farmers are worthwhile people and have seen an upgrade in their status, they are now recognized
by society and respected. For example, now we open bank accounts. Farmer B My life improved when I was able to sell cherries to Maraba Cooperative Association.
Things improved when I was able to sell to Huye Mountain Coffee because the buying price was high and I am
able to get loans and advance payments for everyday expenses. The changes once I began to sell to Huye Mountain Coffee are as follows.
1) I was able to have a cow and TV. 2) I was able to access loans. I wanted to work more so that I could pay back the loans. 3) My knowledge and techniques related to coffee improved because Huye Mountain Coffee provides ongoing
60 The interviews only mentioned training as an example of the government’s support for farmers, but in reality they also distribute
seedlings free of charge.

Supplementary material I. Study of coffee farmers’ current conditions
― 54 ―
support for capacity building. Farmer C The changes brought about by Maraba Cooperative are as follows.
1) Thanks to Maraba Cooperative, my living conditions improved because the cherry sales price increased. 2) Social relationships improved. We all have cash now, and share in the success, so there is no longer any
jealousy of others. However, I don’t think this change is only due to the cooperative. Farmer D The changes brought about by Maraba Cooperative are as follows.
1) It was a real struggle for me to process cherries to parchment by myself, and now I don’t have to do that
anymore. 2) My fears that the harvested cherries and process parchment will be stolen have decreased. Previously, I
would have to wake up in the middle of the night so that my stored cherries and parchment wouldn’t be
stolen. 3) Now I have a bank account and deposit money in the bank, so I don’t have to worry about theft. 4) The big coffee farmers hire the small coffee farmers, which reduces social friction and increases ties.
However, this is not entirely due to Maraba Cooperative. 5) Maraba Cooperative operates four washing stations, so the amount of cherries that can be selected has
increased, which gives the coffee farmers more opportunities to earn income. Source: Prepared by Survey team.
For example, the interviews stated that their income and living conditions had improved (all farmers that
were interviewed) and that their income and living conditions had improved because the selling price of coffee
had increased (Farmers A, B and C). Farmers A and C stated that “It was a real struggle for me to process
cherries to parchment by myself, and now I don’t have to do that anymore,” and Farmers A and B explained
that “My knowledge and techniques related to coffee improved.” Farmer D explained that “I hand over the
cherries right after I harvest them, so I am freed of the fear that my cherries and parchment will be stolen. I
also have a bank account and don’t have to keep large amounts of money on hand, so I don’t face the risk of
theft.” There were also changes at the community level. Farmer A stated that “coffee farmers are seen in a
socially positive light” and that “social interest in coffee has increased,” while Farmers C and D explained that
social relationships and ties had improved. These responses indicate that the establishment of washing stations
by private companies and cooperatives led to an increase in the selling price for cherries and gave them access
to support from the washing stations such as technical instruction and loans. As a result, living conditions and
technical levels related to coffee cultivation improved, and various other positive changes occurred among
coffee farmers and in the community.

Supplementary material I. Study of coffee farmers’ current conditions
― 55 ―
6. Cooperatives
Farmers C and D belong to cooperative associations, but in Rwanda, only 20% of the 400,000 households
growing coffee belong to cooperatives (Table A1-6).
Table A1-6: Number of households growing coffee and number of households that are cooperative
members (2009)
Region Number of households
growing coffee
Coffee farmers that have joined cooperatives
Number of
households Percentage (%)
Kigali 7,277 890 12%
Eastern province 51,140 12,709 25%
Northern province 58,858 21,557 37%
Western province 143,150 28,370 20%
Southern province 133,781 17,058 13%
Nationally 394,206 80,584 20%
Source: OCIR Café (2009)
Maraba Cooperative, which Farmers C and D belong to, have received aid from USAID, and is an
advanced cooperative for Rwanda. In principle, non-members are not eligible for the support provided to
members noted in Box 3-3. This is not true of Maraba Cooperative alone—even if a cooperative will buy
cherries from a non-member, some will not give them secondary payments or provide other support for
farmers. There is a large discrepancy in the benefits available to members and non-members. Many farmers
are not members despite the substantial benefits that accrue to members because of the high contribution that
must be paid when joining the cooperative. In the case of Maraba Cooeprataive, the contribution was initially
1,000 RWF, but the fee began to increase after the cooperative built the washing station, and an expert
estimates that the initial fee of 1,000 RWF now has a value of 50,000 frans and is expected to increase further
in the future. This 50,000 RWF is very high for farmers, and stands in the way of the decision to become a
member.

Supplementary materials II. Reference works
― 56 ―
II. Reference works
National Agricultural Export Development Board (NAEB). (2012). Annual Report 2011 / 12 of National
Agricultural Export Development Board. Kigali: Author.
OCIR Café. (2009). National Coffee Census -Final Report-. Kigali: Author.
Promar Consulting. (2012). Agriculture, Forestry and Fisheries of Rwanda: Fact-finding Survey for the
Support of Aid to Developing Countries (Fiscal Year 2011 Research Project). Ministry of Agriculture,
Forestry and Fisheries.