data collection survey on renewable energy …open_jicareport.jica.go.jp/pdf/12086740_02.pdfdata...
TRANSCRIPT
Data Collection Survey on Renewable Energy Development in Pakistan Final Report
January 2013 119 Nippon Koei Co., Ltd.
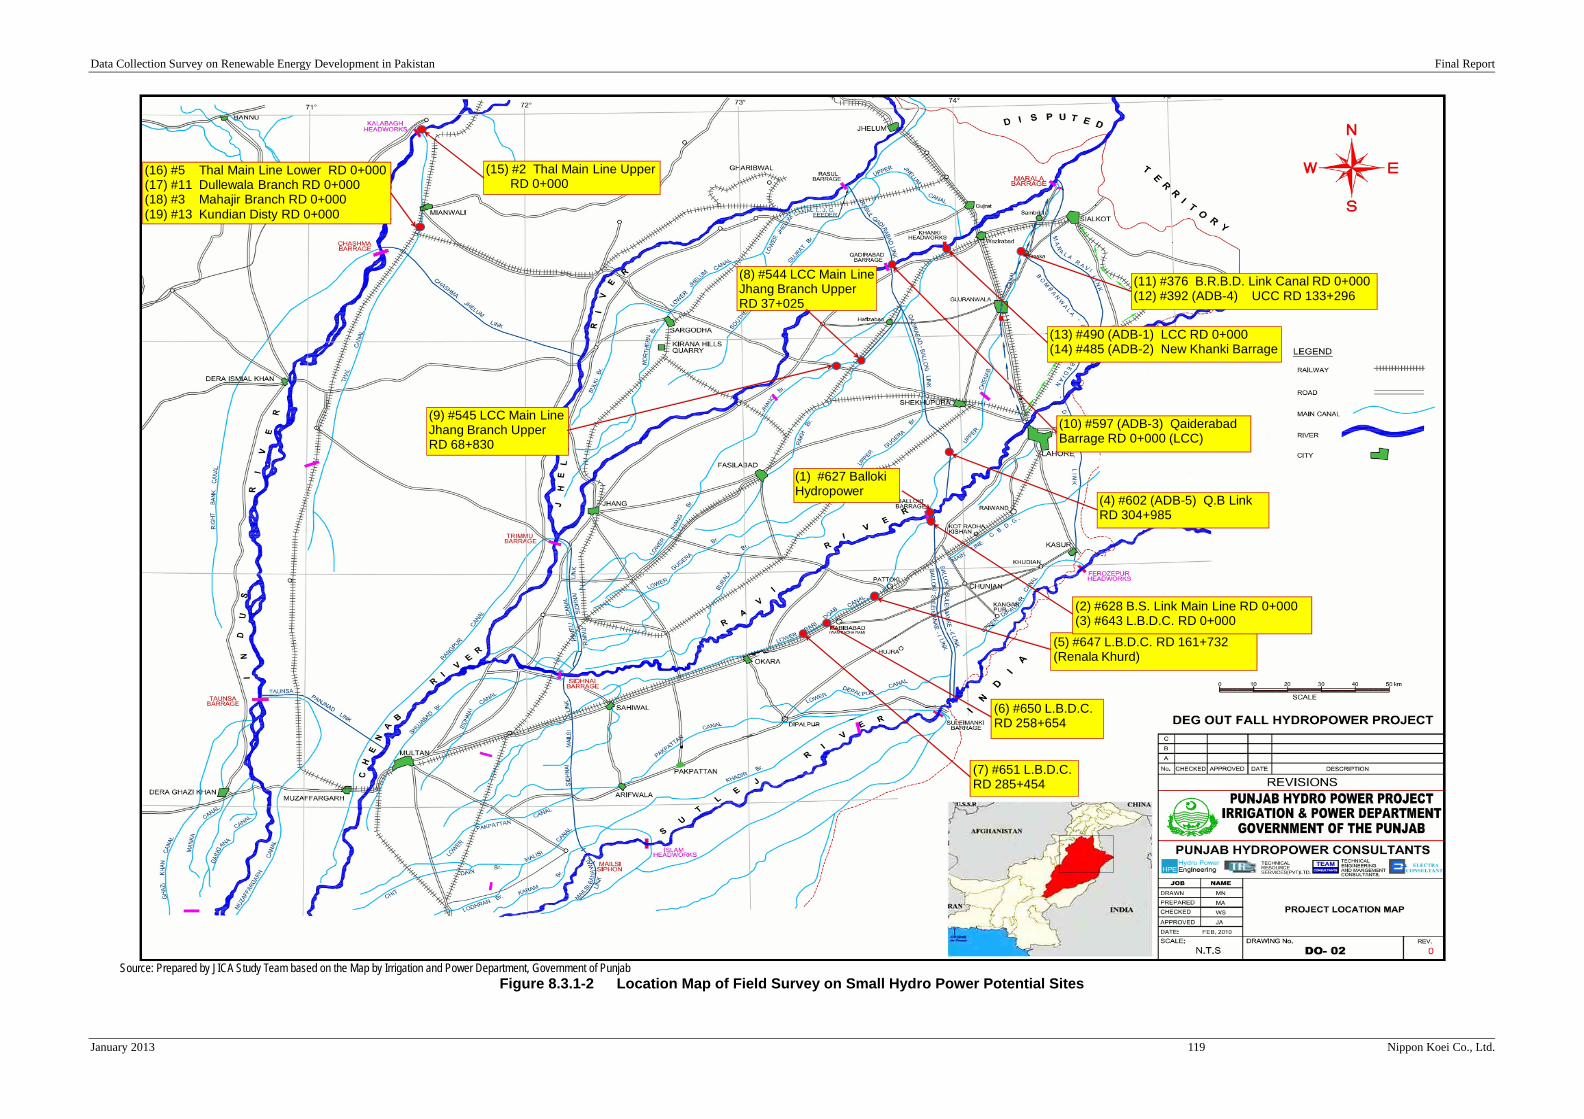
Source: Prepared by JICA Study Team based on the Map by Irrigation and Power Department, Government of Punjab
Figure 8.3.1-2 Location Map of Field Survey on Small Hydro Power Potential Sites
1
(7) #651 L.B.D.C. RD 285+454
(6) #650 L.B.D.C. RD 258+654
(5) #647 L.B.D.C. RD 161+732 (Renala Khurd)
(2) #628 B.S. Link Main Line RD 0+000(3) #643 L.B.D.C. RD 0+000
(1) #627 Balloki Hydropower
(4) #602 (ADB-5) Q.B Link RD 304+985
(9) #545 LCC Main LineJhang Branch Upper RD 68+830
(8) #544 LCC Main LineJhang Branch Upper RD 37+025
(10) #597 (ADB-3) Qaiderabad Barrage RD 0+000 (LCC)
(13) #490 (ADB-1) LCC RD 0+000(14) #485 (ADB-2) New Khanki Barrage
(11) #376 B.R.B.D. Link Canal RD 0+000(12) #392 (ADB-4) UCC RD 133+296
(15) #2 Thal Main Line UpperRD 0+000
(16) #5 Thal Main Line Lower RD 0+000(17) #11 Dullewala Branch RD 0+000(18) #3 Mahajir Branch RD 0+000(19) #13 Kundian Disty RD 0+000

Data Collection Survey on Renewable Energy Development in Pakistan Final Report
January 2013 120 Nippon Koei Co., Ltd.
Table 8.3.1-1 Summary of Field Survey of Small Hydro Power in Northern Punjab
Day Date
SiteNo.
NaturalRiver /Canal
Type ofP/NP *3)
Sr. #of PPDB
List
Source ofRiver
Barrage Canal System CanalR.D.1000
FT.
Latitude (N)Longitude (E)Measured by
GPS
Province DistrictName of City
/ TownDistance from
CityList Data /Field Data
Head(m)
Discharge(m3/s)
Power(InsalledCapacity)
(MW)
AverageAnnualEnergy(GWh)
PlatFactor
(%)
Cost perMW
(MillionUS$/MW)
Stage ofStudy
Notes JudgeRank by
PPDB List
31o 13.208' 83 km PPDB List 4.00 129.00 4.128
73o 51.709' from Lahore Field Data 4.00 0.00 0.000 Not Perennial Flow to D/S X
31o 13.208' 83 km PPDB List 0.74 523.86 3.101
73o 51.709' from Lahore Field Data 2.52 240.00 4.838 New B.S. Link Barrage will be constructed O
31o 13.208' 83 km PPDB List 0.67 278.00 1.490
73o 51.709' from Lahore Field Data 0.95 193.00 1.467 Good condition, P/H will be in canal. O
31o 32.007' 144 km PPDB List 2.08 450.00 7.48873o 56.483' from Lahore ADB F/S 2.04 450.00 7.684 Proposed P/H will be in canal O
Field Data 1.92 320.00 4.915 Good site condition and design O
30o 53.002' 123 km PPDB List 2.03 220.00 3.573Existing off-grid HPP 1.1 MW was operatedby WAPDA.
73o 35.621' from Lahore Field Data - - -F/S for Upgradeing HPP (Total 4MW) willbe finished in Dec.2012 by WAPDA.
O
30o 45.556' 145 km PPDB List 1.98 195.00 3.08973o 19.742' from Lahore Field Data 2.09 116.35 1.945 Good site condition in Right Bank O30o 42.981' 155 km PPDB List 1.66 193.00 2.56373o 15.634' from Lahore Field Data 1.87 111.00 1.661 Good condition, P/H will be in canal. O
31o 53.593' 124 km PPDB List 2.11 83.93 1.417
73o 31.802' from Lahore Field Data 0.36 98.10 0.283 Low head (small potential) X
31o 52.823' 270 km PPDB List 2.15 82.00 1.410 F/S by Alka Power (PVT) Limited
73o 25.966' from Lahore Field Data 1.82 87.75 1.278 F/S by Alka Power (PVT) Limited O
32o 19.785' 198 km PPDB List 3.83 700.00 21.44873o 40.925' from Lahore ADB F/S 3.68 700.00 23.000 Proposed P/H will be at right bank △
Field Data 5.04 0.00 0.000 Not Perennial Flow to D/S △
32o 21.689' 152 km PPDB List 1.76 203.76 2.869
from Lahore Tarakai F/S 1.93 156.00 1.916
74o 17.627' Field Data 0.61 83.50 0.407 Low head (small potential) △
32o 21.446' 139 km PPDB List 2.45 476.86 9.34674o 17.484' from Lahore ADB F/S 2.39 170.00 3.580 Proposed P/H will be in canal △
Field Data 3.23 10.00 0.258 Not Perennial Flow to D/S △
32o 24.150' 128 km PPDB List 3.60 240.00 6.912
73o 58.230' from Lahore ADB F/S 3.57 240.00 7.550Proposed P/H will be in New Lower ChenabCanal
△
Field Data 2.42 159.42 3.086 (after construction of New Khanki Barrage) △
32o 24.901' 128 km PPDB List 2.47 600.00 11.856
73o 58.135' from Lahore ADB F/S 2.62 600.00 14.090Proposed P/H will be at right bank ofproposed New Khanki Barrage
△
Field Data 2.29 0.00 0.000 Not Perennial Flow to D/S △
32o 54.940' 278 km PPDB List 1.97 283.45 4.46771o 31.650' from Islamabad Field Data 0.64 147.67 0.756 Low head (small potential) X32o 30.615' 265 km PPDB List 1.52 144.13 1.75371o 33.248' from Islamabad Field Data 1.21 127.96 1.239 Good condition, P/H will be in canal. O32o 30.615' 265 km PPDB List 1.92 24.60 0.37871o 33.248' from Islamabad Field Data 2.05 19.20 0.315 Small discharge (Low Potential) X
32o 30.615' 265 km PPDB List 2.11 41.42 0.69971o 33.248' from Islamabad Field Data 2.42 29.90 0.579 Small discharge (Low Potential) △
32o 30.615' 265 km PPDB List 1.65 1.84 0.02471o 33.248' from Islamabad Field Data 1.15 1.70 0.016 Small discharge (Low Potential) X
32o 30.615' 265 km PPDB List - - -71o 33.248' from Islamabad Field Data 3.41 0.00 0.000 Not Perennial Flow to D/S X
Source : Prepared by JICA Study Team based on PPDB Hydro Power Potential List.*1) : Feasibility Studies of Hydel Power Stations in Punjab (Task 2), Asian Development Bank (ADB) for the Renewable Energy Development Sector Investment Program, Government of Punjab (GOP), National Engineering Service Pakistan (NESPAK), 2011.*2) : 2MW Hydropower Project on BRBD Canal RD0+000, Feasibility Report, Government of the Punjab Department of Energy, PPDB, Taraki Energy (PVT) Limited, July 2011.
Note: *3) : P = Perennial, means the canal operates for 11 months a year., NP = Not Perennial.
-Mianwali Mianwalli
Identified -Mianwalli
Identified
20 Canal NP - Escape Channel 0+000 Punjab
Punjab Mianwali19 Canal P 13 Kundian Disty 0+000
Identified
18 Canal P 3 Mahajir Branch 0+000 Punjab Mianwali Mianwalli
11 Mianwalli
Identified 18
Thal Main LineUpper
Main Line Lower 0+000 Punjab Mianwali Mianwalli
Dullewala Branch 0+000 Punjab Mianwali
Identified 20
-
7 16-Nov-2012 Fri.
Thal Main.Lineupper
0+000 Punjab MianwaliCanal P 2 INDUS JinnahThal Main LineUpper
16 Canal P 5
INDUS Jinnah
17 Canal P
F/S *1) 3
6 15-Nov-2012 Thu. 15
at Proposed NewKhanki Barrage
Punjab Gujrat Maggowal 38.34
Identified 8Mari Indus
5
F/S *1) 2
14 NaturalRiver
NP485
ADB-2CHENAB Khanki
New KhankiBarrage
Lower ChenabCanal (LCC)
Gujranwala Mansurwali 43.61 65.94 4.04CHENAB KhankiLower ChenabCanal (LCC) (RD0+000)
Lower ChenabCanal (LCC)
0+000 Punjab
31.06 3.56
4.26 F/S *1)KhankiUpper ChenabCanal (UCC) (RD133+296)
Upper ChenabCanal (UCC)
133+296 Punjab Sialkot
4 13-Nov-2012
14-Nov-2012 Wed.
13 Canal P490
ADB-1
12.39
17.19
50.60 4.94 F/S *2) 13
12 Canal NP392
ADB-4CHENAB
B. R. B. D. LinkCanal
0+000 Punjab Sialkot DaskaCanal P 376 CHENAB Marala
Bombanwala RaviBedian Diapur (B.R. B. D.) LinkCanal
4Daska 54.76
10 NaturalRiver
NP597
ADB-3CHENAB Khanki
Tue.
11
10Lower Chenab Cnal(L.C.C) MAINLINE
Jhang BranchUpper
68+830 Punjab Hafizabad Sukheke
1Qaiderabad BarrageLower ChenabCanal (LCC)
at QaiderabadBarrage 0+000
PunjabMandi
BahaddinPhalia 54.53 27.06 3.20 F/S *1)
11
9 Canal P 545 CHENAB Khanki
37+025(37/38))
Punjab Hafizabad KalekeP 544 CHENAB KhankiLower Chenab Cnal(L.C.C) MAINLINE
Jhang BranchUpper
Identified
Identified 14
3 12-Nov-2012 Mon.
8 Canal
Punjab Shahiwal Shahiwal
2 11-Nov-2012 Sun.
Identified
Okara IdentifiedBallokiLower Bari DoabCanal
L.B.D.C 258+654 Punjab Okara
7 Canal P 651 RAVI BallokiLower Bari DoabCanal
L.B.D.C 285+454
Identified 7
6 Canal P 650 RAVI
L.B.D.C(Renala Khurd)
161+732 Punjab Okara Renala KhurdCanal P 647 RAVI BallokiLower Bari DoabCanal5
9
4.42 F/S *1) 6Qaiderabad BallokiLink Canal(304+985)
Qaiderabad BallokiLink Canal
304+985 Punjab Nankana Sahib Miranpur4 Canal P602
ADB-5RAVI Balloki 52.59 78.17
Identified -
3 Canal P 643 RAVI Balloki
0+000 Punjab KasurPjoolnaar(RadhaKishan)
Identified -Lower Bari DoabCanal (L.B.D.C.)
L.B.D.C 0+000 Punjab KasurPjoolnaar(RadhaKishan)
RAVI BallokiBallokiHydropower
Ravi Riverat Balloki Barrage0+000
Punjab
Field Survey Sites
1 10-Nov-2012 Sat.
1 NaturalRiver
NP 627 IdentifiedX (Not
Perennial)
2 Canal P 628 RAVI BallokiB. S. Link MainLine
B. S. Link MainLine
Nankana SahibPjoolnaar(RadhaKishan)
Data Collection Survey on Renewable Energy Development in Pakistan Final Report
January 2013 121 Nippon Koei Co., Ltd.
8.3.2 Potential Project
(1) ADB-F/S Sites
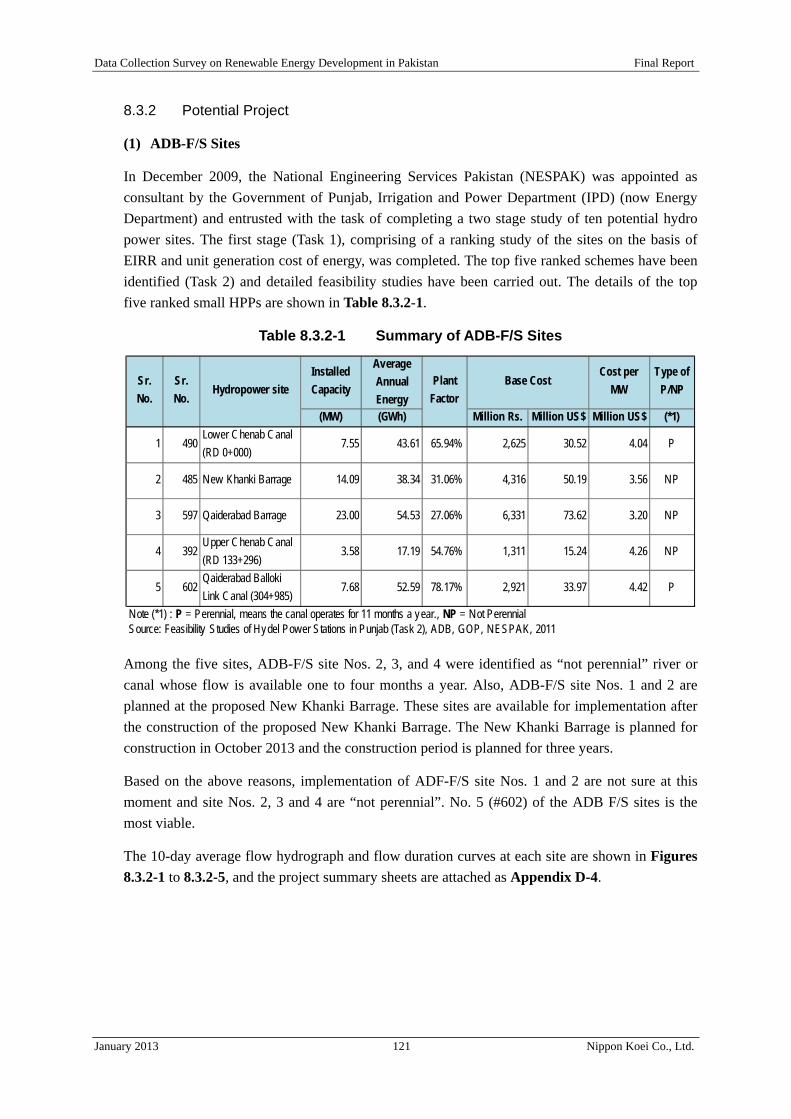
In December 2009, the National Engineering Services Pakistan (NESPAK) was appointed as consultant by the Government of Punjab, Irrigation and Power Department (IPD) (now Energy Department) and entrusted with the task of completing a two stage study of ten potential hydro power sites. The first stage (Task 1), comprising of a ranking study of the sites on the basis of EIRR and unit generation cost of energy, was completed. The top five ranked schemes have been identified (Task 2) and detailed feasibility studies have been carried out. The details of the top five ranked small HPPs are shown in Table 8.3.2-1.
Table 8.3.2-1 Summary of ADB-F/S Sites
Among the five sites, ADB-F/S site Nos. 2, 3, and 4 were identified as “not perennial” river or canal whose flow is available one to four months a year. Also, ADB-F/S site Nos. 1 and 2 are planned at the proposed New Khanki Barrage. These sites are available for implementation after the construction of the proposed New Khanki Barrage. The New Khanki Barrage is planned for construction in October 2013 and the construction period is planned for three years.
Based on the above reasons, implementation of ADF-F/S site Nos. 1 and 2 are not sure at this moment and site Nos. 2, 3 and 4 are “not perennial”. No. 5 (#602) of the ADB F/S sites is the most viable.
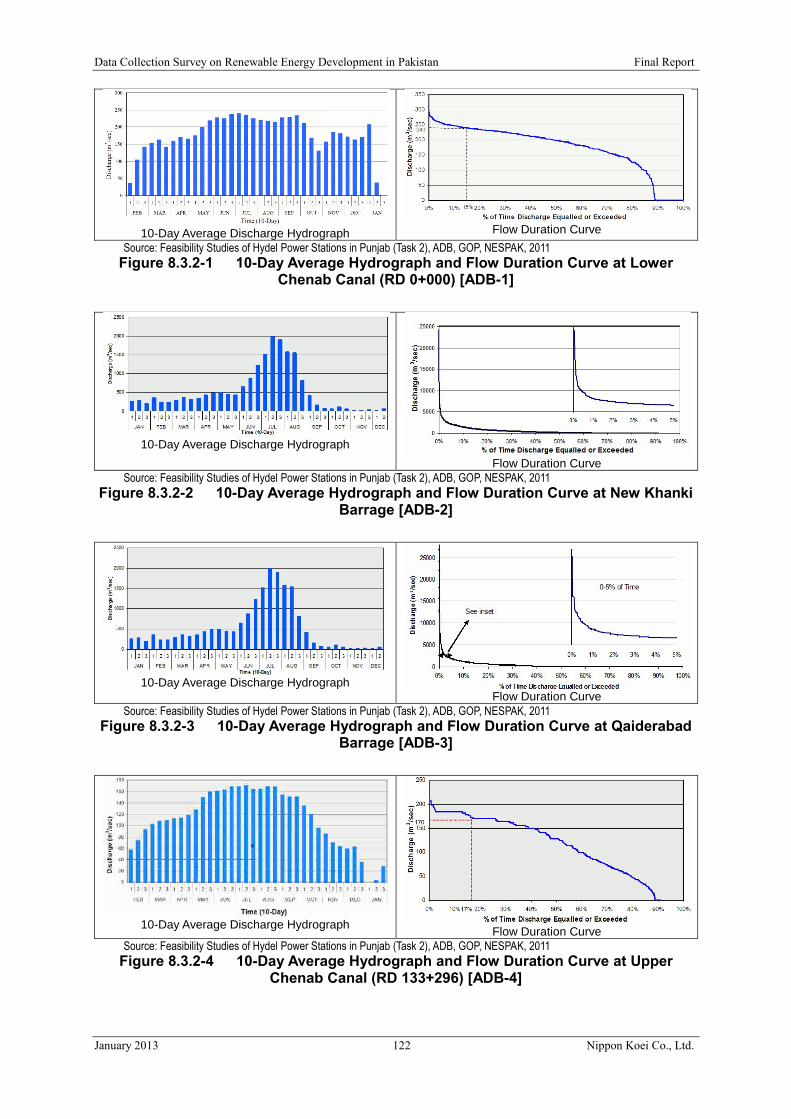
The 10-day average flow hydrograph and flow duration curves at each site are shown in Figures 8.3.2-1 to 8.3.2-5, and the project summary sheets are attached as Appendix D-4.
InstalledCapacity
AverageAnnualEnergy
Base CostCost per
MWType of
P/NP
(MW) (GWh) Million Rs. Million US$ Million US$ (*1)
1 490Lower Chenab Canal(RD 0+000)
7.55 43.61 65.94% 2,625 30.52 4.04 P
2 485 New Khanki Barrage 14.09 38.34 31.06% 4,316 50.19 3.56 NP
3 597 Qaiderabad Barrage 23.00 54.53 27.06% 6,331 73.62 3.20 NP
4 392Upper Chenab Canal(RD 133+296)
3.58 17.19 54.76% 1,311 15.24 4.26 NP
5 602Qaiderabad BallokiLink Canal (304+985)
7.68 52.59 78.17% 2,921 33.97 4.42 P
Note (*1) : P = Perennial, means the canal operates for 11 months a year., NP = Not PerennialSource: Feasibility Studies of Hydel Power Stations in Punjab (Task 2), ADB, GOP, NESPAK, 2011
Sr.No.
Sr.No.
Hydropower sitePlant
Factor
Data Collection Survey on Renewable Energy Development in Pakistan Final Report
January 2013 122 Nippon Koei Co., Ltd.
10-Day Average Discharge Hydrograph
Flow Duration Curve
Source: Feasibility Studies of Hydel Power Stations in Punjab (Task 2), ADB, GOP, NESPAK, 2011
Figure 8.3.2-1 10-Day Average Hydrograph and Flow Duration Curve at Lower Chenab Canal (RD 0+000) [ADB-1]
10-Day Average Discharge Hydrograph
Flow Duration Curve
Source: Feasibility Studies of Hydel Power Stations in Punjab (Task 2), ADB, GOP, NESPAK, 2011
Figure 8.3.2-2 10-Day Average Hydrograph and Flow Duration Curve at New Khanki Barrage [ADB-2]
10-Day Average Discharge Hydrograph
Flow Duration Curve
Source: Feasibility Studies of Hydel Power Stations in Punjab (Task 2), ADB, GOP, NESPAK, 2011
Figure 8.3.2-3 10-Day Average Hydrograph and Flow Duration Curve at Qaiderabad Barrage [ADB-3]
10-Day Average Discharge Hydrograph
Flow Duration Curve
Source: Feasibility Studies of Hydel Power Stations in Punjab (Task 2), ADB, GOP, NESPAK, 2011
Figure 8.3.2-4 10-Day Average Hydrograph and Flow Duration Curve at Upper Chenab Canal (RD 133+296) [ADB-4]

Data Collection Survey on Renewable Energy Development in Pakistan Final Report
January 2013 123 Nippon Koei Co., Ltd.
10-Day Average Discharge Hydrograph Flow Duration Curve
Source: Feasibility Studies of Hydel Power Stations in Punjab (Task 2), ADB, GOP, NESPAK, 2011 Figure 8.3.2-5 10-Day Average Hydrograph and Flow Duration Curve at Qaiderabad
Balloki Link Canal (304+985) [ADB-5]
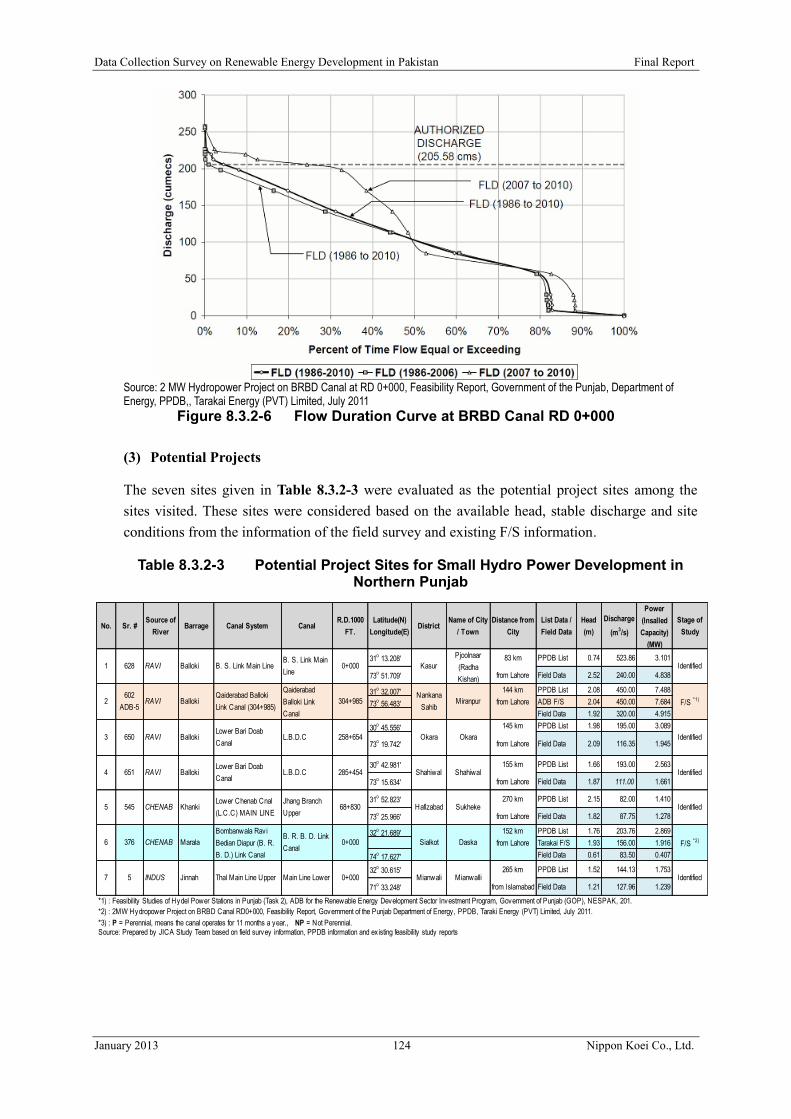
(2) F/S on 2 MW Hydro Power Project on BRBD Canal RD 0+000
The PPDB issued an LOI to Tarakai Energy (PVT) Limited inviting them to undertake the development of a hydro power project at a canal fall located on Bambanwala - Rave - Bedian - Deepalpur (BRBD) Canal. The proposed site for the 2 MW project is located at RD 0+000 of BRBD Canal. The first step in the development process is the preparation of an F/S for the project.
A summary of the F/S on BRBD RD 0+000 is shown in Table 8.3.2-2.
Table 8.3.2-2 Summary of the F/S on the 2 MW Hydro Power Project on BRBD Canal RD 0+000
The flow duration curve for BRBD Canal RD 0+000 is shown in Figure 8.3.2-6. The project summary sheet of BRBD Canal RD 0+000 is attached as Appendix D-4.
InstalledCapacity
AverageAnnualEnergy
Base CostCost per
MW
(MW) (GWh) Million Rs. Million US$ Million US$
376Lower Chenab Canal(RD 0+000)
1.93 12.65 50.6% 1,205 14.087 4.94
Source: 2MW Hydropower Project on BRBD Canal at RD 0+000, Feasibility Report, Government of the Punjab, Department of Energy, PPDB,, Tarakai Energy (PVT) Limited, July 2011
Sr.No.
Hydropower sitePlant
Factor
Data Collection Survey on Renewable Energy Development in Pakistan Final Report
January 2013 124 Nippon Koei Co., Ltd.
Source: 2 MW Hydropower Project on BRBD Canal at RD 0+000, Feasibility Report, Government of the Punjab, Department of Energy, PPDB,, Tarakai Energy (PVT) Limited, July 2011
Figure 8.3.2-6 Flow Duration Curve at BRBD Canal RD 0+000
(3) Potential Projects
The seven sites given in Table 8.3.2-3 were evaluated as the potential project sites among the sites visited. These sites were considered based on the available head, stable discharge and site conditions from the information of the field survey and existing F/S information.
Table 8.3.2-3 Potential Project Sites for Small Hydro Power Development in Northern Punjab
No. Sr. #Source of
RiverBarrage Canal System Canal
R.D.1000
FT.
Latitude(N)
Longitude(E)District
Name of City
/ Town
Distance from
City
List Data /
Field Data
Head
(m)
Discharge
(m3/s)
Power
(Insalled
Capacity)
(MW)
Stage of
Study
31o 13.208' 83 km PPDB List 0.74 523.86 3.101
73o 51.709' from Lahore Field Data 2.52 240.00 4.838
31o 32.007' 144 km PPDB List 2.08 450.00 7.488
73o 56.483' from Lahore ADB F/S 2.04 450.00 7.684
Field Data 1.92 320.00 4.915
30o 45.556' 145 km PPDB List 1.98 195.00 3.089
73o 19.742' from Lahore Field Data 2.09 116.35 1.945
30o 42.981' 155 km PPDB List 1.66 193.00 2.563
73o 15.634' from Lahore Field Data 1.87 111.00 1.661
31o 52.823' 270 km PPDB List 2.15 82.00 1.410
73o 25.966' from Lahore Field Data 1.82 87.75 1.278
32o 21.689' 152 km PPDB List 1.76 203.76 2.869
from Lahore Tarakai F/S 1.93 156.00 1.916
74o 17.627' Field Data 0.61 83.50 0.407
32o 30.615' 265 km PPDB List 1.52 144.13 1.753
71o 33.248' from Islamabad Field Data 1.21 127.96 1.239
*1) : Feasibility Studies of Hydel Power Stations in Punjab (Task 2), ADB for the Renewable Energy Development Sector Investment Program, Government of Punjab (GOP), NESPAK, 201.
*2) : 2MW Hydropower Project on BRBD Canal RD0+000, Feasibility Report, Government of the Punjab Department of Energy, PPDB, Taraki Energy (PVT) Limited, July 2011.
*3) : P = Perennial, means the canal operates for 11 months a year., NP = Not Perennial.Source: Prepared by JICA Study Team based on field survey information, PPDB information and ex isting feasibility study reports
IdentifiedJinnah Thal Main Line Upper Main Line Lower 0+000 Mianwali7 5 INDUS Mianwalli
0+000 Sialkot Daska F/S *2)6 376 CHENAB Marala
Bombanwala Ravi
Bedian Diapur (B. R.
B. D.) Link Canal
B. R. B. D. Link
Canal
Identified68+830 Hafizabad Sukheke5 545 CHENAB KhankiLower Chenab Cnal
(L.C.C) MAIN LINE
Jhang Branch
Upper
285+454 Shahiwal Shahiwal
IdentifiedBallokiLower Bari Doab
CanalL.B.D.C 258+654 Okara
Identified4 651 RAVI BallokiLower Bari Doab
CanalL.B.D.C
304+985Nankana
Sahib
3 650 RAVI Okara
2602
ADB-5RAVI Miranpur F/S
*1)BallokiQaiderabad Balloki
Link Canal (304+985)
Qaiderabad
Balloki Link
Canal
Pjoolnaar
(Radha
Kishan)
IdentifiedBalloki B. S. Link Main LineB. S. Link Main
Line0+000 Kasur1 628 RAVI

Data Collection Survey on Renewable Energy Development in Pakistan Final Report
January 2013 125 Nippon Koei Co., Ltd.
CHAPTER 9 RECOMMENDATION FOR JAPAN'S OFFICIAL
ASSISTANCE
Recommendations of Japanese assistance for RE development in Pakistan are as follows based on the result of the survey:
1. Solar Power Generation Project at Pakistan Institute of Medical Sciences (PIMS)
The project is recommendable for Japanese grant aid. The solar power generation will be a grid-connected system and the PV module of the system will be installed at the premises of PIMS. The project contributes much to the management of PIMS financially by reducing the payment of electricity tariff. The project also helps in disseminating RE in Pakistan in the form of solar power generation.
As mentioned in Sub-chapter 6.2.3, solar power generation system was installed through the Japanese grant aid at the Planning Commission (PC) and at Pakistan Engineering Council (PEC), with each site having 178 kW capacities. At first, the system was a grid-connected solar power generation system in Pakistan, which was a technical breakthrough in the country. This project attracted a high level of interest from the private sector and donors. During the study period, the World Bank representative visited the Study team for the detailed information of this Japan’s grant aid project. Stimulated by this project, the World Bank is now planning to introduce the same grid-connected solar generation system in the whole country of Pakistan. This project became a good technical model in Pakistan.
The recommended solar power generation system at PIMS will become a role model from the financial and technical points of view, as it is the first large-scale grid-connected solar power generation system in Pakistan. Regarding the scale of the project, referring to the trial cost estimation stated in Sub-chapter 8.1.1 and the fact that available land space has not yet been finalized, the installation capacity of 2 MW or more is recommendable in order for the project to contribute financially.
In case that the recommended project is going to be implemented through the Japanese grant aid, it is noted that the detailed topographic and geological surveys at PIMS are essential at the time of preparatory survey.
2. Small Hydro Power Generation Project in Punjab Province
Based on the result of the field survey for small hydro power generation, the potential projects are selected in Sub-chapter 8.3.2. Each of these projects is recommendable for Japanese grant aid and packaging all the projects is also recommendable for Yen loan. There is a huge potential of small hydro power generation utilizing canals in the Punjab province. This potential is almost not yet developed because of the low head for normal hydro development, but it became possible through the application of recent technical improvement.
As order of development, it is recommended to realize the development of low head hydro power generation through Japanese grant aid. Based on the development results, the Yen loan project will be promoted to support the packaged potential projects.

Data Collection Survey on Renewable Energy Development in Pakistan Final Report
January 2013 126 Nippon Koei Co., Ltd.
Besides the development of hydro power, it is recommended to install the PV module over the canal, being a hybrid of hydro and solar power generation. PV module installation over canals at small hydro power development sites solves land acquisition issue, facilitates operation and maintenance of solar power generation with the staff of hydro power generation, and reduces water evaporation from the canal. This technology may lead the project to a Special Terms for Economic Partnership (STEP) project for Yen loan.
3. Technical Assistance to the Provincial Government
Technical assistance to the provincial government for the development of RE is recommendable. As mentioned in Sub-chapter 2.2.7, the provinces in Pakistan are allowed to develop power generation projects up to a maximum capacity of 50 MW through public or private sectors using RE sources. In Sub-chapter 6.8, the bottlenecks in disseminating renewable energy are mentioned. One of the bottlenecks is “Technical Expertise Barriers”. There are needs to develop institutional and human capacities in the provinces. The same kind of needs to AEDB also exists but the necessity of the technical assistance by JICA and the effectiveness of that to the provinces is considered to be high.
Regarding Punjab province, the provincial government has started planning to prepare the RE Policy of Punjab, and requested the Study team to convey their request for assistance in policy making to JICA. With the policy making, it is recommended for the dissemination of RE to build up rules and regulations to exempt the scheduled load shedding from feeders to which the RE-based electricity generators are connected. This will lead to trading of the saved electricity from load shedding and generating electricity through RE generation. Besides, the database preparation for hydro power development is a potential area of interest for the JICA technical assistance.
4. Wind Power Generation Project in Sindh Province
Large-scale wind power generation project in Sindh province is recommendable for Yen loan project. In the southern part of Sindh province, there is the wind power potential and land is properly arranged for the developers. The private sector has already commenced the wind farm project, thus, the risk of the project implementation is relatively low.

Appendix of Draft of Final Report
Data Collection Survey on
Renewable Energy Development in
Pakistan by
Japan International Cooperation Agency (JICA)

List of Appendixes
Appendix A (Institution)
Appendix A-1: Information of AEDB
Appendix A-1-1: AEDB Act Appendix A-1-2: Main Staffs of AEDB
Appendix A-2: Information of PCRET
Appendix A-2-1: Renewable Energy Experts of PCRET
Appendix A-3: Regulation and Tariff
Appendix A-3-1: Parts of Regulation and Rules of the RE Policy Appendix A-3-2: Upfront Tariff
Appendix B (Solar)
Appendix B-1: Monthly averaged Insolation incidents on Horizontal Surface Appendix B-2: Average, Minimum and Maximum of the Daily Mean Earth Temperature Appendix B-3: Information of PIMS
Appendix B-3-1: Organization Chart Appendix B-3-2: Layout of PIMS Appendix B-3-3: Power Consumption Record of PIMS Appendix B-3-4: Skeleton Diagram of PIMS Appendix B-3-5: Topographic Map of PIMS Site Appendix B-3-6: Photographs of PIMS Site Appendix B-3-7: Open Space for Installation
Appendix B-4: Site Reconnaissance Report
Appendix B-4-1: Longlist of the Candidate Sites for the Field Survey of Hospitals Appendix B-4-2: Longlist of the Candidate Sites for the Field Survey of Universities Appendix B-4-3: Airport Appendix B-4-4: Hospital Appendix B-4-5: University Appendix B-4-6: Summarized information collected from hospital and universities
Appendix C (Wind)
Appendix C-1: Monthly Benchmark Wind Speeds Appendix C-2: GPS Coordinates for Wind Masts installed in Sindh Province Appendix C-3: List of Letter of Intent (LOI) Holder Project Developers
Appendix C-4: Summary of Existing Projects (Wind Power) Appendix C-5: Photographs of the Sites of Wind Power
Appendix C-5-1: Photographs of the Wind Farms in Jhimpir Appendix C-5-2: Photographs of the Wind Masts visited during the Survey
Appendix C-6: Geological Map of Gharo-Keti Bandar Wind Corridor and Wind Farm Sites
Appendix D (Small Hydro)
Appendix D-1: Small Hydro Power Potential on Rivers and Canal Falls in Punjab Appendix D-2: Selected Field Sites Appendix D-3: Photographs of Potential Sites of Small Hydro Appendix D-4: Project Summery Sheets
Appendix E (Market)
Appendix E-1: Prices of Related Equipments in Market Appendix E-2: Prices of Solar PV System in Market Appendix E-3: Photographs of Local Shops dealing Solar Energy Equipment

Appendix A-1
Information of AEDB
Appendix A-1-1
AEDB Act 1
Appendix A-1-1: AEDB Act
Appendix A-1-1
AEDB Act 2
Appendix A-1-1
AEDB Act 3

Appendix A-1-1
AEDB Act 4

Appendix A-1-1
AEDB Act 5

Appendix A-1-1
AEDB Act 6

Appendix A-1-1
AEDB Act 7

Appendix A-1-1
AEDB Act 8

Appendix A-1-1
AEDB Act 9

Appendix A-1-1
AEDB Act 10

Appendix A-1-1
AEDB Act 11

Appendix A-1-2
Main Staffs of AEDB
Appendix A-1-2: Main Staffs of AEDB
Name Designation Phone Number Mr. Arif Alauddin Chief Executive Officer 051-9262956 Mr. Muhammad Anwar Ali Secretary AEDB 051-9262947 Dr. Basharat Hasan Bashir Consultant 051-9262947 Mr. Navid Hassan Bokhari Director (Solar) 051-9266374 Mr.Imran Ahmed Director (REP) 051-2215348 Mr. Jahanzeb Dilazaq Director (F&A) 051-9262957 Mr. Nadeem Sabir Virk DD(Admin) 051-9262953 Mr. Jahangir Kakar DDO(Dev) 051-9262947 Mr. Irfan Yousuf Dy.Director(PA & CDM) 051-9262948 Mr. Sheeraz Anwar Khan Dy.Director(DM) / Officer Incharge(COK) 021-35342708 Syed Aqeel Hussain Jafri Dy.Director(Policy) 051-9262947 Mr. Naeem Memon Dy.Director(Compilation) 021-35342708 Mr. Sulman Ishaque Malik Dy.Director (H&W) 051-9262964 Mr. Muhammad Asghar Assistant Director(HR) 051-9262948 Mr. Muhammad Bilal Assistant Director(IT) 051-9262951 Mr. Haq Nawaz Malik Protocol Officer 051-9262948 Mr. Ali Nawaz Channa Admin / Financial Officer(COK) 021-35342708
Source: Website of AEDB (http://www.aedb.org/StaffMembers.htm) as of October 19. 2012

Appendix A-2
Information of PCRET

Appendix A-2-1
Main Staffs & Renewable Energy Experts of PCRET
Appendix A-2-1: Renewable Energy Experts of PCRET
Name Designation / Field Mr. Shaheen Raja Director General Mr. Syed Jalaluddin Shah Deputy Director General Engr Anwer Aziz Head Commercialization Photovoltaic (Solar Energy Systems Fabrication and Installation) Mr. Munwar Ahmed Head Solar Energy (Photovoltaic) Mr. Ashraf Baig Photovoltaic Device Fabrication, Solar Cell Fabrication,
Photovoltaic Systems Sizing and Installation Mr. Muhammad Nadeem Zakir In charge: Crystal Growth, Photovoltaic Systems Sizing and
Installation Mr. Muhammad Hashim Sheikh In charge: Lamination Laboratory Dr. Afzal Kamboh In charge: Organic Solar Cells Laboratory Engr. Amjad Khan Field: Photovoltaic, Electronic Solar Thermal (Solar Water Heating, Drying, Cooking and Desalination) Mr. Saeed Hussain In charge: Solar Thermal and Solar Testing Laboratory Mr. Muhammad Akram Solar Testing Labs PV and Solar Thermal Systems Testing Mr.Azam Ali Khan Field: Solar Thermal (Solar Cooking, Solar Water Heating, Solar
Drying and Solar Desalination), Biogas Wind, Biogas and Micro hydel Power Engr.Samiullah Sheikh Head of Regional Office Lahore Mr. Hakim Ali Siyal Head of Regional Office, Karachi Mr. Badar-ud-Din Head of Regional Office, Quetta Mr. Sarfraz Khan Khattak Head of Regional Office, Peshawar Mr. Muhammad Nabi Field: Microhydel, Biogas Mr. Rauf Ahmed Project Director Mr. M. Sultan Khoso Field: Appropriate Technology / Renewable Energy (Biogas) Mr. Abdul Hameed Saand Field: Computer Science /Renewable Energy Miss. Sohaila Andalib Field: Biogas, Analytical Chemistry Project Up gradation of facilities to produce Silicon Solar Modules up to 80kW annual capacity Mr. S.D. Orfi Project Director Engr. Zafar Javed Advisor Dr. Jalal Bukhari Consultant Engr. Malik Muhammad Aslam Consultant Engr. Ch Bashir Ahmed Advisor Mr. Abdul Majeed Deputy Director Miss. Farhana Jabeen Field: Photovoltaic, Physics Mr. Azmat Ullah Field: Photovoltaic, Physics
Source: Website of PCRET (http://www.pcret.gov.pk/) as of October 19. 2012
Appendix A-3
Regulation and Tariff
Appendix A-3-1
Parts of Regulation and Rules of the RE Policy 1
Appendix A-3-1: Parts of Regulation and Rules of the RE Policy
(i) Scope of the RE Policy
The RE Policy deals the following renewable energies:
Small hydro power of 50 MW or less capacity Solar photovoltaic (PV) and thermal energy for power generation Wind power generation
Other RE power generation technologies are out of the scope of the RE Policy.
(ii) Categories of Power Generation Project for Private Sector
The major objective of the RE Policy is to attract the private sector investments for renewable energy development. In order to regulate the participation of private sector, the following categories of renewable energy projects are stipulated in the RE Policy.
i) Independent power projects based on new plants for sale of power to the grid only : the projects of Independent Power Producers (IPPs)
ii) Captive and grid spillover projects (i.e., self-use and sale to utility) iii) Captive power projects (i.e., for self or dedicated use) iv) Isolated grid power projects (i.e., small, stand-alone)
The projects categorized into i) and iv) of the above are further categorized into the following two types.
Solicited Unsolicited
Solicited projects are those where feasibility study has already been conducted and the implementation of new power generation projects will be processed as solicited proposals. Unsolicited sites are raw sites where feasibility study works needs to be initiated for exploring the site power potential. In other words where no feasibility study has been conducted or initiated, those projects will be analyzed as raw site or unsolicited site projects.
(iii) General Incentives for RE Power Generators of All Categories
The following provisions are stated in the RE Policy. It is stated that the provisions shall be made available to all the renewable energy-based power projects of all the categories.
i. Mandatory Purchase of Electricity
It shall be mandatory for the power distribution utilities to buy all the electricity offered to them by RE projects.
ii. Grid Connection, Off-take Voltage and Interface
Electricity shall be purchased from RE power producers at the outgoing bus bar of power station at the designated voltages 220 kV, 132 kV, 11 kV, and 400 V depending on the distance from the
Appendix A-3-1
Parts of Regulation and Rules of the RE Policy 2
power station to the existing transmission line.
iii. Wheeling
RE power producers shall be allowed to enter into direct (bilateral) sales contracts with end-user consumers. For direct sales, RE power producers shall be required to pay wheeling charges for the use of transmission and/or distribution grid network used to transport he power from the plant to the purchaser.
(iv) Specific Incentives for Grid-connected RE IPPs
The following provisions are stated in the RE Policy for the projects of the category i.e.: the projects of IPPs selling all generated electricity (minus auxiliary consumption) to the grid.
i. RE Resource Variability Risk
The risk of variability in wind speeds (for wind power projects) and water flow (for small hydro power project) shall be borne by the power purchaser in the manner described in Guideline for Determination of Tariff for Grid-Connected IPPs (referred to as “the Guideline-A” in this report) which is a part of the RE Policy document as Annex-A.
“Benchmark” electricity production levels based on mean availability of wind or water flow for the month shall be determined for each project location on the basis of independently monitored data. The IPPs shall be ensured revenues corresponding to this benchmark level, including potential loss of corresponding carbon credits.
ii. Production Incentives
For all power produced above than the benchmark level, a production bonus payment shall be made to the IPP, detailed for wind and hydro generation in the Guideline-A.
iii. Carbon Credits
All RE power projects of wind and small hydro IPPs eligible for financing under the Clean Development Mechanism (CDM) shall be encouraged to resister for Certified Emission Reduction (CER) credits with the CDM Executive Board, either collectively or individually.
iv. Security Package
The power purchaser shall enter into a specific Power Purchase Agreement (PPA), based on a standard model agreement, with RE power producer. The GOP shall also enter into an Implementation Agreement (IA) which will guarantee the payment obligation of the public sector power purchaser on account of sales extending over the term of the PPA.
(v) Facilities for Captive and Grid Spillover Projects
The following provisions are stated as facilities in the RE Policy for the projects of the category ii: the captive and spillover power projects.
i. Net Purchase and Sales - or Net Billing
An RE power project of the capacity greater than 1 MW set up for self (captive) or dedicated use

Appendix A-3-1
Parts of Regulation and Rules of the RE Policy 3
may supply surplus electricity to the power utility (grid spillover), while at other times drawing electricity from the utility. In such case, the net electricity:
supplied by the power producer to the utility in a month (i.e., units supplied by the producer minus units received by the producer, if it is greater than zero) shall be paid for by the utility at the tariff equal to the average energy cost per kWh for oil based-based power generation (as determined by the NEPRA for GENCOs/IPPs over applicable quarter of the year) less 10%, or
supplied by the utility to the power producer in a month (i.e., units received by the producer minus units supplied by the producer, if it is greater than zero) shall be paid for by the producer at the applicable retail tariff
ii. Net Metering
An RE power project of the capacity up to 1 MW set up for self (captive) or dedicated use may also supply surplus electricity to the power utility, while at other times drawing electricity from the utility. In such case, the net electricity:
supplied by the power producer to the utility in a month (i.e., units supplied by the producer minus units received by the producer, if it is greater than zero), or
supplied by the utility to the power producer in a month (i.e., units received by the producer minus units supplied by the producer, if it is greater than zero),
shall be paid for by the utility or the producer, at the applicable retail tariff.
iii. Banking of Net Energy Units for Net Billing
For net billing purposes, a rolling account of energy units will be maintained on the pattern of a bank account (i.e., debit or credit basis). Such banking accounts of net energy units shall be maintained on a monthly basis and final balance will be reconciled at the end of the year.
iv. Wheeling Charges for Net Billing
Under the arrangement of net billing, a producer may generate and supply power to the grid at one location and receive equivalent number of units for self use (say, factory) at a different or physically distant location on the grid at different time without paying any wheeling charges.
(vi) Facilities for Off-grid and Dispersed RE Power Generation
Off-grid power generation wholly for captive or dedicated use (category iii), or for supply to a local community through small isolated distribution lines not connected to the utility grid (category iv), shall be greatly deregulated and simplified.
(vii) Procedure for Setting Up IPPs for Sale of All Power to Grid
The procedure for setting up an IPP is different for solicited and unsolicited or raw sites. Proposals for solicited sites will be processed for selection of successful bidders on the basis of minimum levelized tariff through competitive bidding. Variable tariff over the life of the project will be permitted under the terms specified in the Request for Proposal (RFP). The process of selection involves pre-qualification, issuance of RFP, bidding and evaluation in accordance with
Appendix A-3-1
Parts of Regulation and Rules of the RE Policy 4
the bidding criteria laid down in RFP.
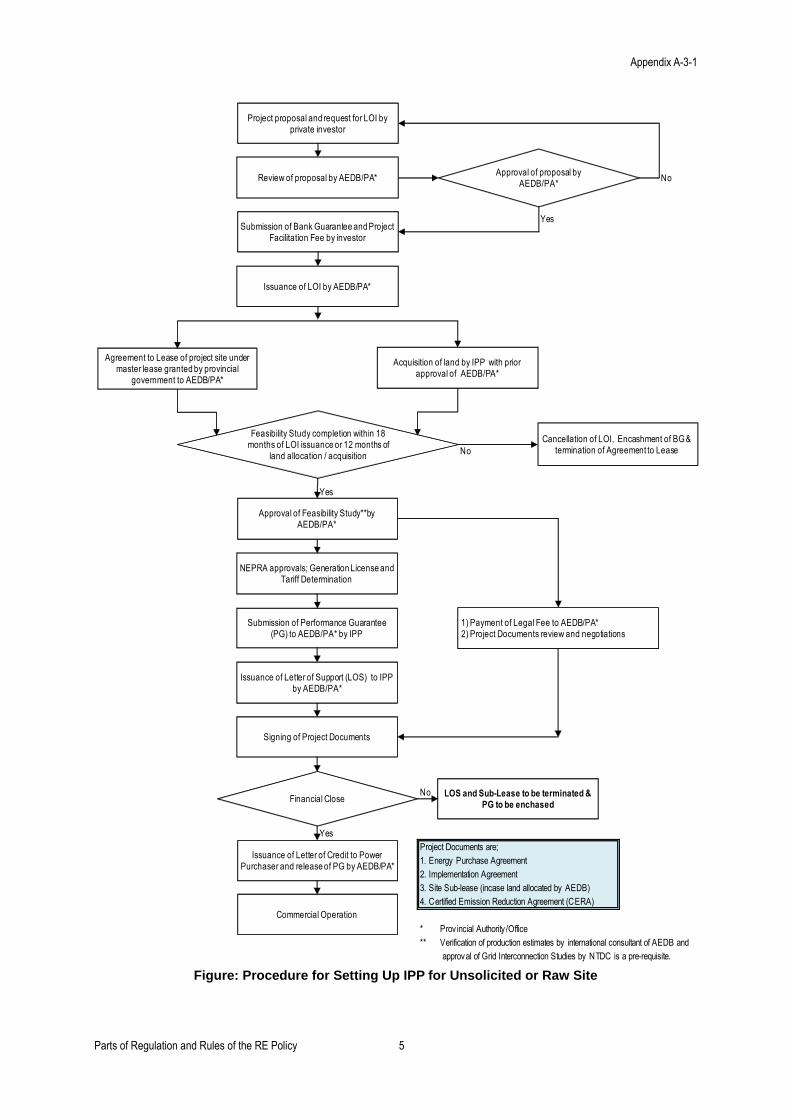
Unsolicited site or raw site proposals shall be submitted to either AEDB or concerned provincial authority. If the proposal is approved by AEDB or concerned provincial authority, Letter of Intent (LOI) is issued after submission of bank guarantee. In cases there is more than one investor for an unsolicited or raw site, each investor will be required to submit Pre-Qualification Documents (PQD) for the project. The procedure including the same after obtaining LOI is shown in the flow chart below.
Appendix A-3-1
Parts of Regulation and Rules of the RE Policy 5
Figure: Procedure for Setting Up IPP for Unsolicited or Raw Site
No
Yes
No
Yes
No
Yes
Project Documents are;
1. Energy Purchase Agreement
2. Implementation Agreement
3. Site Sub-lease (incase land allocated by AEDB)
4. Certified Emission Reduction Agreement (CERA)
* Prov incial Authority /Office
** Verification of production estimates by international consultant of AEDB and
approval of Grid Interconnection Studies by NTDC is a pre-requisite.
Project proposal and request for LOI by private investor
Review of proposal by AEDB/PA*Approval of proposal by
AEDB/PA*
Submission of Bank Guarantee and Project Facilitation Fee by investor
Issuance of LOI by AEDB/PA*
Agreement to Lease of project site under master lease granted by provincial
government to AEDB/PA*
Acquisition of land by IPP with prior approval of AEDB/PA*
Feasibility Study completion within 18 months of LOI issuance or 12 months of
land allocation / acquisition
Approval of Feasibility Study**by AEDB/PA*
Cancellation of LOI, Encashment of BG & termination of Agreement to Lease
NEPRA approvals; Generation License and Tariff Determination
Submission of Performance Guarantee (PG) to AEDB/PA* by IPP
1) Payment of Legal Fee to AEDB/PA*2) Project Documents review and negotiations
Issuance of Letter of Support (LOS) to IPP by AEDB/PA*
Signing of Project Documents
Financial CloseLOS and Sub-Lease to be terminated &
PG to be enchased
Issuance of Letter of Credit to Power Purchaser and release of PG by AEDB/PA*
Commercial Operation

Appendix A-3-2
Details of Distribution Company (DISCO) and Its License Holders 1
Appendix A-3-2: Upfront Tariff
In RE or ARE based technologies GOP through NEPRA had already announced the upfront tariff for wind based RE Power projects in the country but so far no upfront tariff has been announced for other RE or ARE based power plants. According to AEDB sources, NEPRA is in process of calculating upfront tariff for solar based IPPs and most likely it will be announced in next 2-3 months time: January or February 2013. The announced upfront tariff for wind power generation is shown in the following tables.
The principal loan repayment is taken at 10 years.

Appendix A-3-2
Details of Distribution Company (DISCO) and Its License Holders 2
Table: Upfront Tariff on the basis of project structure of Equity plus 100% Foreign Loan
Appendix A-3-3
Details of Distribution Company (DISCO) and Its License Holders 1
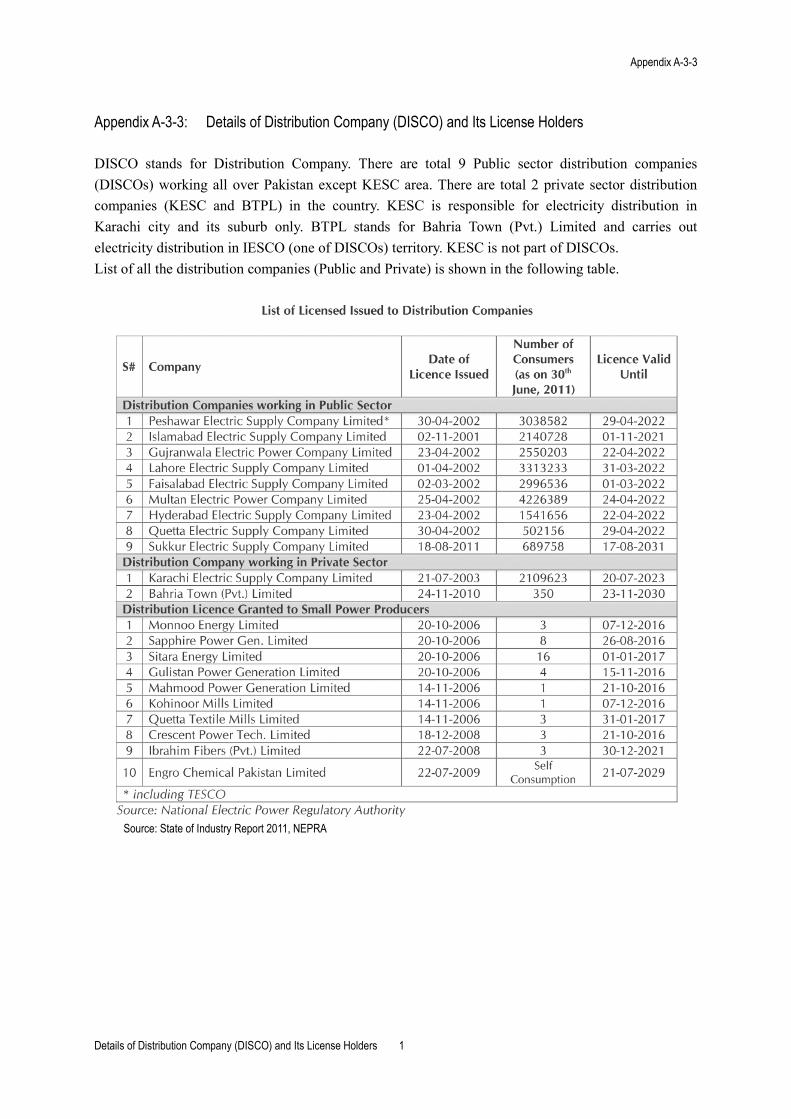
Appendix A-3-3: Details of Distribution Company (DISCO) and Its License Holders
DISCO stands for Distribution Company. There are total 9 Public sector distribution companies (DISCOs) working all over Pakistan except KESC area. There are total 2 private sector distribution companies (KESC and BTPL) in the country. KESC is responsible for electricity distribution in Karachi city and its suburb only. BTPL stands for Bahria Town (Pvt.) Limited and carries out electricity distribution in IESCO (one of DISCOs) territory. KESC is not part of DISCOs. List of all the distribution companies (Public and Private) is shown in the following table.
Source: State of Industry Report 2011, NEPRA

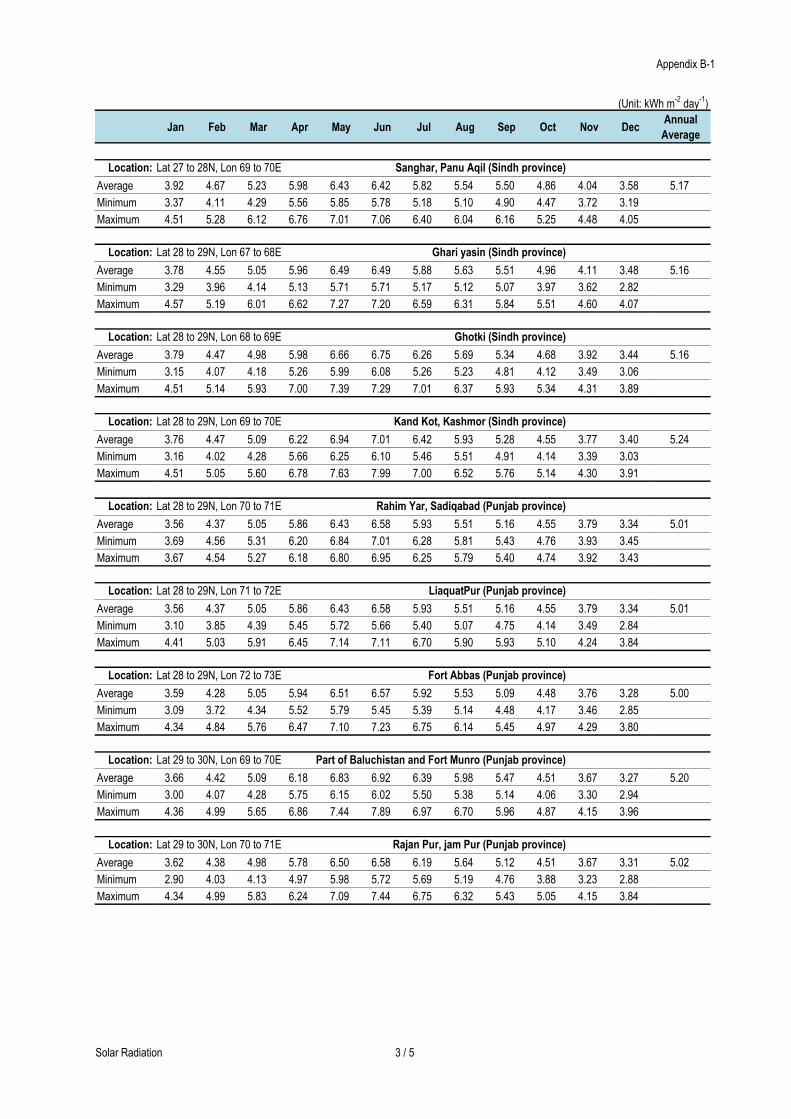
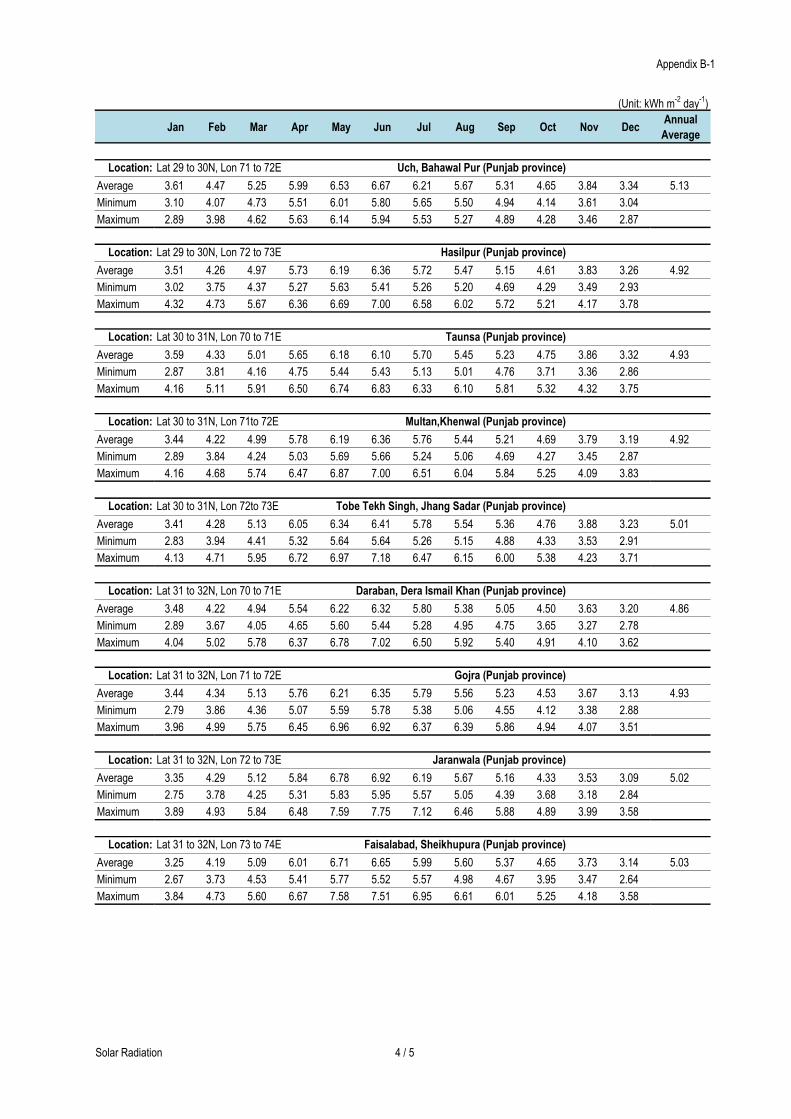
Appendix B-1
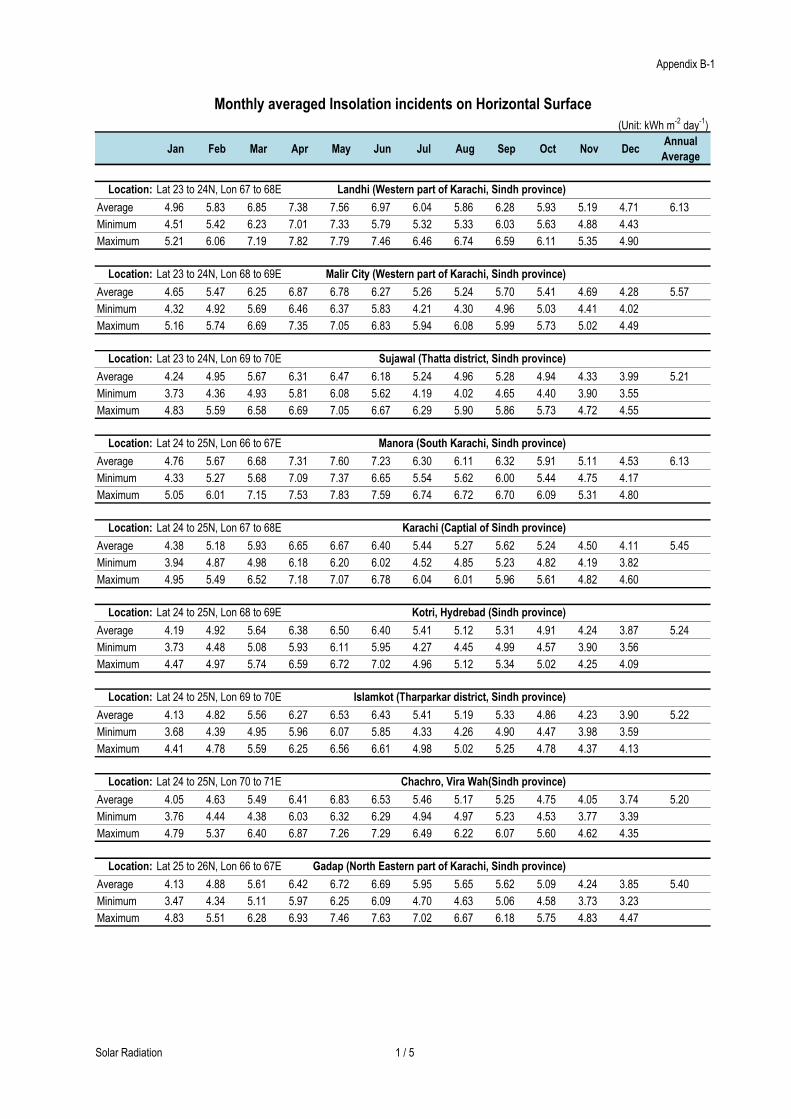
Monthly averaged Insolation incidents on
Horizontal Surface
(Source: NASA)
Appendix B-1
(Unit: kWh m-2
day-1
)
Jan Feb Mar Apr May Jun Jul Aug Sep Oct Nov DecAnnual
Average
Location: Lat 23 to 24N, Lon 67 to 68E Landhi (Western part of Karachi, Sindh province)
Average 4.96 5.83 6.85 7.38 7.56 6.97 6.04 5.86 6.28 5.93 5.19 4.71 6.13
Minimum 4.51 5.42 6.23 7.01 7.33 5.79 5.32 5.33 6.03 5.63 4.88 4.43
Maximum 5.21 6.06 7.19 7.82 7.79 7.46 6.46 6.74 6.59 6.11 5.35 4.90
Location: Lat 23 to 24N, Lon 68 to 69E Malir City (Western part of Karachi, Sindh province)
Average 4.65 5.47 6.25 6.87 6.78 6.27 5.26 5.24 5.70 5.41 4.69 4.28 5.57
Minimum 4.32 4.92 5.69 6.46 6.37 5.83 4.21 4.30 4.96 5.03 4.41 4.02
Maximum 5.16 5.74 6.69 7.35 7.05 6.83 5.94 6.08 5.99 5.73 5.02 4.49
Location: Lat 23 to 24N, Lon 69 to 70E Sujawal (Thatta district, Sindh province)
Average 4.24 4.95 5.67 6.31 6.47 6.18 5.24 4.96 5.28 4.94 4.33 3.99 5.21
Minimum 3.73 4.36 4.93 5.81 6.08 5.62 4.19 4.02 4.65 4.40 3.90 3.55
Maximum 4.83 5.59 6.58 6.69 7.05 6.67 6.29 5.90 5.86 5.73 4.72 4.55
Location: Lat 24 to 25N, Lon 66 to 67E Manora (South Karachi, Sindh province)
Average 4.76 5.67 6.68 7.31 7.60 7.23 6.30 6.11 6.32 5.91 5.11 4.53 6.13
Minimum 4.33 5.27 5.68 7.09 7.37 6.65 5.54 5.62 6.00 5.44 4.75 4.17
Maximum 5.05 6.01 7.15 7.53 7.83 7.59 6.74 6.72 6.70 6.09 5.31 4.80
Location: Lat 24 to 25N, Lon 67 to 68E Karachi (Captial of Sindh province)
Average 4.38 5.18 5.93 6.65 6.67 6.40 5.44 5.27 5.62 5.24 4.50 4.11 5.45
Minimum 3.94 4.87 4.98 6.18 6.20 6.02 4.52 4.85 5.23 4.82 4.19 3.82
Maximum 4.95 5.49 6.52 7.18 7.07 6.78 6.04 6.01 5.96 5.61 4.82 4.60
Location: Lat 24 to 25N, Lon 68 to 69E Kotri, Hydrebad (Sindh province)
Average 4.19 4.92 5.64 6.38 6.50 6.40 5.41 5.12 5.31 4.91 4.24 3.87 5.24
Minimum 3.73 4.48 5.08 5.93 6.11 5.95 4.27 4.45 4.99 4.57 3.90 3.56
Maximum 4.47 4.97 5.74 6.59 6.72 7.02 4.96 5.12 5.34 5.02 4.25 4.09
Location: Lat 24 to 25N, Lon 69 to 70E Islamkot (Tharparkar district, Sindh province)
Average 4.13 4.82 5.56 6.27 6.53 6.43 5.41 5.19 5.33 4.86 4.23 3.90 5.22
Minimum 3.68 4.39 4.95 5.96 6.07 5.85 4.33 4.26 4.90 4.47 3.98 3.59
Maximum 4.41 4.78 5.59 6.25 6.56 6.61 4.98 5.02 5.25 4.78 4.37 4.13
Location: Lat 24 to 25N, Lon 70 to 71E Chachro, Vira Wah(Sindh province)
Average 4.05 4.63 5.49 6.41 6.83 6.53 5.46 5.17 5.25 4.75 4.05 3.74 5.20
Minimum 3.76 4.44 4.38 6.03 6.32 6.29 4.94 4.97 5.23 4.53 3.77 3.39
Maximum 4.79 5.37 6.40 6.87 7.26 7.29 6.49 6.22 6.07 5.60 4.62 4.35
Location: Lat 25 to 26N, Lon 66 to 67E Gadap (North Eastern part of Karachi, Sindh province)
Average 4.13 4.88 5.61 6.42 6.72 6.69 5.95 5.65 5.62 5.09 4.24 3.85 5.40
Minimum 3.47 4.34 5.11 5.97 6.25 6.09 4.70 4.63 5.06 4.58 3.73 3.23
Maximum 4.83 5.51 6.28 6.93 7.46 7.63 7.02 6.67 6.18 5.75 4.83 4.47
Monthly averaged Insolation incidents on Horizontal Surface
Solar Radiation 1 / 5
Appendix B-1
(Unit: kWh m-2
day-1
)
Jan Feb Mar Apr May Jun Jul Aug Sep Oct Nov DecAnnual
Average
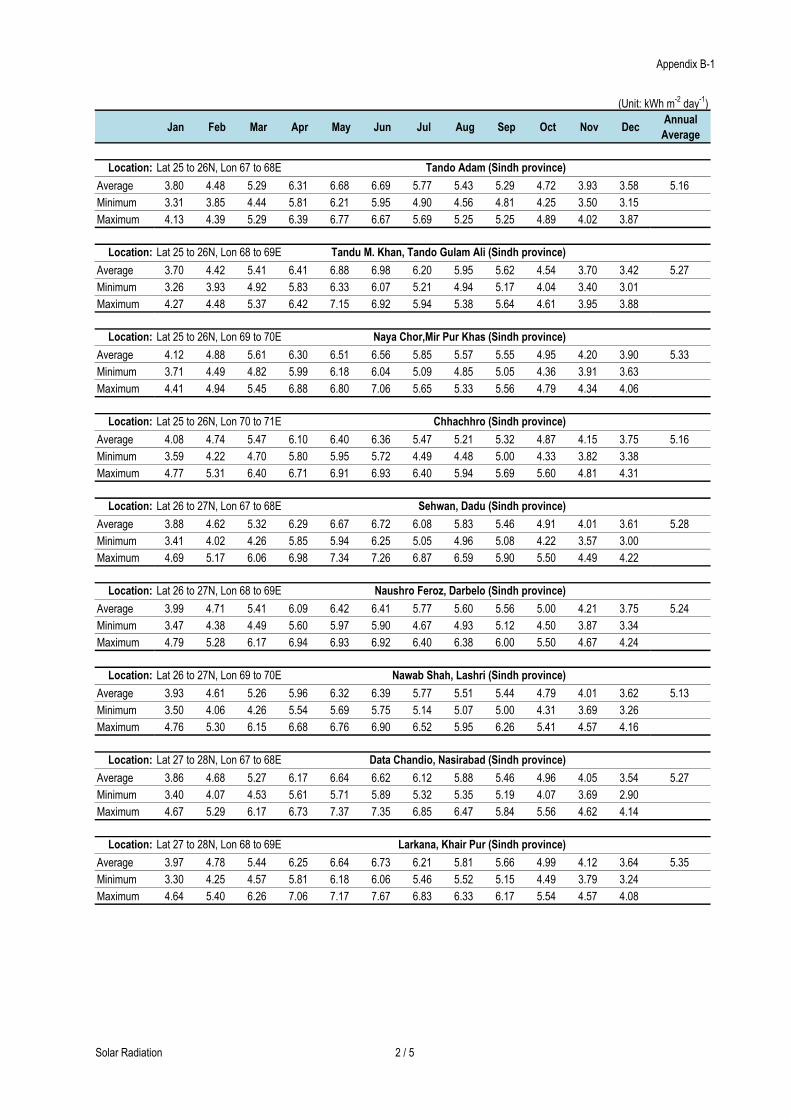
Location: Lat 25 to 26N, Lon 67 to 68E Tando Adam (Sindh province)
Average 3.80 4.48 5.29 6.31 6.68 6.69 5.77 5.43 5.29 4.72 3.93 3.58 5.16
Minimum 3.31 3.85 4.44 5.81 6.21 5.95 4.90 4.56 4.81 4.25 3.50 3.15
Maximum 4.13 4.39 5.29 6.39 6.77 6.67 5.69 5.25 5.25 4.89 4.02 3.87
Location: Lat 25 to 26N, Lon 68 to 69E Tandu M. Khan, Tando Gulam Ali (Sindh province)
Average 3.70 4.42 5.41 6.41 6.88 6.98 6.20 5.95 5.62 4.54 3.70 3.42 5.27
Minimum 3.26 3.93 4.92 5.83 6.33 6.07 5.21 4.94 5.17 4.04 3.40 3.01
Maximum 4.27 4.48 5.37 6.42 7.15 6.92 5.94 5.38 5.64 4.61 3.95 3.88
Location: Lat 25 to 26N, Lon 69 to 70E Naya Chor,Mir Pur Khas (Sindh province)
Average 4.12 4.88 5.61 6.30 6.51 6.56 5.85 5.57 5.55 4.95 4.20 3.90 5.33
Minimum 3.71 4.49 4.82 5.99 6.18 6.04 5.09 4.85 5.05 4.36 3.91 3.63
Maximum 4.41 4.94 5.45 6.88 6.80 7.06 5.65 5.33 5.56 4.79 4.34 4.06
Location: Lat 25 to 26N, Lon 70 to 71E Chhachhro (Sindh province)
Average 4.08 4.74 5.47 6.10 6.40 6.36 5.47 5.21 5.32 4.87 4.15 3.75 5.16
Minimum 3.59 4.22 4.70 5.80 5.95 5.72 4.49 4.48 5.00 4.33 3.82 3.38
Maximum 4.77 5.31 6.40 6.71 6.91 6.93 6.40 5.94 5.69 5.60 4.81 4.31
Location: Lat 26 to 27N, Lon 67 to 68E Sehwan, Dadu (Sindh province)
Average 3.88 4.62 5.32 6.29 6.67 6.72 6.08 5.83 5.46 4.91 4.01 3.61 5.28
Minimum 3.41 4.02 4.26 5.85 5.94 6.25 5.05 4.96 5.08 4.22 3.57 3.00
Maximum 4.69 5.17 6.06 6.98 7.34 7.26 6.87 6.59 5.90 5.50 4.49 4.22
Location: Lat 26 to 27N, Lon 68 to 69E Naushro Feroz, Darbelo (Sindh province)
Average 3.99 4.71 5.41 6.09 6.42 6.41 5.77 5.60 5.56 5.00 4.21 3.75 5.24
Minimum 3.47 4.38 4.49 5.60 5.97 5.90 4.67 4.93 5.12 4.50 3.87 3.34
Maximum 4.79 5.28 6.17 6.94 6.93 6.92 6.40 6.38 6.00 5.50 4.67 4.24
Location: Lat 26 to 27N, Lon 69 to 70E Nawab Shah, Lashri (Sindh province)
Average 3.93 4.61 5.26 5.96 6.32 6.39 5.77 5.51 5.44 4.79 4.01 3.62 5.13
Minimum 3.50 4.06 4.26 5.54 5.69 5.75 5.14 5.07 5.00 4.31 3.69 3.26
Maximum 4.76 5.30 6.15 6.68 6.76 6.90 6.52 5.95 6.26 5.41 4.57 4.16
Location: Lat 27 to 28N, Lon 67 to 68E Data Chandio, Nasirabad (Sindh province)
Average 3.86 4.68 5.27 6.17 6.64 6.62 6.12 5.88 5.46 4.96 4.05 3.54 5.27
Minimum 3.40 4.07 4.53 5.61 5.71 5.89 5.32 5.35 5.19 4.07 3.69 2.90
Maximum 4.67 5.29 6.17 6.73 7.37 7.35 6.85 6.47 5.84 5.56 4.62 4.14
Location: Lat 27 to 28N, Lon 68 to 69E Larkana, Khair Pur (Sindh province)
Average 3.97 4.78 5.44 6.25 6.64 6.73 6.21 5.81 5.66 4.99 4.12 3.64 5.35
Minimum 3.30 4.25 4.57 5.81 6.18 6.06 5.46 5.52 5.15 4.49 3.79 3.24
Maximum 4.64 5.40 6.26 7.06 7.17 7.67 6.83 6.33 6.17 5.54 4.57 4.08
Solar Radiation 2 / 5
Appendix B-1
(Unit: kWh m-2
day-1
)
Jan Feb Mar Apr May Jun Jul Aug Sep Oct Nov DecAnnual
Average
Location: Lat 27 to 28N, Lon 69 to 70E Sanghar, Panu Aqil (Sindh province)
Average 3.92 4.67 5.23 5.98 6.43 6.42 5.82 5.54 5.50 4.86 4.04 3.58 5.17
Minimum 3.37 4.11 4.29 5.56 5.85 5.78 5.18 5.10 4.90 4.47 3.72 3.19
Maximum 4.51 5.28 6.12 6.76 7.01 7.06 6.40 6.04 6.16 5.25 4.48 4.05
Location: Lat 28 to 29N, Lon 67 to 68E Ghari yasin (Sindh province)
Average 3.78 4.55 5.05 5.96 6.49 6.49 5.88 5.63 5.51 4.96 4.11 3.48 5.16
Minimum 3.29 3.96 4.14 5.13 5.71 5.71 5.17 5.12 5.07 3.97 3.62 2.82
Maximum 4.57 5.19 6.01 6.62 7.27 7.20 6.59 6.31 5.84 5.51 4.60 4.07
Location: Lat 28 to 29N, Lon 68 to 69E Ghotki (Sindh province)
Average 3.79 4.47 4.98 5.98 6.66 6.75 6.26 5.69 5.34 4.68 3.92 3.44 5.16
Minimum 3.15 4.07 4.18 5.26 5.99 6.08 5.26 5.23 4.81 4.12 3.49 3.06
Maximum 4.51 5.14 5.93 7.00 7.39 7.29 7.01 6.37 5.93 5.34 4.31 3.89
Location: Lat 28 to 29N, Lon 69 to 70E Kand Kot, Kashmor (Sindh province)
Average 3.76 4.47 5.09 6.22 6.94 7.01 6.42 5.93 5.28 4.55 3.77 3.40 5.24
Minimum 3.16 4.02 4.28 5.66 6.25 6.10 5.46 5.51 4.91 4.14 3.39 3.03
Maximum 4.51 5.05 5.60 6.78 7.63 7.99 7.00 6.52 5.76 5.14 4.30 3.91
Location: Lat 28 to 29N, Lon 70 to 71E Rahim Yar, Sadiqabad (Punjab province)
Average 3.56 4.37 5.05 5.86 6.43 6.58 5.93 5.51 5.16 4.55 3.79 3.34 5.01
Minimum 3.69 4.56 5.31 6.20 6.84 7.01 6.28 5.81 5.43 4.76 3.93 3.45
Maximum 3.67 4.54 5.27 6.18 6.80 6.95 6.25 5.79 5.40 4.74 3.92 3.43
Location: Lat 28 to 29N, Lon 71 to 72E LiaquatPur (Punjab province)
Average 3.56 4.37 5.05 5.86 6.43 6.58 5.93 5.51 5.16 4.55 3.79 3.34 5.01
Minimum 3.10 3.85 4.39 5.45 5.72 5.66 5.40 5.07 4.75 4.14 3.49 2.84
Maximum 4.41 5.03 5.91 6.45 7.14 7.11 6.70 5.90 5.93 5.10 4.24 3.84
Location: Lat 28 to 29N, Lon 72 to 73E Fort Abbas (Punjab province)
Average 3.59 4.28 5.05 5.94 6.51 6.57 5.92 5.53 5.09 4.48 3.76 3.28 5.00
Minimum 3.09 3.72 4.34 5.52 5.79 5.45 5.39 5.14 4.48 4.17 3.46 2.85
Maximum 4.34 4.84 5.76 6.47 7.10 7.23 6.75 6.14 5.45 4.97 4.29 3.80
Location: Lat 29 to 30N, Lon 69 to 70E Part of Baluchistan and Fort Munro (Punjab province)
Average 3.66 4.42 5.09 6.18 6.83 6.92 6.39 5.98 5.47 4.51 3.67 3.27 5.20
Minimum 3.00 4.07 4.28 5.75 6.15 6.02 5.50 5.38 5.14 4.06 3.30 2.94
Maximum 4.36 4.99 5.65 6.86 7.44 7.89 6.97 6.70 5.96 4.87 4.15 3.96
Location: Lat 29 to 30N, Lon 70 to 71E Rajan Pur, jam Pur (Punjab province)
Average 3.62 4.38 4.98 5.78 6.50 6.58 6.19 5.64 5.12 4.51 3.67 3.31 5.02
Minimum 2.90 4.03 4.13 4.97 5.98 5.72 5.69 5.19 4.76 3.88 3.23 2.88
Maximum 4.34 4.99 5.83 6.24 7.09 7.44 6.75 6.32 5.43 5.05 4.15 3.84
Solar Radiation 3 / 5
Appendix B-1
(Unit: kWh m-2
day-1
)
Jan Feb Mar Apr May Jun Jul Aug Sep Oct Nov DecAnnual
Average
Location: Lat 29 to 30N, Lon 71 to 72E Uch, Bahawal Pur (Punjab province)
Average 3.61 4.47 5.25 5.99 6.53 6.67 6.21 5.67 5.31 4.65 3.84 3.34 5.13
Minimum 3.10 4.07 4.73 5.51 6.01 5.80 5.65 5.50 4.94 4.14 3.61 3.04
Maximum 2.89 3.98 4.62 5.63 6.14 5.94 5.53 5.27 4.89 4.28 3.46 2.87
Location: Lat 29 to 30N, Lon 72 to 73E Hasilpur (Punjab province)
Average 3.51 4.26 4.97 5.73 6.19 6.36 5.72 5.47 5.15 4.61 3.83 3.26 4.92
Minimum 3.02 3.75 4.37 5.27 5.63 5.41 5.26 5.20 4.69 4.29 3.49 2.93
Maximum 4.32 4.73 5.67 6.36 6.69 7.00 6.58 6.02 5.72 5.21 4.17 3.78
Location: Lat 30 to 31N, Lon 70 to 71E Taunsa (Punjab province)
Average 3.59 4.33 5.01 5.65 6.18 6.10 5.70 5.45 5.23 4.75 3.86 3.32 4.93
Minimum 2.87 3.81 4.16 4.75 5.44 5.43 5.13 5.01 4.76 3.71 3.36 2.86
Maximum 4.16 5.11 5.91 6.50 6.74 6.83 6.33 6.10 5.81 5.32 4.32 3.75
Location: Lat 30 to 31N, Lon 71to 72E Multan,Khenwal (Punjab province)
Average 3.44 4.22 4.99 5.78 6.19 6.36 5.76 5.44 5.21 4.69 3.79 3.19 4.92
Minimum 2.89 3.84 4.24 5.03 5.69 5.66 5.24 5.06 4.69 4.27 3.45 2.87
Maximum 4.16 4.68 5.74 6.47 6.87 7.00 6.51 6.04 5.84 5.25 4.09 3.83
Location: Lat 30 to 31N, Lon 72to 73E Tobe Tekh Singh, Jhang Sadar (Punjab province)
Average 3.41 4.28 5.13 6.05 6.34 6.41 5.78 5.54 5.36 4.76 3.88 3.23 5.01
Minimum 2.83 3.94 4.41 5.32 5.64 5.64 5.26 5.15 4.88 4.33 3.53 2.91
Maximum 4.13 4.71 5.95 6.72 6.97 7.18 6.47 6.15 6.00 5.38 4.23 3.71
Location: Lat 31 to 32N, Lon 70 to 71E Daraban, Dera Ismail Khan (Punjab province)
Average 3.48 4.22 4.94 5.54 6.22 6.32 5.80 5.38 5.05 4.50 3.63 3.20 4.86
Minimum 2.89 3.67 4.05 4.65 5.60 5.44 5.28 4.95 4.75 3.65 3.27 2.78
Maximum 4.04 5.02 5.78 6.37 6.78 7.02 6.50 5.92 5.40 4.91 4.10 3.62
Location: Lat 31 to 32N, Lon 71 to 72E Gojra (Punjab province)
Average 3.44 4.34 5.13 5.76 6.21 6.35 5.79 5.56 5.23 4.53 3.67 3.13 4.93
Minimum 2.79 3.86 4.36 5.07 5.59 5.78 5.38 5.06 4.55 4.12 3.38 2.88
Maximum 3.96 4.99 5.75 6.45 6.96 6.92 6.37 6.39 5.86 4.94 4.07 3.51
Location: Lat 31 to 32N, Lon 72 to 73E Jaranwala (Punjab province)
Average 3.35 4.29 5.12 5.84 6.78 6.92 6.19 5.67 5.16 4.33 3.53 3.09 5.02
Minimum 2.75 3.78 4.25 5.31 5.83 5.95 5.57 5.05 4.39 3.68 3.18 2.84
Maximum 3.89 4.93 5.84 6.48 7.59 7.75 7.12 6.46 5.88 4.89 3.99 3.58
Location: Lat 31 to 32N, Lon 73 to 74E Faisalabad, Sheikhupura (Punjab province)
Average 3.25 4.19 5.09 6.01 6.71 6.65 5.99 5.60 5.37 4.65 3.73 3.14 5.03
Minimum 2.67 3.73 4.53 5.41 5.77 5.52 5.57 4.98 4.67 3.95 3.47 2.64
Maximum 3.84 4.73 5.60 6.67 7.58 7.51 6.95 6.61 6.01 5.25 4.18 3.58
Solar Radiation 4 / 5

Appendix B-1
(Unit: kWh m-2
day-1
)
Jan Feb Mar Apr May Jun Jul Aug Sep Oct Nov DecAnnual
Average
Location: Lat 31 to 32N, Lon 74 to 75E Lahore (Punjab province)
Average 3.31 4.30 5.41 6.53 7.34 7.26 6.14 5.69 5.58 5.04 4.01 3.24 5.32
Minimum 2.58 3.53 4.87 6.01 6.61 6.24 5.22 5.01 4.69 4.54 3.73 2.75
Maximum 3.84 4.90 6.49 7.12 8.00 7.84 7.37 7.00 6.25 5.59 4.41 3.73
Location: Lat 32 to 33N, Lon 71 to 72E Khushab, Mian Wali (Punjab province)
Average 3.30 4.16 5.09 6.21 6.37 7.10 6.20 5.80 5.21 4.59 3.69 3.08 5.07
Minimum 2.74 3.70 3.97 5.34 5.67 5.89 5.52 5.22 4.74 3.86 3.25 2.68
Maximum 3.73 4.87 6.21 7.20 6.82 7.67 7.07 6.50 5.94 5.42 4.10 3.67
Location: Lat 32 to 33N, Lon 72 to 73E Sahiwal, Sargodha (Punjab province)
Average 3.26 4.13 5.08 6.24 7.12 7.14 6.01 5.56 5.19 4.63 3.76 3.08 5.10
Minimum 2.71 3.72 4.11 5.43 6.05 6.21 5.59 4.78 4.67 3.84 3.27 2.71
Maximum 3.81 4.79 6.30 7.24 7.83 7.85 6.91 6.39 6.02 5.46 4.10 3.67
Location: Lat 32 to 33N, Lon 73 to 74E Khewra, Jhelum (Punjab province)
Average 3.21 4.13 5.18 6.43 7.32 7.35 5.88 5.64 5.47 4.93 3.92 3.12 5.22
Minimum 2.50 3.63 4.40 5.66 6.44 6.32 5.29 4.96 4.65 4.04 3.61 2.71
Maximum 3.72 4.75 6.32 7.27 7.91 7.94 6.53 6.82 6.13 5.57 4.23 3.71
Location: Lat 32 to 33N, Lon 74 to 75E Wazirabad, Gujranwala (Punjab province)
Average 3.20 4.12 5.22 6.51 7.37 7.47 6.15 5.75 5.77 5.19 4.03 3.15 5.33
Minimum 2.27 3.54 4.59 5.86 6.49 5.98 4.92 5.18 4.79 4.26 3.63 2.65
Maximum 3.81 4.82 6.32 7.29 7.96 7.84 7.81 6.79 6.35 5.55 4.35 3.75
Location: Lat 32 to 33N, Lon 75 to 76E Sialkot, Sharkargar (Punjab province)
Average 3.25 4.15 5.22 6.55 7.32 7.33 5.86 5.48 5.75 5.29 4.13 3.18 5.29
Minimum 2.63 3.53 4.49 5.76 6.08 5.79 4.40 4.66 4.72 4.28 3.59 2.64
Maximum 3.84 4.94 6.47 7.53 7.98 7.99 7.62 6.52 6.33 5.71 4.50 3.82
Location: Lat 33 to 34N, Lon 72 to 73E Chakwal, Rawalpindi (Punjab province)
Average 3.19 3.92 4.87 6.22 7.16 7.43 6.48 5.75 5.51 4.93 3.84 2.97 5.19
Minimum 2.58 3.41 3.75 5.35 6.23 6.98 5.51 4.60 4.63 3.65 3.49 2.55
Maximum 3.76 4.66 6.23 7.28 7.73 7.95 7.39 6.67 6.28 5.47 4.15 3.62
Location: Lat 33 to 34N, Lon 73 to 74E Islamabad Capital City (Pakistan)
Average 3.18 3.87 4.95 6.31 7.27 7.54 6.44 5.72 5.69 5.07 3.89 2.99 5.24
Minimum 2.58 3.33 3.91 5.36 6.47 6.64 5.28 4.80 4.67 4.01 3.46 2.57
Maximum 3.78 4.61 6.29 7.32 7.71 7.92 7.60 6.81 6.37 5.53 4.20 3.68
Source: NASA website
Note: (1) Data also referred to as global horizontal radiation
(2) Average data for that month over 22 years period (Jul 1983 -Jun 2005)
(3) Minimum and Maximum values is calculated from provided value in percentage
(4) The minimum and maximum values for a given month indicate the difference between the year that has
the least (minimum) or most (maximum) monthly averaged insolation and the 22-year monthly averaged insolation.
Solar Radiation 5 / 5

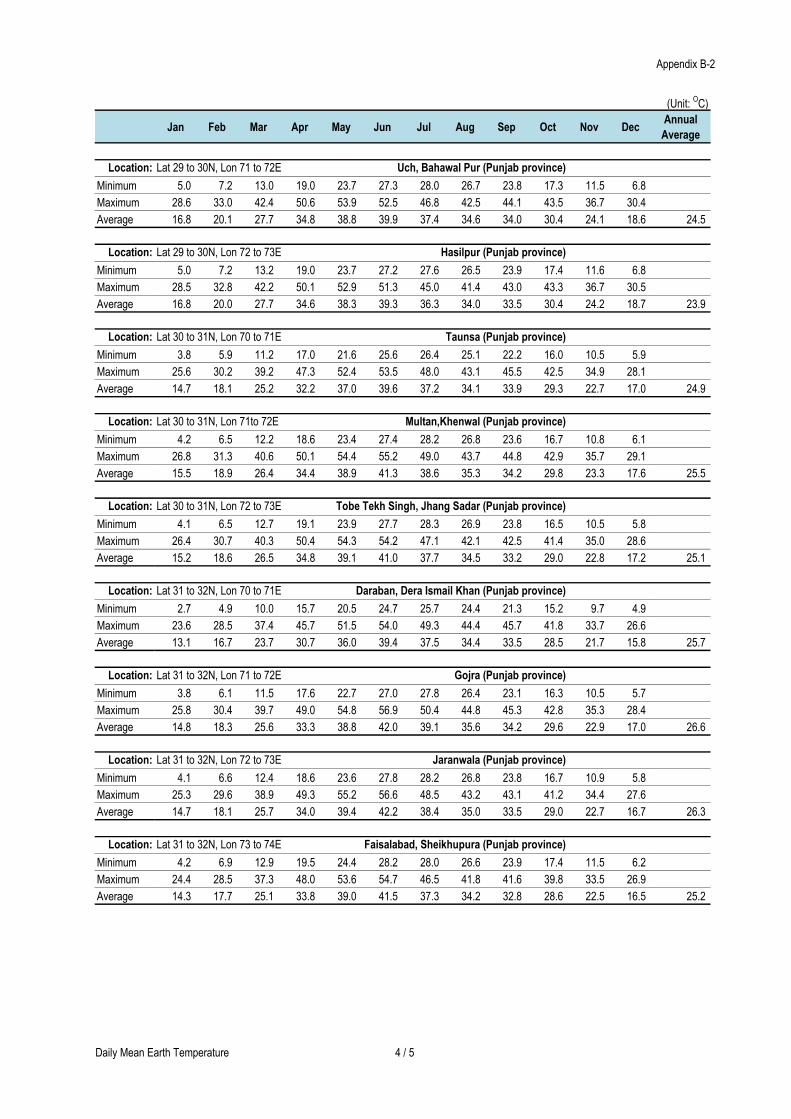
Appendix B-2
Average, Minimum and Maximum of the Daily
Mean Earth Temperature
(Source: NASA)

Appendix B-2
(Unit: OC)
Jan Feb Mar Apr May Jun Jul Aug Sep Oct Nov DecAnnual
Average
Location: Lat 23 to 24N, Lon 67 to 68E Landhi (Western part of Karachi, Sindh province)
Minimum 18.0 19.0 21.7 24.3 26.7 28.1 27.8 26.9 26.5 25.3 22.8 19.6
Maximum 30.2 32.1 35.6 37.2 37.3 37.0 34.8 34.2 35.3 37.4 35.4 31.6
Average 24.1 25.6 28.7 30.8 32.0 32.6 31.3 30.6 30.9 31.4 29.1 25.6 9.7
Location: Lat 23 to 24N, Lon 68 to 69E Malir City (Western part of Karachi, Sindh province)
Minimum 19.1 20.1 22.9 25.4 27.4 28.5 28.0 27.2 27.0 26.4 24.0 20.7
Maximum 30.4 32.4 36.2 38.1 38.2 37.2 35.0 34.3 36.1 37.8 35.5 31.8
Average 24.8 26.3 29.6 31.8 32.8 32.9 31.5 30.8 31.6 32.1 29.8 26.3 9.6
Location: Lat 23 to 24N, Lon 69 to 70E Sujawal (Thatta district, Sindh province)
Minimum 16.8 18.3 22.1 24.9 26.8 27.7 27.0 26.3 26.4 25.5 22.3 18.5
Maximum 35.7 39.0 44.2 46.3 44.5 41.2 37.1 36.7 40.5 43.9 41.3 36.8
Average 26.3 28.7 33.2 35.6 35.7 34.5 32.1 31.5 33.5 34.7 31.8 27.7 14.8
Location: Lat 24 to 25N, Lon 66 to 67E Manora (South Karachi, Sindh province)
Minimum 21.3 21.6 23.2 25.4 27.6 28.8 28.5 27.5 27.1 26.7 25.2 22.9
Maximum 26.2 26.8 28.9 30.8 32.0 32.4 31.4 30.5 30.8 31.8 30.3 27.7
Average 23.8 24.2 26.1 28.1 29.8 30.6 30.0 29.0 29.0 29.3 27.8 25.3 5.6
Location: Lat 24 to 25N, Lon 67 to 68E Karachi (Captial of Sindh province)
Minimum 12.0 14.2 18.6 22.0 25.0 26.9 26.8 26.1 25.1 22.5 18.4 13.7
Maximum 36.7 40.7 46.7 48.5 47.0 45.1 41.6 41.1 43.3 47.5 43.7 37.9
Average 24.4 27.5 32.7 35.3 36.0 36.0 34.2 33.6 34.2 35.0 31.1 25.8 18.3
Location: Lat 24 to 25N, Lon 68 to 69E Kotri, Hydrebad (Sindh province)
Minimum 12.8 14.9 19.7 23.2 26.0 27.5 27.3 26.5 25.8 23.5 19.2 14.5
Maximum 37.0 41.3 48.5 51.2 49.8 47.0 42.9 42.2 45.5 48.4 44.1 38.4
Average 24.9 28.1 34.1 37.2 37.9 37.3 35.1 34.4 35.7 36.0 31.7 26.5 19.2
Location: Lat 24 to 25N, Lon 69 to 70E Islamkot (Tharparkar district, Sindh province)
Minimum 13.0 15.1 20.0 23.7 26.3 27.5 27.1 26.3 26.0 23.8 19.3 14.8
Maximum 38.2 42.4 49.5 52.7 51.1 47.5 43.0 42.0 46.2 49.1 44.9 39.4
Average 25.6 28.8 34.8 38.2 38.7 37.5 35.1 34.2 36.1 36.5 32.1 27.1 19.9
Location: Lat 24 to 25N, Lon 70 to 71E Chachro, Vira Wah(Sindh province)
Minimum 13.1 15.0 20.0 24.0 26.4 27.3 26.7 26.0 25.9 23.7 19.2 14.9
Maximum 39.0 43.1 50.2 53.7 51.7 47.1 42.1 41.3 46.0 49.1 45.2 40.0
Average 26.1 29.1 35.1 38.9 39.1 37.2 34.4 33.7 36.0 36.4 32.2 27.5 20.3
Location: Lat 25 to 26N, Lon 66 to 67E Gadap (North Eastern part of Karachi, Sindh province)
Minimum 15.2 16.3 19.5 22.8 25.6 27.3 27.3 26.5 25.6 23.3 20.3 16.8
Maximum 29.8 32.1 36.9 40.8 42.2 41.4 38.1 37.7 39.5 39.9 36.0 31.3
Average 22.5 24.2 28.2 31.8 33.9 34.4 32.7 32.1 32.6 31.6 28.2 24.1 13.5
Average, Minimum and Maximum of the Daily Mean Earth Temperature
Daily Mean Earth Temperature 1 / 5

Appendix B-2
(Unit: OC)
Jan Feb Mar Apr May Jun Jul Aug Sep Oct Nov DecAnnual
Average
Location: Lat 25 to 26N, Lon 67 to 68E Tando Adam (Sindh province)
Minimum 10.8 13.0 17.8 21.8 25.0 26.9 26.9 26.2 25.2 22.0 17.4 12.5
Maximum 35.7 39.9 47.1 51.2 50.9 48.1 44.2 43.8 46.4 48.9 43.4 37.0
Average 23.3 26.5 32.5 36.5 38.0 37.5 35.6 35.0 35.8 35.5 30.4 24.8 20.2
Location: Lat 25 to 26N, Lon 68 to 69E Tandu M. Khan, Tando Gulam Ali (Sindh province)
Minimum 10.0 12.1 17.7 22.1 25.5 27.3 27.4 26.6 25.5 22.0 16.9 12.0
Maximum 35.5 39.9 48.6 53.2 53.1 50.2 45.6 44.7 47.6 49.5 43.8 37.3
Average 22.8 26.0 33.2 37.7 39.3 38.8 36.5 35.7 36.6 35.8 30.4 24.7 21.6
Location: Lat 25 to 26N, Lon 69 to 70E Naya Chor,Mir Pur Khas (Sindh province)
Minimum 10.1 12.1 17.5 22.0 25.4 27.2 27.2 26.4 25.3 21.9 16.7 12.0
Maximum 36.6 40.9 49.1 53.5 53.0 49.7 45.3 43.9 47.5 49.5 44.2 38.2
Average 23.4 26.5 33.3 37.8 39.2 38.5 36.3 35.2 36.4 35.7 30.5 25.1 21.7
Location: Lat 25 to 26N, Lon 70 to 71E Chhachhro (Sindh province)
Minimum 10.3 12.1 17.3 21.9 25.3 26.8 26.7 25.9 25.0 21.6 16.6 12.2
Maximum 37.5 41.7 49.3 53.6 52.6 48.4 44.2 42.7 46.8 49.3 44.4 38.8
Average 23.9 26.9 33.3 37.8 39.0 37.6 35.5 34.3 35.9 35.5 30.5 25.5 21.7
Location: Lat 26 to 27N, Lon 67 to 68E Sehwan, Dadu (Sindh province)
Minimum 8.5 10.8 16.1 21.0 24.8 27.0 27.2 26.6 25.0 20.4 15.2 10.3
Maximum 33.6 38.2 46.6 53.6 56.2 54.4 49.1 48.2 50.9 49.2 42.2 35.1
Average 21.1 24.5 31.4 37.3 40.5 40.7 38.2 37.4 38.0 34.8 28.7 22.7 23.8
Location: Lat 26 to 27N, Lon 68 to 69E Naushro Feroz, Darbelo (Sindh province)
Minimum 8.3 10.3 16.2 21.3 25.3 27.5 27.7 26.9 25.5 20.9 15.4 10.3
Maximum 33.3 37.7 47.1 53.6 55.7 53.4 47.9 46.3 49.3 49.0 42.4 35.3
Average 20.8 24.0 31.7 37.5 40.5 40.5 37.8 36.6 37.4 35.0 28.9 22.8 23.7
Location: Lat 26 to 27N, Lon 69 to 70E Nawab Shah, Lashri (Sindh province)
Minimum 8.6 10.5 16.1 21.0 25.0 27.2 27.5 26.5 25.2 20.8 15.3 10.5
Maximum 33.6 37.9 46.5 51.9 53.3 50.7 45.9 44.0 47.3 48.0 41.9 35.4
Average 21.1 24.2 31.3 36.5 39.2 39.0 36.7 35.3 36.3 34.4 28.6 23.0 22.4
Location: Lat 27 to 28N, Lon 67 to 68E Data Chandio, Nasirabad (Sindh province)
Minimum 6.5 8.9 14.4 19.7 24.1 26.7 27.4 26.6 24.2 18.5 13.2 8.3
Maximum 31.9 36.5 45.2 53.3 57.4 57.3 52.2 49.6 52.2 48.1 40.5 33.5
Average 19.2 22.7 29.8 36.5 40.8 42.0 39.8 38.1 38.2 33.3 26.9 20.9 25.4
Location: Lat 27 to 28N, Lon 68 to 69E Larkana, Khair Pur (Sindh province)
Minimum 7.3 9.5 15.2 20.5 25.0 27.7 28.3 27.1 25.0 19.4 13.8 9.1
Maximum 32.1 37.0 46.4 53.7 57.4 55.4 49.9 46.4 49.2 47.4 40.5 33.7
Average 19.7 23.2 30.8 37.1 41.2 41.6 39.1 36.8 37.1 33.4 27.2 21.4 25.1
Daily Mean Earth Temperature 2 / 5

Appendix B-2
(Unit: OC)
Jan Feb Mar Apr May Jun Jul Aug Sep Oct Nov DecAnnual
Average
Location: Lat 27 to 28N, Lon 69 to 70E Sanghar, Panu Aqil (Sindh province)
Minimum 7.4 9.4 15.0 20.3 24.7 27.6 28.0 26.8 24.8 19.4 13.8 9.2
Maximum 32.0 36.6 45.5 51.7 54.6 52.7 47.0 43.8 46.8 46.4 39.9 33.6
Average 19.7 23.0 30.3 36.0 39.7 40.2 37.5 35.3 35.8 32.9 26.9 21.4 23.6
Location: Lat 28 to 29N, Lon 67 to 68E Ghari yasin (Sindh province)
Minimum 4.8 7.2 12.3 17.7 22.3 25.2 26.4 25.3 22.3 16.5 11.4 6.7
Maximum 29.9 34.4 42.7 50.8 55.1 55.5 50.7 47.3 50.6 46.1 38.7 31.7
Average 17.4 20.8 27.5 34.3 38.7 40.4 38.6 36.3 36.5 31.3 25.1 19.2 25.3
Location: Lat 28 to 29N, Lon 68 to 69E Ghotki (Sindh province)
Minimum 6.5 8.7 14.0 19.4 23.8 27.0 27.9 26.5 23.9 18.1 12.8 8.3
Maximum 30.5 35.3 44.3 51.6 55.9 54.6 49.1 44.9 48.3 45.7 38.6 32.1
Average 18.5 22.0 29.2 35.5 39.9 40.8 38.5 35.7 36.1 31.9 25.7 20.2 24.7
Location: Lat 28 to 29N, Lon 69 to 70E Kand Kot, Kashmor (Sindh province)
Minimum 6.6 8.6 14.1 19.4 23.9 27.2 27.9 26.6 24.1 18.2 12.8 8.3
Maximum 30.4 35.2 44.2 50.8 54.7 53.1 47.3 43.2 46.2 45.1 38.3 32.0
Average 18.5 21.9 29.2 35.1 39.3 40.2 37.6 34.9 35.2 31.7 25.6 20.2 24.1
Location: Lat 28 to 29N, Lon 70 to 71E Rahim Yar, Sadiqabad (Punjab province)
Minimum 5.1 7.3 12.6 18.3 22.9 26.5 27.2 26.0 23.2 17.1 11.6 7.0
Maximum 28.1 32.6 41.7 49.1 53.3 52.3 46.6 42.2 44.9 43.4 36.4 30.0
Average 16.6 19.9 27.2 33.7 38.1 39.4 36.9 34.1 34.1 30.3 24.0 18.5 24.1
Location: Lat 28 to 29N, Lon 71 to 72E LiaquatPur (Punjab province)
Minimum 6.2 8.3 13.9 19.2 23.9 26.9 27.4 26.4 24.0 18.4 12.7 8.1
Maximum 30.6 35.0 44.0 50.0 52.5 50.1 44.7 41.6 44.1 45.0 38.4 32.2
Average 18.4 21.6 29.0 34.6 38.2 38.5 36.1 34.0 34.1 31.7 25.6 20.1 23.1
Location: Lat 28 to 29N, Lon 72 to 73E Fort Abbas (Punjab province)
Minimum 6.4 8.4 13.9 19.1 23.7 26.6 26.9 26.0 23.9 18.5 13.0 8.4
Maximum 30.7 35.0 43.8 49.5 51.7 48.9 43.2 40.7 43.7 45.2 38.7 32.6
Average 18.6 21.7 28.9 34.3 37.7 37.8 35.1 33.4 33.8 31.9 25.9 20.5 22.6
Location: Lat 29 to 30N, Lon 69 to 70E Part of Baluchistan and Fort Munro (Punjab province)
Minimum 5.0 7.0 12.1 17.4 21.9 25.4 26.2 25.1 22.4 16.7 11.5 6.9
Maximum 27.5 32.0 40.7 47.8 52.6 52.3 46.5 42.4 46.1 43.5 36.3 29.6
Average 16.2 19.5 26.4 32.6 37.3 38.9 36.4 33.8 34.3 30.1 23.9 18.3 23.8
Location: Lat 29 to 30N, Lon 70 to 71E Rajan Pur, jam Pur (Punjab province)
Minimum 5.1 7.3 12.6 18.3 22.9 26.5 27.2 26.0 23.2 17.1 11.6 7.0
Maximum 28.1 32.6 41.7 49.1 53.3 52.3 46.6 42.2 44.9 43.4 36.4 30.0
Average 16.6 19.9 27.2 33.7 38.1 39.4 36.9 34.1 34.1 30.3 24.0 18.5 24.1
Daily Mean Earth Temperature 3 / 5
Appendix B-2
(Unit: OC)
Jan Feb Mar Apr May Jun Jul Aug Sep Oct Nov DecAnnual
Average
Location: Lat 29 to 30N, Lon 71 to 72E Uch, Bahawal Pur (Punjab province)
Minimum 5.0 7.2 13.0 19.0 23.7 27.3 28.0 26.7 23.8 17.3 11.5 6.8
Maximum 28.6 33.0 42.4 50.6 53.9 52.5 46.8 42.5 44.1 43.5 36.7 30.4
Average 16.8 20.1 27.7 34.8 38.8 39.9 37.4 34.6 34.0 30.4 24.1 18.6 24.5
Location: Lat 29 to 30N, Lon 72 to 73E Hasilpur (Punjab province)
Minimum 5.0 7.2 13.2 19.0 23.7 27.2 27.6 26.5 23.9 17.4 11.6 6.8
Maximum 28.5 32.8 42.2 50.1 52.9 51.3 45.0 41.4 43.0 43.3 36.7 30.5
Average 16.8 20.0 27.7 34.6 38.3 39.3 36.3 34.0 33.5 30.4 24.2 18.7 23.9
Location: Lat 30 to 31N, Lon 70 to 71E Taunsa (Punjab province)
Minimum 3.8 5.9 11.2 17.0 21.6 25.6 26.4 25.1 22.2 16.0 10.5 5.9
Maximum 25.6 30.2 39.2 47.3 52.4 53.5 48.0 43.1 45.5 42.5 34.9 28.1
Average 14.7 18.1 25.2 32.2 37.0 39.6 37.2 34.1 33.9 29.3 22.7 17.0 24.9
Location: Lat 30 to 31N, Lon 71to 72E Multan,Khenwal (Punjab province)
Minimum 4.2 6.5 12.2 18.6 23.4 27.4 28.2 26.8 23.6 16.7 10.8 6.1
Maximum 26.8 31.3 40.6 50.1 54.4 55.2 49.0 43.7 44.8 42.9 35.7 29.1
Average 15.5 18.9 26.4 34.4 38.9 41.3 38.6 35.3 34.2 29.8 23.3 17.6 25.5
Location: Lat 30 to 31N, Lon 72 to 73E Tobe Tekh Singh, Jhang Sadar (Punjab province)
Minimum 4.1 6.5 12.7 19.1 23.9 27.7 28.3 26.9 23.8 16.5 10.5 5.8
Maximum 26.4 30.7 40.3 50.4 54.3 54.2 47.1 42.1 42.5 41.4 35.0 28.6
Average 15.2 18.6 26.5 34.8 39.1 41.0 37.7 34.5 33.2 29.0 22.8 17.2 25.1
Location: Lat 31 to 32N, Lon 70 to 71E Daraban, Dera Ismail Khan (Punjab province)
Minimum 2.7 4.9 10.0 15.7 20.5 24.7 25.7 24.4 21.3 15.2 9.7 4.9
Maximum 23.6 28.5 37.4 45.7 51.5 54.0 49.3 44.4 45.7 41.8 33.7 26.6
Average 13.1 16.7 23.7 30.7 36.0 39.4 37.5 34.4 33.5 28.5 21.7 15.8 25.7
Location: Lat 31 to 32N, Lon 71 to 72E Gojra (Punjab province)
Minimum 3.8 6.1 11.5 17.6 22.7 27.0 27.8 26.4 23.1 16.3 10.5 5.7
Maximum 25.8 30.4 39.7 49.0 54.8 56.9 50.4 44.8 45.3 42.8 35.3 28.4
Average 14.8 18.3 25.6 33.3 38.8 42.0 39.1 35.6 34.2 29.6 22.9 17.0 26.6
Location: Lat 31 to 32N, Lon 72 to 73E Jaranwala (Punjab province)
Minimum 4.1 6.6 12.4 18.6 23.6 27.8 28.2 26.8 23.8 16.7 10.9 5.8
Maximum 25.3 29.6 38.9 49.3 55.2 56.6 48.5 43.2 43.1 41.2 34.4 27.6
Average 14.7 18.1 25.7 34.0 39.4 42.2 38.4 35.0 33.5 29.0 22.7 16.7 26.3
Location: Lat 31 to 32N, Lon 73 to 74E Faisalabad, Sheikhupura (Punjab province)
Minimum 4.2 6.9 12.9 19.5 24.4 28.2 28.0 26.6 23.9 17.4 11.5 6.2
Maximum 24.4 28.5 37.3 48.0 53.6 54.7 46.5 41.8 41.6 39.8 33.5 26.9
Average 14.3 17.7 25.1 33.8 39.0 41.5 37.3 34.2 32.8 28.6 22.5 16.5 25.2
Daily Mean Earth Temperature 4 / 5

Appendix B-2
(Unit: OC)
Jan Feb Mar Apr May Jun Jul Aug Sep Oct Nov DecAnnual
Average
Location: Lat 31 to 32N, Lon 74 to 75E Lahore (Punjab province)
Minimum 3.6 6.2 11.9 18.1 22.8 26.3 26.3 25.0 22.3 15.9 10.2 5.3
Maximum 23.3 27.1 35.7 46.8 52.3 52.4 43.0 38.7 38.6 37.2 31.9 25.8
Average 13.4 16.6 23.8 32.5 37.6 39.4 34.7 31.9 30.5 26.6 21.1 15.5 24.4
Location: Lat 32 to 33N, Lon 71 to 72E Khushab, Mian Wali (Punjab province)
Minimum 3.6 6.0 11.0 16.9 22.0 26.3 26.8 25.4 22.2 16.0 10.3 5.5
Maximum 23.6 27.9 36.8 46.1 52.9 56.0 49.2 44.2 44.1 41.1 33.7 26.4
Average 13.6 16.9 23.9 31.5 37.5 41.2 38.0 34.8 33.2 28.6 22.0 16.0 26.2
Location: Lat 32 to 33N, Lon 72 to 73E Sahiwal, Sargodha (Punjab province)
Minimum 4.0 6.5 11.9 17.7 22.7 26.8 27.1 25.8 22.7 16.4 10.8 5.8
Maximum 23.8 28.1 36.6 46.5 53.4 55.7 48.0 43.0 42.2 40.0 33.3 26.3
Average 13.9 17.3 24.3 32.1 38.1 41.3 37.6 34.4 32.5 28.2 22.1 16.0 25.9
Location: Lat 32 to 33N, Lon 73 to 74E Khewra, Jhelum (Punjab province)
Minimum 4.2 6.6 11.9 18.1 23.1 26.6 26.2 24.9 22.3 16.7 11.4 6.3
Maximum 22.3 26.1 34.0 44.2 50.6 52.1 44.4 40.3 39.9 37.8 31.7 25.0
Average 13.3 16.3 23.0 31.2 36.9 39.4 35.3 32.6 31.1 27.3 21.6 15.6 24.0
Location: Lat 32 to 33N, Lon 74 to 75E Wazirabad, Gujranwala (Punjab province)
Minimum 2.6 4.7 9.5 15.3 19.8 23.0 23.1 22.0 19.1 13.5 8.8 4.5
Maximum 19.5 22.6 30.2 40.4 46.2 46.7 38.7 35.1 35.0 33.3 28.4 22.4
Average 11.1 13.6 19.8 27.9 33.0 34.9 30.9 28.6 27.1 23.4 18.6 13.4 22.0
Location: Lat 32 to 33N, Lon 75 to 76E Sialkot, Sharkargar (Punjab province)
Minimum -2.2 -0.5 3.7 9.2 13.6 16.9 18.1 17.2 13.7 7.9 3.8 0.1
Maximum 13.9 16.3 23.1 32.7 38.8 39.6 32.3 29.3 29.1 27.3 22.7 17.2
Average 5.9 7.9 13.4 21.0 26.2 28.3 25.2 23.3 21.4 17.6 13.2 8.6 20.9
Location: Lat 33 to 34N, Lon 72 to 73E Chakwal, Rawalpindi (Punjab province)
Minimum 2.9 5.3 10.0 15.8 20.6 24.3 24.2 22.9 19.6 14.2 9.4 4.8
Maximum 20.4 24.1 31.7 41.4 47.8 50.3 42.5 38.2 37.4 35.6 29.9 23.1
Average 11.7 14.7 20.9 28.6 34.2 37.3 33.4 30.6 28.5 24.9 19.7 14.0 23.7
Location: Lat 33 to 34N, Lon 73 to 74E Islamabad Capital City (Pakistan)
Minimum 1.5 3.4 7.6 13.1 17.7 21.1 21.4 20.4 17.1 11.9 7.5 3.4
Maximum 17.1 20.1 27.2 36.6 42.5 44.4 37.5 34.4 34.1 32.0 26.7 20.2
Average 9.3 11.7 17.4 24.9 30.1 32.8 29.5 27.4 25.6 22.0 17.1 11.8 21.4
Source: NASA website
Note: (1) The data is over 22-years period (Jan 1983 - Dec 2004)
(2) The data is minimum and maximum of the daily earth's surface temperature for given month.
(3) The average data is derived from Amplitude that is; one half of the difference between the minimum and maximum of 22 years
average.
Daily Mean Earth Temperature 5 / 5
Appendix B-3
Information of PIMS

Appendix B-3-1
Organization Chart of PIMS and EED 1
Appendix B-3-1: Organization Chart of PIMS and EED Organization Chart of Pakistan Institute of Medical Sciences (PIMS)
Source: PIMS
Electrical Engineering Department (EED) (Responsible department for O&M)

Appendix B-3-1
Organization Chart of PIMS and EED 2
Organization Chart of Electrical Engineering Department (EED) of PIMS
Source: PIMS

Appendix B-3-2
Layout of PIMS 3
Appendix B-3-2: Layout of PIMS
Source: PIMS
SS No.4 SS No.5
SS No. 3
SS No. 2
SS No. 1
Open Space
HANN
A RO
AD

Appendix B-3-3
Power Consumption Record of PIMS 4
Appendix B-3-3: Power Consumption Record of PIMS Substation No.1
Serial No. Month Total Unit Consumed (kWh) Total paid amount (Rs.)
Year 2011
1 January 430,770 7,509,712
2 February 435,850 4,832,337
3 March 327,350 0
4 April 262,490 3,545,750
5 May 362,250 4,025,609
6 June 577,380 9,827,194
7 July 656,490 0
8 August 573,240 7,766,804
9 September 725,200 6,617,434
10 October 634,910 8,560,216
11 November 275,240 7,308,445
12 December 276,870 3,971,270
Average 461,503 5,330,398
Total 5,538,040 63,964,771
Year 2012
1 January 378,090 4,354,979
2 February 396,660 0
3 March 352,350 4,468,028
4 April 247,280 6,057,326
5 May 303,110 7,781,558
6 June 409,900 0
7 July 709,670 0
8 August 726,010 0
9 September 668,670 16,733,344
10 October 432,110 34,640,968
11 November 323,290 10,160,638
Average 449,740 7,654,258
Total 4,947,140 84,196,841
Source: Prepared by JICA Study Team based on Monthly Electricity Bill of PIMS
Note: (1) In total paid amount (i) N.J. Surcharge (ii) GST and (iii) Fuel Price Adjustment (FPA) is included
(2) If amount paid is "0" then it is adjusted to other months.
(3) In total amount, depending on months includes penalty of due date payment too.
(4) The unit consumed at above table is of previous month, billed and paid on given months.
Electricity supply area from this substation:
Children Hospital, Burn Care Centre,
Mother and Child Health Centre including OPD,
Heating Ventilator Air Conditioner (HAVC) Plant
Nursing Hostel, Serv ices Block including Laundry, Kitchen, etc.
Summery of Electricity Consumption (Sub-station No. 1)

Appendix B-3-3
Power Consumption Record of PIMS 5
Substation No.2
Serial No. Month Total Unit Consumed (kWh) Total paid amount (Rs.)
Year 2011
1 January 293,660 3,171,011
2 February 296,080 3,401,417
3 March 262,480 0
4 April 299,320 2,969,168
5 May 352,760 7,205,884
6 June 454,140 5,714,977
7 July 461,280 0
8 August 486,060 5,423,730
9 September 440,860 5,657,335
10 October 364,340 5,771,801
11 November 350,920 4,439,723
12 December 258,420 8,897,896
360,027 4,387,745
4,320,320 52,652,942
Year 2012
1 January 278,100 3,361,510
2 February 319,780 0
3 March 230,520 3,701,513
4 April 276,280 4,513,635
5 May 315,920 7,954,510
6 June 326,240 5,405,000
7 July 561,900 0
8 August 533,080 0
9 September 487,460 15,746,947
10 October 333,880 14,501,699
11 November 316,800 11,566,206
361,815 6,068,275
3,979,960 66,751,020
Source: Prepared by JICA Study Team based on Monthly Electricity Bill of PIMS
Note: (1) In total paid amount (i) N.J. Surcharge (ii) GST and (iii) Fuel Price Adjustment (FPA) is included
(2) If amount paid is "0" then it is adjusted to other months.
(3) In total amount, depending on months includes penalty of due date payment too.
(4) The unit consumed at above table is of previous month, billed and paid on given months.
Electricity supply area from this substation:
Inpatient wards building (Medical ward & Surgical ward)
CT Angio, MRI, Radiology, Pathology, Blood bank, OPD, Private ward,
CCU, SICU, MICU, Cardiology ward, Operation Theaters,
Cardiac Surgery, ICU, Lithotripsy, Water supply pumps and tube well,
Administration and Account branch
Total
Summery of Electricity Consumption (Sub-station No. 2)
Average
Total
Average

Appendix B-3-3
Power Consumption Record of PIMS 6
Substation No.3
Serial No. Month Total Unit Consumed (kWh) Total paid amount (Rs.)
Year 2011
1 January 147,000 1,679,179
2 February 114,000 1,034,969
3 March 130,000 0
4 April 125,000 1,141,442
5 May 123,000 650,000
6 June 135,000 1,622,790
7 July 154,000 450,000
8 August 179,000 2,105,216
9 September 140,000 2,512,051
10 October 139,000 867,220
11 November 163,000 1,256,295
12 December 160,000 3,658,056
142,417 1,414,768
1,709,000 16,977,218
Year 2012
1 January 173,000 1,720,505
2 February 219,000 0
3 March 228,000 2,104,184
4 April 236,000 2,855,007
5 May 262,000 3,439,089
6 June 266,000 3,168,666
7 July 275,000 524,188
8 August 285,000 614,476
9 September 287,000 3,376,002
10 October 210,000 8,334,971
11 November 210,000 2,456,107
241,000 2,599,381
2,651,000 28,593,195
Source: Prepared by JICA Study Team based on Monthly Electricity Bill of PIMS
Note: (1) In total paid amount (i) N.J. Surcharge (ii) GST and (iii) Fuel Price Adjustment (FPA) is included
(2) If amount paid is "0" then it is adjusted to other months.
(3) In total amount, depending on months includes penalty of due date payment too.
(4) The unit consumed at above table is of previous month, billed and paid on given months.
Electricity supply area from this substation:
Cardiac Surgery facility including HVAC plant, Burn Care Centre,
Federal Government Model School PIMS, Dhobi Ghat,
Laundry and Serv ices building, Transport,
B type flats water supply pumps and Tube well etc.
Total
Summery of Electricity Consumption (Sub-station No. 3)
Average
Total
Average

Appendix B-3-3
Power Consumption Record of PIMS 7
Substation No.4
Serial No. Month Total Unit Consumed (kWh) Total paid amount (Rs.)
Year 2011
1 January 45,860 767,192
2 February 43,140 820,405
3 March 39,900 819,238
4 April 45,400 1,114,026
5 May 58,020 1,351,254
6 June 102,000 1,677,971
7 July 118,900 0
8 August 119,500 1,562,834
9 September 110,940 1,320,920
10 October 74,720 1,978,530
11 November 52,440 943,194
12 December 44,860 600,000
71,307 1,079,630
855,680 12,955,564
Year 2012
1 January 45,150 797,147
2 February 45,820 0
3 March 44,660 0
4 April 44,780 925,501
5 May 55,280 2,846,327
6 June 387,500 0
7 July 119,000 0
8 August 145,700 0
9 September 115,760 2,396,421
10 October 58,800 3,479,287
11 November 52,800 644,343
101,386 1,008,093
1,115,250 11,089,026
Source: Prepared by JICA Study Team based on Monthly Electricity Bill of PIMS
Note: (1) In total paid amount (i) N.J. Surcharge (ii) GST and (iii) Fuel Price Adjustment (FPA) is included
(2) If amount paid is "0" then it is adjusted to other months.
(3) In total amount, depending on months includes penalty of due date payment too.
(4) The unit consumed at above table is of previous month, billed and paid on given months.
Electricity supply area from this substation:
Residential area block-C, D, E & type Bungalows and Mosque
Total
Summery of Electricity Consumption (Sub-station No. 4)
Average
Total
Average
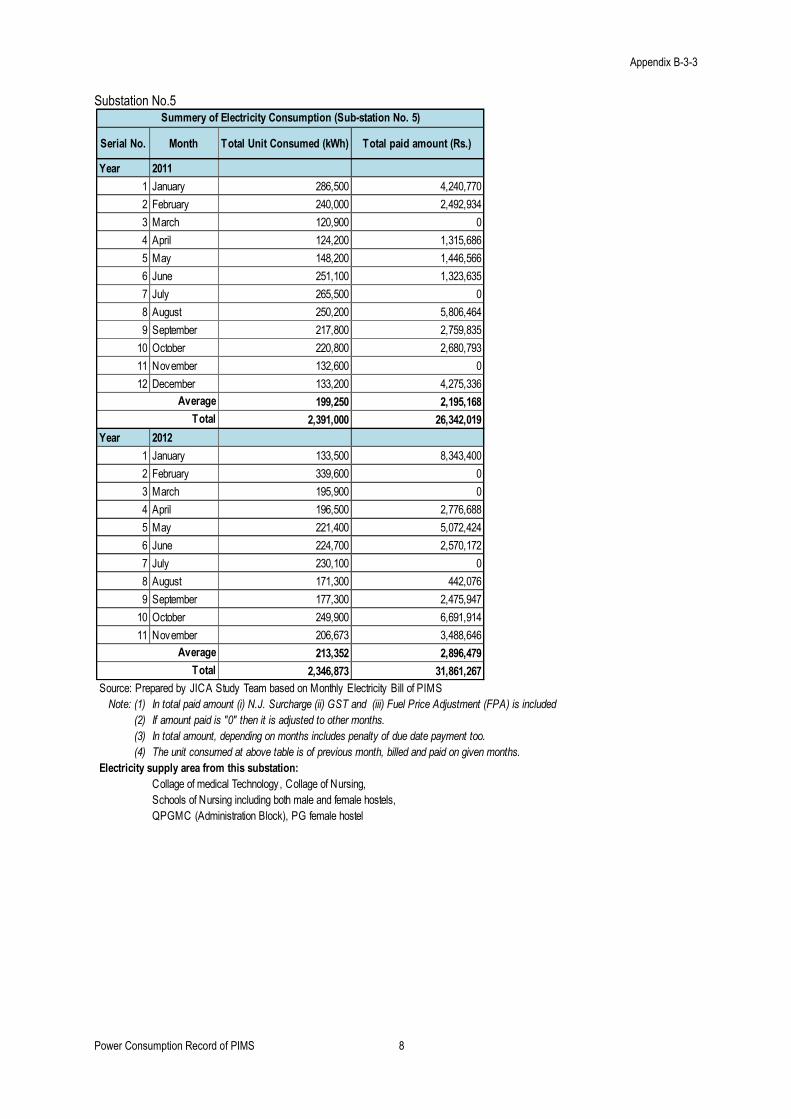
Appendix B-3-3
Power Consumption Record of PIMS 8
Substation No.5
Serial No. Month Total Unit Consumed (kWh) Total paid amount (Rs.)
Year 2011
1 January 286,500 4,240,770
2 February 240,000 2,492,934
3 March 120,900 0
4 April 124,200 1,315,686
5 May 148,200 1,446,566
6 June 251,100 1,323,635
7 July 265,500 0
8 August 250,200 5,806,464
9 September 217,800 2,759,835
10 October 220,800 2,680,793
11 November 132,600 0
12 December 133,200 4,275,336
199,250 2,195,168
2,391,000 26,342,019
Year 2012
1 January 133,500 8,343,400
2 February 339,600 0
3 March 195,900 0
4 April 196,500 2,776,688
5 May 221,400 5,072,424
6 June 224,700 2,570,172
7 July 230,100 0
8 August 171,300 442,076
9 September 177,300 2,475,947
10 October 249,900 6,691,914
11 November 206,673 3,488,646
213,352 2,896,479
2,346,873 31,861,267
Source: Prepared by JICA Study Team based on Monthly Electricity Bill of PIMS
Note: (1) In total paid amount (i) N.J. Surcharge (ii) GST and (iii) Fuel Price Adjustment (FPA) is included
(2) If amount paid is "0" then it is adjusted to other months.
(3) In total amount, depending on months includes penalty of due date payment too.
(4) The unit consumed at above table is of previous month, billed and paid on given months.
Electricity supply area from this substation:
Collage of medical Technology, Collage of Nursing,
Schools of Nursing including both male and female hostels,
QPGMC (Administration Block), PG female hostel
Total
Summery of Electricity Consumption (Sub-station No. 5)
Average
Total
Average

Appendix B-3-4
Skeleton Diagram of PIMS 9
Appendix B-3-4: Skeleton Diagram of PIMS Substation No.1
Source: PIMS
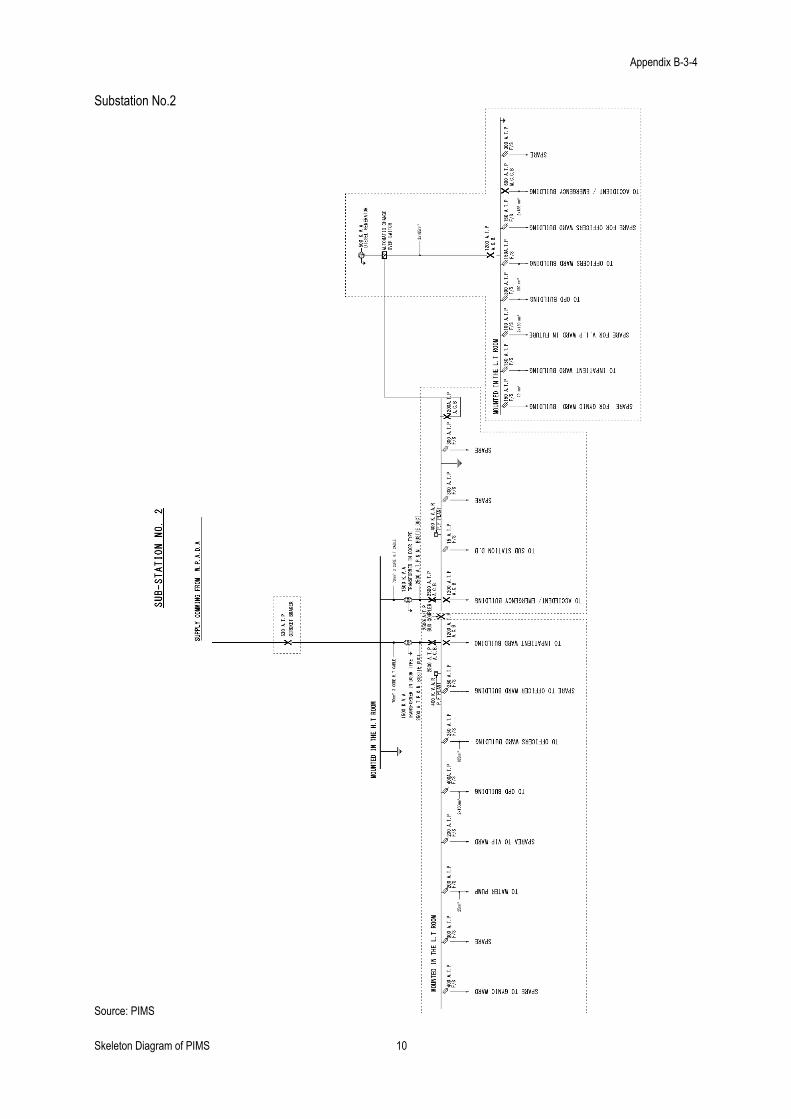
Appendix B-3-4
Skeleton Diagram of PIMS 10
Substation No.2
Source: PIMS
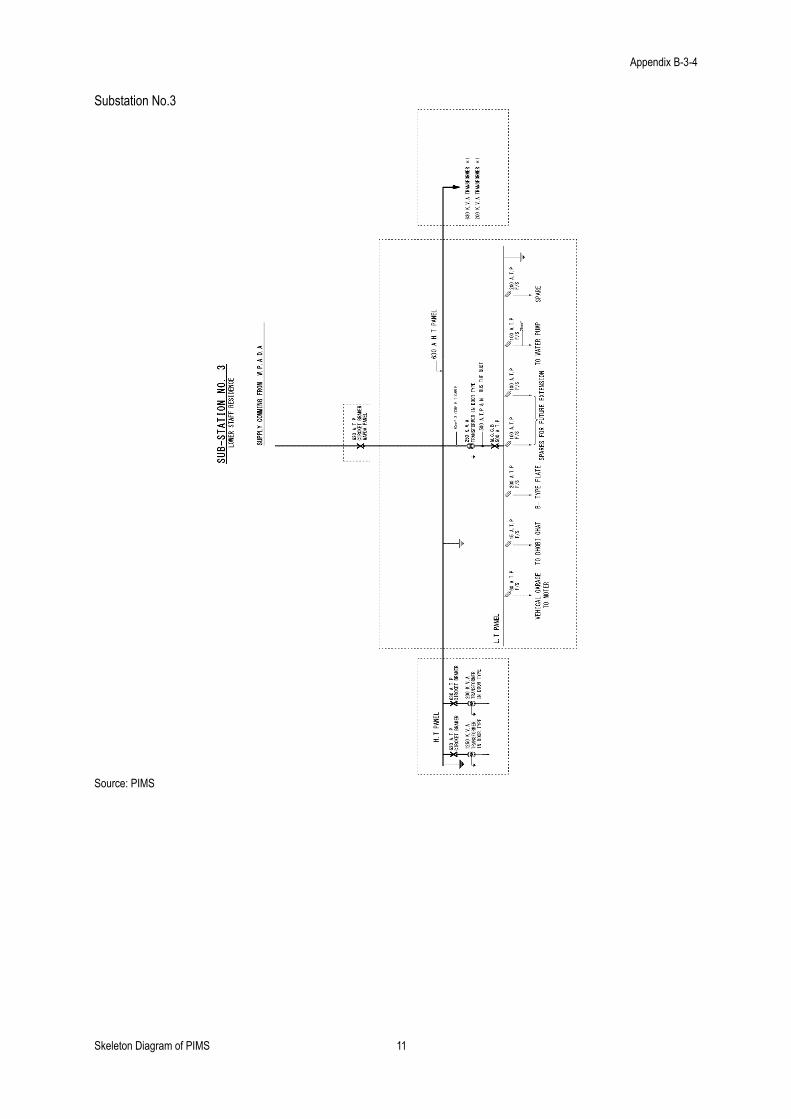
Appendix B-3-4
Skeleton Diagram of PIMS 11
Substation No.3
Source: PIMS

Appendix B-3-4
Skeleton Diagram of PIMS 12
Substation No.4
Source: PIMS

Appendix B-3-4
Skeleton Diagram of PIMS 13
Substation No.5
Source: PIMS

Appendix B-3-5
Topographic Map of PIMS Site 14
Appendix B-3-5: Topographic Map of PIMS Site
Source: Topographic Survey implemented by JICA Study Team