data dashboards
DESCRIPTION
Pages 51-63 of the 2016 Vision Project Annual Report, "The Degree Gap."TRANSCRIPT
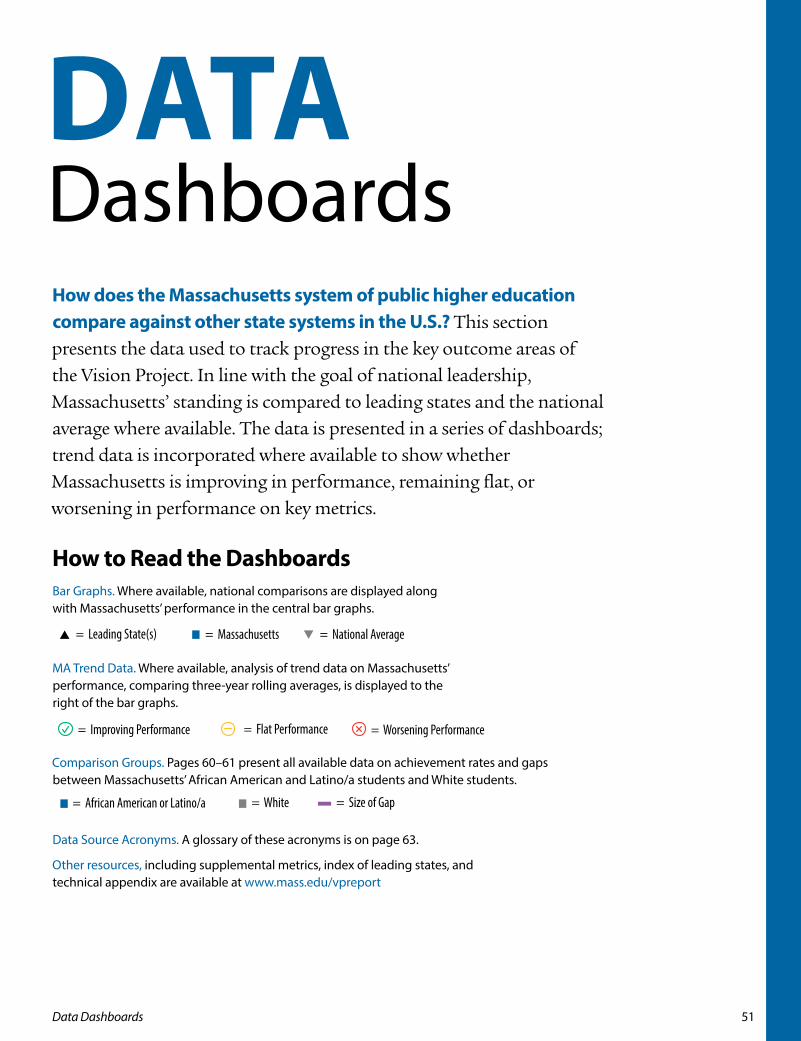
How does the Massachusetts system of public higher education compare against other state systems in the U.S.? This section presents the data used to track progress in the key outcome areas of the Vision Project. In line with the goal of national leadership, Massachusetts’ standing is compared to leading states and the national average where available. The data is presented in a series of dashboards; trend data is incorporated where available to show whether Massachusetts is improving in performance, remaining flat, or worsening in performance on key metrics.
How to Read the DashboardsBar Graphs. Where available, national comparisons are displayed along with Massachusetts’ performance in the central bar graphs.
MA Trend Data. Where available, analysis of trend data on Massachusetts’ performance, comparing three-year rolling averages, is displayed to the right of the bar graphs.
Comparison Groups. Pages 60–61 present all available data on achievement rates and gaps between Massachusetts’ African American and Latino/a students and White students.
Data Source Acronyms. A glossary of these acronyms is on page 63.
Other resources, including supplemental metrics, index of leading states, and technical appendix are available at www.mass.edu/vpreport
DATADashboards
= African American or Latino/a = White = Size of Gap
= Massachusetts= Leading State(s) = National Average
= Improving Performance = Flat Performance = Worsening Performance
= African American or Latino/a = White = Size of Gap
= Massachusetts= Leading State(s) = National Average
= Improving Performance = Flat Performance = Worsening Performance
= African American or Latino/a = White = Size of Gap
= Massachusetts= Leading State(s) = National Average
= Improving Performance = Flat Performance = Worsening Performance
51Data Dashboards
100%0%
College Enrollment Rates of Recent High School Graduates3 Fall 2014
College Enrollment Rates of 18- to 24-Year-Olds4 2011-2013 (Three-year average)
UMASS% of Recent High School Graduates Enrolling in Remedial Courses2 2015
COMMUNITY COLLEGES% of Recent High School Graduates Enrolling in Remedial Courses2 2015
STATE UNIVERSITIES% of Recent High School Graduates Enrolling in Remedial Courses2 2015
% of HS Seniors Scoring Pro�cient in Math1 2013
% of HS Seniors Scoring Pro�cient in Reading1 2013
4-Year Trend
MA5-YearTrend
MA1-Year
Change
MA6 or 8-Yr.
Trend
MA1 or 2-Yr.Change
(2-Year)
(1-Year)
(8-Year)
(6-Year)
MA
48%
30%
58%
43% 50%36%
34%
34%24%
100%
100%
100%
100%
100%
100%
100%
100%
100%
Any 0%
Math 0%
English 0%
Any 0%
Math 0%
English 0%
Any 0%
Math 0%
English 0%
18%
6%
23%
2%
0%
2%
100%0%
78%75%66%
71%67%56%
100%0%
100%0%
100%0%
College Enrollment Rates of Recent High School Graduates3 Fall 2014
College Enrollment Rates of 18- to 24-Year-Olds4 2011-2013 (Three-year average)
UMASS% of Recent High School Graduates Enrolling in Remedial Courses2 2015
COMMUNITY COLLEGES% of Recent High School Graduates Enrolling in Remedial Courses2 2015
STATE UNIVERSITIES% of Recent High School Graduates Enrolling in Remedial Courses2 2015
% of HS Seniors Scoring Pro�cient in Math1 2013
% of HS Seniors Scoring Pro�cient in Reading1 2013
4-Year Trend
MA5-YearTrend
MA1-Year
Change
MA6 or 8-Yr.
Trend
MA1 or 2-Yr.Change
(2-Year)
(1-Year)
(8-Year)
(6-Year)
MA
48%
30%
58%
43% 50%36%
34%
34%24%
100%
100%
100%
100%
100%
100%
100%
100%
100%
Any 0%
Math 0%
English 0%
Any 0%
Math 0%
English 0%
Any 0%
Math 0%
English 0%
18%
6%
23%
2%
0%
2%
100%0%
78%75%66%
71%67%56%
100%0%
100%0%
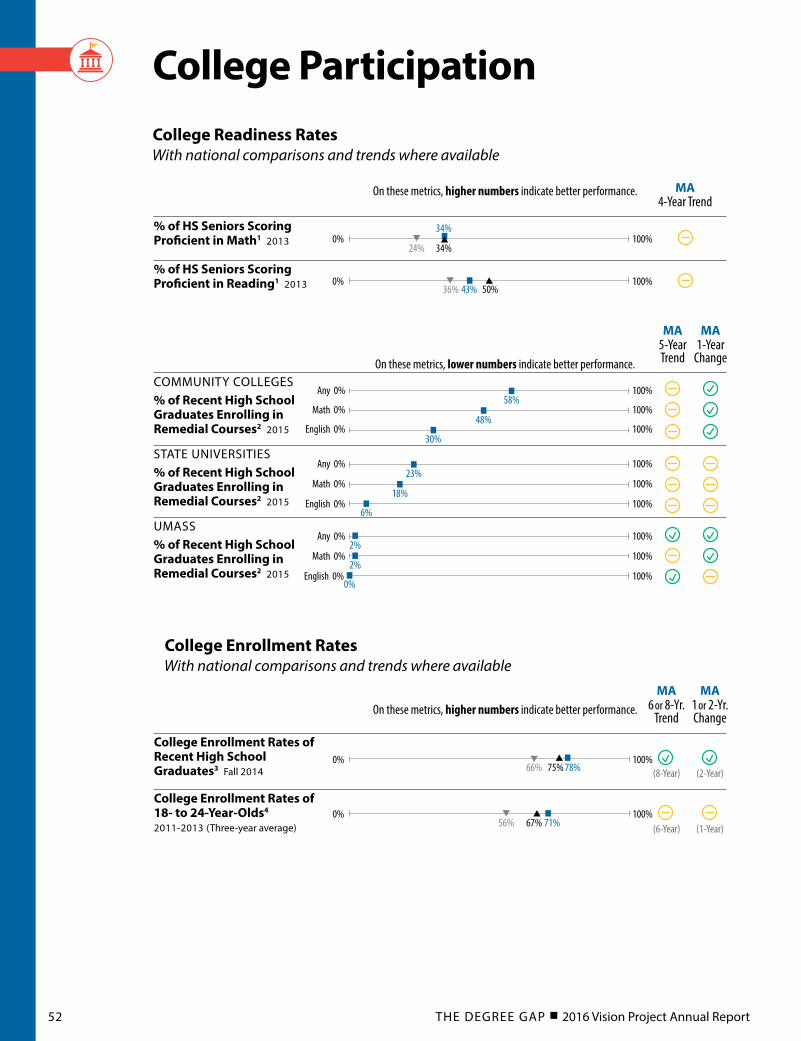
College Readiness Rates With national comparisons and trends where available
College Enrollment Rates With national comparisons and trends where available
College Participation
On these metrics, higher numbers indicate better performance.
On these metrics, higher numbers indicate better performance.
On these metrics, lower numbers indicate better performance.
52 THE DEGREE GAP 2016 Vision Project Annual Report
0-40
0-40
0-40
% of HS Seniors Scoring Pro�cient in Math1 2013
% of HS Seniors Scoring Pro�cient in Reading1 2013
Parental Education Gap
College Enrollment Rates of 18- to 24-Year Olds4 2011–13
Latino/White Gap
African-American/White Gap
Parental Education Gap
Latino/White Gap
African-American/White Gap
Latino/White Gap
African-American/White Gap
4-Year TrendMA
MA5-Year Trend
-28 -7-25
-23 -12-21
-29 -17-26
0-40
0-40
0-40
-31 -13
-31
-27 -12-23
-29 -18-27
0-40
0-40
-5
-5-10
-21 -7-11
0-40
0-40
0-40
% of HS Seniors Scoring Pro�cient in Math1 2013
% of HS Seniors Scoring Pro�cient in Reading1 2013
Parental Education Gap
College Enrollment Rates of 18- to 24-Year Olds4 2011–13
Latino/White Gap
African-American/White Gap
Parental Education Gap
Latino/White Gap
African-American/White Gap
Latino/White Gap
African-American/White Gap
4-Year TrendMA
MA5-Year Trend
-28 -7-25
-23 -12-21
-29 -17-26
0-40
0-40
0-40
-31 -13
-31
-27 -12-23
-29 -18-27
0-40
0-40
-5
-5-10
-21 -7-11
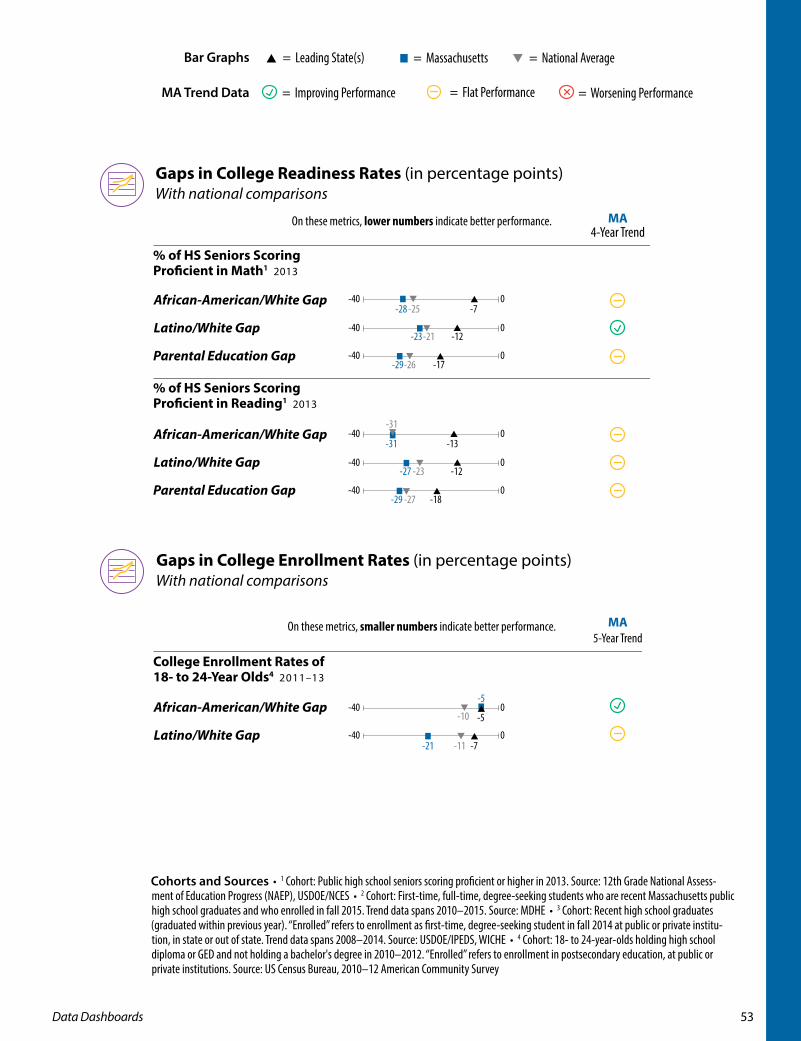
Gaps in College Readiness Rates (in percentage points)With national comparisons
Gaps in College Enrollment Rates (in percentage points)With national comparisons
Cohorts and Sources • 1 Cohort: Public high school seniors scoring proficient or higher in 2013. Source: 12th Grade National Assess-ment of Education Progress (NAEP), USDOE/NCES • 2 Cohort: First-time, full-time, degree-seeking students who are recent Massachusetts public high school graduates and who enrolled in fall 2015. Trend data spans 2010–2015. Source: MDHE • 3 Cohort: Recent high school graduates (graduated within previous year). “Enrolled” refers to enrollment as first-time, degree-seeking student in fall 2014 at public or private institu-tion, in state or out of state. Trend data spans 2008–2014. Source: USDOE/IPEDS, WICHE • 4 Cohort: 18- to 24-year-olds holding high school diploma or GED and not holding a bachelor's degree in 2010–2012. “Enrolled” refers to enrollment in postsecondary education, at public or private institutions. Source: US Census Bureau, 2010–12 American Community Survey
On these metrics, lower numbers indicate better performance.
On these metrics, smaller numbers indicate better performance.
= African American or Latino/a = White = Size of Gap
= Massachusetts= Leading State(s) = National Average
= Improving Performance = Flat Performance = Worsening Performance
Bar Graphs
MA Trend Data
= African American or Latino/a = White = Size of Gap
= Massachusetts= Leading State(s) = National Average
= Improving Performance = Flat Performance = Worsening Performance
53Data Dashboards
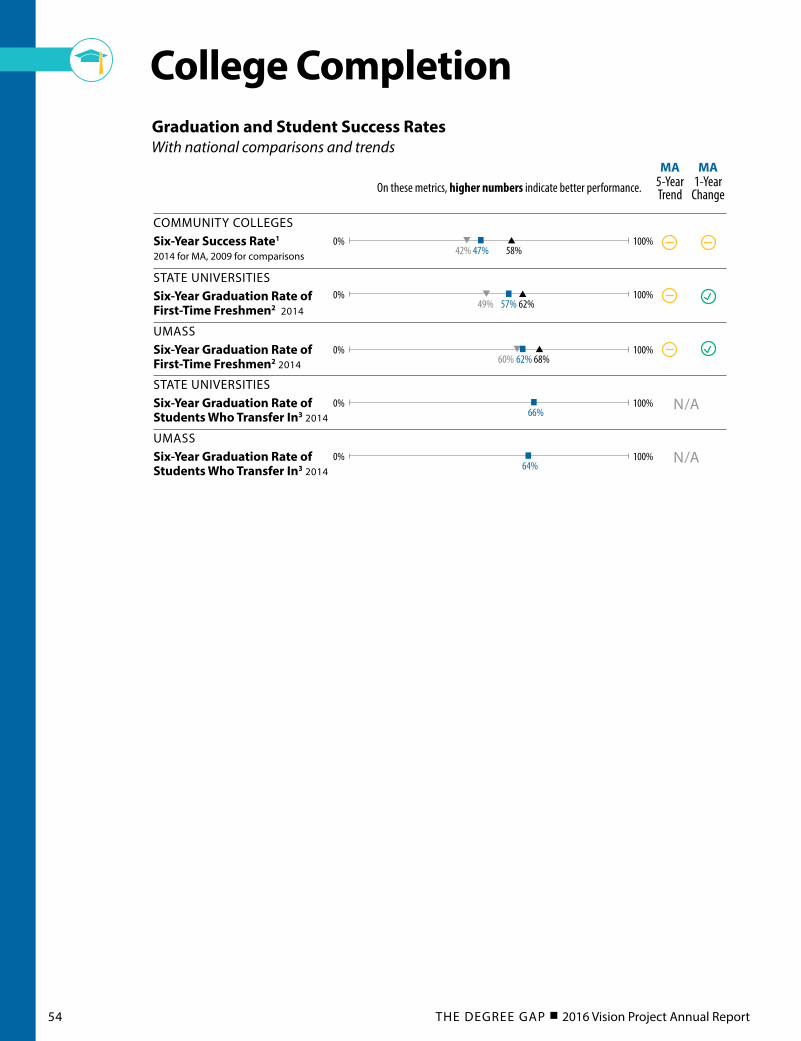
STATE UNIVERSITIESSix-Year Graduation Rate of First-Time Freshmen2 2014
COMMUNITY COLLEGESSix-Year Success Rate1 2014 for MA, 2009 for comparisons
UMASSSix-Year Graduation Rate of First-Time Freshmen2 2014
N/A
N/A
STATE UNIVERSITIESSix-Year Graduation Rate of Students Who Transfer In3 2014
UMASSSix-Year Graduation Rate of Students Who Transfer In3 2014
MA5-YearTrend
MA1-Year
Change
47% 58%42%100%0%
57% 62%49%100%0%
62% 68%60%100%0%
66%100%0%
64%100%0%
Graduation and Student Success RatesWith national comparisons and trends
College Completion
On these metrics, higher numbers indicate better performance.
54 THE DEGREE GAP 2016 Vision Project Annual Report
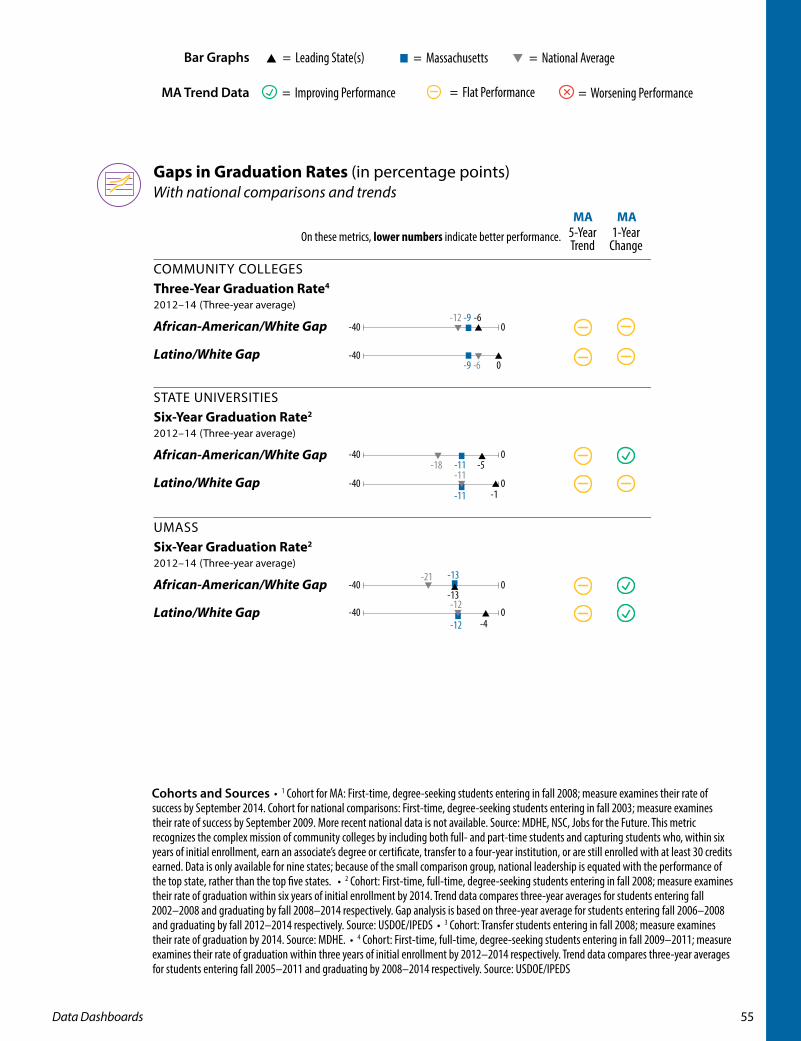
Cohorts and Sources • 1 Cohort for MA: First-time, degree-seeking students entering in fall 2008; measure examines their rate of success by September 2014. Cohort for national comparisons: First-time, degree-seeking students entering in fall 2003; measure examines their rate of success by September 2009. More recent national data is not available. Source: MDHE, NSC, Jobs for the Future. This metric recognizes the complex mission of community colleges by including both full- and part-time students and capturing students who, within six years of initial enrollment, earn an associate’s degree or certificate, transfer to a four-year institution, or are still enrolled with at least 30 credits earned. Data is only available for nine states; because of the small comparison group, national leadership is equated with the performance of the top state, rather than the top five states. • 2 Cohort: First-time, full-time, degree-seeking students entering in fall 2008; measure examines their rate of graduation within six years of initial enrollment by 2014. Trend data compares three-year averages for students entering fall 2002–2008 and graduating by fall 2008–2014 respectively. Gap analysis is based on three-year average for students entering fall 2006–2008 and graduating by fall 2012–2014 respectively. Source: USDOE/IPEDS • 3 Cohort: Transfer students entering in fall 2008; measure examines their rate of graduation by 2014. Source: MDHE. • 4 Cohort: First-time, full-time, degree-seeking students entering in fall 2009–2011; measure examines their rate of graduation within three years of initial enrollment by 2012–2014 respectively. Trend data compares three-year averages for students entering fall 2005–2011 and graduating by 2008–2014 respectively. Source: USDOE/IPEDS
Latino/White Gap
African-American/White Gap
COMMUNITY COLLEGESThree-Year Graduation Rate4 2012–14 (Three-year average)
Latino/White Gap
African-American/White Gap
STATE UNIVERSITIESSix-Year Graduation Rate2 2012–14 (Three-year average)
Latino/White Gap
African-American/White Gap
UMASSSix-Year Graduation Rate2 2012–14 (Three-year average)
5-YearTrend
1-YearChange
MA MA
0-40
0-40
0-40
0-40
0-40
-9 -6-12
-9 0-6
-11 -1
-11
-12
-13
-4
-13-12
-21
-11 -5-18
-40
Gaps in Graduation Rates (in percentage points)With national comparisons and trends
On these metrics, lower numbers indicate better performance.= African American or Latino/a = White = Size of Gap
= Massachusetts= Leading State(s) = National Average
= Improving Performance = Flat Performance = Worsening Performance
Bar Graphs
MA Trend Data
= African American or Latino/a = White = Size of Gap
= Massachusetts= Leading State(s) = National Average
= Improving Performance = Flat Performance = Worsening Performance
55Data Dashboards
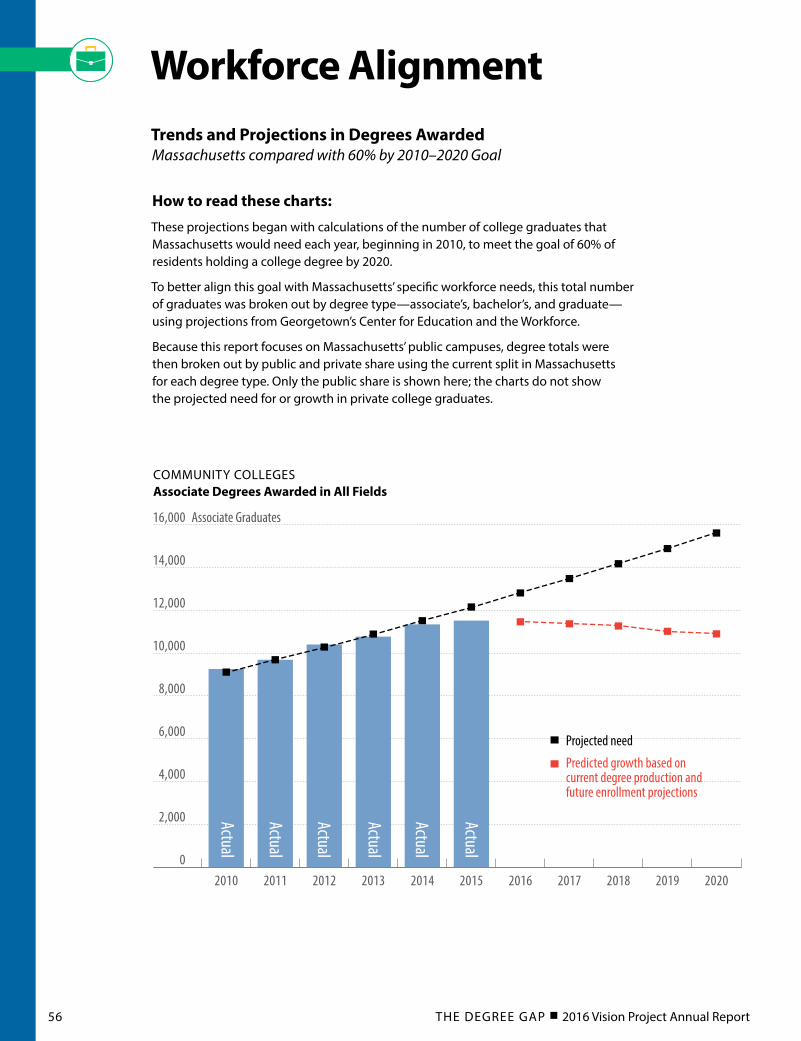
Workforce AlignmentTrends and Projections in Degrees AwardedMassachusetts compared with 60% by 2010–2020 Goal
0
2,000
4,000
6,000
8,000
10,000
12,000
14,000
16,000
20202019201820172016201520142013201220112010
0
2,000
4,000
6,000
8,000
10,000
12,000
14,000
16,000
20202019201820172016201520142013201220112010
Associate Graduates
COMMUNITY COLLEGESAssociate Degrees Awarded in All Fields
Actual
Actual
Actual
Actual
Actual
Actual
Baccalaureate Graduates
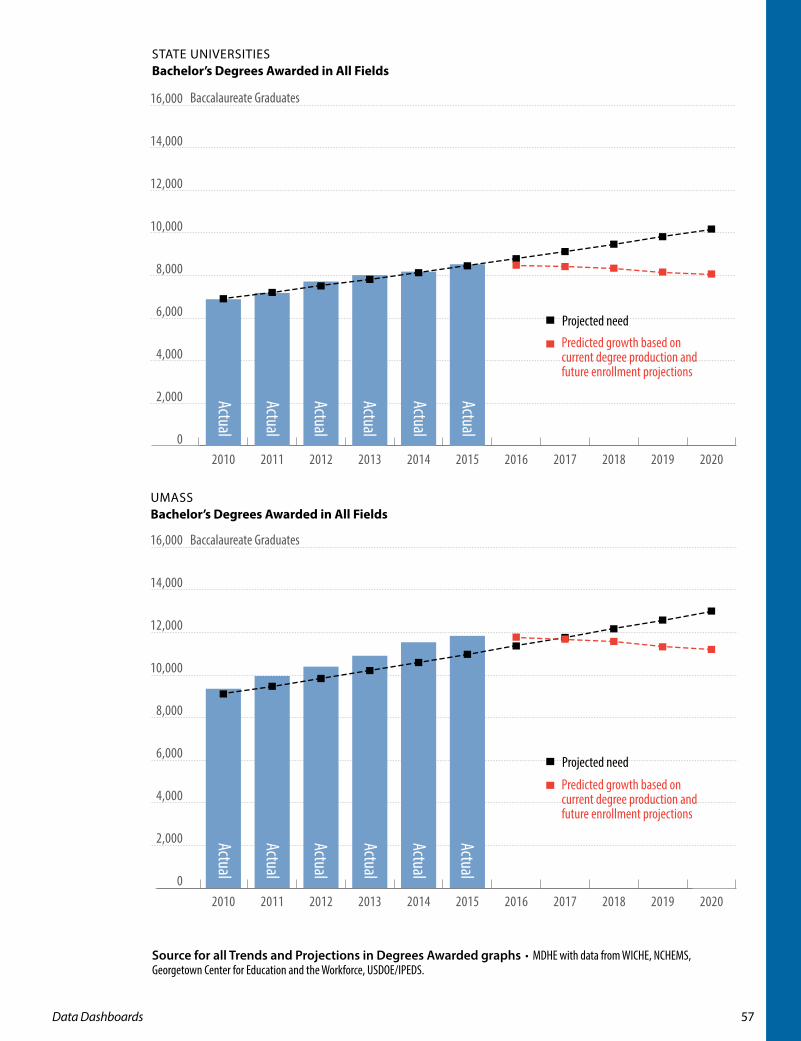
STATE UNIVERSITIESBachelor’s Degrees Awarded in All Fields
Actual
Actual
Actual
Actual
Actual
Actual
Baccalaureate Graduates
UMASSBachelor’s Degrees Awarded in All Fields
0
2,000
4,000
6,000
8,000
10,000
12,000
14,000
16,000
20202019201820172016201520142013201220112010
Actual
Actual
Actual
Actual
Actual
Actual
Projected need
Predicted growth based on current degree production and future enrollment projections
Predicted growth based on current degree production and future enrollment projections
Predicted growth based on current degree production and future enrollment projections
Projected need
Projected need
How to read these charts:
These projections began with calculations of the number of college graduates that Massachusetts would need each year, beginning in 2010, to meet the goal of 60% of residents holding a college degree by 2020.
To better align this goal with Massachusetts’ specific workforce needs, this total number of graduates was broken out by degree type—associate’s, bachelor’s, and graduate— using projections from Georgetown’s Center for Education and the Workforce.
Because this report focuses on Massachusetts’ public campuses, degree totals were then broken out by public and private share using the current split in Massachusetts for each degree type. Only the public share is shown here; the charts do not show the projected need for or growth in private college graduates.
56 THE DEGREE GAP 2016 Vision Project Annual Report
0
2,000
4,000
6,000
8,000
10,000
12,000
14,000
16,000
20202019201820172016201520142013201220112010
0
2,000
4,000
6,000
8,000
10,000
12,000
14,000
16,000
20202019201820172016201520142013201220112010
Associate Graduates
COMMUNITY COLLEGESAssociate Degrees Awarded in All Fields
Actual
Actual
Actual
Actual
Actual
Actual
Baccalaureate Graduates
STATE UNIVERSITIESBachelor’s Degrees Awarded in All Fields
Actual
Actual
Actual
Actual
Actual
Actual
Baccalaureate Graduates
UMASSBachelor’s Degrees Awarded in All Fields
0
2,000
4,000
6,000
8,000
10,000
12,000
14,000
16,000
20202019201820172016201520142013201220112010
Actual
Actual
Actual
Actual
Actual
Actual
Projected need
Predicted growth based on current degree production and future enrollment projections
Predicted growth based on current degree production and future enrollment projections
Predicted growth based on current degree production and future enrollment projections
Projected need
Projected need
Source for all Trends and Projections in Degrees Awarded graphs • MDHE with data from WICHE, NCHEMS, Georgetown Center for Education and the Workforce, USDOE/IPEDS.
57Data Dashboards
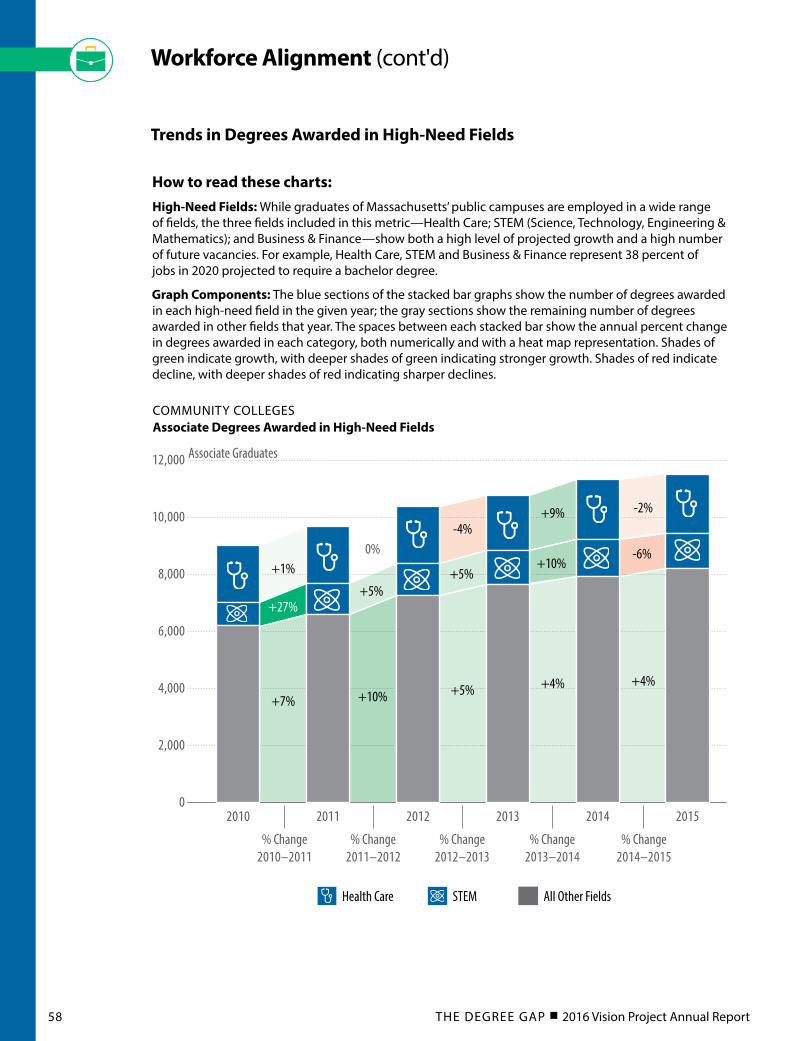
Trends in Degrees Awarded in High-Need Fields
How to read these charts:High-Need Fields: While graduates of Massachusetts’ public campuses are employed in a wide range of fields, the three fields included in this metric—Health Care; STEM (Science, Technology, Engineering & Mathematics); and Business & Finance—show both a high level of projected growth and a high number of future vacancies. For example, Health Care, STEM and Business & Finance represent 38 percent of jobs in 2020 projected to require a bachelor degree.
Graph Components: The blue sections of the stacked bar graphs show the number of degrees awarded in each high-need field in the given year; the gray sections show the remaining number of degrees awarded in other fields that year. The spaces between each stacked bar show the annual percent change in degrees awarded in each category, both numerically and with a heat map representation. Shades of green indicate growth, with deeper shades of green indicating stronger growth. Shades of red indicate decline, with deeper shades of red indicating sharper declines.
Workforce Alignment (cont'd)
0
2,000
4,000
6,000
8,000
10,000
12,000
14,000
16,000
18,000
20,000
22,000
201520142013201220112010
Baccalaureate Graduates
STATE UNIVERSITIES & UMASSBachelor’s Degrees Awarded in High-Need Fields
+16%
+2%
+11%
+9%+7%
+5% +4%+4%
+2%+2%
+6%
+16%
+9%+7%
+8%
+2%+2%
+3% +2%-2%
Health Care STEM Business & Finance All Other FieldsHealth Care STEM All Other Fields
% Change2010–2011
% Change2011–2012
% Change2012–2013
% Change2013–2014
% Change2014–2015
% Change2010–2011
% Change2011–2012
% Change2012–2013
% Change2013–2014
% Change2014–2015
0
2,000
4,000
6,000
8,000
10,000
12,000
201520142013201220112010
Associate Graduates
COMMUNITY COLLEGESAssociate Degrees Awarded in High-Need Fields
+1%0%
-4%+9% -2%
+7% +10% +5% +4% +4%
+27%+5%
+10%-6%
+5%
58 THE DEGREE GAP 2016 Vision Project Annual Report
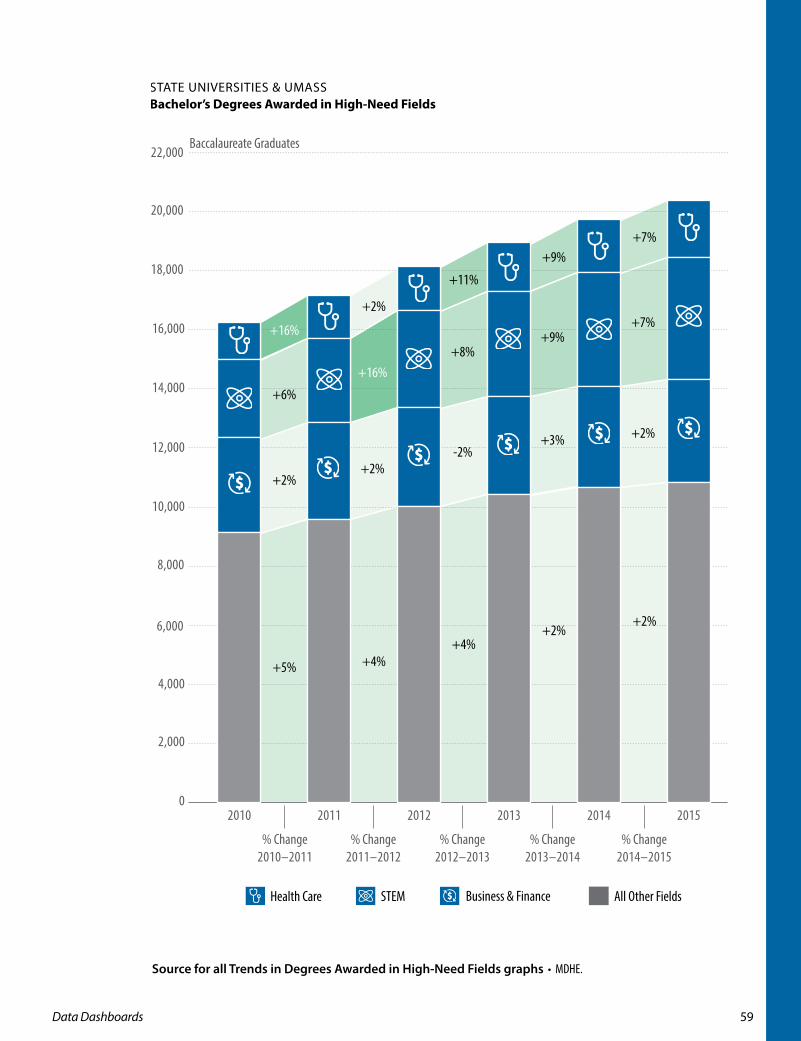
Source for all Trends in Degrees Awarded in High-Need Fields graphs • MDHE.
0
2,000
4,000
6,000
8,000
10,000
12,000
14,000
16,000
18,000
20,000
22,000
201520142013201220112010
Baccalaureate Graduates
STATE UNIVERSITIES & UMASSBachelor’s Degrees Awarded in High-Need Fields
+16%
+2%
+11%
+9%+7%
+5% +4%+4%
+2%+2%
+6%
+16%
+9%+7%
+8%
+2%+2%
+3% +2%-2%
Health Care STEM Business & Finance All Other FieldsHealth Care STEM All Other Fields
% Change2010–2011
% Change2011–2012
% Change2012–2013
% Change2013–2014
% Change2014–2015
% Change2010–2011
% Change2011–2012
% Change2012–2013
% Change2013–2014
% Change2014–2015
0
2,000
4,000
6,000
8,000
10,000
12,000
201520142013201220112010
Associate Graduates
COMMUNITY COLLEGESAssociate Degrees Awarded in High-Need Fields
+1%0%
-4%+9% -2%
+7% +10% +5% +4% +4%
+27%+5%
+10%-6%
+5%
59Data Dashboards
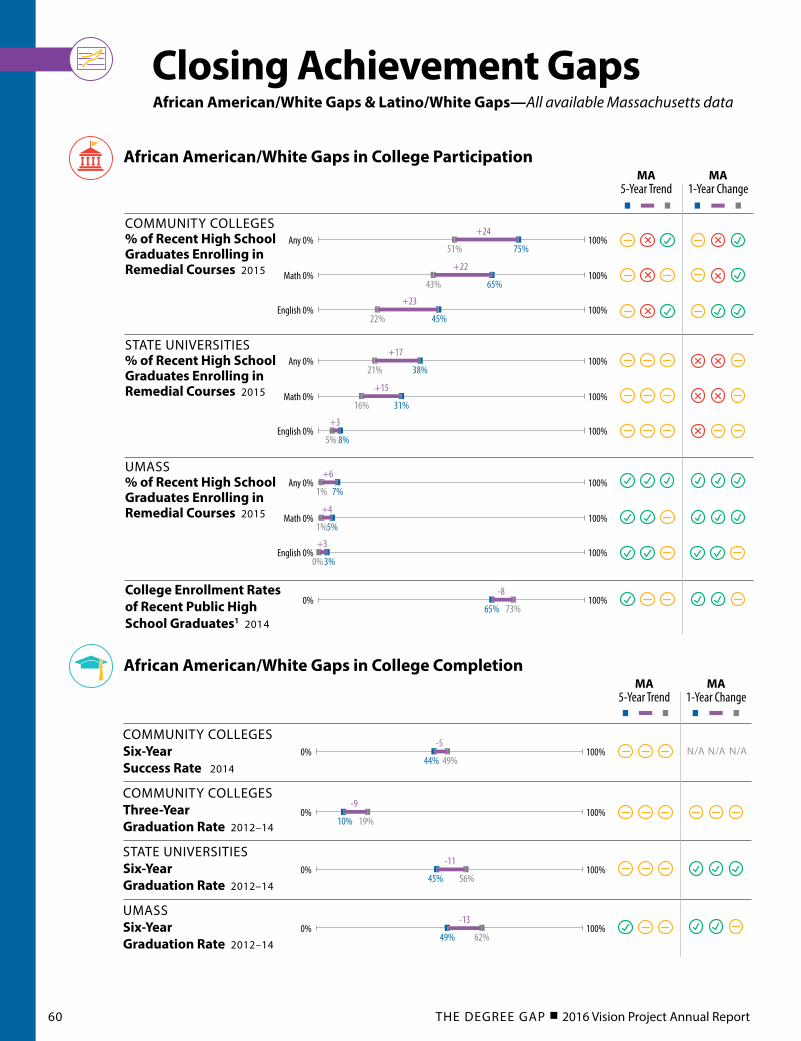
African American/White Gaps & Latino/White Gaps—All available Massachusetts data
African American/White Gaps in College Participation
African American/White Gaps in College Completion
N/AN/A N/A
COMMUNITY COLLEGES % of Recent High School Graduates Enrolling in Remedial Courses 2015
STATE UNIVERSITIES % of Recent High School Graduates Enrolling in Remedial Courses 2015
UMASS% of Recent High School Graduates Enrolling in Remedial Courses 2015
College Enrollment Rates of Recent Public High School Graduates1 2014
COMMUNITY COLLEGES Six-Year Success Rate 2014
COMMUNITY COLLEGES Three-Year Graduation Rate 2012–14
STATE UNIVERSITIES Six-Year Graduation Rate 2012–14
UMASSSix-Year Graduation Rate 2012–14
COMMUNITY COLLEGES % of Graduates Employed and/or Pursuing Additional Education in MA in the Year After Graduation2 2012
STATE UNIVERSITIES % of Graduates Employed and/or Pursuing Additional Education in MA in the Year After Graduation2 2012
UMASS% of Graduates Employed and/or Pursuing Additional Education in MA in the Year After Graduation2 2012
MA5-Year Trend
MA1-Year Change
MA5-Year Trend
MA1-Year Change
75%
+24
51%100%Any 0%
65%
+22
43%100%Math 0%
45%
+23
22%100%English 0%
38%
+17
21%100%Any 0%
31%
+15
16%100%Math 0%
8%
+3
5%100%English 0%
7%
+6
1%100%Any 0%
5%
+4
1%100%Math 0%
3%
+3
0%100%English 0%
65%
-8
73%100%0%
MA5-Year Trend
44%
-5
49%100%0%
10%
-9
19%100%0%
45%
-11
56%100%0%
49%
-13
62%100%0%
93%
+2
+2
91%100%0%
92%
92%100%0%
90%88%100%0%
Closing Achievement Gaps
60 THE DEGREE GAP 2016 Vision Project Annual Report
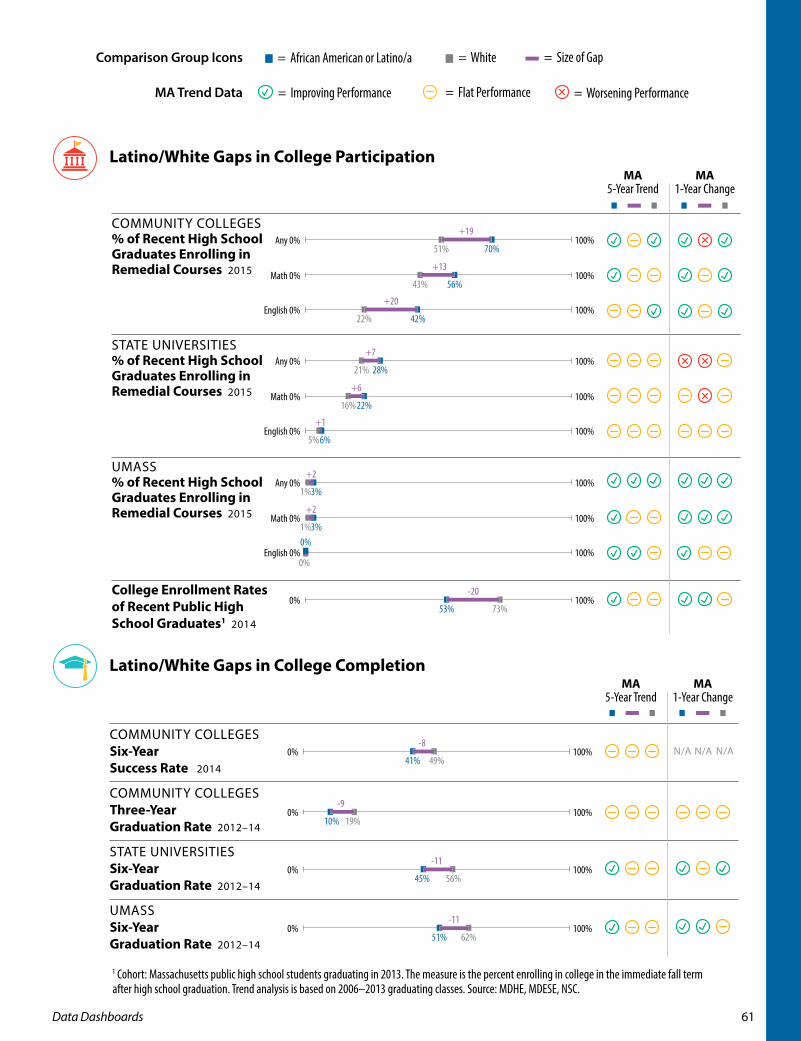
1 Cohort: Massachusetts public high school students graduating in 2013. The measure is the percent enrolling in college in the immediate fall term after high school graduation. Trend analysis is based on 2006–2013 graduating classes. Source: MDHE, MDESE, NSC.
= African American or Latino/a = White = Size of Gap
= Massachusetts= Leading State(s) = National Average
= Improving Performance = Flat Performance = Worsening Performance
Comparison Group Icons
MA Trend Data
= African American or Latino/a = White = Size of Gap
= Massachusetts= Leading State(s) = National Average
= Improving Performance = Flat Performance = Worsening Performance
Latino/White Gaps in College Participation
Latino/White Gaps in College Completion
N/AN/A N/A
COMMUNITY COLLEGES % of Recent High School Graduates Enrolling in Remedial Courses 2015
STATE UNIVERSITIES % of Recent High School Graduates Enrolling in Remedial Courses 2015
UMASS% of Recent High School Graduates Enrolling in Remedial Courses 2015
College Enrollment Rates of Recent Public High School Graduates1 2014
COMMUNITY COLLEGES Six-Year Success Rate 2014
COMMUNITY COLLEGES Three-Year Graduation Rate 2012–14
STATE UNIVERSITIES Six-Year Graduation Rate 2012–14
UMASSSix-Year Graduation Rate 2012–14
COMMUNITY COLLEGES % of Graduates Employed and/or Pursuing Additional Education in MA in the Year After Graduation2 2012
STATE UNIVERSITIES % of Graduates Employed and/or Pursuing Additional Education in MA in the Year After Graduation2 2012
UMASS% of Graduates Employed and/or Pursuing Additional Education in MA in the Year After Graduation2 2012
MA5-Year Trend
MA1-Year Change
MA5-Year Trend
MA1-Year Change
70%
+19
51%100%Any 0%
56%
+13
43%100%Math 0%
42%
+20
22%100%English 0%
28%
+7
21%100%Any 0%
22%
+6
16%100%Math 0%
6%
+1
5%100%English 0%
53%
-20
73%100%0%
MA5-Year Trend
41%
-8
49%100%0%
10%
-9
19%100%0%
45%
-11
56%100%0%
51%
-11
62%100%0%
90%
-1
+1
91%100%0%
94%92%100%0%
89%88%100%0%
+2
100%Any 0%
3%
+2
1%100%Math 0%
3%
+2
1%
0%
0%100%English 0%
61Data Dashboards
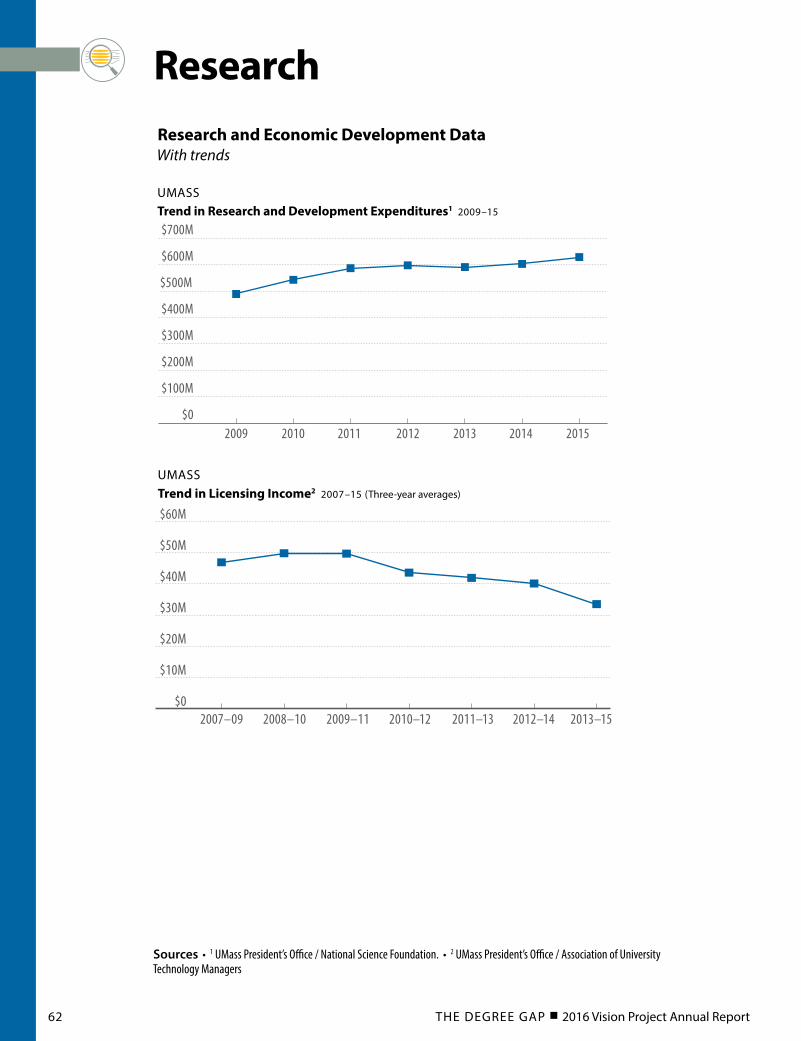
Research and Economic Development Data With trends
20102009 2011 2012 2013 2014 2015
Total R&D Expenditures
$0
$100M
$200M
$300M
$400M
$500M
$600M
$700M
2008–102007–09 2009–11 2010–12 2011–13 2012–14 2013–15
Total Licensing Income
$0
$10M
$20M
$30M
$40M
$50M
$60M
UMASSTrend in Research and Development Expenditures1 2009–15
UMASSTrend in Licensing Income2 2007–15 (Three-year averages)
Sources • 1 UMass President’s Office / National Science Foundation. • 2 UMass President’s Office / Association of University Technology Managers
Research7
62 THE DEGREE GAP 2016 Vision Project Annual Report
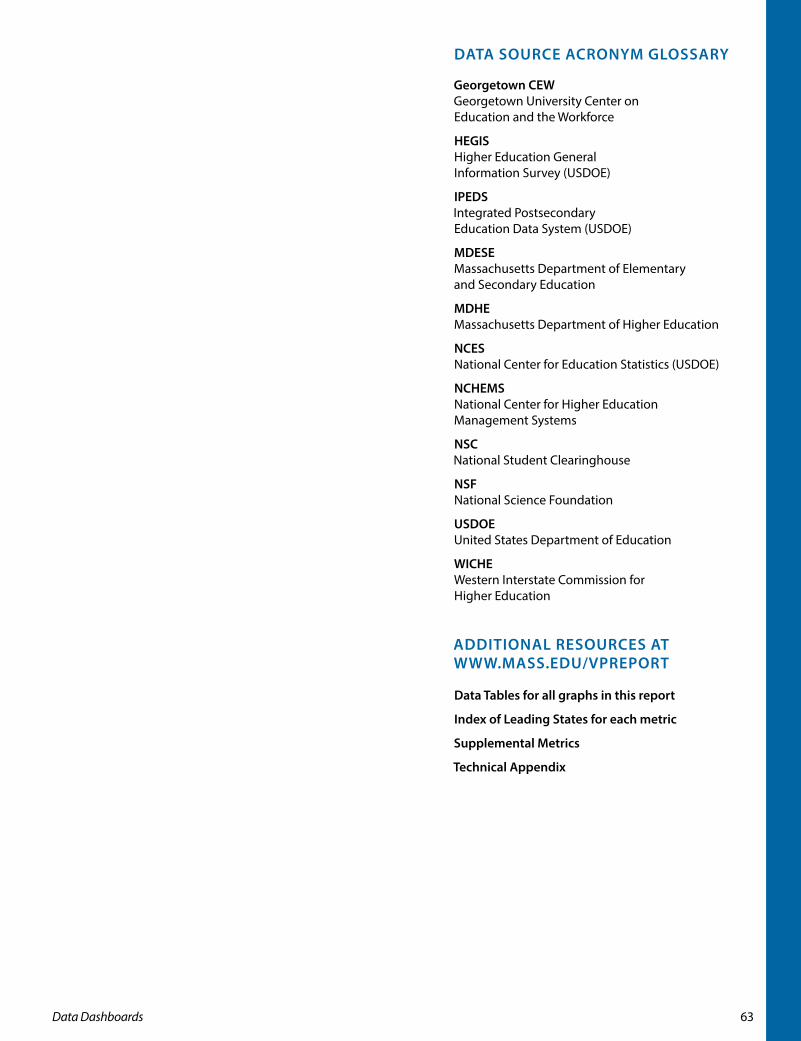
DATA SourCe ACroNyM GloSSAry
ADDITIoNAl reSourCeS AT www.MASS.eDu/vPrePorT
Georgetown Cew Georgetown University Center on Education and the Workforce
HeGIS Higher Education General Information Survey (USDOE)
IPeDS Integrated Postsecondary Education Data System (USDOE)
MDeSe Massachusetts Department of Elementary and Secondary Education
MDHe Massachusetts Department of Higher Education
NCeS National Center for Education Statistics (USDOE)
NCHeMS National Center for Higher Education Management Systems
NSC National Student Clearinghouse
NSF National Science Foundation
uSDoe United States Department of Education
wICHe Western Interstate Commission for Higher Education
Data Tables for all graphs in this report
Index of leading States for each metric
Supplemental Metrics
Technical Appendix
63Data Dashboards