data descriptor: a multiscale imaging and …specimens (including the external auditory canal, the...
TRANSCRIPT

General rights Copyright and moral rights for the publications made accessible in the public portal are retained by the authors and/or other copyright owners and it is a condition of accessing publications that users recognise and abide by the legal requirements associated with these rights.
Users may download and print one copy of any publication from the public portal for the purpose of private study or research.
You may not further distribute the material or use it for any profit-making activity or commercial gain
You may freely distribute the URL identifying the publication in the public portal If you believe that this document breaches copyright please contact us providing details, and we will remove access to the work immediately and investigate your claim.
Downloaded from orbit.dtu.dk on: Jun 12, 2020
Data Descriptor: A multiscale imaging and modelling dataset of the human inner ear
Gerber, Nicolas; Reyes, Mauricio; Barazzetti, Livia; Kjer, Hans Martin; Vera, Sergio; Stauber, Martin;Mistrik, Pavel; Ceresa, Mario; Mangado, Nerea; Wimmer, WilhelmTotal number of authors:15
Published in:Scientific Data
Link to article, DOI:10.1038/sdata.2017.132
Publication date:2017
Document VersionPublisher's PDF, also known as Version of record
Link back to DTU Orbit
Citation (APA):Gerber, N., Reyes, M., Barazzetti, L., Kjer, H. M., Vera, S., Stauber, M., Mistrik, P., Ceresa, M., Mangado, N.,Wimmer, W., Stark, T., Paulsen, R. R., Weber, S., Caversaccio, M., & Gonzalez Ballester, M. A. (2017). DataDescriptor: A multiscale imaging and modelling dataset of the human inner ear. Scientific Data, 4, [170132].https://doi.org/10.1038/sdata.2017.132

Data Descriptor: A multiscaleimaging and modelling datasetof the human inner earNicolas Gerber1, Mauricio Reyes2, Livia Barazzetti2, Hans Martin Kjer3, Sergio Vera4,Martin Stauber5, Pavel Mistrik6, Mario Ceresa7, Nerea Mangado7, Wilhelm Wimmer1,8,Thomas Stark8, Rasmus R. Paulsen3, Stefan Weber1, Marco Caversaccio9
& Miguel A. González Ballester7,10
Understanding the human inner ear anatomy and its internal structures is paramount to advance hearingimplant technology. While the emergence of imaging devices allowed researchers to improveunderstanding of intracochlear structures, the difficulties to collect appropriate data has resulted in studiesconducted with few samples. To assist the cochlear research community, a large collection of humantemporal bone images is being made available. This data descriptor, therefore, describes a rich set of imagevolumes acquired using cone beam computed tomography and micro-CT modalities, accompanied bymanual delineations of the cochlea and sub-compartments, a statistical shape model encoding itsanatomical variability, and data for electrode insertion and electrical simulations. This data makes animportant asset for future studies in need of high-resolution data and related statistical data objects of thecochlea used to leverage scientific hypotheses. It is of relevance to anatomists, audiologists, computerscientists in the different domains of image analysis, computer simulations, imaging formation, and forbiomedical engineers designing new strategies for cochlear implantations, electrode design, and others.
Design Type(s) observation design
Measurement Type(s) inner ear morphology trait
Technology Type(s)micro-computed tomography • Cone-Beam Computed Tomography• Computer Modeling
Factor Type(s) Biologic Sample Preservation Procedure
Sample Characteristic(s) Homo sapiens • petrous part of temporal bone
1ARTORG Center for Biomedical Engineering Research, University of Bern, Switzerland. 2Institute for SurgicalTechnology and Biomechanics, University of Bern, Bern 3100, Switzerland. 3Technical University of Denmark,Copenhagen 2800, Denmark. 4Alma IT Systems, Barcelona 8007, Spain. 5Scanco Medical AG, Brüttisellen 8306,Switzerland. 6Med-El, Innsbruck 6020, Austria. 7Universitat Pompeu Fabra, Barcelona 8007, Spain. 8Departmentof Otorhinolaryngology, Technical University Munich, Munich 80333, Germany. 9Department of ENT, Head andNeck Surgery, Inselspital, University Hospital of Bern, Bern 3100, Switzerland. 10ICREA, Barcelona 8007, Spain.Correspondence and requests for materials should be addressed to M.R. (email: [email protected])
OPEN
Received: 6 March 2017
Accepted: 24 July 2017
Published: 19 September 2017
www.nature.com/scientificdata
SCIENTIFIC DATA | 4:170132 | DOI: 10.1038/sdata.2017.132 1

Background & SummaryThe anatomy of the human cochlea is subject to research in many areas of scientific and technologicaldevelopment including audiological studies, the development of less invasive surgical procedures and thedesign of more effective artificial hearing implants. Since the emergence of imaging technologies, it hasbecome evident that imaging of the human cochlea has played a central role in these and other areas ofresearch1–4. In audiology, the intrinsic relation between cochlear function and shape has beenexhaustively studied, and has enabled the use of imaging information to develop functional models5–7.Similarly, in image-guided surgery of cochlear interventions, imaging has allowed researchers to studysafety margins and how the anatomical variability is to be taken into account for safer and less invasivesurgical procedures8–12. In electrophysiological modelling of the human cochlea, initial works have usedsynthetic and simplistic models, and despite the awareness on the importance of using realistic modelsgenerated from patient data, the difficulties to collect appropriate data has resulted in studies conductedwith few samples13–15. In relation to the anatomical size of the human cochlea and its internal structures,the geometric resolution of current clinical computed tomography (CT) scans is considerably low. As aresult, images acquired from patients typically lack information on the intracochlear anatomy and aretherefore of limited usage for precise and accurate patient treatment or for the improvement anddevelopment of artificial hearing implants. To counter the limited resolution of clinical CT imaging,several attempts have been proposed to estimate the information of interest (e.g., complete cochlear ductlength, position of the basilar membrane) from surrogate data measured or derived from CT images16–19.However, the complexity of the cochlear anatomy lowers the effectiveness of these approaches, as theobservable surrogate measures are not capable of fully characterizing the internal cochlear anatomy.
With the advent of modern imaging techniques, such as micro computed tomography (μCT), thepossibility to obtain detailed imaging information has allowed researchers to capture details of thecochlear anatomy that were not possible before. The current limitations of this technology for clinicalintegration are the reduced size of the scanning field of view, and the high amount of radiation doserequired to obtain high level of image quality. However, ex-vivo studies using μCT imaging informationhave enabled researchers to validate important scientific hypotheses and computational models of thehuman cochlear physiology1,20–23.
Solutions to make connections between the relatively ‘low-resolution’ clinical scenario and the ex-vivoμCT imaging have emerged in recent years through the development of advanced computational modelsthat use μCT information to build high resolution models of the cochlear anatomy, which can be used toinfer the patient-specific anatomy from the low-resolution clinical CT image24. These computationalmodels are able to better capture the three-dimensional correlations between shape information derivedfrom CT and μCT imaging.
Construction of these high-resolution models requires the application of image processing techniqueson high-resolution imaging. In addition to the high resource demands of μCT imaging, the release of thisdata descriptor makes an important asset for future studies in need of high-resolution data and relatedmodels and statistical data objects of the cochlea used to leverage scientific hypotheses.
This data descriptor encompasses a rich set of imaging data sets of the human cochlea, accompaniedby manual delineations of the cochlea and sub-compartments, a statistical shape model encoding itsanatomical variability, and models for electrode insertion simulation and electrical stimulations. It is ofrelevance to anatomists, audiologists, computer scientists in the different domains of image analysis,computer simulations, and imaging formation, as well as for biomedical engineers designing newstrategies for cochlear implantations, electrode design, and others.
The provided data includes 52 temporal bones scanned with clinical cone beam CT (CBCT) and μCTresulting in 30 and 50 image volumes respectively. Manual and semiautomatic segmentations of thecochlea from μCT data are provided for 24 samples. A statistical shape model (SSM) that describes themain patterns of shape variability has been built from a subset of the available data, and can be used togenerate statistically plausible sample shapes programmatically. Finally, we contribute with several dataobjects for finite-element simulations of electrode insertion and electrical stimulation. An overview of thedata generation can be seen in Fig. 1.
MethodsIn the following sections, detailed description of the samples preparation, image acquisition and meshmodelling is presented. Since the database encompasses different modalities and protocols, the methodsare separated per dataset when appropriate, following the convention in Table 1.
All specimens in this data descriptor are coming from the University of Bern and the TechnicalUniversity of Munich (TUM). Approval from the local ethical body in Bern was received for thespecimens included herein (Ethics Commmission of Bern, Switzerland, KEK-BE Nr. 2016-00887).Specimens from the Technical University of Munich were provided according to the World MedicalAssociation Declaration of Helsinki25.
In general, the workflow depicted in Fig. 2 was followed in order to provide CBCT and μCT imagedatasets of the specimens. In addition, a subset of the specimens were implanted using cochlear implantselectrode array and imaged for further implantation analysis.
www.nature.com/sdata/
SCIENTIFIC DATA | 4:170132 | DOI: 10.1038/sdata.2017.132 2

Human cadaver specimens preparationAll imaging and mesh data provided in this data descriptor originate from sets of cadaveric humantemporal bone specimens containing the cochlea. The specimens are organized and summarized inTable 1 and described below in terms of preservation of the biological tissue, extraction and preparation,imaging methodology, image processing approaches, statistical shape modeling, and finite element modelcreation.
Specimen collection A. In total, 20 petrous temporal bones were extracted from 10 whole humancadaver head specimens preserved in Thiel solution26,27. The Thiel fixation method is known to preservethe mechanical properties of the tissue without the hardening and shrinkage of soft tissue, whileconserving the specimen for long periods of time, similarly to formaldehyde. The specimens wereprepared to fit in a sample holder with a diameter of 34 mm prior to image acquisition. While 19 petrousbones contained the complete external auditory canal, middle and inner ear, one case was damagedduring the extraction process (the anterior semicircular canal was slightly cut) and was thus excludedfrom this descriptor.
Specimen collection B. Seven human cadaveric specimens were obtained from a previous studyinvestigating a minimally invasive robotic approach for cochlear implantation8. A small tunnel (1.8 mmin diameter), originating on the mastoid surface and targeting the center of the round window, wasdrilled in each specimen and free-fitting CI electrode arrays were manually inserted. In order to allowimaging using a μCT scanner, the petrous part of the temporal bone was extracted from the whole headspecimens (including the external auditory canal, the middle ear and the inner ear). A detaileddescription of the materials and methods is given in Bell et al.8 and Wimmer et al.12.
Specimen collection C. A total of 20 dry temporal bone specimens were provided by the anatomicalcollection of the Institute of Anatomy, University of Bern, Switzerland. No intracochlear structures suchas the basilar membrane or the round/oval window membranes were preserved. Thus, only the calcifiedtissues are visible in the images. The sample holder size of the μCT was chosen individually per sample inorder to fit the specimen size containing the complete inner ear. All specimens were fixed in the sampleholders with polystyrene foam to avoid relative motion of the specimens during the scans.
Figure 1. Spiral of cochlear data generation: From harvested cochlea specimens, μCT and Cone-beam CT
scans, image segmentations, 3D models of the human cochlea, statistical shape model, geometrical models of
surrounding cochlear structures, finite-element data objects for electrode insertion and electrical simulation.
The resulting data are summarized in Tables 2 and 3.
www.nature.com/sdata/
SCIENTIFIC DATA | 4:170132 | DOI: 10.1038/sdata.2017.132 3

Specimen collection D. Five petrous temporal bones were frozen and preserved at −20 °C, withoutadditional fixation, and defrosted 3 h before scanning. Four samples were implanted with MED-ELFlexEAS dummy electrode arrays excluding wires (in order to avoid metal artifacts) using a transmastoidapproach and a posterior tympanotomy. The semicircular canals could not be retained in order to be ableto fit the specimens to the 17 mm μCT holder of a μCT 50 scanner (Scanco Medical AG, Brüttisellen,Switzerland). A detailed description is available in1,28.
Image acquisitionImages from the prepared specimens were acquired using μCT and CBCT modalities. An overview of theresulting image datasets are depicted in Fig. 3. The diagram is organized as follows: specimen affiliation,preservation method, collections, followed by CBCT and μCT imaging for intact and implantedspecimens.
μCT imaging. All prepared specimens from collections A and C were imaged using a μCT 100 scanner(Scanco Medical AG, Brüttisellen, Switzerland). Additionally, the prepared specimens from collection Dwere scanned using a μCT 50 scanner (Scanco Medical AG, Brüttisellen, Switzerland). Table 2summarizes the μCT measurement parameters for the different specimen collections. All specimens werefixed in the sample holders with polystyrene foam to avoid relative motion of the specimen during thescans. No medium such as ethanol or phosphate-buffered saline (PBS) was added and the specimens werescanned in air to obtain the best image contrast.
The data was reconstructed using a filtered back-projection algorithm. From an initial reconstruction, aregion of interest was selected and subsequently reconstructed to 4,608 × 4,608 pixels per slice. Theresulting voxel size is 7.6 μm for the Thiel fixed specimens, 16.3 μm for the specimens measured in the 73mm sample holder and 19.5 μm for the specimens measured in the 88 mm sample holder, respectively.Finally, the reconstructed data was converted and stored as sequences of DICOM images.
CBCT imaging. While μCT may provide sufficient spatial resolution to display intracochlearmembranous structures, it is limited to in-vitro examinations with samples restricted in size. This datadescriptor is therefore augmented with clinically applicable modalities such as the cone beam CT(CBCT). 15 specimens from collection A and 7 specimens from collection B were scanned with a ProMax3D Max CBCT scanner (Planmeca, Finland). The specimens were placed in a plastic container at theapproximate center of the revolving scanning arm. A lower skull scan protocol with the followingparameters was used: 90 kVp, 8 mA, 100 mm FOV, 108mAs and a slice thickness of 0.15 mm. The focalspot was 0.6 mm×0.6 mm according to the manufacturer’s documentation. The resulting reconstructedstack of images has an isotropic voxel size of 150 μm and are saved in a sequence of DICOM files.
In addition, 8 specimens from collection A were imaged using the xCAT® mobile CBCT scanner(Xoran Technologies, United States). The specimens were placed in a plastic container at the approximatecenter of the rotating gantry. A high resolution scanning protocol was used using the followingparameters: 120 kVp, 6 mA, 245mm FOV. The resulting reconstructed stack of images has an isotropicvoxel size of 300 μm and are saved in a sequence of DICOM files.
ID Source Specimen Preservation Method Number of Samples
A University of Bern Petrous bone Thiel 19
B University of Bern Petrous bone Thiel 7
C University of Bern Petrous bone Dry 20
D Technical University of Munich (TUM) Cochlea Frozen 5
Table 1. Summary of human cadaver specimen collections.
Figure 2. Imaging workflow overview.
www.nature.com/sdata/
SCIENTIFIC DATA | 4:170132 | DOI: 10.1038/sdata.2017.132 4

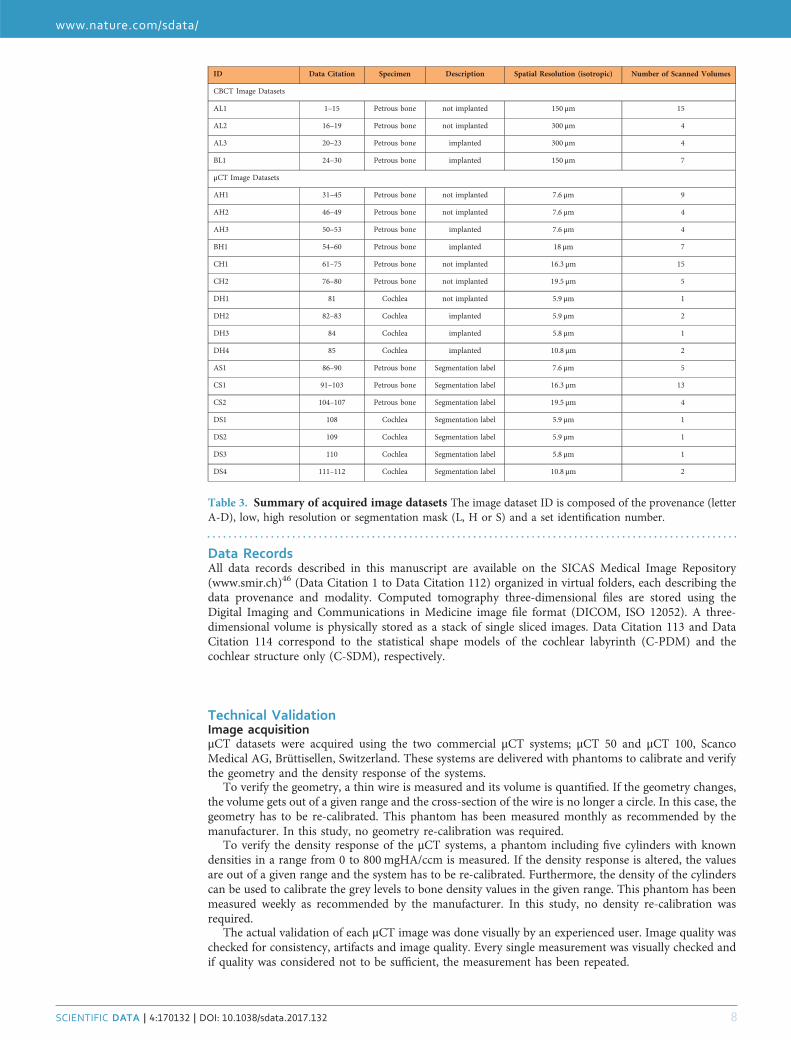
Summary of acquired image datasets. The following table summarizes the different image datasetsobtained from imaging the specimen collections.
Micro computed tomography segmentationSpecimen collection A. The contrast in the images enables the distinction between cochlear fluid-filledregions, soft-tissue and bone. The following inner ear structures were manually segmented on 5 μCTimage datasets using a commercially available software (Amira, FEI Visualization Sciences Group):
● The scala tympani and scala vestibuli. Because the image resolution was not sufficient to visualize theReissner’s membrane, the scala media could not be identified and was included in the scala vestibulisegmentation.
● The vestibule and the semicircular canals● The modiolus (including the interscalar septum)● The lamina spiralis● The spiral ligament● The basilar membrane● The round and oval window membranes
The data resulting from segmentation is a volumetric label image, where each voxel in the originalvolume has been assigned a label. A label is an integer value indicating the nature of the underlying tissue.Surface models of the different anatomies can be generated from the label volumes using standard iso-surface extraction techniques29.
Figure 3. Overview and origin of acquired image datasets with number of specimens (s) and number of
image volumes (n). Each image set was given an ID composed of the specimen provenance (letter A–D), low,
high resolution or segmentation mask (L, H or S) and a set identification number.
www.nature.com/sdata/
SCIENTIFIC DATA | 4:170132 | DOI: 10.1038/sdata.2017.132 5

Specimen collection C. The contrast in the set of images from collection C enables bone and non-bonestructures to be distinguished. The labyrinth was segmented by using a single object/label representingthe cochlear scalae (i.e., scala tympani, vestibuli and media), vestibule and semicircular canals. The laminaspiralis was excluded from the object, and the openings to the oval and round window had no obviousboundaries to demarcate the segmentation. Consequently, a consistent smooth manual closing wasperformed in these regions. The manual closing of the oval and round window and segmentation of thecochlea, vestibule and semicircular canals was performed using the software tool ITK-SNAP30, while themanual corrections of the segmentations were made using the software tool Seg3D (www.seg3d.org). Itresulted in 19 labelled image datasets.
Specimen collection D. Two image datasets were manually segmented with a commercially availablesoftware (Amira, FEI Visualization Sciences Group). In the case of the non-implanted temporal bones,the segmented structures were the scala vestibuli, scala tympani, osseous spiral lamina, round window,cochlear partition and stapes. Since the Reissner’s membrane was missing, the scala media could not beindividually identified and was included in the scala vestibuli segmentation. In the case of the implantedtemporal bones, the structures segmented were the electrode array, scala tympani and scala vestibuli.
Statistical shape analysisStatistical shape modeling (SSM). is a powerful technique used to represent the anatomical variabilityof a given structure or organ as a compact and parametric mathematical model. The first step of theprocess is to establish correspondences between the samples. The principle described in Frangi et al.31 isfollowed, where the correspondences are found through a volumetric image registration between a chosenreference and each of the remaining available samples. Following, the image registration a mesh structurewas propagated to all samples using the deformation fields computed using the volumetric registration.
Labyrinth PDM ( Data Citation 113): From the specimen collection C, 17 samples could be used tobuild a classic Point Distribution Model (PDM)32 of the inner ear labyrinth, with the registration modeldetailed in ref. 33. In short, the datasets were downsampled to 24 μm voxel-sizes and then rigidly alignedto take out variability in translation and rotation between the samples. In order to ensure a good qualityof the following non-rigid registration, especially for the cochlear turns and apical region, a simple modelof the cochlea skeleton was introduced, which provides a more suited way of describing the similaritybetween two cochlea samples. The non-rigid multi-level cubic B-spline registrations were made followingthe framework and formulation of the elastix software library34.
Cochlea PDM ( Data Citation 114): The reference 3D surface model is projected to each of theindividual samples through the image registration transformations. A classic linear principal componentanalysis (PCA) is made using Statismo35. The result is a point distribution model (PDM) that models thevariation in the surface point coordinates.
Virtual electrode array insertion and finite element mesh generationIn order to generate a complete computational model of the cochlear implantation, the electrode arrayneeds to be virtually implanted into the specific cochlear anatomy, previously created. Thus, a virtualinsertion is first performed followed by the generation of a volumetric finite element mesh of the wholemodel allowing further assessment of the electrical activation using Finite Element Methods (FEM).
During the virtual insertion step, first, the vestibular and semicircular canals are removed from thevirtual cochlea and an insertion point is estimated at the center of the round window membrane. Aspecific electrode array is subsequently generated from a parametric model that describes the possibleshape, size, number and type of electrode contacts using template files written in the open-source CADlanguage OpenSCAD (http://www.openscad.org). Once both the processed cochlea and specific selectedelectrode are defined, the insertion of the electrode inside the virtual ear is performed. A set of issues needto be considered to compute a virtual insertion. There exist many possible surgical trajectories and thefinal position of the implant during a real intervention will depend on several factors such as the stiffness
Sample Holder Diameter TUM (n= 4) 17mm TUM (n= 2) 32mm Thiel (n= 16) 34mm Dry (n= 15) 73mm Dry (n= 5) 88mm
Energy 70 kVp 70 kVp 90 kVp 90 kVp 90 kVp
Intensity 200 μA 200 μA 88 μA 155 μA 155 μA
Filtering Al 0.5 mm Al 0.5 mm Al 0.5 mm Al 0.5 mm Al 0.5 mm
Integration time 800/1,000 ms 800/1,000 ms 600 ms 350ms 350 ms
Frame averaging 4 x 4 x 2 x 4 x 4 x
Samples 3,400 3,400 3,072 3,072 3,072
No. projections/180° 1,500 1,500 2,000 2,000 2,000
HR reconstruction voxel size 5.9 μm 10.8 μm 7.6 μm 16.3 μm 19.5 μm
Average measurement time 36 h 36 h 25.5 h 23.4 h 21.0 h
Table 2. μCT measurement settings used for the different collections of specimens.
www.nature.com/sdata/
SCIENTIFIC DATA | 4:170132 | DOI: 10.1038/sdata.2017.132 6

of the electrode itself, the dexterity of the surgeon and the interaction between the insertion tools and thepatient’s anatomy.
Additionally, to reduce computational complexity, the virtual insertion step is optimized for potentialrepeated use. A two-step solution is proposed. First computing a possible surgical trajectory using theSOFA framework, using simplified geometrical models and greedy collision detection algorithms, andsecond deforming the shape of the original electrode design in the new position using the paralleltransport frame36,37. The collision model for the electrode array is generated using a set of points andlines along the centerline of the object for reducing computation time38,39. Several trajectories are pre-computed to speed up the process accommodating the most common scenarios, but can be traced againfor special cases. Overall, this results in a very flexible and lightweight approach to control the insertion ofthe electrode into the cochlea.
Once the virtual insertion is completed, the generation of the volumetric mesh is performed. Thismesh is used to carry out the stimulation of the electrical activation of the nerve fibers due to the implantactivation. Starting from the surface models of the virtually implanted cochlea, the nerve fibers areautomatically generated considering the position of the spiral ganglion and a surrounding temporal bone,which is crucial for a realistic propagation of the stimulating currents. Spheres of 0.75 mm of diameter arecreated on the electrode's contact to ease the definition of boundary conditions for the electricalstimulation. Afterwards, all the structures described so far are merged and a single tetrahedral mesh isgenerated (see Fig. 4) and proper FEM definitions are applied. Further details of the framework can befound in Mangado et al.40 and a full application to the case of patients with healthy and degeneratednerve auditory fibers in Ceresa et al.41. The aspect ratio of all elements contained in the final mesh iscomputed to quantify the mesh quality of the model, in order to avoid convergence problems during thefinite element simulation. Finally, the tetrahedral mesh is exported into a GMESH2 file format (MSH)which details the list of tetrahedral elements and their connections42.
Code availabilityStatismo framework. Statismo is an open source C++ framework for statistical shape modeling43. Itsupports all shape modeling tasks, from model building to shape analysis. Although the focus of Statismolies on shape modeling, it is designed such that it supports a variety of statistical models, includingstatistical deformation models and intensity models. One of the main goals of Statismo is to make theexchange of statistical shape models easy. This is achieved by using a well-documented file format basedon HDF5. https://github.com/statismo/statismo.
The following software tools were used for manual segmentation and manual correction of thesegmentation masks:
ITKSnap. The manual brushing tool was used to alter the manual segmentations30.http://www.itksnap.org/Used Version: 2.4
Seg3D. The manual brushing tool was used to alter the manual segmentations31.http://www.sci.utah.edu/cibc-software/seg3d.htmlUsed Version: 2.14
For general-purpose tasks, such as cropping and reformatting recommended open source softwareinclude Slicer3D (www.slicer.org)44 and MevisLab (www.mevislab.de)45.
Figure 4. Finite element mesh obtained for a single patient. Faces are cut for visualization purpose.
www.nature.com/sdata/
SCIENTIFIC DATA | 4:170132 | DOI: 10.1038/sdata.2017.132 7
Data RecordsAll data records described in this manuscript are available on the SICAS Medical Image Repository(www.smir.ch)46 (Data Citation 1 to Data Citation 112) organized in virtual folders, each describing thedata provenance and modality. Computed tomography three-dimensional files are stored using theDigital Imaging and Communications in Medicine image file format (DICOM, ISO 12052). A three-dimensional volume is physically stored as a stack of single sliced images. Data Citation 113 and DataCitation 114 correspond to the statistical shape models of the cochlear labyrinth (C-PDM) and thecochlear structure only (C-SDM), respectively.
Technical ValidationImage acquisitionμCT datasets were acquired using the two commercial μCT systems; μCT 50 and μCT 100, ScancoMedical AG, Brüttisellen, Switzerland. These systems are delivered with phantoms to calibrate and verifythe geometry and the density response of the systems.
To verify the geometry, a thin wire is measured and its volume is quantified. If the geometry changes,the volume gets out of a given range and the cross-section of the wire is no longer a circle. In this case, thegeometry has to be re-calibrated. This phantom has been measured monthly as recommended by themanufacturer. In this study, no geometry re-calibration was required.
To verify the density response of the μCT systems, a phantom including five cylinders with knowndensities in a range from 0 to 800 mgHA/ccm is measured. If the density response is altered, the valuesare out of a given range and the system has to be re-calibrated. Furthermore, the density of the cylinderscan be used to calibrate the grey levels to bone density values in the given range. This phantom has beenmeasured weekly as recommended by the manufacturer. In this study, no density re-calibration wasrequired.
The actual validation of each μCT image was done visually by an experienced user. Image quality waschecked for consistency, artifacts and image quality. Every single measurement was visually checked andif quality was considered not to be sufficient, the measurement has been repeated.
ID Data Citation Specimen Description Spatial Resolution (isotropic) Number of Scanned Volumes
CBCT Image Datasets
AL1 1–15 Petrous bone not implanted 150 μm 15
AL2 16–19 Petrous bone not implanted 300 μm 4
AL3 20–23 Petrous bone implanted 300 μm 4
BL1 24–30 Petrous bone implanted 150 μm 7
μCT Image Datasets
AH1 31–45 Petrous bone not implanted 7.6 μm 9
AH2 46–49 Petrous bone not implanted 7.6 μm 4
AH3 50–53 Petrous bone implanted 7.6 μm 4
BH1 54–60 Petrous bone implanted 18 μm 7
CH1 61–75 Petrous bone not implanted 16.3 μm 15
CH2 76–80 Petrous bone not implanted 19.5 μm 5
DH1 81 Cochlea not implanted 5.9 μm 1
DH2 82–83 Cochlea implanted 5.9 μm 2
DH3 84 Cochlea implanted 5.8 μm 1
DH4 85 Cochlea implanted 10.8 μm 2
AS1 86–90 Petrous bone Segmentation label 7.6 μm 5
CS1 91–103 Petrous bone Segmentation label 16.3 μm 13
CS2 104–107 Petrous bone Segmentation label 19.5 μm 4
DS1 108 Cochlea Segmentation label 5.9 μm 1
DS2 109 Cochlea Segmentation label 5.9 μm 1
DS3 110 Cochlea Segmentation label 5.8 μm 1
DS4 111–112 Cochlea Segmentation label 10.8 μm 2
Table 3. Summary of acquired image datasets The image dataset ID is composed of the provenance (letterA-D), low, high resolution or segmentation mask (L, H or S) and a set identification number.
www.nature.com/sdata/
SCIENTIFIC DATA | 4:170132 | DOI: 10.1038/sdata.2017.132 8

Data segmentationA neuroradiologist reviewed the segmentation datasets to account for anatomical malformations. Thefollowing image artefacts or anatomical malformations were observed in the datasets hindering thesegmentation process:
● Drilling trajectories appear on the datasets from collection B. These drillings come from experimentsperformed as part of a previous study on cochlear implantation8.
● Some areas show deviations from the normal anatomy, possibly caused by anatomical variations ordebris coming from the fixation process or subsequent robotic drilling.
● The round and oval window membranes are in most of the cases lost or partially lost in the images.Missing window membranes hinder the segmentation process due to loss of connectivity.
Usage NotesTo process the provided images, it is highly recommended to use medical image tools which handleconsistently the physical space and orientation of the images. We verified that all the used formats(DICOM, Nifti, Metaimage), the segmentations and the meshes can be loaded correctly with 3D Slicer(www.slicer.org)44.
The statistical shape model is an HDF5 file which respects Statismo format. It is possible to view themean shape and extract samples with the Statismo viewer or the Statismo CLI47. The deformation fieldscan be applied to the reference to obtain varying samples34. The later requires an integration betweenelastix and Statismo as available at https://github.com/tom-albrecht/statismo-elastix.
References1. Braun, K., Böhnke, F. & Stark, T. Three-dimensional representation of the human cochlea using micro-computed tomographydata: Presenting an anatomical model for further numerical calculations. Acta Otolaryngol. 132, 11 (2012).
2. Frijns, J. H., Briaire, J. J. & Grote, J. J. The importance of human cochlear anatomy for the results of modiolus-huggingmultichannel cochlear implants. Otol. Neurotol. 22, 340–349 (2001).
3. Verbist, B. M. et al. Consensus panel on a cochlear coordinate system applicable in histological, physiological and radiologicalstudies of the human cochlea. Otol Neurotol 31, 722–730 (2010).
4. Wilson, B. S. & Dorman, M. F. Cochlear implants: a remarkable past and a brilliant future. Hear. Res. 242, 3–21 (2008).5. Bekesy, G. Direct observation of the vibrations of the cochlear partition under a microscope. Acta Otolaryngol. 42,197–201 (1952).
6. Greenwood, D. D. A cochlear frequency-position function for several species--29 years later. J. Acoust. Soc. Am. 87,2592–2605 (1990).
7. Stakhovskaya, O., Sridhar, D., Bonham, B. H. & Leake, P. A. Frequency map for the human cochlear spiral ganglion: implicationsfor cochlear implants. J. Assoc. Res. Otolaryngol 8, 220–233 (2007).
8. Bell, B. et al. In Vitro Accuracy Evaluation of Image-Guided Robot System for Direct Cochlear Access. Otol. Neurotol. 34,1284–1290 (2013).
9. Ceresa, M. et al. Patient-specific simulation of implant placement and function for cochlear implantation surgery planning. inLecture Notes in Computer Science (including subseries Lecture Notes in Artificial Intelligence and Lecture Notes in Bioinformatics)8674 LNCS, 49–56 (2014).
10. Balachandran, R. et al. Clinical testing of an alternate method of inserting bone-implanted fiducial markers. Int. J. Comput. Assist.Radiol. Surg 9, 913–920 (2014).
11. Meshik, X., Holden, T. a., Chole, R. A. & Hullar, T. E. Optimal cochlear implant insertion vectors. Otol. Neurotol. 31,58–63 (2010).
12. Wimmer, W. et al. Cone beam and micro-computed tomography validation of manual array insertion for minimally invasivecochlear implantation. Audiol. Neurootol 19, 22–30 (2014).
13. Briaire, J. J. & Frijns, J. H. M. Field patterns in a 3D tapered spiral model of the electrically stimulated cochlea. Hear. Res. 148,18–30 (2000).
14. Kalkman, R. K., Briaire, J. J., Dekker, D. M. T. & Frijns, J. H. M. Place pitch versus electrode location in a realistic computationalmodel of the implanted human cochlea. Hear. Res. 315, 10–24 (2014).
15. Malherbe, T. K., Hanekom, T. & Hanekom, J. J. Can subject-specific single-fibre electrically evoked auditory brainstem responsedata be predicted from a model? Med. Eng. Phys. 35, 926–936 (2012).
16. Erixon, E. & Rask-Andersen, H. How to predict cochlear length before cochlear implantation surgery. Acta Otolaryngol. 133,1258–1265 (2013).
17. Escudé, B. et al. The size of the cochlea and predictions of insertion depth angles for cochlear implant electrodes. Audiol.Neurootol 11(Suppl 1): 27–33 (2006).
18. Wimmer, W. et al. In-vitro microCT validation of preoperative cochlear duct length estimation. in CURAC 143–146 (2013).19. Wimmer, W. et al. in 13th International Conference on Cochlear Implants 704 (2014).20. Avci, E., Nauwelaers, T., Lenarz, T., Hamacher, V. & Kral, A. Variations in microanatomy of the human cochlea. J. Comp. Neurol.
522, 3245–3261 (2014).21. Poznyakovskiy, A. A. et al. The creation of geometric three-dimensional models of the inner ear based on micro computer
tomography data. Hear. Res. 243, 95–104 (2008).22. Teymouri, J., Hullar, T. E., Holden, T. A. & Chole, R. A. Verification of computed tomographic estimates of cochlear implant
array position: a micro-CT and histologic analysis. Otol. Neurotol. 32, 980–986 (2011).23. Verbist, B. M. et al. Anatomic considerations of cochlear morphology and its implications for insertion trauma in cochlear
implant surgery. Otol. Neurotol. 30, 471–477 (2009).24. Noble, J. H. et al. Statistical Shape Model Segmentation and Frequency Mapping of Cochlear Implant Stimulation Targets in CT.
Med Image Comput Comput Assist Interv 15, 421–428 (2012).25. World Medical Association. Declaration of Helsinki: ethical principles for medical research involving human subjects. JAMA 310,
2191–2194 (2013).26. Thiel, W. The preservation of the whole corpse with natural color. [Die Konservierung ganzer Leichen in natürlichen Farben.].
Ann Anat 174, 185–195 (1992).
www.nature.com/sdata/
SCIENTIFIC DATA | 4:170132 | DOI: 10.1038/sdata.2017.132 9

27. Alberty, J. & Zenner, H. P. Thiel method fixed cadaver ears. A new procedure for graduate and continuing education in middleear surgery. [Nach Thiel fixierte Leichenohren. Ein neues Verfahren für die Aus- und Weiterbildung in der Mittelohrchirurgie.].HNO 50, 739–742 (2002).
28. Stark, T., Braun, K., Helbig, S., Bas, M. & Boehnke, F. 3D Representation of the Human Cochlea with FLEX EAS Electrodes. Int.Adv. Otol 49, 123–129 (2012).
29. Lorensen, W. E. & Cline, H. E. Marching Cubes: A High Resolution 3D Surface Construction Algorithm. Comput. Graph. (ACM)21, 163–169 (1987).
30. Yushkevich, P. A. et al. User-guided 3D active contour segmentation of anatomical structures: Significantly improved efficiencyand reliability. Neuroimage 31, 1116–1128 (2006).
31. Frangi, A. F., Rueckert, D., Schnabel, J. A. & Niessen, W. J. Automatic construction of multiple-object three-dimensionalstatistical shape models: Application to cardiac modeling. IEEE Trans. Med. Imaging 21, 1151–1166 (2002).
32. Cootes, T. F., Taylor, C. J., Cooper, D. H. & Graham, J. Active Shape Models—Their Training and Application. Comput. Vis.Image Underst 61, 38–59 (1995).
33. Kjer, H. M. et al. Free-form image registration of human cochlear μCT data using skeleton similarity as anatomical prior. PatternRecognit. Lett 76, 76–82 (2016).
34. Klein, S., Staring, M., Murphy, K., Viergever, M. A. & Pluim, J. P. W. elastix: a toolbox for intensity-based medical imageregistration. IEEE Trans. Med. Imaging 29, 196–205 (2010).
35. Luethi, M. & Blanc, R. Statismo—Framework for building Statistical Image And Shape Models. The Insight Journal 1,1–18 (2012).
36. Duchateau, N. et al. in 2015 IEEE 12th International Symposium on Biomedical Imaging (ISBI) 1398–1401 (IEEE, 2015).37. Mangado, N. et al. Automatic Model Generation Framework for Computational Simulation of Cochlear Implantation. Ann.
Biomed. Eng. 44, 2453–2463 (2016).38. Allard, J. et al. SOFA--an open source framework for medical simulation. Stud. Health Technol. Inform. 125, 13–18 (2007).39. Lim, Y. S., Park, S.-I., Kim, Y. H., Oh, S. H. & Kim, S. J. Three-dimensional analysis of electrode behavior in a human
cochlear model. Med. Eng. Phys. 27, 695–703 (2005).40. Mangado, N. et al. Patient-specific virtual insertion of electrode array for electrical simulation of cochlear implants. in Computer
Assisted Radiology and Surgery (CARS) S102–S103 (2015).41. Ceresa, M., Mangado, N., Andrews, R. J. & Gonzalez Ballester, M. A. Computational Models for Predicting Outcomes of
Neuroprosthesis Implantation: the Case of Cochlear Implants. Mol. Neurobiol. 52, 934–941 (2015).42. Geuzaine, C. & Remacle, J.-F. Gmsh: A 3-D finite element mesh generator with built-in pre- and post-processing facilities. Int. J.
Numer. Methods Eng 79, 1309–1331 (2009).43. Lüthi, M. et al. Statismo-A framework for PCA based statistical models. Insight J 1, 1–18 (2012).44. Fedorov, A. et al. 3D Slicer as an image computing platform for the Quantitative Imaging Network. Magn. Reson. Imaging 30,
1323–1341 (2012).45. Ritter, F. et al. Medical image analysis. IEEE Pulse 2, 60–70 (2011).46. Kistler, M., Bonaretti, S., Pfahrer, M., Niklaus, R. & Büchler, P. The virtual skeleton database: an open access repository for
biomedical research and collaboration. J. Med. Internet Res. 15, e245 (2013).47. Lüthi, M. et al. Statismo-A framework for PCA based statistical models. The Insight Journal 1, 1–18 (2012).
Data Citations1. SICAS Medical Image Repository https://doi.org/10.22016/smir.o.121756 (2017).2. SICAS Medical Image Repository https://doi.org/10.22016/smir.o.121755 (2017).3. SICAS Medical Image Repository https://doi.org/10.22016/smir.o.121754 (2017).4. SICAS Medical Image Repository https://doi.org/10.22016/smir.o.121753 (2017).5. SICAS Medical Image Repository https://doi.org/10.22016/smir.o.121752 (2017).6. SICAS Medical Image Repository https://doi.org/10.22016/smir.o.121751 (2017).7. SICAS Medical Image Repository https://doi.org/10.22016/smir.o.121750 (2017).8. SICAS Medical Image Repository https://doi.org/10.22016/smir.o.121749 (2017).9. SICAS Medical Image Repository https://doi.org/10.22016/smir.o.121748 (2017).
10. SICAS Medical Image Repository https://doi.org/10.22016/smir.o.121747 (2017).11. SICAS Medical Image Repository https://doi.org/10.22016/smir.o.121697 (2017).12. SICAS Medical Image Repository https://doi.org/10.22016/smir.o.121695 (2017).13. SICAS Medical Image Repository https://doi.org/10.22016/smir.o.121693 (2017).14. SICAS Medical Image Repository https://doi.org/10.22016/smir.o.121691 (2017).15. SICAS Medical Image Repository https://doi.org/10.22016/smir.o.121689 (2017).16. SICAS Medical Image Repository https://doi.org/10.22016/smir.o.75021 (2017).17. SICAS Medical Image Repository https://doi.org/10.22016/smir.o.75020 (2017).18. SICAS Medical Image Repository https://doi.org/10.22016/smir.o.75019 (2017).19. SICAS Medical Image Repository https://doi.org/10.22016/smir.o.75018 (2017).20. SICAS Medical Image Repository https://doi.org/10.22016/smir.o.83082 (2017).21. SICAS Medical Image Repository https://doi.org/10.22016/smir.o.83081 (2017).22. SICAS Medical Image Repository https://doi.org/10.22016/smir.o.83080 (2017).23. SICAS Medical Image Repository https://doi.org/10.22016/smir.o.83079 (2017).24. SICAS Medical Image Repository https://doi.org/10.22016/smir.o.74034 (2017).25. SICAS Medical Image Repository https://doi.org/10.22016/smir.o.74032 (2017).26. SICAS Medical Image Repository https://doi.org/10.22016/smir.o.73964 (2017).27. SICAS Medical Image Repository https://doi.org/10.22016/smir.o.73962 (2017).28. SICAS Medical Image Repository https://doi.org/10.22016/smir.o.73960 (2017).29. SICAS Medical Image Repository https://doi.org/10.22016/smir.o.73936 (2017).30. SICAS Medical Image Repository https://doi.org/10.22016/smir.o.73934 (2017).31. SICAS Medical Image Repository https://doi.org/10.22016/smir.o.14129 (2017).32. SICAS Medical Image Repository https://doi.org/10.22016/smir.o.14128 (2017).33. SICAS Medical Image Repository https://doi.org/10.22016/smir.o.14123 (2017).34. SICAS Medical Image Repository https://doi.org/10.22016/smir.o.14114 (2017).35. SICAS Medical Image Repository https://doi.org/10.22016/smir.o.14109 (2017).36. SICAS Medical Image Repository https://doi.org/10.22016/smir.o.14106 (2017).37. SICAS Medical Image Repository https://doi.org/10.22016/smir.o.14097 (2017).38. SICAS Medical Image Repository https://doi.org/10.22016/smir.o.14094 (2017).39. SICAS Medical Image Repository https://doi.org/10.22016/smir.o.14001 (2017).
www.nature.com/sdata/
SCIENTIFIC DATA | 4:170132 | DOI: 10.1038/sdata.2017.132 10

40. SICAS Medical Image Repository https://doi.org/10.22016/smir.o.13603 (2017).41. SICAS Medical Image Repository https://doi.org/10.22016/smir.o.12307 (2017).42. SICAS Medical Image Repository https://doi.org/10.22016/smir.o.12096 (2017).43. SICAS Medical Image Repository https://doi.org/10.22016/smir.o.12091 (2017).44. SICAS Medical Image Repository https://doi.org/10.22016/smir.o.12079 (2017).45. SICAS Medical Image Repository https://doi.org/10.22016/smir.o.11688 (2017).46. SICAS Medical Image Repository https://doi.org/10.22016/smir.o.122573 (2017).47. SICAS Medical Image Repository https://doi.org/10.22016/smir.o.122572 (2017).48. SICAS Medical Image Repository https://doi.org/10.22016/smir.o.122571 (2017).49. SICAS Medical Image Repository https://doi.org/10.22016/smir.o.122570 (2017).50. SICAS Medical Image Repository https://doi.org/10.22016/smir.o.122217 (2017).51. SICAS Medical Image Repository https://doi.org/10.22016/smir.o.94571 (2017).52. SICAS Medical Image Repository https://doi.org/10.22016/smir.o.94554 (2017).53. SICAS Medical Image Repository https://doi.org/10.22016/smir.o.94097 (2017).54. SICAS Medical Image Repository https://doi.org/10.22016/smir.o.74035 (2017).55. SICAS Medical Image Repository https://doi.org/10.22016/smir.o.74030 (2017).56. SICAS Medical Image Repository https://doi.org/10.22016/smir.o.74029 (2017).57. SICAS Medical Image Repository https://doi.org/10.22016/smir.o.74028 (2017).58. SICAS Medical Image Repository https://doi.org/10.22016/smir.o.74027 (2017).59. SICAS Medical Image Repository https://doi.org/10.22016/smir.o.73958 (2017).60. SICAS Medical Image Repository https://doi.org/10.22016/smir.o.73937 (2017).61. SICAS Medical Image Repository https://doi.org/10.22016/smir.o.13832 (2017).62. SICAS Medical Image Repository https://doi.org/10.22016/smir.o.13733 (2017).63. SICAS Medical Image Repository https://doi.org/10.22016/smir.o.12085 (2017).64. SICAS Medical Image Repository https://doi.org/10.22016/smir.o.12084 (2017).65. SICAS Medical Image Repository https://doi.org/10.22016/smir.o.12083 (2017).66. SICAS Medical Image Repository https://doi.org/10.22016/smir.o.12082 (2017).67. SICAS Medical Image Repository https://doi.org/10.22016/smir.o.12081 (2017).68. SICAS Medical Image Repository https://doi.org/10.22016/smir.o.12080 (2017).69. SICAS Medical Image Repository https://doi.org/10.22016/smir.o.11708 (2017).70. SICAS Medical Image Repository https://doi.org/10.22016/smir.o.11683 (2017).71. SICAS Medical Image Repository https://doi.org/10.22016/smir.o.11682 (2017).72. SICAS Medical Image Repository https://doi.org/10.22016/smir.o.11681 (2017).73. SICAS Medical Image Repository https://doi.org/10.22016/smir.o.11680 (2017).74. SICAS Medical Image Repository https://doi.org/10.22016/smir.o.11679 (2017).75. SICAS Medical Image Repository https://doi.org/10.22016/smir.o.11669 (2017).76. SICAS Medical Image Repository https://doi.org/10.22016/smir.o.12090 (2017).77. SICAS Medical Image Repository https://doi.org/10.22016/smir.o.12089 (2017).78. SICAS Medical Image Repository https://doi.org/10.22016/smir.o.12088 (2017).79. SICAS Medical Image Repository https://doi.org/10.22016/smir.o.12087 (2017).80. SICAS Medical Image Repository https://doi.org/10.22016/smir.o.12086 (2017).81. SICAS Medical Image Repository https://doi.org/10.22016/smir.o.29498 (2017).82. SICAS Medical Image Repository https://doi.org/10.22016/smir.o.89045 (2017).83. SICAS Medical Image Repository https://doi.org/10.22016/smir.o.122263 (2017).84. SICAS Medical Image Repository https://doi.org/10.22016/smir.o.124191 (2017).85. SICAS Medical Image Repository https://doi.org/10.22016/smir.o.122291 (2017).86. SICAS Medical Image Repository https://doi.org/10.22016/smir.o.124077 (2017).87. SICAS Medical Image Repository https://doi.org/10.22016/smir.o.122294 (2017).88. SICAS Medical Image Repository https://doi.org/10.22016/smir.o.122293 (2017).89. SICAS Medical Image Repository https://doi.org/10.22016/smir.o.80593 (2017).90. SICAS Medical Image Repository https://doi.org/10.22016/smir.o.80591 (2017).91. SICAS Medical Image Repository https://doi.org/10.22016/smir.o.123996 (2017).92. SICAS Medical Image Repository https://doi.org/10.22016/smir.o.79073 (2017).93. SICAS Medical Image Repository https://doi.org/10.22016/smir.o.78643 (2017).94. SICAS Medical Image Repository https://doi.org/10.22016/smir.o.78641 (2017).95. SICAS Medical Image Repository https://doi.org/10.22016/smir.o.78639 (2017).96. SICAS Medical Image Repository https://doi.org/10.22016/smir.o.78633 (2017).97. SICAS Medical Image Repository https://doi.org/10.22016/smir.o.78629 (2017).98. SICAS Medical Image Repository https://doi.org/10.22016/smir.o.78627 (2017).99. SICAS Medical Image Repository https://doi.org/10.22016/smir.o.78625 (2017).
100. SICAS Medical Image Repository https://doi.org/10.22016/smir.o.78621 (2017).101. SICAS Medical Image Repository https://doi.org/10.22016/smir.o.78615 (2017).102. SICAS Medical Image Repository https://doi.org/10.22016/smir.o.78613 (2017).103. SICAS Medical Image Repository https://doi.org/10.22016/smir.o.78611 (2017).104. SICAS Medical Image Repository https://doi.org/10.22016/smir.o.79075 (2017).105. SICAS Medical Image Repository https://doi.org/10.22016/smir.o.78645 (2017).106. SICAS Medical Image Repository https://doi.org/10.22016/smir.o.78635 (2017).107. SICAS Medical Image Repository https://doi.org/10.22016/smir.o.78631 (2017).108. SICAS Medical Image Repository https://doi.org/10.22016/smir.o.29503 (2017).109. SICAS Medical Image Repository https://doi.org/10.22016/smir.o.124193 (2017).110. SICAS Medical Image Repository https://doi.org/10.22016/smir.o.122260 (2017).111. SICAS Medical Image Repository https://doi.org/10.22016/smir.o.122259 (2017).112. SICAS Medical Image Repository https://doi.org/10.22016/smir.o.122292 (2017).113. SICAS Medical Image Repository https://doi.org/10.22016/smir.o.207472 (2017).114. SICAS Medical Image Repository https://doi.org/10.22016/smir.o.207473 (2017).
www.nature.com/sdata/
SCIENTIFIC DATA | 4:170132 | DOI: 10.1038/sdata.2017.132 11

AcknowledgementsWe would like to thank the Institute of Anatomy from the University of Bern, Switzerland for providingsamples used in this data descriptor. We thank the neuroradiologist, Dr Christian Weisstanner from theInstitute of Diagnostic and Interventional Neuroradiology, Inselspital, University Hospital of Bern,Switzerland, for his expertise in image analysis. We thank the SICAS Medical Image Repository team fortheir support. This work was financially supported by the European Commission FP7 (HEAR-EUEuropean project #304857 http://www.hear-eu.eu) and the Swiss National Science Foundation (Nano-Tera initiative project title Hear-Restore). In addition, this work is partly supported by the SpanishMinistry of Economy and Competitiveness under the Maria de Maeztu Units of Excellence Programme(MDM-2015-0502). Cochlear electrode arrays were supplied by the Med-El Corporation, Innsbruck,Austria. Prof. Mauricio Reyes has full access to all the data in the study and takes responsibility for theintegrity of the data and the accuracy of the data analysis.
Author ContributionsN.G. prepared specimens, acquired image data, corrected segmentation masks, wrote the manuscript. M.R. surveyed the study, wrote the manuscript. L.B. segmented the data, wrote the manuscript. H.M.K.segmented data, prepared S.S.M., edited manuscript. S.V. segmented data, prepared S.S.M., preparedinsertion model, edited manuscript. M.S. acquired image data, edited manuscript. P.M. surveyed study,edited manuscript. M.Ce. prepared F.E.M., edited manuscript. N.M.L. prepared F.E.M., editedmanuscript. W.W. prepared specimens, edited manuscript. T.S. provided data, edited manuscript. R.P.surveyed study, edited manuscript. S.W. surveyed study, edited manuscript. M.Ca. surveyed study, editedmanuscript. M.G.B. surveyed study, edited manuscript.
Additional InformationCompeting interests: Scanco Medical AG has used its own scanners μCT 50 and μCT 100 for theacquisition of the μCT data.
How to cite this article: Gerber, N. et al. A multiscale imaging and modelling dataset of the human innerear. Sci. Data 4:170132 doi: 10.1038/sdata.2017.132 (2017).
Publisher’s note: Springer Nature remains neutral with regard to jurisdictional claims in published mapsand institutional affiliations.
Open Access This article is licensed under a Creative Commons Attribution 4.0 Interna-tional License, which permits use, sharing, adaptation, distribution and reproduction in any
medium or format, as long as you give appropriate credit to the original author(s) and the source, provide alink to the Creative Commons license, and indicate if changes were made. The images or other third partymaterial in this article are included in the article’s Creative Commons license, unless indicated otherwise ina credit line to the material. If material is not included in the article’s Creative Commons license and yourintended use is not permitted by statutory regulation or exceeds the permitted use, you will need to obtainpermission directly from the copyright holder. To view a copy of this license, visit http://creativecommons.org/licenses/by/4.0/
The Creative Commons Public Domain Dedication waiver http://creativecommons.org/publicdomain/zero/1.0/ applies to the metadata files made available in this article.
© The Author(s) 2017
www.nature.com/sdata/
SCIENTIFIC DATA | 4:170132 | DOI: 10.1038/sdata.2017.132 12