data development for astm e24.06.02 round robin … · data development for astm e24.06.02 round...
TRANSCRIPT
NASA Contractor Report 1590
103J ~
· 1~~II\I~JII~~~~~m~~UI i •NASA-CR-159103
Data Development for ASTM E24.06.02Round Robin Program on InstabilityPrediction
D.E. McCabe
Westinghouse R&D Center1310 Beulah RoadPittsburgh, PA 15235
CONTRACT NASI-15461August 1979
NI\S/\National Aeronautics andSpace Administration
Langley Research CenterHampton, Virginia 23665AC 804 827-3966
......
LIBRARV COpys:. P o~ 0 19/9
IlANGLEY RESEARCH CENTERLIBRARY. NASA
HAMPTON, VIRGINIA
https://ntrs.nasa.gov/search.jsp?R=19790022183 2018-09-04T03:09:12+00:00Z

NASA Contractor Report 159103
Data Development for ASTM E24.06.02Round Robin Program on InstabilityPrediction
D.E. McCabe
Westinghouse R&D Center1310 Beulah RoadPittsburgh, PA 15235
CONTRACT NASI-15461August 1919
NI\S/\National Aeronautics andSpace Administration
Langley Research CenterHampton, Virginia 23665AC 804 827-3966


DATA DEVELOPMENT FOR ASTM E24.06.02 ROUND ROBINPROGRAM ON INSTABILITY PREDICTION
D. E. McCabeStructural Behavior of Materials Department
ABSTRACT
The principal objective of this project was to develop basis
data for use in an ASTM E24.06.02 task gro~p round robin activity.
Compact specimens were made of 2024-T35l, V075-T65l aluminum alloys,
and 304 stainless steel. All were 12.7 mm thick and planar dimension
variables incorporated were for lT, 2T and 4T sizes. Representative
raw data for each material and specimen size are contained herein. R
curves plotted in terms of 6a physical and 6a effective are 'p1otted for
each material.
i

BACKGROUND
This report represents a presentation of data generated on
three materials representing brittle, intermediate, and ductile
toughness behavior. The compact specimem,geometry was used with three
planar dimension sizes of IT, 2T, and 4T, but with thickness nominally
constant at 12.7 mm. Displacement was measured at three locations
along the crack plane at Vo ' VLL , and V2 locations indicated in Figure 1.
Two x-y recorders were used. One was a two pen type that plotted V ando
VLL
displacement against applied load. A second recorder plotted Vo
displacement versus V2 displacement, (Double Compliance). All
specimens were periodically partially unloaded to obtain unloading
slopes which are used to measure slow-stable crack advance, ba physical.
In addition, the crack growth was followed to the nearest 1.3 mm by
observation on the specimen surfaces. Such optical measurements are
highly imprecise, especially with plastic zone interference and crack
tunneling tendancies.
TYPICAL DATA SETS
In all, 27 specimens were tested and TAbles I through IX
represent the typical basic data for each set of three replicates.
The specimen code is as follows:
Code (Material) Plate /I Code - Size
AC (2024) 2 I = 4T
Be (7075) 5 2 = 2T
SC (304 SS) 8 3 or 5 = IT
Example; AC5-2 = 2024 AI, Plate /15, 2T specimen.
I
The data listed are for each unloading point on the test
records and the corresponding effective crack aspect ratios, ae/W,
(with plastic zone correction),and physical crack aspect ratios, a /W,p(from unloading slopes) are given. The determinations are made for V
oand VLL using single eompliance and V
o/V2 for double compliance. Crack
growth resistance, ~, is calculated using ae/w. This will be acceptable
and will give ~ values equivalent to J except for 304 stainless on data
points generated at nominal stress greater than 2 times material yield
strength. Supplementary information includes initial crack aspect
ratio, a /W, specimen thickness, B , loading rate, P, and elastic modulio 0
indicated from the initial linear elastic part of the load-displacement
record.
SUMMARY DATA
Tables X through XII sunnnarize the maximum load data from all
specimens. Values of initial dimensions, maximum load, and displacements
at first attainment of maximum load are given.- Do not look for an
exact matchup point for these data with values reported in Tables I
through IX, because the latter are at each unloading point which may
or may not coincide with maximum load. Two of 27 specimens were lost
to the unknowns in equipment setup.
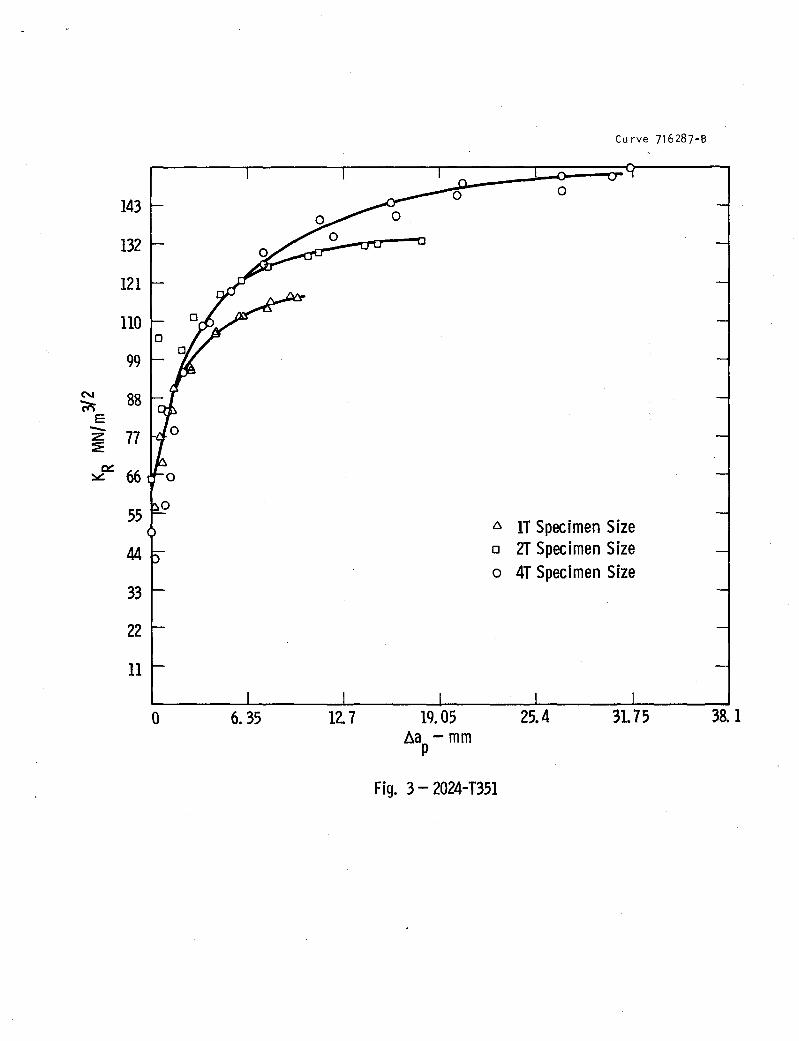
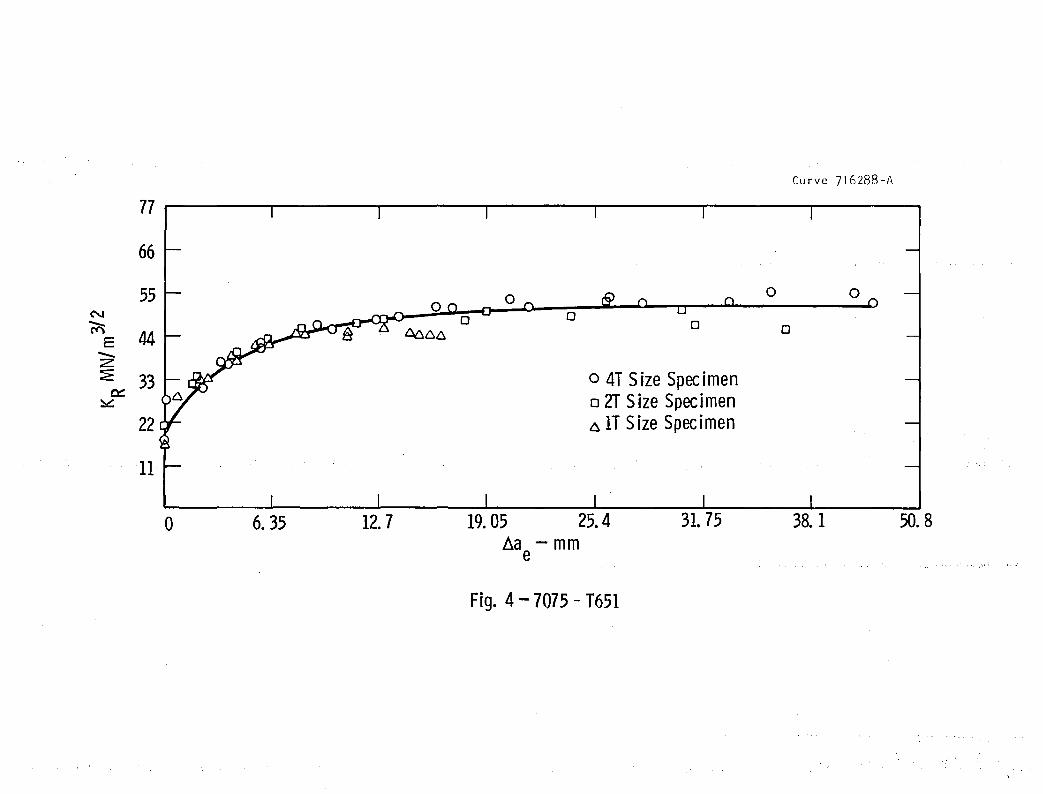
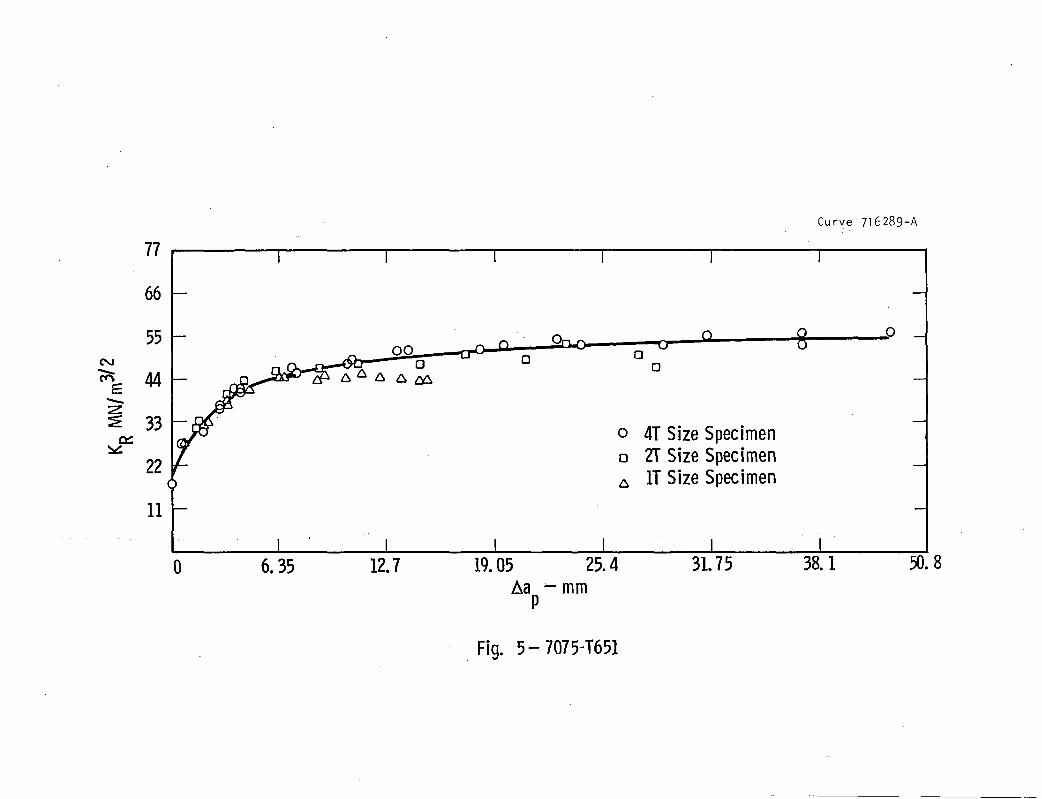
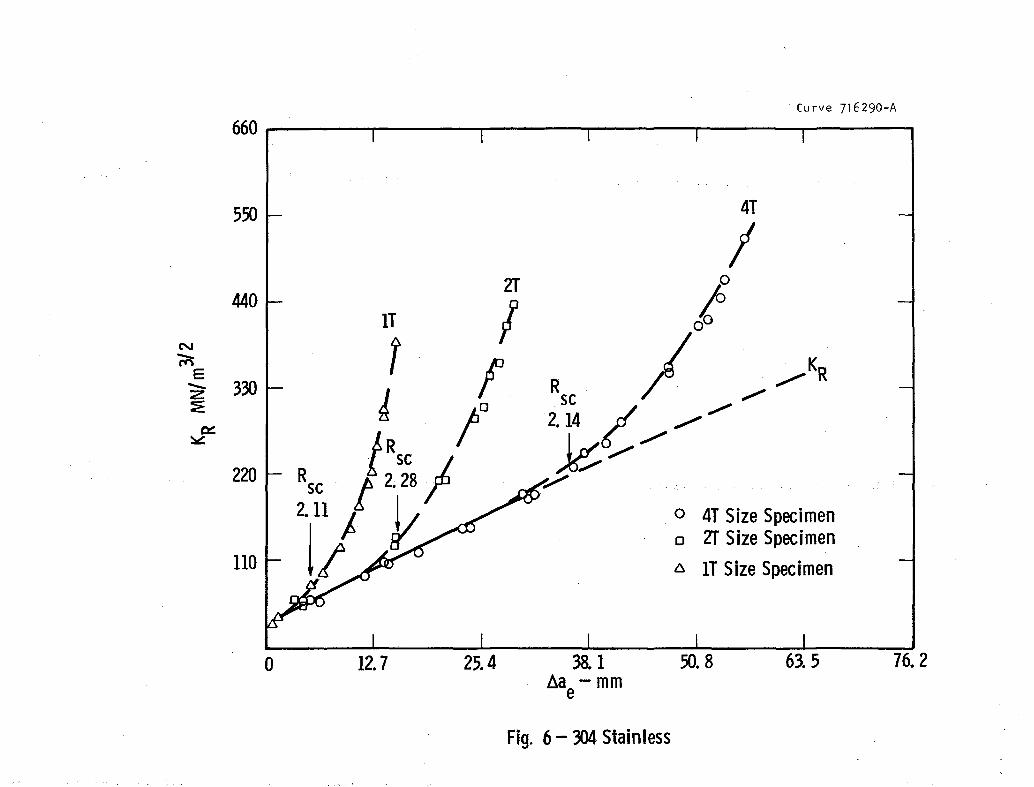
R-CURVES
Figures 2 through 7 are R-curves for the three materials with
data points for three specimen sizes superimposed. Physical crack
growth is from unloading compliance for the two aluminum alloys. This
was justified by a better than 5% correlation to surface measured crack
size (visual). The unloading compliance on the stainless steel had
equal precision and testing technique applied but the comparison to visual
was unacceptable. Therefore the ~a plot is made in terms of opticalp
~ap values which are considerably less than precise as noted before.
2

FATIGUE PRECRACKING
The fatigue precracking data are given in Table XIII along
with the initial crack size measured at five locations across the crack
front.
S=:)(.~~ /lo/c 6?&_-Principal Investigator:D. E. McCabe
3
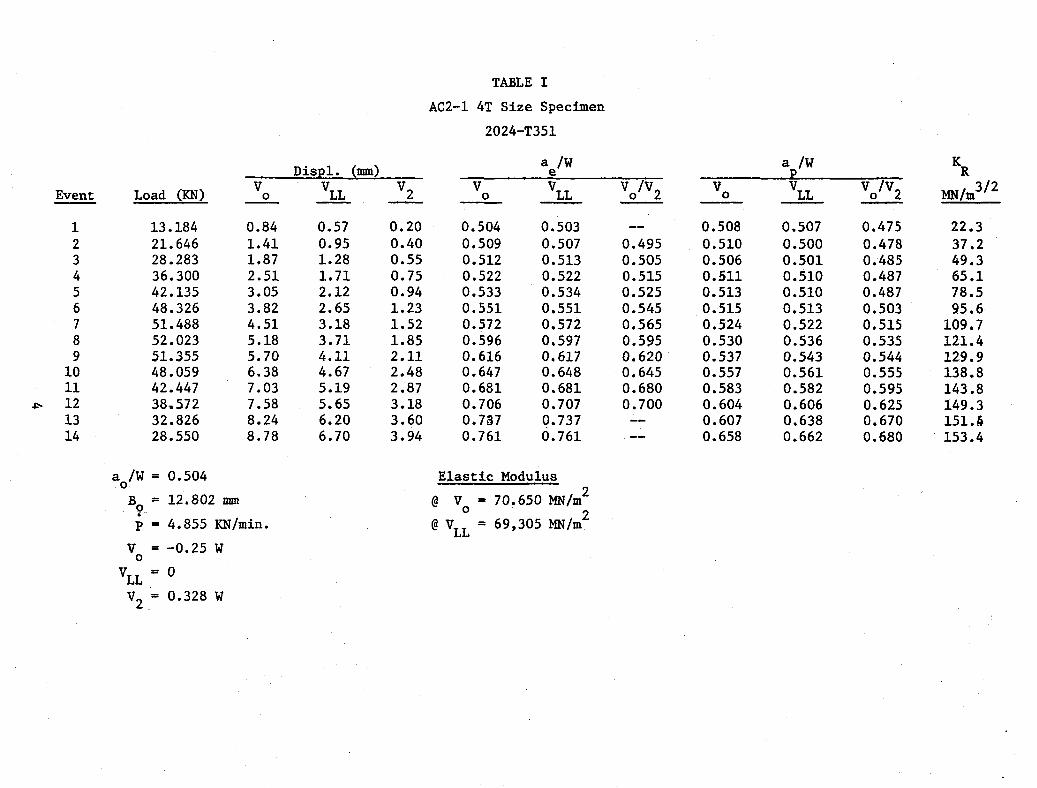
TABLE I
AC2-1 4T Size Specimen
2024-T351
Disp1. (mm) a /W a /W Ke p R
Event Load (KN) V VLLV2 V V
LLVo/V2 V V
LL Vo/V2 MN/m3/ 20 0 0
1 13.184 0.84 0.57 0.20 0.504 0.503 0.508 0.507 0.475 22.32 21.646 1.41 0.95 0.40 0.509 0.507 0.495 0.510 0.500 0.478 37.23 28.283 1.87 1.28 0.55 0.512 0.513 0.505 0.506 0.501 0.485 49.34 36.300 2.51 1.71 0.75 0.522 0.522 0.515 0.511 0.510 0.487 65.15 42.135 3.05 2.12 0.94 0.533 0.534 0.525 0.513 0.510 0.487 78.56 48.326 3.82 2.65 1.23 0.551 0.551 0.545 0.515 0.513 0.503 95.67 51. 488 4.51 3.18 1.52 0.572 0.572 0.565 0.524 0.522 0.515 109.78 52.023 5.18 3.71 1.85 0.596 0.597 0.595 0.530 0.536 0.535 121.49 51.355 5.70 4.11 2.11 0.616 0.617 0.620 0.537 0.543 0.544 129.9
10 48.059 6.38 4.67 2.48 0.647 0.648 0.645 0.557 0.561 0.555 138.811 42.447 7.03 5.19 2.87 0.681 0.681 0.680 0.583 0.582 0.595 143.8
.f:'o 12 38,572 7.58 5.65 3.18 0.706 0.707 0.700 0.604 0.606 0.625 149.313 32.826 8.24 6.20 3.60 0.737 0.737 0.607 0.638 0.670 151.614 28.550 8.78 6.70 3.94 0.761 0.761 0.658 0.662 0.680 153.4
a /W = 0.504 Elastic Modulus0 2B
Q= 12.802 mm @ V = 70.650 MN/m. o 2
P = 4.855 KN/min. @VLL = 69,305 MN/m
V = -0.25 W0
VLL .= 0V2 _= 0.328 W
~ a /W = 0.512o
B = 12.522 mmop= 12.471 (KN)/min.
V = -0.25 Wo
V' = 0LLV2 = 0.303 W
Event
12
.3456789
Disp1. (mm)
Load (KN)V V V
_0_ ...b1.... -.2...
8.231 0.56 0.39 0.1815.923 1.14 0.76 0.3623.223 1.85 1.23 0.6227.339 2.53 1. 75 0.9128.759 3.18 2.24 1.2225.918 3.99 2.90 1.6821.802 4.64 3.45 2.0818.373 5.11 3.87 2.3914.698 5.72 4.36 2.75
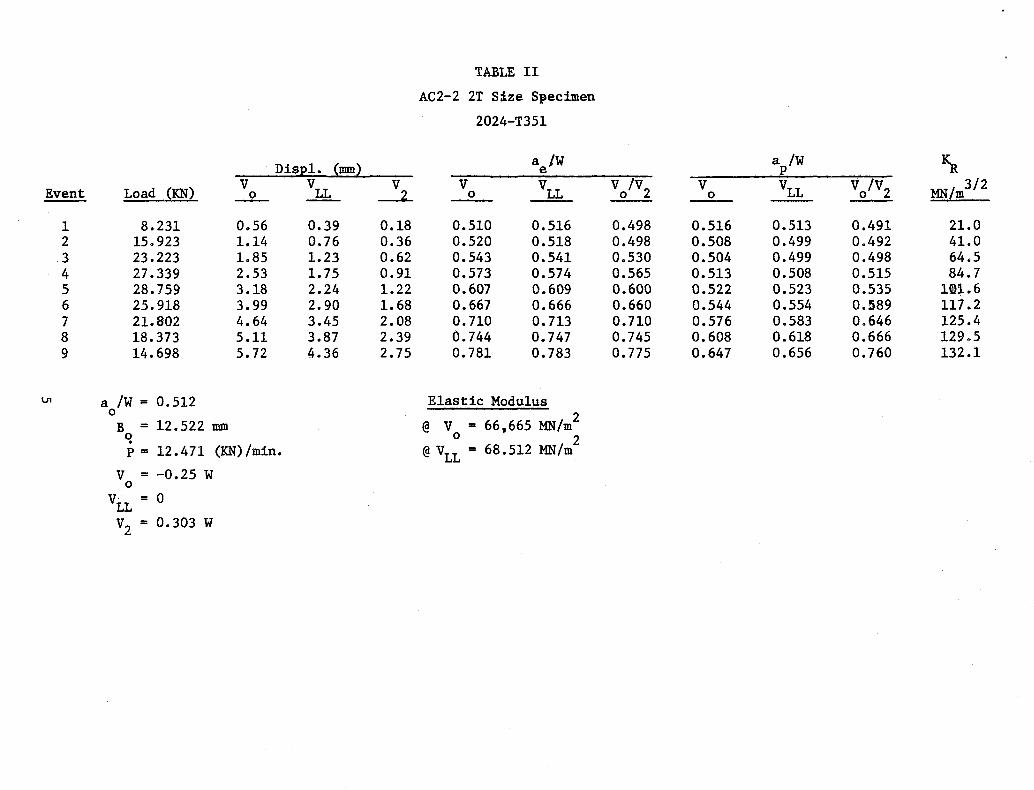
TABLE II
AC2-2 2T S~ze Specimen
2024-T351
a Iw a /W ~e pV V
LL V/V2 V VLL V/V2 MN/m3/ 20 0
0.510 0.516 0.498 0.516 0.513 0.491 21.00.520 0.518 0.498 0.508 0.499 0.492 41.00.543 0.541 0.530 0.504 0.499 0.498 64.50.573 0.574 0.565 0.513 0.508 0.515 84.70.607 0.609 0.600 0.522 0.523 0.535 lID1.60.667 0.666 0.660 0.544 0.554 0.589 117.20.710 0.713 0.710 0.576 0.583 0.646 125.40.744 0.747 0.745 0.608 0.618 0.666 129.50.781 0.783 0.775 0.647 0.656 0.760 132.1
Elastic Modulus
@ V = 66,665 MN/m2o 2
@VLL = 68.512 MN/m
a /W = 0.522oBo = 12.548 mm
~ = 32.07 KN/min.
V = -0.25 WoVLL = 0
V2 = 0.303 W
Event
123456789
Load (KN)
6.21811.44213.98114.77413.80712.58710.6238.2586.218
vo
0.420.831.241.632.212.472.923.343.86
Disp1. (mm)V
LL
0.280.590.871.171.521.832.202.532.97
0.130.280.440.640.881.091.341.611.91
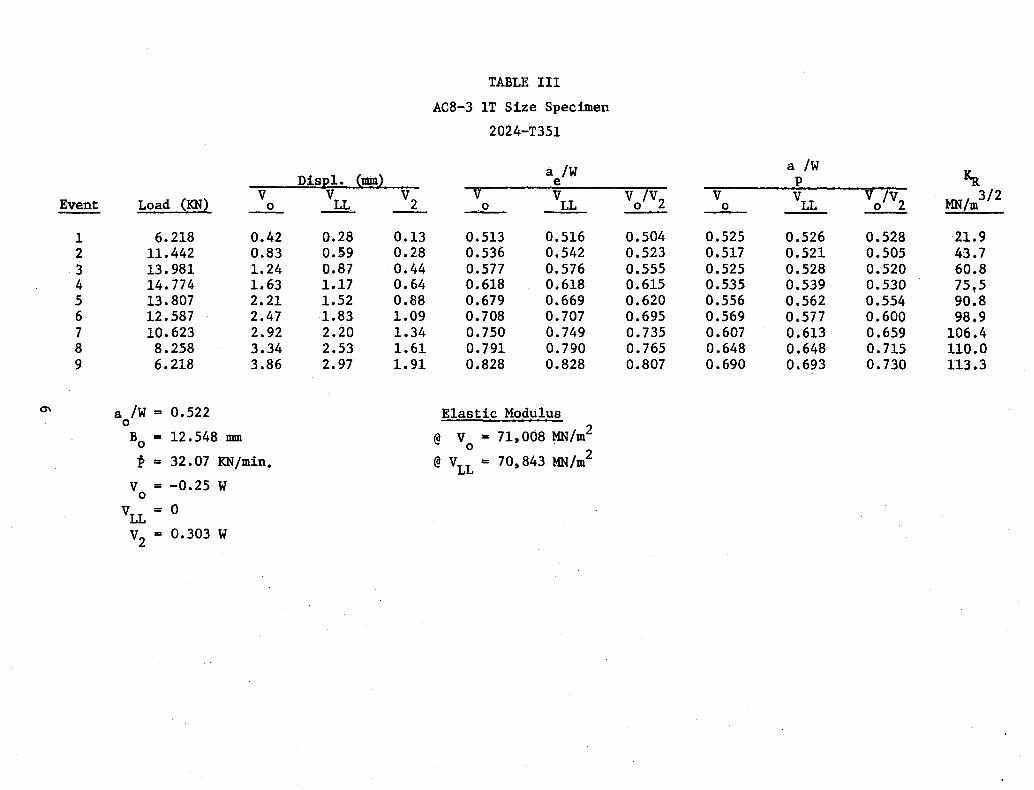
TABLE III
AC8-3 IT Size Specimen
2024-T351
a /W a /WKae p
V V Vo!V2 V VLLV
o/V
2 MN/m3/ 20 LL 0
0.513 0.516 0.504 0.525 0.526 0.528 21.90.536 0.542 0.523 0.517 0.521 0.505 43.70.577 0.576 0.555 0.525 0.528 0.520 60.80.618 0.618 0.615 0.535 0.539 0.530 75 t 50.679 0.669 0.620 0.556 0.562 0.554 90.80.708 0.707 0.695 0.569 0.577 0.600 98.90.750 0.749 0.735 0.607 0.613 0.659 106.40.791 0.790 0.765 0.648 0.648 0.715 110.00.828 0.828 0.807 0.690 0.693 0.730 113.3
Elastic Modulus
@ Vo • 71,008 MN/m2
@VLL = 70,843 MN/m2
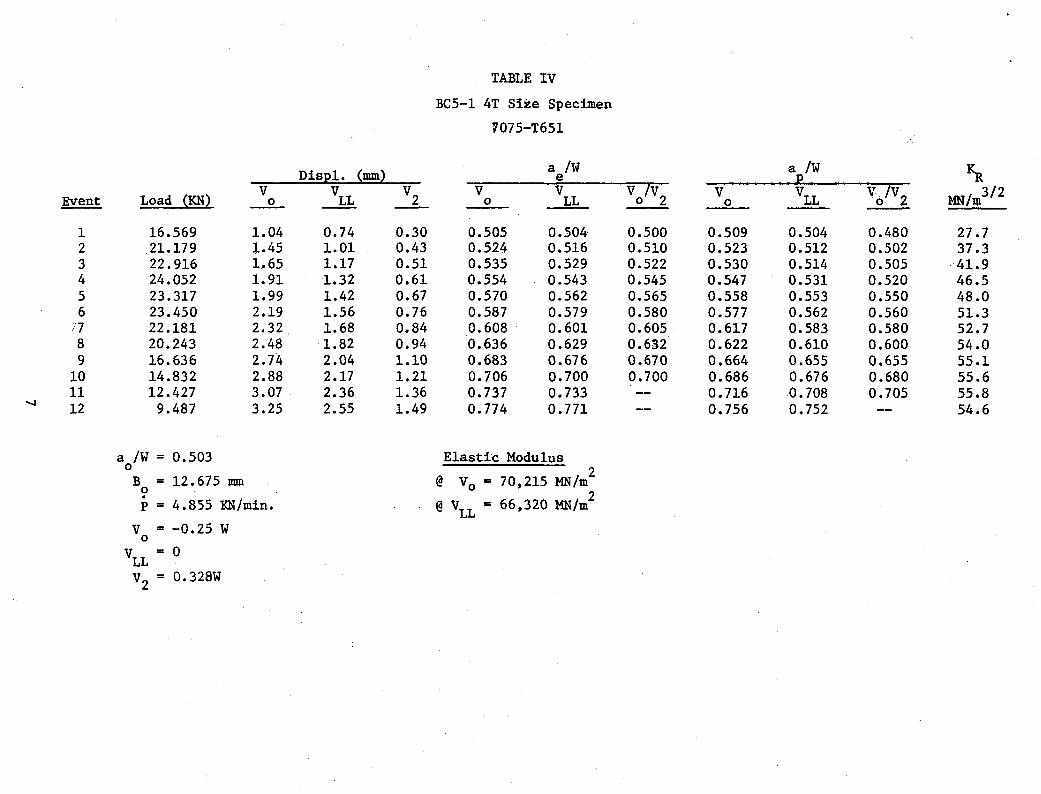
TABLE IV
BC5-1 4T Size Specimen
7075-T651
Disp1. (mm) a /W a /W~e p
Load (KN)V V
LLV
2V V V lv V VLL V
o/V
2 MN/r.n3/ 2Event _0_ 0 LL o 2 0
1 16.569 1.04 0.74 0.30 0.505 0.504' 0.500 0.509 0.504 0.480 27.72 .21.179 )..45 1.01 0.43 0.524 0.516 0.510 0.523 0.512 0.502 37.33 22.916 1~65 1.17 0.51 0.535 0.529 0.522 0.530 0.514 0.505 ·41.94 24.052 1.91 1.32 0.61 0.554 0.543 0.545 0.547 0.531 0.520 46.55 23.317 1.99 1.42 0.67 0.570 0.562 0.565 0.558 0.553 0.550 48.06 23.450 2.19 1.56 0.76 0.587 0.579 0.580 0.577 0.562 0.560 51.3
i7 22.181 2.32 1.68 0.84 0.608 0.601 0.605 0.617 0.583 0.580 52.78 20.243 2.48 1.82 0.94 0.636 0.629 0.632 0.622 0.610 0.600 54.09 16.636 2.74 2.04 1.10 0.683 0.676 0.670 0.664 0.655 0.655 55.1
10 14.832 2.88 2.17 1.21 0.706 0.700 0.700 0.686 0.676 0.680 55.611 12.427 3.07 2.36 1.36 0.737 0.733 0.716 0.708 0.705 55.812 9.487 3.25 2.55 1.49 0.774 0.771 0.756 0.752 54.6
a /W = 0.503 Elastic Modulus0 2
B = 12.675 mm @ Vo = 70,215 MN/m0
p = 4.855 KN/min. 2@VLL = 66,320 MN/m
V = -0.25 W0
VLL= 0
V2 = 0.328W
TABLE V
BC8-2 2T Size Specimen
7075-T651
Disp1. (mm) a /W ap/w Kae
Load (KN) V VLLV
2V V V
o/V2 V V
LLV
O/V
2 MN/m3/ 2Event 0 0 LL 0
1 8.387 0.57 0.37 0.18 0.513 0.514 0.495 0.511 0.504 0.488 20.42 12.881 0.90 0.57 0.30 0.520 0.516 0.534 0.521 0.521 0.511 31.83 14.181 1.17 0.79 0.43 0.555 0.560 0.565 0.543 0.541 0.530 39.94 12.734 1.53 1.07 0.63 0.627 0.630 0.640 0.601 0.604 0.612 47115 11.032 1.70 1.23 0.75 0.668 0.672 0.699 0.645 0.644 0.643 49.36 8.788 1.85 1.37 0.88 0.713 0.718 0.760 0.689 0.692 0.707 49.77 6.191 2.32 1.57 1.06 0.768 0.772 0.748 0.748 0.766 49.38 4.044 2.41 1.87 1.29 0.822 0.820 0.803 0.804 49.3
a /W = 0.509oBo = 12.802 mm.P = 12.471 KN/min.
V = -0.25 Wo
VLL
= 0
V2 = 0.303 W
'Elastic Modulus
@ V = 67,127 ~/m2o 2
@VLL
= 70,332 MN/m
TABLE VI
BC8-3 IT Specimen Size
7075-T651
Disp1. (mm)a /W a /W Kae p
Load. (KN)V V
LLV2 V VLL V
O/V2
V VLL Vo/VZ MN/m3/ Z
Event 0 0 0
1 8.231 0.53 0.35 0.18 0.513 0.505 0.530 0.508 0.509 0.489 28.02 8.231 0.64 0.44 0.23 0.554 0.547 0.570 0.539 0.548 0.541 32.13 8.182 0.78 0.56 0.31 0.595 0.594 0.630 0.571 0.572 0.575 37.54 8.155 0.90 0.65 0.36 0.622 0.618 0.627 0.594 0.586 0.595 41.45 6.984 1.06 0.76 0.48 0.673 0.668 0.715 0.636 0.636 0.670 44.36 5.336 1.15 0.88 0.55 0.723 0.723 0.770 0.685 0.689 0.701 44.87 4.142 1.30 0.99 0.61 0.767 0.764 0.747 0.728 0.733 0.750 45.38 2.993 1.38 1.07 0.69 0.805 0.804 0.811 0.766 0.769 0.810 43;89 2.370 1.51 1.17 0.76 0.832 0.830 0.830 0.795 0.797 0.815 43.7
a /W = 0.508o
Bo = 12.751 mm
p = 34.741 KN/min.
V = -0.25 Wo
VLL = 0
V2 = 0.303 W
Elastic Modulus
@ V = 71,208 MN/m2
o 2@V
LL= 69,643 MN/m
TABLE VII
SC2-1 4T Size Specimen
304 Stainless Steel
Disp1. (mm) a Iw Sp/We~MN/m3/2
(KN)y V V
2V V
LL volv2 V VLLEvent Load 0 ---11. 0 0
0 13.362 0.30 0.20 0.08 0.505 0.501 0.492 22.21 33.672 0.85 0.56 0.25 0.532 0.524 0.510 0.506 0.502 60.82 50.330 1.56 1.07 0.49 0.574 0.570 0.522 0.507 0.506 105.73 60.485 2.40 1.65 0.80 0.620 0.613 0.560 0.507 0.501 150.84 66.097 3.23 2.26 1.12 0.655 0.649 0.585 0.505 0.506 192.25 71.086 4.39 3.12 1.60 0.691 0.686 0.608 0.505 0.499 246.66 73.936 5.28 3.79 1.97 0.711 0.707 0.620 0.504 0.502 286.07 78.301 6.95 5.02 2.63 0.739 0.735 0.630 0.501 0.499 356.28 80.795 8.29 6.04 3.19 0.756 0.752 0.640 0.495 0.498 409.09 83.201 9.91 7.24 3.87 0.772 0.768 0.495 0.494 468.9
.... 10 85.071 11.30 8.27 4.45 0.784 0.779 0.495 0.494 520.40 11 86.318 12.78 9.38 5.05 0.794 0.790 0.498 0.498 571.2
12 86.853 14.33 10.55 5.73 0.804 0.800 0.500 0.502 621.613 86.853 15.60 11151 6.28 0.811 0.808 0.502 0.507 660.914 86.497 17.35 12.87 7.21 0.821 0.818 0.509 0.516 718.015 . 85.873 18.86 13.97 7.72 0.828 0.825 0.515 0.523 757.716 84.982 20.22 15.04 7.98 0.834 0.832 0.521 0.525 796.417 84.181 21.34 15.91 8.49 0.839 0.837 0.525 0.531 827.6
a /W = 0.502 E1astic Modulus0
@V = 196,369 MN/m2Bo = 12.776 mm
p = 10.436 KN/min.o. .2
@VLL = 196,748 MN/m
V = -0.25 W0
VLL = 0
V2 = 0.328 W
TABLE VIII
SC8-2 2T.Size Specimen
304 Stainless Steel
Disp1. (mm) a /W ~/W Ke R
Load (KN)V V
LLV
2V V
LLV
o/V
2V V
LL Vo
!V2 1!m/m3/ 2Event 0 0 0
\
1 19.842 0.57 0.36 0.18 0.560 0.547 0.500 0.498 0.494 0.472 54.12 33.316 1.71 1.13 0.62 0.664 0.655 0.562 0.498 0.494 0.485 139.03 37.480 2.88 1.96 1.10 0.721 0.715 0.596 0.502 0.494 0.472 211.44 41.400 4.53 3.15 1.18 0.763 0.759 0.625 0.506 0.494 0.515 304.35 43.115 5.61 3.95 2.28 0.782 0.778 0.630 0.490 0.494 0.501 361.86 45.074 7.12 5.04 2.92 0.800 0.797 0.640 0.494 0.494 0.513 . 435.07 46.299 8.37 5.98 3.46 0.812 0.810 0.647 0.490 0.504 0.505 494.78 47.181 9.31 6.68 3.88 0.820 0.817 0.658 0.486 0'.499 0.555 537.69 47.769 10.64 7.68 4.50 0.830 0.828 0.665 0.498 0.499 0.525 598.0
10 47.622 11.86 8.55 5.04 0.838 0.836 0.665 0.510 0.529 0.540 642.9I-' 11 47.475 13.09 9.42 5.60 0.845 0.843 0.670 0.510 0.519 0.540 686.8I-' 12 46.789 14.77 10.69 6.41 0.854 0.853 0.685 0.521 0.524 0.570 747.1
13 46.691 15.57 11.30 6.79 0.858 0.857 0.685 0.521 0.541 0.550 778.614 44.878 17.28 12.57 7.45 0.868 0.866 0.675 0.524 0.550 0.512 833.615 43.850 18.31 13.39 8.09 0.872 0.871 0.700 0.524 0.550 0.532 859.3
a /W = 0.510 Elastic Modulus0
V = i93,438 MN/m2
B = 13.030 mm @0 o 2P= 13.362 KN/min. @ V
LL= 201,966 MN/m
V = -0.25W0
VLL = 0
V2 = 0.303 W
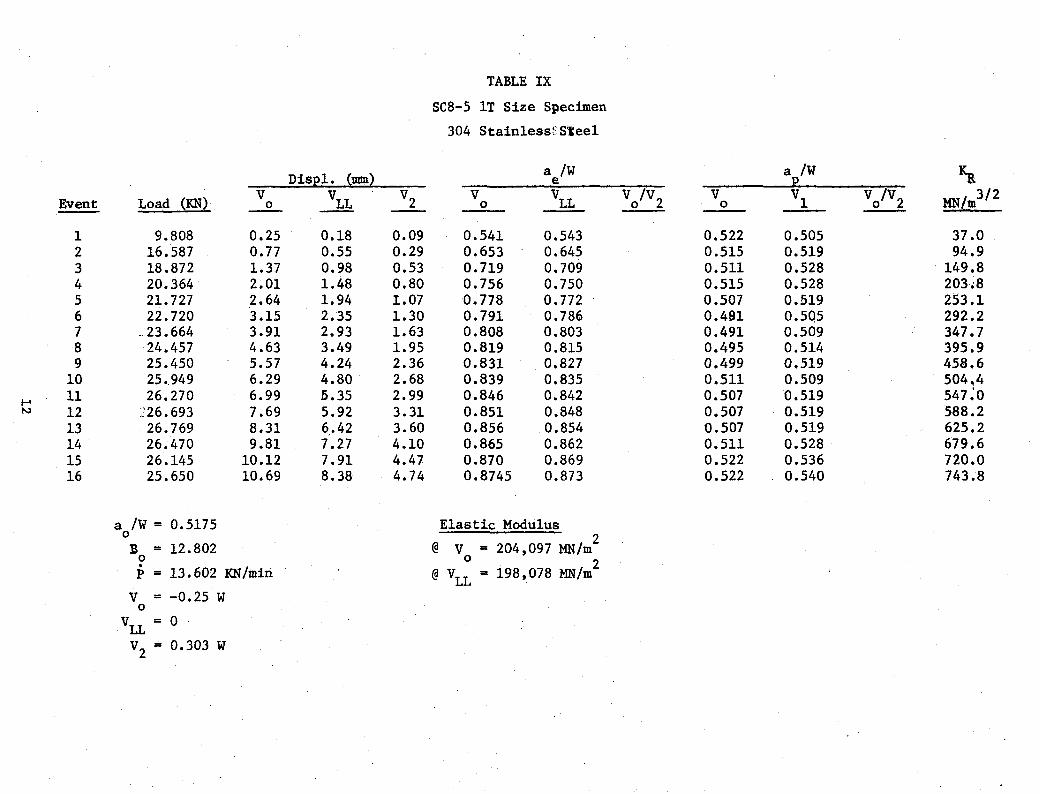
TABLE IX
SC8-5 IT Size Specimen
304 StainlessfSleel
Disp1. (mm)a /W a /W Kae p
Load (KN)V VLL
V2 V VLL V/V2
V VI Vo/V2 MN/m3/ 2
Event 0 0 0
1 9.808 0.25 0.18 0.09 0.541 0.543 0.522 0.505 37.02 16.587 0.77 0.55 0.29 0.653 0.645 0.515 0.519 94.93 18.872 1.37 0.98 0.53 0.719 0.709 0.511 0.528 . 149.84 20.364 2.01 1.48 0.80 0.756 0.750 0.515 0.528 203~8
5 21. 727 2.64 1.94 1.07 0.778 0.772 0.507 0.519 253.16 22.720 3.15 2.35 1.30 0.791 0.786 0.491 0.505 292.27 .• 23.664 3.91 2.93 1.63 0.808 0.803 0.491 0.509 347.78 24.457 4.63 3.49 1.95 0.819 0.815 0.495 0.514 395.99 25.450 5.57 4.24 2.36 0.831 0.827 0.499 0.519 458.6
10 25.949 6.29 4.80 2.68 0.839 0.835 0.511 0.509 504.4.... 11 26.270 6.99 5.35 2.99 0.846 0.842 0.507 0.519 547~0~ 12 ::26.693 7.69 5.92 3.31 0.851 0.848 0.507 0.519 588.2
13 26.769 8.31 6.42 3.60 0.856 0.854 0.507 0.519 625.214 26.470 9.81 7.27 4.10 0.865 0.862 0.511 0.528 679.615 26.145 10.12 7.91 4.47 0.870 0.869 0.522 0.536 720.016 25.650 10.69 8.38 4.74 0.8745 0.873 0.522 0.540 743.8
a /W = 0.5175 Elastic Modulus0 2
11 = 12.802 @ V = 204,097 MN/m0 o 2P= 13.602 KN/min @VLL = 198,078 MN/m
V = -0.25 W0
V = 0. 11V2 = 0.303 W

TABLE X
Summary Data
All 2024-T351
Size 4T 4T 4T 2T 2T 2T IT IT IT
Code AC2 AC5 AC8 AC2 AC5 AC8 AC2 AC5 AC8
Width (nun) 203 203 203 102 102 102 51 51 51
Thick. (nun) 12.60 12.57 12.52 12.60 12.57 12.60 12.55 12.55
A (nun) 102.39 102.51 51.94 51.61 51.43 26.49 26.31 26.140
P max (KN) 52.11 51.89 28.76 28.92 29.76 14.18 14.72 14.77
*V max (nun) 4.78 5.11 3.18 3.00 2.90 1.67 1.51 1.630
*v max (nun) 3.38 3.58 2.24 2.08 1.98 1.17 1.06 1.17LL .
*V2 max (mm) 1.66 1.83 1.22 1.17 1.09 0.65 0.56 0.643/2
114.4 120.0 101.6 105.0 95.1 76.4 72.4~ *KR max (MN/m ) 75.5w
*Max. stands for at maximum load.
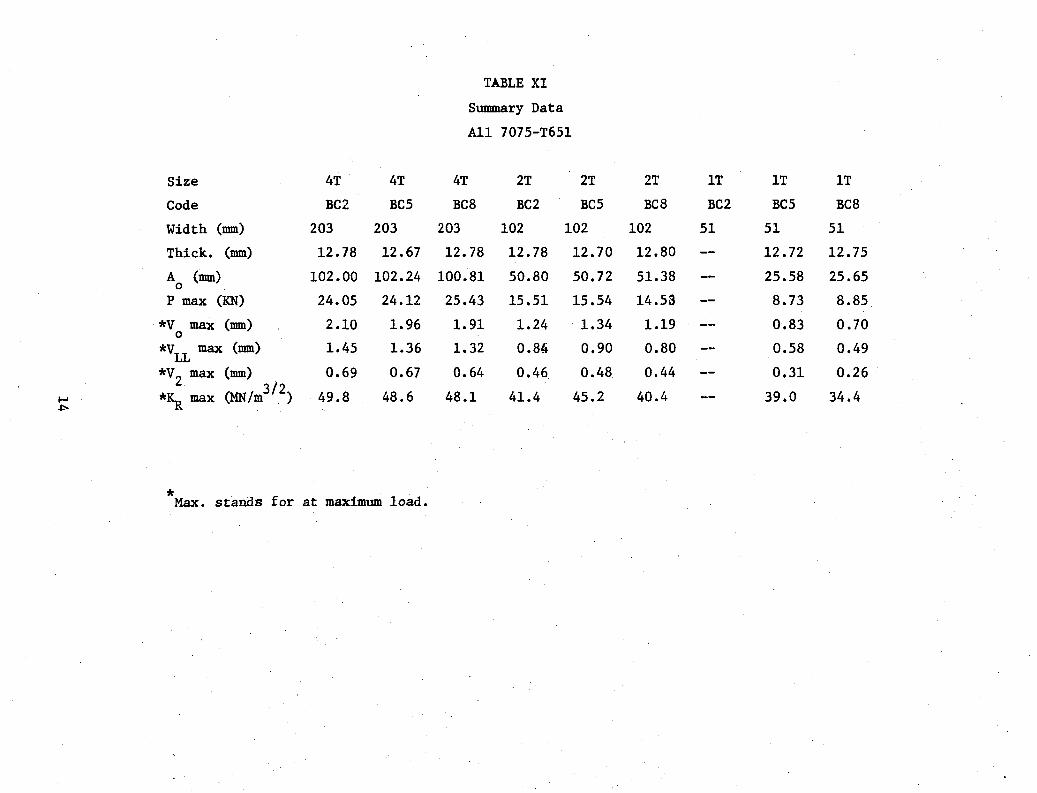
TABLE XI
Swmnary Data
All 7075-T651
Size 4T 4T 4T 2T 2T 2T IT IT IT
Code BC2 BC5 BC8 BCZ BC5 Be8 BCZ BC5 BC8
Width (mm) 203 203 203 102 102 102 51 51 51
Thick. (mm) 12.78 12.67 12.78 12.78 12.70 12.80 12.72 12.75
A (mm) 102.00 102.24 100.81 50.80 50.72 51.38 25.58 25.65o .P max (KN) 24.05 24.12 25.43 15.51 15.54 14.58 8.73 8.85
*v max (mm) 2.10 1.96 1.91 1.24 1.34 1.19 0.83 0.700
*V max (mm) 1.45 1.36 1.32 0.84 0.90 0.80 0.58 0.49LL
*V2 max (mm) 0.69 0.67 0.64 0.46 0.48 0.44 0.31 0.26
..... *~ max ('MN/m3/ 2) 49.8 48.6 48.1 41.4 45.2 40.4 39.0 34.4J:-
*Max. stands for at maximum load.
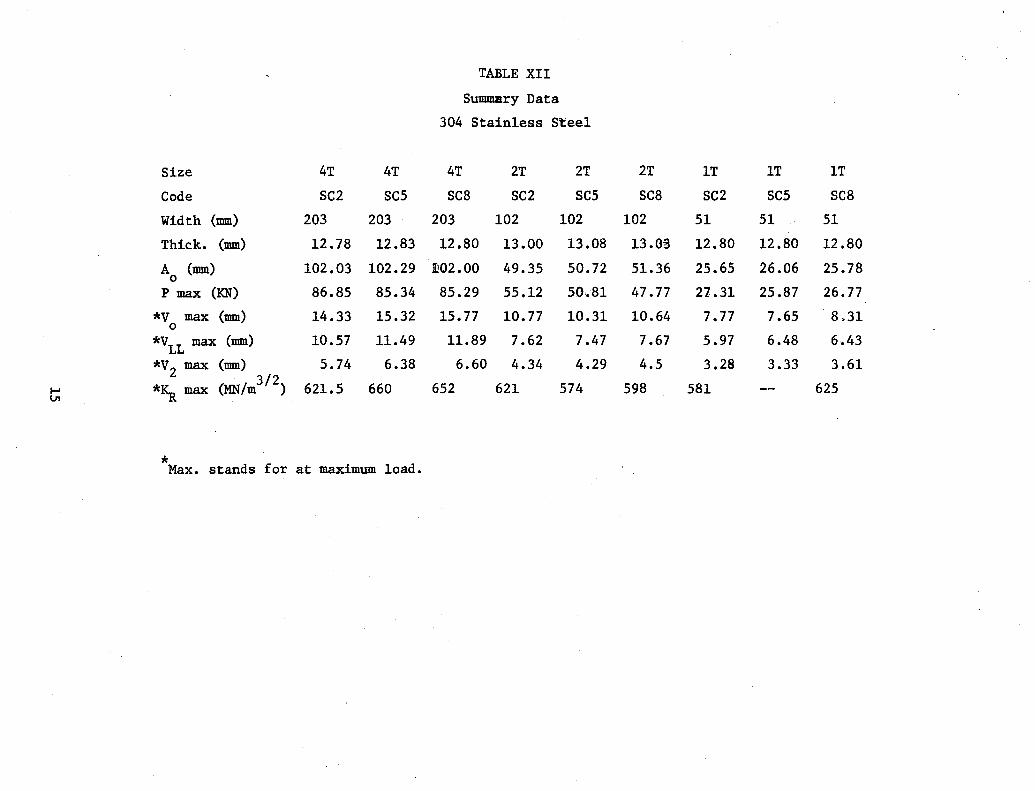
TABLE XII
Summary Data
304 Stainless Steel
Size 4T 4T 4T 2T 2T 2T 1T 1T 1T
Code SC2 SC5 SC8 SC2 SC5 SC8 SC2 SC5 SC8
Width (mm) 203 203 203 102 102 102 51 51 51
Thick. (mm) 12.78 12.83 12.80 13.00 13.08 13.03 12.80 12.80 12.80
A (nun) 102.03 102.29 ID02.00 49.35 50.72 51.36 25.65 26.06 25.780
P max (KN) 86.85 85.34 85.29 55.12 50.. 81 47.77 21.31 25.87 26.77
*v max (mm) 14.33 15.32 15.77 10.77 10.31 10.64 7.77 7.65 8.310
*vLL max (nun) 10.57 11.49 11.89 7.62 7.47 7.67 5.97 6.48 6.43
*V2 max (mm) 5.74 6.38 6.60 4.34 4.29 4.5 3.28 3.33 3.613/2 621.5 660 652 621 574 598 581 625I-' *~ max (MN/m )
V1
*Max. stands for at maximum load.
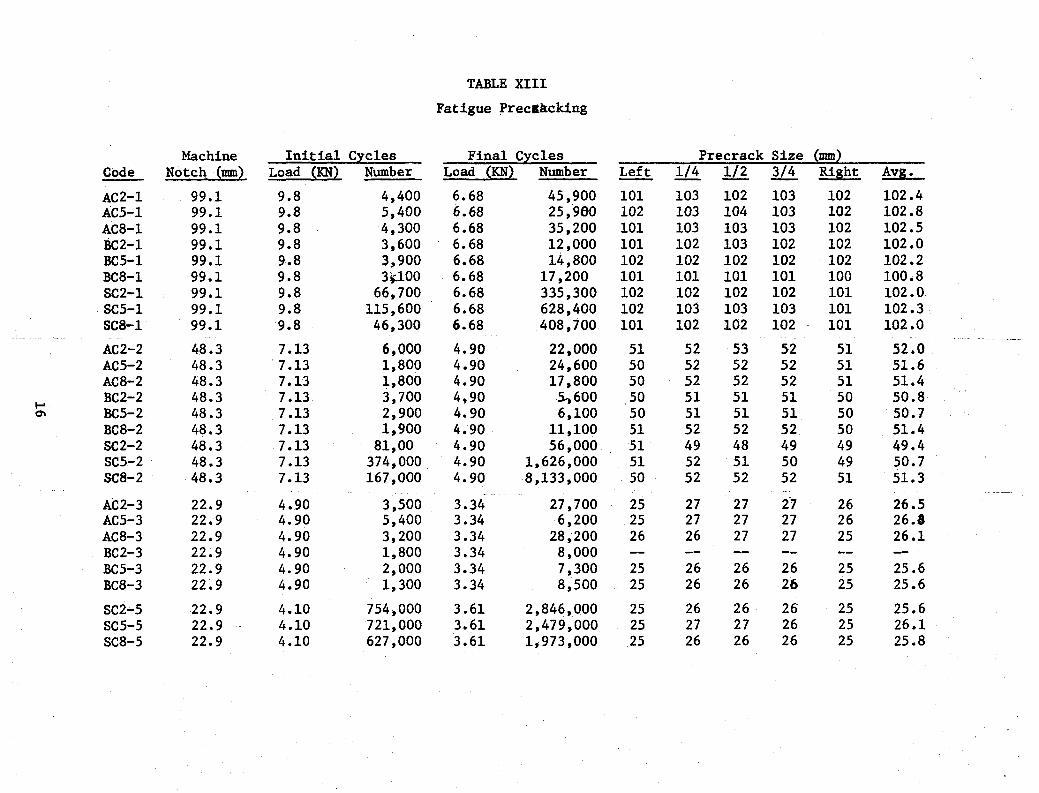
TABLE XIII
Fatigue Precaacking
Machine Initial Cycles Final Cycles Precrack Size (mm)Code Notch ·(mm) Load (KN) Number Load (KN) Number bili. 1/4 1/2 3/4 Right Avg.
AC2-1 99.1 9.8 4,400 6.68 45,900 101 103 102 103 102 102.4AC5-1 99.1 9.8 5,400 6.68 25,960 102 103 104 103 102 102.8AC8-1 99.1 9.8 4,300 6.68 35,200 101 103 103 103 102 102.5BC2-1 99.1 9.8 3,600 6.68 12,000 101 102 103 102 102 102.0BC5-1 99.1 9.8 3,900 6.68 14,800 102 102 102 102 102 102.2BC8-1 99.1 9.8 3~100 6.68 17,200 101 101 101 101 100 100.8SC2-1 99.1 9.8 66,700 6.68 335,300 102 102 102 102 101 102.0SC5-1 99.1 9.8 115,600 6.68 628,400 102 103 103 103 101 102.3SC8-1 99.1 9.8 46,300 6.68 408,700 101 102 102 102 101 102.0
AC2-2 48.3 7.13 6,000 4.90 22,000 51 52 53 52 51 52.0AC5-2 48.3 ·7.13 1,800 4.90 24,600 50 52 52 52 51 51.6AC8-2 48.3 7.13 1,800 4.90 17,800 50 52 52 52 51 51.4BC2-2 48.3 7.13 3,700 4,90 5.-;600 50 51 51 51 50 50.8....BC5-2 48.3 7.13 2,900 4.90 6,100 50 51 51 51 50 50.70\
BC8-2 48.3 7.13 1,900 4.90 11,100 51 52 52 52 50 51.4SC2-2 48.3 7.13 81,00 4.90 56,000 51 49 48 49 49 49.4SC5-2 48.3 7.13 374,000 . 4.90 1,626,000 51 52 51 50 49 50.7SC8-2 48.3 7.13 167,000 4.90 8,133,000 50 52 52 52 51 51.3
AC2-3 22.9 4.90 3,500 3.34 27,700 25 27 27 2"7 26 26.5AC5-3 22.9 4.90 5,400 3.34 6,200 25 27 27 27 26 26.3AC8-3 22.9 4.90 3,200 3.34 28,200 26 26 27 27 25 26.1BC2-3 22.9 4.90 1,800 3.34 8,000BC5-3 22.9 4.90 2,000 3.34 7,300 25 26 26 26 25 25.6BC8-3 22.9 4.90 1,300 3.34 8,500 25 26 26 26 25 25.6
SC2-5 22.9 4.10 754,000 3.61 2,846,000 25 26 26 26 25 25.6SC5-5 22.9 4.10 721,000 3.61 2,479,000 25 27 27 26 25 26.1SC8-5 22.9 4.10 627,000 3.61 1,973,000 25 26 26 26 25 25.8
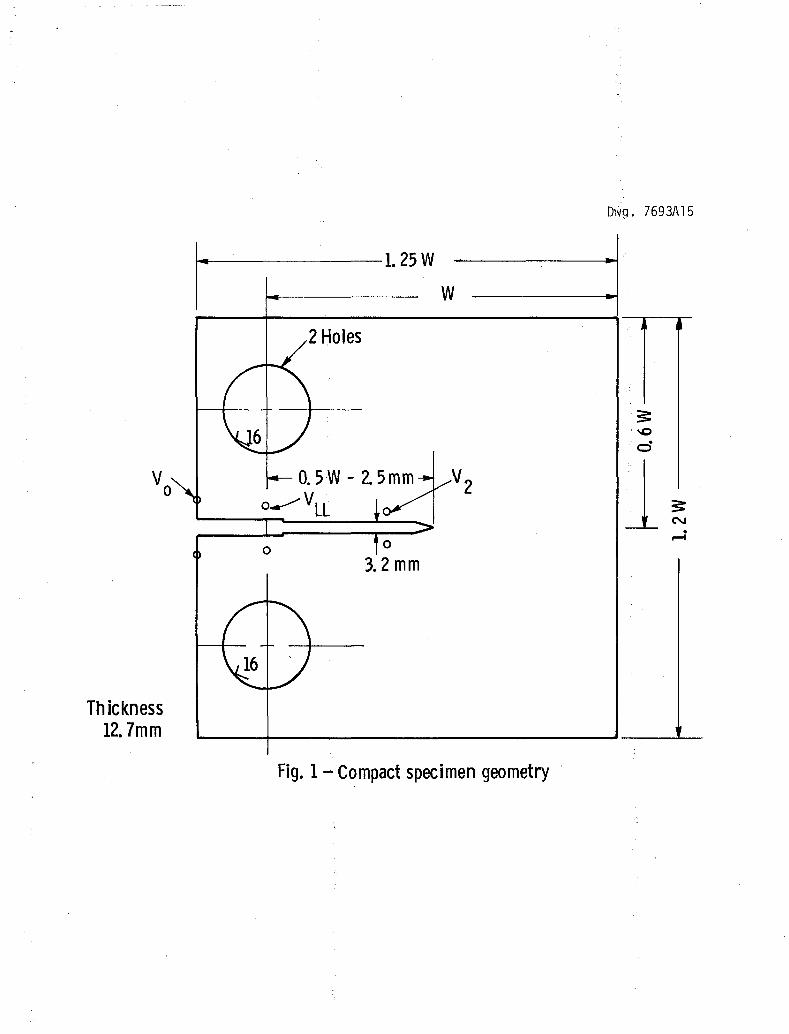
1~"------1.25WW
2Holes
3.2mm
Thickness12.7mm
Fig. 1- Compact specimen geometry
0".{9. 7693A15

Curve 716286-8
o
t:. IT Specimen Size
o .2T Specimen Size
o 4T Specimen Size44
33
22
99
121
110
132
154 r-----,----.,----,...------,-----r------.,....------T---
143
~ 88E-~ 77
.:ff-66
11
O'-----=-==------:--=-=---~:::__----:~---==-l::_::_--~-----=4---.J6.35 12.7 19.05 25.4 3175 38.1 50.8
~ae - mm
Fig. 2- 2024-T351
Cu rve 716287-8
0143
132
121
1100
99
N 88~
E- 77z:E
0:::66~
55IT Specimen Size6
44 0 2T Specimen Sizeo 4T Specimen Size
33
22
11
0 6.35 12.1 19.05 25.4 31.15 38.1/).a - mmp
Fig. 3- 2024-T351
Curve 716288-/\
77
66
55 0 0
N
~ 044E-..z
2: 33 o 4T Size Specimen0:::
o 2T Size Specimen~
22 A IT Size Specimen
11
o 6. 35 12. 7 19.05 25.46a - mme
Fig. 4 - 7075 - T651
31. 75 38. 1 SO. 8
Cu rve 71 f 289-A
77
66
55 000 0
N 0 0
~ 44 6666t:£:.0
E-z:E 33
0::: 0 4T Size Specimen~ 2T Size Specimen22 0
6 IT Size Specimen
11
o 6.35 12.7 19.05 25.4D.a -- mm
p
31. 75 38. 1 so. 8
. Fig. 5- 7075-T651
Curve 716290-A
660 .----,..-----~---_r_---__r__---_---_
o 12. 7 25.4 38. 1~ae - mm
Fig. 6- 304 Stainless
SO. 8 63. 5 76.2

