data driven authentication: on the effectiveness of … driven authentication: on the effectiveness...
TRANSCRIPT

Data Driven Authentication: On the Effectiveness ofUser Behaviour Modelling with Mobile Device
Sensors
Hilmi Gunes Kayacık∗, Mike Just∗, Lynne Baillie∗, David Aspinall† and Nicholas Micallef∗∗Glasgow Caledonian University, Glasgow, UK, {gunes.kayacik, mike.just, lynne.baillie, nicholas.micallef}@gcu.ac.uk
†University of Edinburgh, Edinburgh, UK, [email protected]
Abstract—We propose a lightweight, and temporally and spa-tially aware user behaviour modelling technique for sensor-basedauthentication. Operating in the background, our data driventechnique compares current behaviour with a user profile. If thebehaviour deviates sufficiently from the established norm, actionssuch as explicit authentication can be triggered. To support aquick and lightweight deployment, our solution automaticallyswitches from training mode to deployment mode when the user’sbehaviour is sufficiently learned. Furthermore, it allows the deviceto automatically determine a suitable detection threshold. Weuse our model to investigate practical aspects of sensor-basedauthentication by applying it to three publicly available data sets,computing expected times for training duration and behaviourdrift. We also test our model with scenarios involving an attackerwith varying knowledge and capabilities.
I. INTRODUCTION
Mobile devices such as smart phones and tablets are rapidlybecoming our digital identity. They are used for payments andauthentication, and they store valuable information. Today’smobile device hardware is quite capable with multi-core gi-gahertz processors, and gigabytes of memory and solid-statestorage. Their relatively low cost, ease of use and ‘alwayson’ connectivity provides a suitable platform for many day-to-day tasks involving money and sensitive data, which inturn makes mobile devices an attractive attack target (e.g., seeattacks against well-known Apple iOS and Google Androidplatforms [1]).
Authentication based on user behaviour and biometricshas attracted interest as mobile device popularity grows. Fortraditional authentication methods, research shows that PINand password-based security is cumbersome to use [2], [3], [4]and is frequently disabled by users. A recent study [5] showsthat 64% of users do not use authentication on their phones.By contrast, implicit authentication relies not on what the userknows but is based upon user behaviour, and is accomplishedby building so-called user profiles from various sensor data[3], [6], [7], [8], [9], [10]. If the user behaviour is consistentwith their profile, the device will have high comfort, hence noexplicit authentication action is required. However, if the userdeviates sufficiently from the established normal behaviour,alternative measures can be triggered, such as requiring a PINor password. Reducing the occurence of explicit authenticationshould provide a more usable experience, and might encouragemore users to protect access to their devices.
Generally, previous work has ignored the practical con-siderations of deploying implicit authentication in large scale,
in-the-wild deployment scenarios. In this work, we providea data driven and empirical study of implicit authenticationunder a realistic scenario. In this case, we assume that the userpurchases a mobile device with behaviour learning capabilitiesand starts using the device in the same way that they wouldany other just-purchased mobile device. The device starts in‘training mode’, learning the user’s routine until it determinesautomatically, from data-driven heuristics that it is time toswitch to deployment. When the model is built and trainingends, the device is considered to be in ‘deployment mode’in which it presents authentication challenges when a userdeviates from the established normal behaviour. Our researchsought to answer the question of whether we could buildand deploy such a model in a practical and secure manneron today’s mobile devices, in support of which this papercontributes the following:
1) We propose an incremental training paradigm that istransparent to the user. In training mode, the deviceupdates the profile daily. When the device learns auser’s routine sufficiently, it automatically switchesfrom training to deployment mode.
2) After training, the device automatically determinesa suitable detection threshold, below which explicitauthentication is invoked. As the user interacts withthe device day after day, the threshold is dynamicallyupdated from the observed data.
3) In recognition of changes in work patterns, travelto new locations and moving to a new place, wepresent case studies where behavioural drift occursand examine different retraining techniques.
4) We also present an attack analysis, based upon anadversary with varying knowledge and capabilities.
Our incremental training differs from the previous work [3],[11], [12] which uses a fixed subset of data (i.e. a percentage ofcollected data, typically over a few weeks, is used for training).We do not disagree that a few weeks may suffice for training, infact, we empirically confirm it. We however argue that trainingduration must be set automatically on a per user basis since,as our evaluation shows, there is no one-size-fits-all.
The remainder of the paper is organised as follows. Relatedmobile device sensing work is discussed in Section II. Thedatasets used in our experiments are detailed in Section III.Our methodology for building user profiles is introduced inSection IV, including our incremental training approach andautomatic threshold generation. Section V provides the results,

including our analysis of behavioural drift and our attackscenarios. Conclusions are drawn in Section VI.
II. RELATED WORK
Building profiles from mobile device sensors has a broadrange of possible applications, for example, to facilitate socialstudies of human behaviour [6], [13], [14], publicly availabledata collections [15], [16] and context aware devices [17], [3],[11], [8], [9], which is the focus of this work.
Similar to our work, Gupta et al. [17] proposed a modelfor the familiarity and safety of a user’s device based uponits location, and used this to automatically construct accesscontrol policies. Their model distinguishes the behaviour ofdifferent users, and incorporates user feedback for refinement,though they do not consider the duration of training or thetransition from a training to deployment or retraining. Shiet al. [3] focused on implicit authentication by learning userbehaviour and assigning a score – positive for familiar eventsand negative for novel – based on recent user activity. Thetraining was performed on a fixed subset (60%) of the data.Lin et al. [7] proposed a non-intrusive authentication methodbased on orientation sensor data using k-nearest neighbourclassification. They argued that while input from a singlesensor may yield poor accuracy, combining multiple sensorinputs would improve the accuracy. To this end, Senguard [18]aimed to implicitly and continuously authenticate users usinginput from many sensors yielding a stronger classifier builtfrom per-sensor classifiers.
Furthermore, context aware authentication research [4], [8],[9], [10] focused on sensing the context in which the device isused (such as home or work) and providing access based ondevice comfort computed from various sensor data. Though alocation-only may be more susceptible to insider attacks (e.g.,friends and family), something that we address in our attackmodel. Eagle et al. [6] employed Eigenbehaviour analysis toidentify the patterns in a user’s daily routine. Using MITReality Mining Data [15], a small set of characteristic vectorsare computed, summarising user behaviour. Various research[3], [11], [12] proposed an implicit authentication methodusing behavioural and environmental biometrics collected fromdevice sensors. While this context-aware, sensor-based authen-tication research is similar to our work, the do not addressthe incremental training and determining detection thresholdautomatically from data.
While previous work investigated the use of various mod-elling methods, very little attention was paid to the practicalconsiderations of using such methods in large-scale deploy-ments with minimum intervention. It is reasonable to expect a(motivated) user to expend some effort in ‘teaching’ the deviceby providing feedback but they will quickly grow tired if fre-quent and labour intensive feedback is required. Additionally,some users may prefer an on-device modelling technique thatallows them to build and deploy models without their dataever leaving the device. Thus, in this work, we propose alightweight, non-parametric modelling approach that can runon today’s modern devices and determine when to stop trainingand the threshold for detection, both automatically from thedata. It is conceivable to have multiple techniques, some inthe cloud for more intensive but also accurate modelling. Thus
we believe our technique complements the existing work byproviding a scalable alternative that can run on a device.
III. DATASETS
To facilitate our analysis we use the publicly available Riceand MIT datasets, as well as our own GCU dataset. Table Isummarises the datasets used in our analysis.
A. GCU
The GCU dataset currently consists of a collection from7 staff and students of Glasgow Caledonian University. Thepresent data was collected in 2013 from Android devicesand contains sensor data from wifi networks, cell towers,application use, light and noise levels and device system stats.The duration of the data varies from 2 weeks to 14 weeks fordifferent users. Compared to other publicly available datasetsused in this paper, it also contains a detailed diary for each userwhich allows for a more informed investigation of anomalies.The dataset is publicly available in text file format1.
B. Rice Livelab
The Rice Livelab dataset [16] was created from the be-haviour of 35 users, all students at Rice University or HoustonCommunity College. The data was collected from iPhone 3GSdevices between 2010 and 2011 and contains sensor data suchas application use, wifi networks, cell towers, GPS readings,battery usage and accelerometer output. The duration of thedata varies from a few days to less than one year for differentusers. The dataset is publicly available in MySQL format.
C. MIT Reality Mining
The MIT Reality Mining dataset [15] contains the be-haviour data of 100 subjects from various departments of MIT.The data was collected from Nokia 6600 smartphones between2004 and 2005 and contains sensor data such as call logs,bluetooth devices in proximity, cell towers, application usage.The duration of data collection varies from a few days toabout one year for different users. It is publicly available as aMATLAB workspace file.
TABLE I. SUMMARY OF THE GCU, RICE AND MIT DATASETS.COLLECTION YEAR IS PROVIDED IN PARENTHESES.
GCU (2013) Rice (2010) MIT (2004)Users 7 25 100Duration 3 weeks 12 months 6 monthsSensors app, wifi, cell, cpu
load, light, noise,magnetic field, rota-tion
app, wifi, cell, de-vice active, call his-tory, battery, cpuload
app, bluetooth, cell,device active, call,charge
IV. METHODOLOGY
Our profiling technique builds temporal and spatial modelsfrom data in a lightweight and non-parametric way. Whenthe profile stabilises, training is considered to be completeand the device switches to a deployment mode. A detectionthreshold is computed based on the user’s security settings toactivate explicit authentication when the comfort is below thethreshold.
1Partial data can be accessed at http://www.ittgroup.org/.
A. User profile
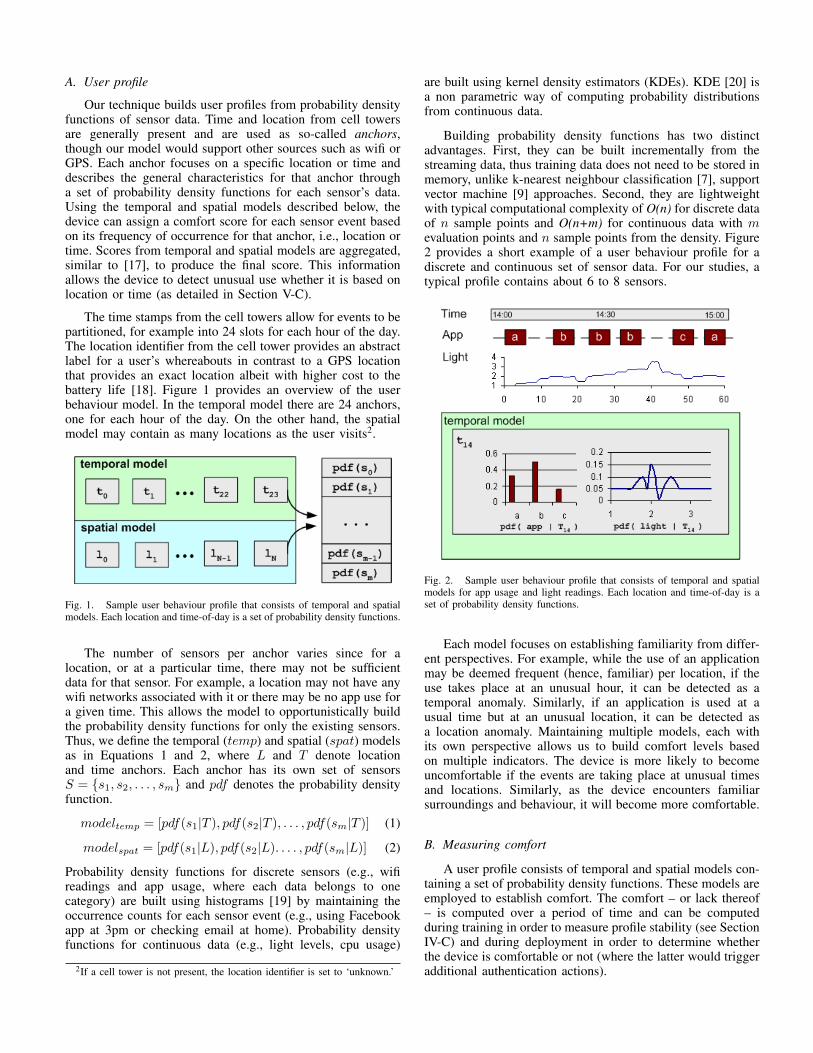
Our technique builds user profiles from probability densityfunctions of sensor data. Time and location from cell towersare generally present and are used as so-called anchors,though our model would support other sources such as wifi orGPS. Each anchor focuses on a specific location or time anddescribes the general characteristics for that anchor througha set of probability density functions for each sensor’s data.Using the temporal and spatial models described below, thedevice can assign a comfort score for each sensor event basedon its frequency of occurrence for that anchor, i.e., location ortime. Scores from temporal and spatial models are aggregated,similar to [17], to produce the final score. This informationallows the device to detect unusual use whether it is based onlocation or time (as detailed in Section V-C).
The time stamps from the cell towers allow for events to bepartitioned, for example into 24 slots for each hour of the day.The location identifier from the cell tower provides an abstractlabel for a user’s whereabouts in contrast to a GPS locationthat provides an exact location albeit with higher cost to thebattery life [18]. Figure 1 provides an overview of the userbehaviour model. In the temporal model there are 24 anchors,one for each hour of the day. On the other hand, the spatialmodel may contain as many locations as the user visits2.
Fig. 1. Sample user behaviour profile that consists of temporal and spatialmodels. Each location and time-of-day is a set of probability density functions.
The number of sensors per anchor varies since for alocation, or at a particular time, there may not be sufficientdata for that sensor. For example, a location may not have anywifi networks associated with it or there may be no app use fora given time. This allows the model to opportunistically buildthe probability density functions for only the existing sensors.Thus, we define the temporal (temp) and spatial (spat) modelsas in Equations 1 and 2, where L and T denote locationand time anchors. Each anchor has its own set of sensorsS = {s1, s2, . . . , sm} and pdf denotes the probability densityfunction.
modeltemp = [pdf(s1|T ), pdf(s2|T ), . . . , pdf(sm|T )] (1)
modelspat = [pdf(s1|L), pdf(s2|L). . . . , pdf(sm|L)] (2)
Probability density functions for discrete sensors (e.g., wifireadings and app usage, where each data belongs to onecategory) are built using histograms [19] by maintaining theoccurrence counts for each sensor event (e.g., using Facebookapp at 3pm or checking email at home). Probability densityfunctions for continuous data (e.g., light levels, cpu usage)
2If a cell tower is not present, the location identifier is set to ‘unknown.’
are built using kernel density estimators (KDEs). KDE [20] isa non parametric way of computing probability distributionsfrom continuous data.
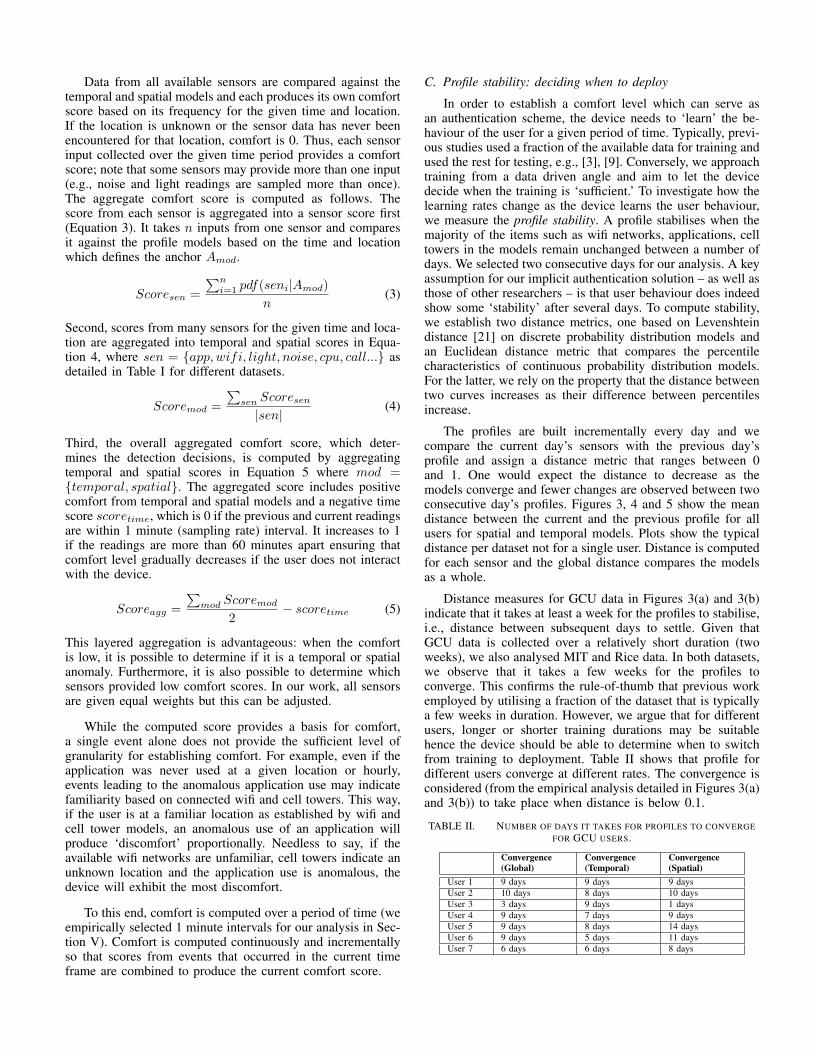
Building probability density functions has two distinctadvantages. First, they can be built incrementally from thestreaming data, thus training data does not need to be stored inmemory, unlike k-nearest neighbour classification [7], supportvector machine [9] approaches. Second, they are lightweightwith typical computational complexity of O(n) for discrete dataof n sample points and O(n+m) for continuous data with mevaluation points and n sample points from the density. Figure2 provides a short example of a user behaviour profile for adiscrete and continuous set of sensor data. For our studies, atypical profile contains about 6 to 8 sensors.
Fig. 2. Sample user behaviour profile that consists of temporal and spatialmodels for app usage and light readings. Each location and time-of-day is aset of probability density functions.
Each model focuses on establishing familiarity from differ-ent perspectives. For example, while the use of an applicationmay be deemed frequent (hence, familiar) per location, if theuse takes place at an unusual hour, it can be detected as atemporal anomaly. Similarly, if an application is used at ausual time but at an unusual location, it can be detected asa location anomaly. Maintaining multiple models, each withits own perspective allows us to build comfort levels basedon multiple indicators. The device is more likely to becomeuncomfortable if the events are taking place at unusual timesand locations. Similarly, as the device encounters familiarsurroundings and behaviour, it will become more comfortable.
B. Measuring comfort
A user profile consists of temporal and spatial models con-taining a set of probability density functions. These models areemployed to establish comfort. The comfort – or lack thereof– is computed over a period of time and can be computedduring training in order to measure profile stability (see SectionIV-C) and during deployment in order to determine whetherthe device is comfortable or not (where the latter would triggeradditional authentication actions).
Data from all available sensors are compared against thetemporal and spatial models and each produces its own comfortscore based on its frequency for the given time and location.If the location is unknown or the sensor data has never beenencountered for that location, comfort is 0. Thus, each sensorinput collected over the given time period provides a comfortscore; note that some sensors may provide more than one input(e.g., noise and light readings are sampled more than once).The aggregate comfort score is computed as follows. Thescore from each sensor is aggregated into a sensor score first(Equation 3). It takes n inputs from one sensor and comparesit against the profile models based on the time and locationwhich defines the anchor Amod.
Scoresen =
∑ni=1 pdf(seni|Amod)
n(3)
Second, scores from many sensors for the given time and loca-tion are aggregated into temporal and spatial scores in Equa-tion 4, where sen = {app, wifi, light, noise, cpu, call...} asdetailed in Table I for different datasets.
Scoremod =
∑sen Scoresen|sen|
(4)
Third, the overall aggregated comfort score, which deter-mines the detection decisions, is computed by aggregatingtemporal and spatial scores in Equation 5 where mod ={temporal, spatial}. The aggregated score includes positivecomfort from temporal and spatial models and a negative timescore scoretime, which is 0 if the previous and current readingsare within 1 minute (sampling rate) interval. It increases to 1if the readings are more than 60 minutes apart ensuring thatcomfort level gradually decreases if the user does not interactwith the device.
Scoreagg =
∑mod Scoremod
2− scoretime (5)
This layered aggregation is advantageous: when the comfortis low, it is possible to determine if it is a temporal or spatialanomaly. Furthermore, it is also possible to determine whichsensors provided low comfort scores. In our work, all sensorsare given equal weights but this can be adjusted.
While the computed score provides a basis for comfort,a single event alone does not provide the sufficient level ofgranularity for establishing comfort. For example, even if theapplication was never used at a given location or hourly,events leading to the anomalous application use may indicatefamiliarity based on connected wifi and cell towers. This way,if the user is at a familiar location as established by wifi andcell tower models, an anomalous use of an application willproduce ‘discomfort’ proportionally. Needless to say, if theavailable wifi networks are unfamiliar, cell towers indicate anunknown location and the application use is anomalous, thedevice will exhibit the most discomfort.
To this end, comfort is computed over a period of time (weempirically selected 1 minute intervals for our analysis in Sec-tion V). Comfort is computed continuously and incrementallyso that scores from events that occurred in the current timeframe are combined to produce the current comfort score.
C. Profile stability: deciding when to deploy
In order to establish a comfort level which can serve asan authentication scheme, the device needs to ‘learn’ the be-haviour of the user for a given period of time. Typically, previ-ous studies used a fraction of the available data for training andused the rest for testing, e.g., [3], [9]. Conversely, we approachtraining from a data driven angle and aim to let the devicedecide when the training is ‘sufficient.’ To investigate how thelearning rates change as the device learns the user behaviour,we measure the profile stability. A profile stabilises when themajority of the items such as wifi networks, applications, celltowers in the models remain unchanged between a number ofdays. We selected two consecutive days for our analysis. A keyassumption for our implicit authentication solution – as well asthose of other researchers – is that user behaviour does indeedshow some ‘stability’ after several days. To compute stability,we establish two distance metrics, one based on Levenshteindistance [21] on discrete probability distribution models andan Euclidean distance metric that compares the percentilecharacteristics of continuous probability distribution models.For the latter, we rely on the property that the distance betweentwo curves increases as their difference between percentilesincrease.
The profiles are built incrementally every day and wecompare the current day’s sensors with the previous day’sprofile and assign a distance metric that ranges between 0and 1. One would expect the distance to decrease as themodels converge and fewer changes are observed between twoconsecutive day’s profiles. Figures 3, 4 and 5 show the meandistance between the current and the previous profile for allusers for spatial and temporal models. Plots show the typicaldistance per dataset not for a single user. Distance is computedfor each sensor and the global distance compares the modelsas a whole.
Distance measures for GCU data in Figures 3(a) and 3(b)indicate that it takes at least a week for the profiles to stabilise,i.e., distance between subsequent days to settle. Given thatGCU data is collected over a relatively short duration (twoweeks), we also analysed MIT and Rice data. In both datasets,we observe that it takes a few weeks for the profiles toconverge. This confirms the rule-of-thumb that previous workemployed by utilising a fraction of the dataset that is typicallya few weeks in duration. However, we argue that for differentusers, longer or shorter training durations may be suitablehence the device should be able to determine when to switchfrom training to deployment. Table II shows that profile fordifferent users converge at different rates. The convergence isconsidered (from the empirical analysis detailed in Figures 3(a)and 3(b)) to take place when distance is below 0.1.
TABLE II. NUMBER OF DAYS IT TAKES FOR PROFILES TO CONVERGEFOR GCU USERS.
Convergence(Global)
Convergence(Temporal)
Convergence(Spatial)
User 1 9 days 9 days 9 daysUser 2 10 days 8 days 10 daysUser 3 3 days 9 days 1 daysUser 4 9 days 7 days 9 daysUser 5 9 days 8 days 14 daysUser 6 9 days 5 days 11 daysUser 7 6 days 6 days 8 days

●
●
●
●
●
●
●
●●
●
●●
●
●
●●
●
●
● ●●
5 10 15 20
0.0
0.2
0.4
0.6
0.8
1.0
days
dist
ance
● appwifilightmagneticrotationnoisesys−loadusr−loadglobal
(a) Spatial models
●
●
●●
●
●
● ●
●
●
●
● ●
●
●
●
●
●
●
●
●
5 10 15 20
0.0
0.2
0.4
0.6
0.8
1.0
days
dist
ance
● appwifilightmagneticrotationnoisesys−loadusr−loadglobal
(b) Temporal models
Fig. 3. Comparison of spatial and temporal models between current day and preceding day on GCU dataset. Low distance indicates increased similarity.
●
●
●
●
●
●
●●●●●
●
●●
●●●●●●●●●●●●●●●●●●●●
●●●●●●●●●
●●●●●●●●●●●●●●●●●●●●●●●●●●●●●●●●●●●●●●●●●●
●●●●●●●●●●●●●●●●●●●●●●●●●●●●●●●●●●●●●●●●●●●●●●●●●●●●●●●●●●●●●●●●●●●●●●●●●●●●●●●●●●●●●●●●●●●●●●●●●●●●●●●●●●●●●●●●●●●●●●●●●●●●●●●●●●●●●●●●●●
●●●●●●●●●●●●●●●●●●●●●●●●●●●●●●●●●●●●●●●●●●●●●●●●●●●●●●●●●●●●●●●●●●●●●●●●●●●●●●●●●●●●●●●●●●●●●●●●●●●●●●●●●●●●●●●●●●●●●●
0 100 200 300
0.0
0.2
0.4
0.6
0.8
1.0
days
dist
ance
● appwifiactivecallbatterysys−loadusr−loadglobal
(a) Spatial models
●
●
●
●●●●
●●●
●
●
●●
●
●
●●●●●●
●
●
●●●●●
●
●●●●●●●●●●●●
●●●●●●●●●
●●●●●●●●●●●●●●●●●●●●●●●●●●●●●●●●●●●●●●●●●●●●●●●●●●
●●●●●●●●●●●●●●●●
●
●●●●●●●
●●●●
●●●●●●●
●●●●●●●
●●●●●●●●
●●●●●●●●●●●
●
●
●
●●●●●●●●
●
●●●●●●●●●●
●●●●●●●●●●●●●●●●
●●●●●●●●
●
●●●●●●●●●●●●●●●
●●●●●●●●●●●●●●●●●
●●●●●●●●
●●●●●●●●●●
●
●●●●
●●●●●●●●●
●●●●●●●●●●●
●●●●●●●●●
●●●●●●●●●●●●●●●●●●●●●●●
●●●●●●●●●●●
●●●●●●●●●●●●●●●●●●●●●
●●●●●●●●●●●
●●●●●●●●●●
●●●●●●●●●●●●●
0 100 200 300
0.0
0.2
0.4
0.6
0.8
1.0
days
dist
ance
● appwifiactivecallbatterysys−loadusr−loadglobal
(b) Temporal models
Fig. 4. Comparison of spatial and temporal models between current day and preceding day on Rice dataset. Low distance indicates increased similarity.
D. Determining a detection threshold
Computing comfort scores as detailed in Section IV-Ballows the device to produce a score at given time intervals,every 1 minute in this case. As profiles are built incrementallyeach day, the previous day’s model is utilised to compare withthe current day for convergence tests as shown in SectionIV-C. The previous day’s profiles can also be used to computecomfort levels for the current day’s data to explore how devicecomfort changes over time. For example, one would expectthe comfort to be low during the initial days since the deviceis unfamiliar with the user. As the profile converges and thetraining is sufficiently complete, the comfort should increase
and the detection of anomalies now becomes possible. Eachdevice will establish a comfort level unique to its user. While adaily average comfort level of 0.5 may be high for some users,for others (leading more predictable lives) it may be low.
A detection threshold can be defined as a value belowwhich additional authentication must be performed, e.g., ex-plicit authentication. We compute thresholds per user in adata driven fashion. We utilise the previous day’s profileand compute comfort levels for the current day. The use ofthe previous day’s profile allows us to investigate how thethreshold might change during training. Needless to say, whena device is in deployment, the profile to be used will be

●
●
●
●
●●●
●●●●●●●●●●
●●●●●●●
●●●●●●●●●●●●●●●●●●●●●●●●●●●●●●●●
●●●●●●●●●●●●●●●●●●●●●●●●●●●●●●●●●●●●●●●●●●●●●
●●●●●●●●●
●●●●●●●●●●●●●●●●●●●●●●●●●●●●
●●●●●●●●●●●●●●●●●●●●●●●●●●●●●●●●●●●●●●●●●●●●●●●●●●●●●●●●●●●●●●●●●●●●●●●●●●●●●●●●●●●●●●●●
●●●●●●●●●●●●●●●●●●●●●●●●●●●●●●●●●●●●
0 50 100 150 200 250
0.0
0.2
0.4
0.6
0.8
1.0
days
dist
ance
● appbtoothactivecallchargeglobal
(a) Spatial models
●
●
●
●●
●●●●●●●●
●●●●●
●●●●●●●●●●●●●●●●●●
●●●●●●●●●
●●●●●
●●●●●●●●●
●●●●
●●●●●●●●●●●●●●●●●●●●●●●
●●●●●●●●●
●●●●●●●●●
●●●●●●●●●
●●●●●●
●●●●●●●●●●●
●●●●●●●●●●●●●●●●●
●●●●●●●●●●●●●●●●●●●
●●●●●●●
●●●●●●●●●●●●●
●●●●
●●●●●●●
●●●●●●●●
●●●●●●●●●
●●●●
●●●●●●
●●●●●●●●●●●●●
●●●●●●●
●●●●●●●●●●●●●●●●●
●
0 50 100 150 200 250
0.0
0.2
0.4
0.6
0.8
1.0
days
dist
ance
● appbtoothactivecallchargeglobal
(b) Temporal models
Fig. 5. Comparison of spatial and temporal models between current day and preceding day on MIT dataset. Low distance indicates increased similarity.
the one that emerges after training. Figure 7 shows how thecomfort value at 2nd percentile changes over time. The valuesfrom each user in the data is averaged. Furthermore, Figure 6shows comfort values at 2nd percentile for each user, whichwe also use for our computations. In all three datasets, thecomfort level increases substantially in the first few weeks.Given a 1 minute sampling rate, approximately 1440 comfortscores are computed per day. We compute the comfort levelat 2nd percentile every day for each user. The implication of2nd percentile is that, as long as the new data follows thedistribution captured by the model, approximately 98% of thedata will be above the threshold and thus will not result inexplicit authentication.
While the value at percentile provides a data-driven wayto set the threshold, the user can select a suitable percentilefor his/her requirements (and one could imagine that thisvalue is set at default, and perhaps updated by the phonemanufacturer or service provider). For example, if the userkeeps the percentile at 2, he/she should expect explicit au-thentication to kick in roughly 2% of the time. If this is notacceptable from a (usability) security standpoint, he/she can(decrease) increase the percentile to accommodate (less) moreexplicit authentication. This will allow user to interact with theauthentication scheme (in the form selecting a point within arange) without having to set a specific threshold. Though inreality, the user may only have insight into the usability impactof setting the threshold. We discuss issues related to securityand impersonation below in Section V-C.
V. EVALUATION
This section presents case studies of legitimate and attackusage scenarios to investigate how well our implicit authenti-cation technique might perform in practice.
●●
●
●
●
●
●
●
●
●
●
●●
●
● ●
●
●
● ●
●
●●
●
●
●
●
●
●
●● ●
●
●
●
0 5 10 15 20 25 30 35
0.0
0.2
0.4
0.6
0.8
1.0
days
com
fort
at 2
nd p
erce
ntile
● user1user2user3user4user5user6user7
Fig. 6. Comfort score at 2nd percentile over time for each user in GCUdataset.
A. Long term study of comfort
Rice and MIT datasets contain user behaviour over 6months. Additionally, two users in the GCU dataset collecteddata for over 6 months and they were asked to keep detaileddiaries of their daily lives during this long term experiment.Figure 8 shows the comfort levels devices observe from a userfrom each dataset during the long term experiment. Other usersin the datasets exhibit similar properties.
Figure 8 shows that devices establish different comfortlevels for different users. For GCU User 2, the typical comfortwas around 0.5, whereas for the selected MIT and Rice users,

●
●
●
●
●
●
●
●
●
●
●
●
●
●
●
●
●
●
●
●
●
5 10 15 20
0.45
0.50
0.55
0.60
0.65
days
mea
n th
resh
old
(a) GCU
●
●●●●
●
●
●
●●
●
●
●
●
●
●
●
●
●●
●●
●●
●●
●
●
●
●●
●●
●
●
●●
●●●
●●
●
●
●●
●
●●●●
●
●
●
●
●●
●
●
●
●●●
●
●
●
●●
●
●●
●
●
●
●●
●
●
●
●
●
●●●
●●●
●●
●
●
●
●
●
●
●
●
●
●
●●
●●●
●●●
●●
●
●●●
●
●
●
●
●●
●●
●●
●●
●●
●
●
●
●
●
●●
●
●
●●
●●
●
●●
●
●
●
●
●●
●
●
●
●
●
●
●
●
●
●
●
●
●
●●
●
●
●
●
●
●
●
●
●
●
●●
●●
●
●
●
●●●●
●●
●
●
●●
●●
●
●
●●
●
●
●●
●
●
●
●
●●
●
●●
●●●
●
●
●
●●
●
●
●
●
●
●●
●
●
●●
●●●●
●
●
●●●●
●
●●●
●
●
●
●
●
●●
●
●
●
●●●
●
●
●
●
●
●●
●
●
●●
●
●
●●●●
●
●
●
●
●
●
●
●
●
●
●
●
●●
●
●
●●
●●
●
●
●
●
●
●
●●
●
●
●
●
●
●
●
●
●
0 50 100 150 200 250 300
0.1
0.2
0.3
0.4
0.5
0.6
0.7
days
mea
n th
resh
old
(b) Rice
●
●
●●
●●●
●●●●
●●●●
●●●
●
●
●●
●●●●●
●
●
●
●
●●
●
●
●●●●
●●
●
●●
●
●
●
●
●●
●●
●●
●●
●●
●
●●
●
●●●●●●
●
●
●●
●
●
●
●
●
●
●●●
●
●
●●
●●●●●
●
●
●
●●
●●
●
●●
●
●
●●●
●●
●
●
●
●
●
●
●●●●
●
●
●●
●●●
●
●
●●
●
●
●●
●
●
●
●
●
●
●
●●
●●●
●
●●●
●
●
●
●
●
●
●
●
●
●●
●
●●
●
●
●
●●
●
●
●
●●●●
●
●
●●
●●
●
●
●
●
●
●
●
●
●
●●●
●
●
●
●●●●
●
●
●
●
●●
●●
●
●
●
●●
●
●
●●
●
●
●
●●
●
●
●
●
●
●●
●
●
●
●
●
●●
●●
●
●
●
●
●
●
●
●
●
●●
●●
0 50 100 150 200 250
0.2
0.3
0.4
0.5
0.6
0.7
0.8
days
mea
n th
resh
old
(c) MIT
Fig. 7. Comfort score at 2nd percentile over time. Score is averaged over all users per dataset.
it was closer to 0.2. This is mainly due to two reasons: (i)each dataset consists of different sets of sensors, which mayprovide different comfort levels, and (ii) each user may havea different level of predictability in their lives. Therefore, it iscrucial to establish comfort level and detection thresholds peruser since there is no one size-fits-all solution.
Another phenomenon observable from Figure 8 is be-havioural drift. In long-term studies, we observed a slow andgradual decrease in overall comfort as time passes. After threeweeks of training, GCU User 2’s device encounters comfortlevels above 0.7, which slowly drops down to 0.5 after 6months. Similarly, Rice User A08 starts out with comfort levelsof 0.5 which drops below 0 after one year. On the other hand,MIT User 4 encounters comfort levels up to 1.0 which drops to0.5 in six months. This supports our argument for retraining:as the device recognises behaviour drift, it should go backto training mode again until the new behaviour is learned.Our technique provides a suitable means to detect behaviourdrift by checking the distribution of comfort levels daily andsuggesting to the user to put the device in training mode, if thedistribution varies sufficiently from that previously established,for a period of time. Needless to say, to prevent devices fromlearning malicious behaviour, the transition from deploymentback to training occurs after explicit authentication and onlyfor a brief period of time, such as a few hours, after which theuser needs to authenticate again to update the model.
Note that we use the term ‘retraining’ since our currentmodel is based upon a fixed profile that is used duringdeployment. Drift from this profile can automatically triggerperiodic retraining. An alternative would be to use a moredynamic profile that gradually changes according to a user’sbehaviour drift. However, we believe that such a model maynot be as effective since more frequent updates could requireuser confirmation, and our goal is to reduce the frequencyof explicit user interaction. In addition, our experimental datasuggests that behavioural drift might not be so noticeable tillafter a period of several months (e.g., 6 months for someusers). Thus, the relatively stable behaviour of users overtime suggests that a fixed model, with periodic retraining, issufficient for our purposes.
B. Changes in behaviour
The long term study of comfort levels on the three datasetsshown in Figure 8 shows behavioural drift in which the comfortlevel decreases over time. This can cause an increase in thenumber of explicit authentication requests if the comfort dropsbelow the detection threshold frequently. Over the period of afew months, the comfort level drops substantially for all threeusers.
To investigate the effect of moving to a new city, we plotthe comfort level observed for GCU User 2 in Figure 9. OnJune 15, the user moves to a different city which causes thecomfort level to drop. In Figure 9(a) the device uses the oldmodel after the move resulting in a low comfort level. Figure9(b) shows the change in comfort level when the user chosesto update the existing model whereas in Figure 9(c), the oldmodel is scrapped and a new model is trained. Results showthat re-training the existing model 9(b) is comparably effectiveas training a new model 9(c) when the established routinechanges, although retraining the existing model appears toprovide higher comfort scores for the first few days.
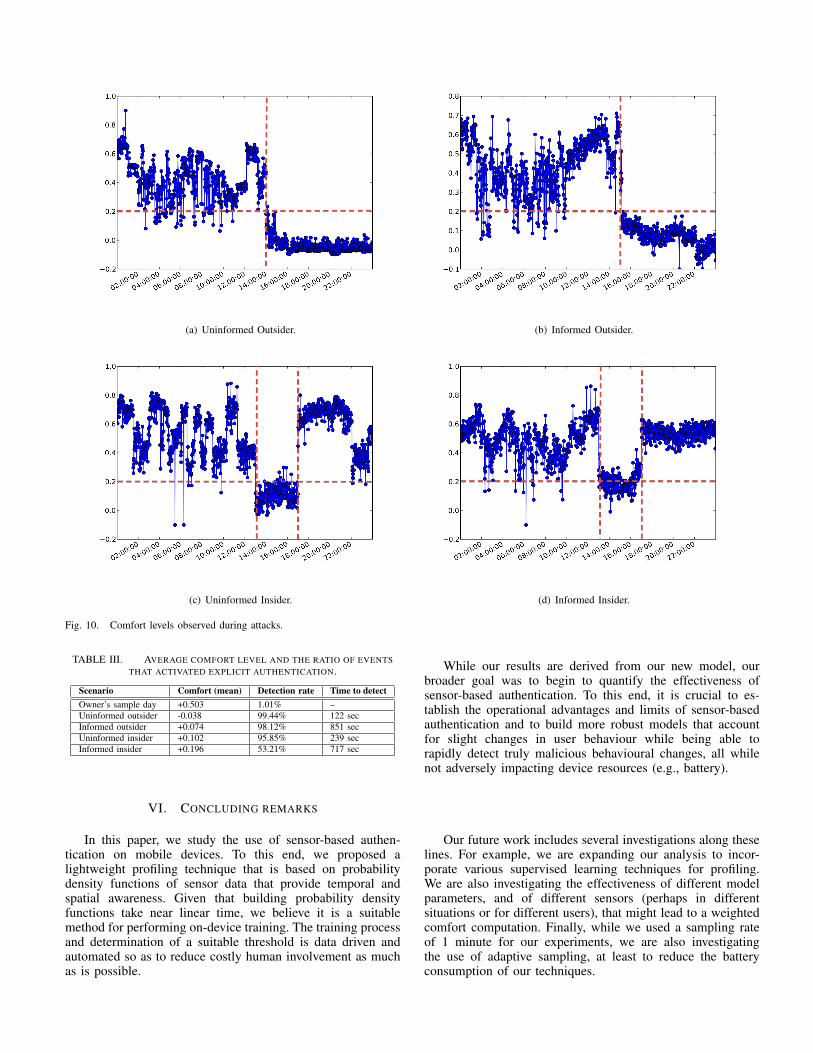
C. Attack Case Studies
Four different attack scenarios are formulated based on theattacker’s level of access to a user’s frequent locations andhis/her knowledge about the user’s behaviour [3]. To this end,we define two adversarial levels based on their knowledgeof the user and the authentication scheme. An uninformedadversary knows very little about the user and their routinewhereas an informed adversary possesses some knowledge ofthe users, for example, applications are frequently used (e.g.,a close friend or family member). Additionally, we define anoutsider to be a person who steals the device and runs away.On the other hand, an insider has access to a location that userfrequently visits and attempts to use the device at a locationfamiliar to the device (e.g., an office mate).
To facilitate our experiments, we asked one of our labmembers to use their device until the profile settled. After theprofile settled, the device owner was asked to use the devicenormally to establish the typical comfort level. We then devisedfour scenarios, detailed as follows:
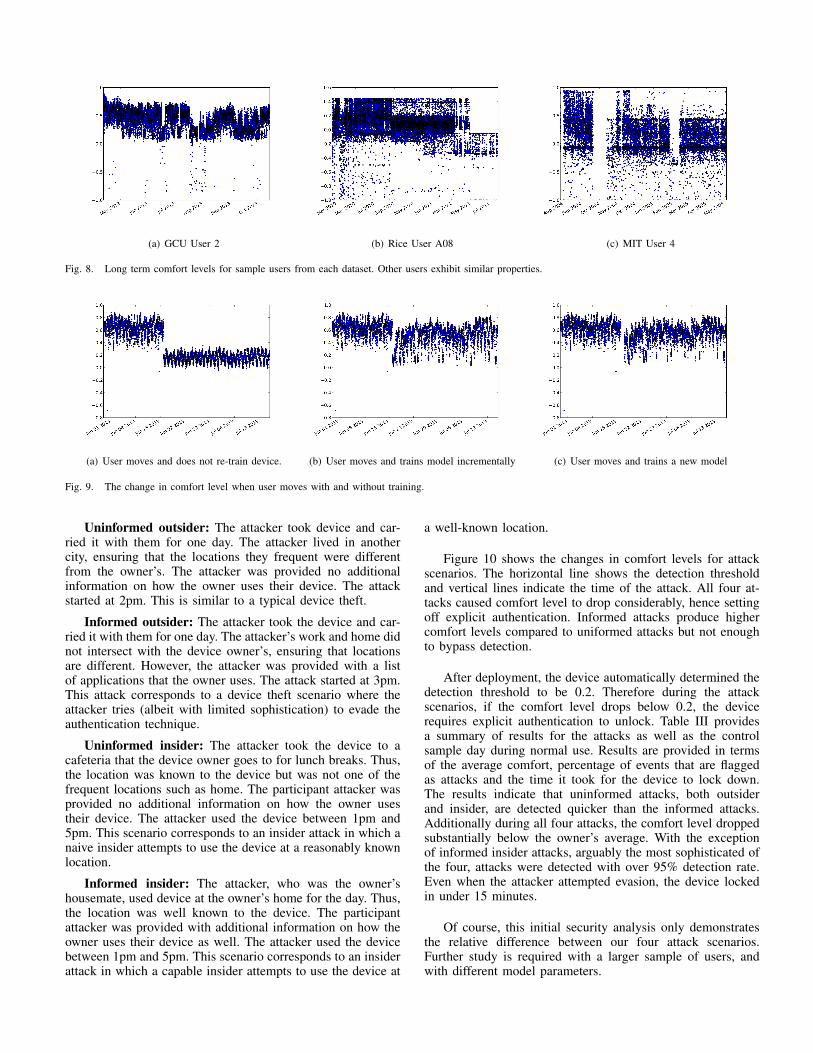
(a) GCU User 2 (b) Rice User A08 (c) MIT User 4
Fig. 8. Long term comfort levels for sample users from each dataset. Other users exhibit similar properties.
(a) User moves and does not re-train device. (b) User moves and trains model incrementally (c) User moves and trains a new model
Fig. 9. The change in comfort level when user moves with and without training.
Uninformed outsider: The attacker took device and car-ried it with them for one day. The attacker lived in anothercity, ensuring that the locations they frequent were differentfrom the owner’s. The attacker was provided no additionalinformation on how the owner uses their device. The attackstarted at 2pm. This is similar to a typical device theft.
Informed outsider: The attacker took the device and car-ried it with them for one day. The attacker’s work and home didnot intersect with the device owner’s, ensuring that locationsare different. However, the attacker was provided with a listof applications that the owner uses. The attack started at 3pm.This attack corresponds to a device theft scenario where theattacker tries (albeit with limited sophistication) to evade theauthentication technique.
Uninformed insider: The attacker took the device to acafeteria that the device owner goes to for lunch breaks. Thus,the location was known to the device but was not one of thefrequent locations such as home. The participant attacker wasprovided no additional information on how the owner usestheir device. The attacker used the device between 1pm and5pm. This scenario corresponds to an insider attack in which anaive insider attempts to use the device at a reasonably knownlocation.
Informed insider: The attacker, who was the owner’shousemate, used device at the owner’s home for the day. Thus,the location was well known to the device. The participantattacker was provided with additional information on how theowner uses their device as well. The attacker used the devicebetween 1pm and 5pm. This scenario corresponds to an insiderattack in which a capable insider attempts to use the device at
a well-known location.
Figure 10 shows the changes in comfort levels for attackscenarios. The horizontal line shows the detection thresholdand vertical lines indicate the time of the attack. All four at-tacks caused comfort level to drop considerably, hence settingoff explicit authentication. Informed attacks produce highercomfort levels compared to uniformed attacks but not enoughto bypass detection.
After deployment, the device automatically determined thedetection threshold to be 0.2. Therefore during the attackscenarios, if the comfort level drops below 0.2, the devicerequires explicit authentication to unlock. Table III providesa summary of results for the attacks as well as the controlsample day during normal use. Results are provided in termsof the average comfort, percentage of events that are flaggedas attacks and the time it took for the device to lock down.The results indicate that uninformed attacks, both outsiderand insider, are detected quicker than the informed attacks.Additionally during all four attacks, the comfort level droppedsubstantially below the owner’s average. With the exceptionof informed insider attacks, arguably the most sophisticated ofthe four, attacks were detected with over 95% detection rate.Even when the attacker attempted evasion, the device lockedin under 15 minutes.
Of course, this initial security analysis only demonstratesthe relative difference between our four attack scenarios.Further study is required with a larger sample of users, andwith different model parameters.
(a) Uninformed Outsider. (b) Informed Outsider.
(c) Uninformed Insider. (d) Informed Insider.
Fig. 10. Comfort levels observed during attacks.
TABLE III. AVERAGE COMFORT LEVEL AND THE RATIO OF EVENTSTHAT ACTIVATED EXPLICIT AUTHENTICATION.
Scenario Comfort (mean) Detection rate Time to detectOwner’s sample day +0.503 1.01% –Uninformed outsider -0.038 99.44% 122 secInformed outsider +0.074 98.12% 851 secUninformed insider +0.102 95.85% 239 secInformed insider +0.196 53.21% 717 sec
VI. CONCLUDING REMARKS
In this paper, we study the use of sensor-based authen-tication on mobile devices. To this end, we proposed alightweight profiling technique that is based on probabilitydensity functions of sensor data that provide temporal andspatial awareness. Given that building probability densityfunctions take near linear time, we believe it is a suitablemethod for performing on-device training. The training processand determination of a suitable threshold is data driven andautomated so as to reduce costly human involvement as muchas is possible.
While our results are derived from our new model, ourbroader goal was to begin to quantify the effectiveness ofsensor-based authentication. To this end, it is crucial to es-tablish the operational advantages and limits of sensor-basedauthentication and to build more robust models that accountfor slight changes in user behaviour while being able torapidly detect truly malicious behavioural changes, all whilenot adversely impacting device resources (e.g., battery).
Our future work includes several investigations along theselines. For example, we are expanding our analysis to incor-porate various supervised learning techniques for profiling.We are also investigating the effectiveness of different modelparameters, and of different sensors (perhaps in differentsituations or for different users), that might lead to a weightedcomfort computation. Finally, while we used a sampling rateof 1 minute for our experiments, we are also investigatingthe use of adaptive sampling, at least to reduce the batteryconsumption of our techniques.

ACKNOWLEDGMENT
Thanks to the MoST reviewers for their helpful comments.The research leading to these results has received fundingfrom the People Programme (Marie Curie Actions) of theEuropean Union’s Seventh Framework Programme (FP7/2007-2013) under REA grant agreement no PIIF-GA-2011-301536.
REFERENCES
[1] C. Nachenberg, “A window into mobile device security: Examiningthe security approaches employed in apple’s ios and google’s android,”Symantec, Tech. Rep., 2011.
[2] Confident Technologies. Survey shows smartphoneusers choose convenience over security. [On-line]. Available: http://confidenttechnologies.com/news events/survey-shows-smartphone-users-choose-convenience-over-security
[3] E. Shi, Y. Niu, M. Jakobsson, and R. Chow, “Implicit authenticationthrough learning user behavior,” in Proceedings of the 13thinternational conference on Information security, ser. ISC’10. Berlin,Heidelberg: Springer-Verlag, 2011, pp. 99–113. [Online]. Available:http://dl.acm.org/citation.cfm?id=1949317.1949329
[4] I. T. Fischer, C. Kuo, L. Huang, and M. Frank, “Short paper:Smartphones: Not smart enough?” in Proceedings of the SecondACM Workshop on Security and Privacy in Smartphones and MobileDevices, ser. SPSM ’12. New York, NY, USA: ACM, 2012, pp. 27–32.[Online]. Available: http://doi.acm.org/10.1145/2381934.2381941
[5] “Keep your phone safe: How to protect yourself from wirelessthreats,” Consumer Reports, Tech. Rep., 2013. [Online]. Available:http://consumerreports.org/privacy0613
[6] N. Eagle and A. S. Pentland, “Eigenbehaviors: identifying structurein routine,” Behavioral Ecology and Sociobiology, vol. 63, no. 7,pp. 1057–1066, 2009. [Online]. Available: http://dx.doi.org/10.1007/s00265-009-0739-0
[7] C.-C. Lin, D. Liang, C.-C. Chang, and C.-H. Yang, “A new non-intrusiveauthentication method based on the orientation sensor for smartphoneusers,” in Proceedings of the 6th IEEE International Conference onSoftware Security and Reliability, 2012, pp. 245 –252.
[8] E. Hayashi, S. Das, S. Amini, J. Hong, and I. Oakley, “Casa:Context-aware scalable authentication,” in Proceedings of the NinthSymposium on Usable Privacy and Security, ser. SOUPS ’13. NewYork, NY, USA: ACM, 2013, pp. 3:1–3:10. [Online]. Available:http://doi.acm.org/10.1145/2501604.2501607
[9] O. Riva, C. Qin, K. Strauss, and D. Lymberopoulos, “Progressiveauthentication: Deciding when to authenticate on mobile phones,” inProceedings of the 21st USENIX Conference on Security Symposium,ser. Security’12. Berkeley, CA, USA: USENIX Association, 2012, pp.
15–15. [Online]. Available: http://dl.acm.org/citation.cfm?id=2362793.2362808
[10] J. Seifert, A. De Luca, B. Conradi, and H. Hussmann, “Treasurephone:Context-sensitive user data protection on mobile phones,” in Proceed-ings of the 8th International Conference on Pervasive Computing, ser.Pervasive’10. Berlin, Heidelberg: Springer-Verlag, 2010, pp. 130–137.
[11] M. Tamviruzzaman, S. I. Ahamed, C. S. Hasan, and C. O’Brien,“epet: when cellular phone learns to recognize its owner,” inProceedings of the 2nd workshop on Assurable and usablesecurity configuration. ACM, 2009, pp. 13–18. [Online]. Available:http://doi.acm.org/10.1145/1655062.1655066
[12] J. Zheng and L. M. Ni, “An unsupervised framework for sensingindividual and cluster behavior patterns from human mobile data,”in Proceedings of the 2012 ACM Conference on UbiquitousComputing. ACM, 2012, pp. 153–162. [Online]. Available: http://doi.acm.org/10.1145/2370216.2370241
[13] A. Rahmati and L. Zhong, “Studying smartphone usage: Lessons froma four-month field study,” IEEE Transactions on Mobile Computing,vol. 99, no. PrePrints, 2012.
[14] Z. Shen and K.-L. Ma, “Mobivis: A visualization system for exploringmobile data,” in Visualization Symposium, 2008. PacificVIS ’08. IEEEPacific, 2008, pp. 175 –182.
[15] N. Eagle and A. (Sandy) Pentland, “Reality mining: sensing complexsocial systems,” Personal Ubiquitous Comput., vol. 10, no. 4,pp. 255–268, 2006. [Online]. Available: http://dx.doi.org/10.1007/s00779-005-0046-3
[16] C. Shepard, A. Rahmati, C. Tossell, L. Zhong, and P. Kortum,“Livelab: measuring wireless networks and smartphone users in thefield,” SIGMETRICS Perform. Eval. Rev., vol. 38, no. 3, pp. 15–20,2011. [Online]. Available: http://doi.acm.org/10.1145/1925019.1925023
[17] A. Gupta, M. Miettinen, N. Asokan, and M. Nagy, “Intuitive securitypolicy configuration in mobile devices using context profiling,” inProceedings of the 2012 ASE/IEEE International Conference onSocial Computing. IEEE CS, 2012, pp. 471–480. [Online]. Available:http://dx.doi.org/10.1109/SocialCom-PASSAT.2012.60
[18] W. Shi, J. Yang, Y. Jiang, F. Yang, and Y. Xiong, “Senguard: Passiveuser identification on smartphones using multiple sensors,” in Pro-ceedings of the 7th International Conference on Wireless and MobileComputing, Networking and Communications, 2011, pp. 141 –148.
[19] C. M. Bishop, Pattern Recognition and Machine Learning (InformationScience and Statistics). Secaucus, NJ, USA: Springer-Verlag NewYork, Inc., 2006.
[20] M. P. Wand, “Fast computation of multivariate kernel estimators,”Journal of Computational and Graphical Statistics, vol. 3, no. 4, pp.433–445, Dec. 1994. [Online]. Available: http://dx.doi.org/10.1080/10618600.1994.10474656
[21] V. I. Levenshtein, “Binary codes capable of correcting deletions, inser-tions, and reversals,” Soviet Physics Doklady, Tech. Rep. 8, 1966.