data-driven genomic computing: making sense of …
TRANSCRIPT

DATA-DRIVEN GENOMIC COMPUTING:
MAKING SENSE OF SIGNALS FROM THE GENOME
Stefano Ceri DEIB | Dipartimento di Elettronica, Informazione e Bioingegneria

BACKGROUND


HIGH THROUGHPUT SEQUENCING COST PER GENOME, 2001-2015
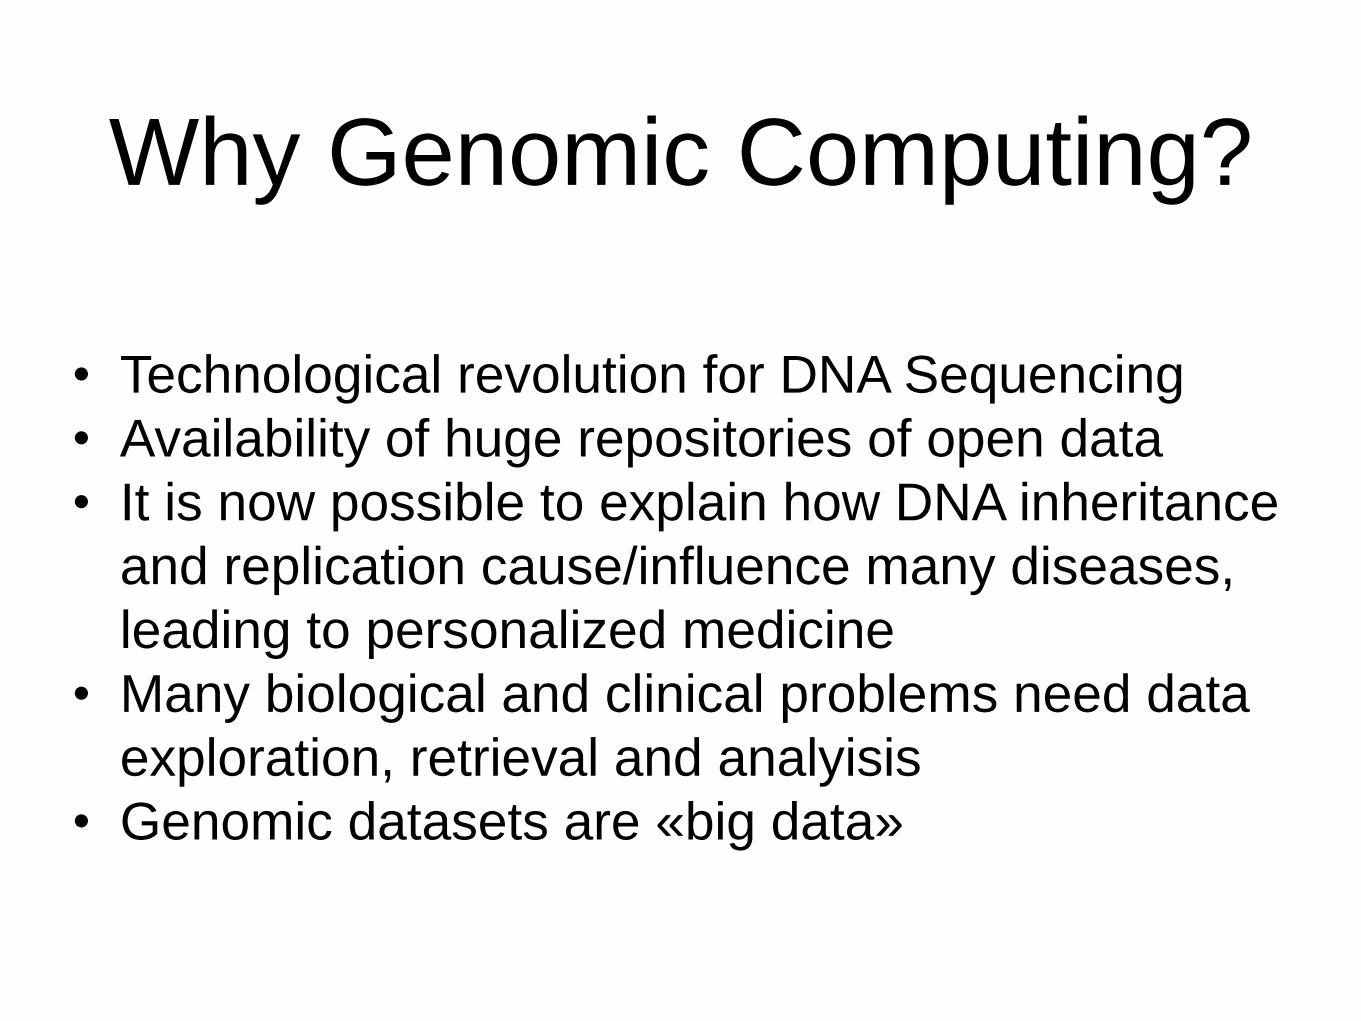
Why Genomic Computing?
• Technological revolution for DNA Sequencing
• Availability of huge repositories of open data
• It is now possible to explain how DNA inheritance
and replication cause/influence many diseases,
leading to personalized medicine
• Many biological and clinical problems need data
exploration, retrieval and analyisis
• Genomic datasets are «big data»
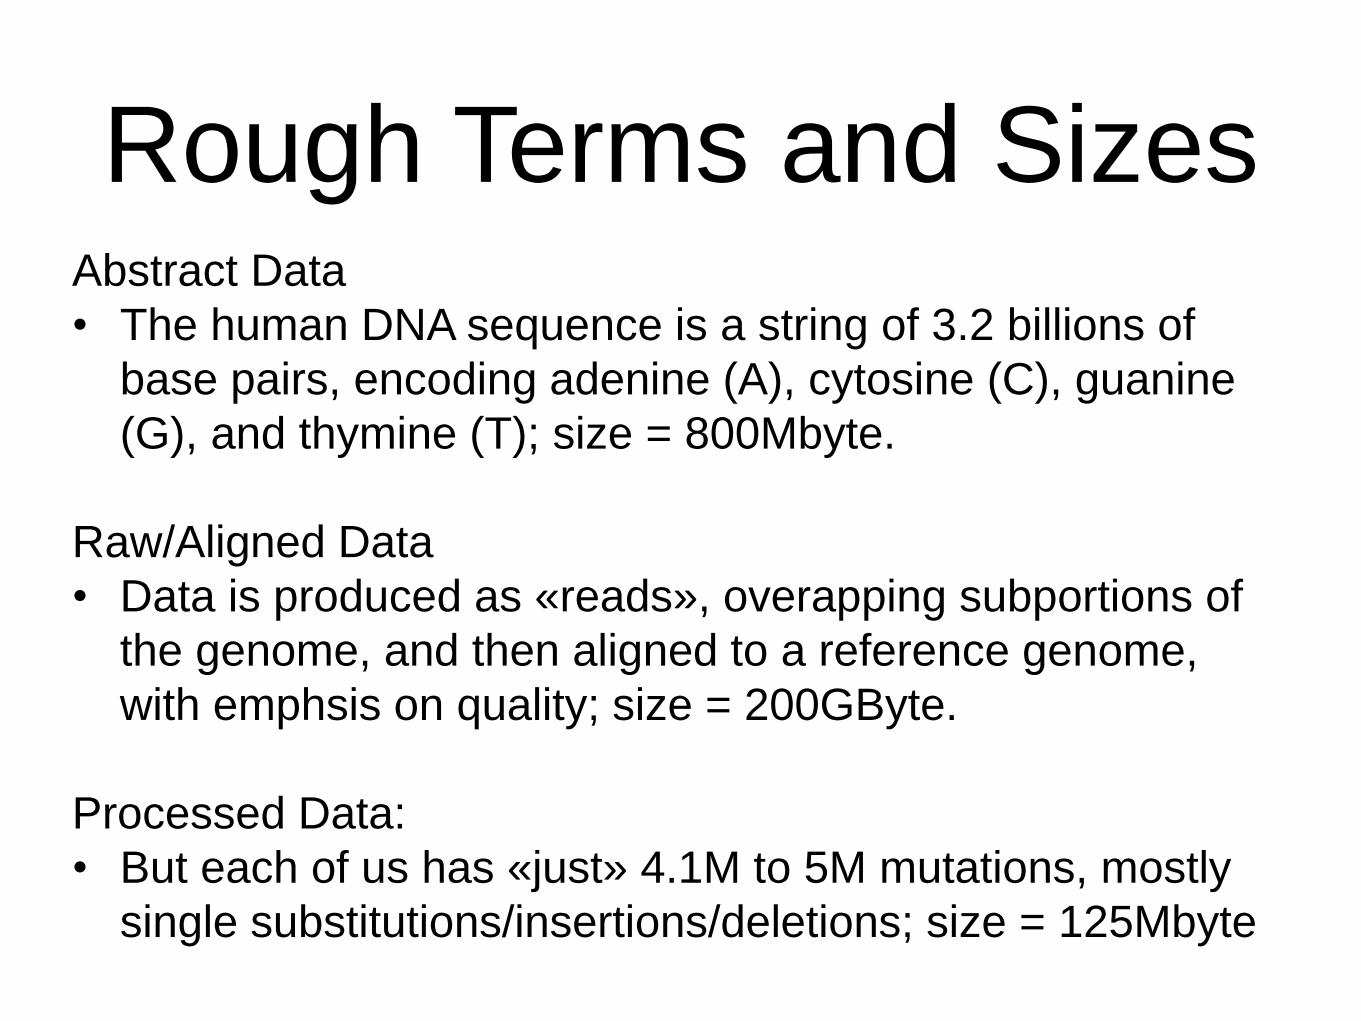
Rough Terms and SizesAbstract Data
• The human DNA sequence is a string of 3.2 billions of
base pairs, encoding adenine (A), cytosine (C), guanine
(G), and thymine (T); size = 800Mbyte.
Raw/Aligned Data
• Data is produced as «reads», overapping subportions of
the genome, and then aligned to a reference genome,
with emphsis on quality; size = 200GByte.
Processed Data:
• But each of us has «just» 4.1M to 5M mutations, mostly
single substitutions/insertions/deletions; size = 125Mbyte
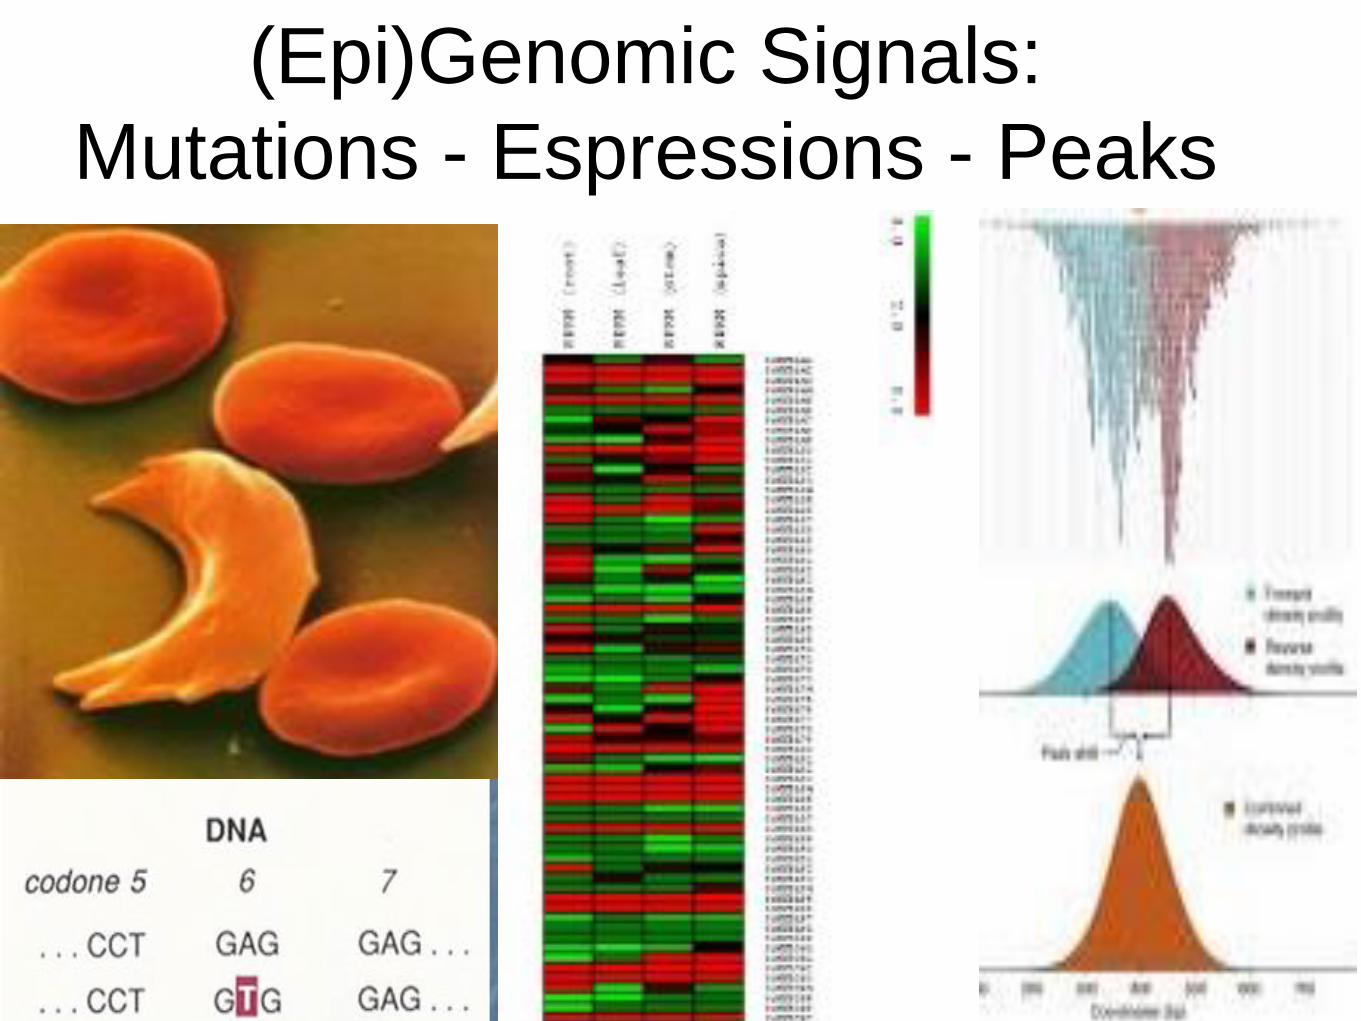
(Epi)Genomic Signals:
Mutations - Espressions - Peaks
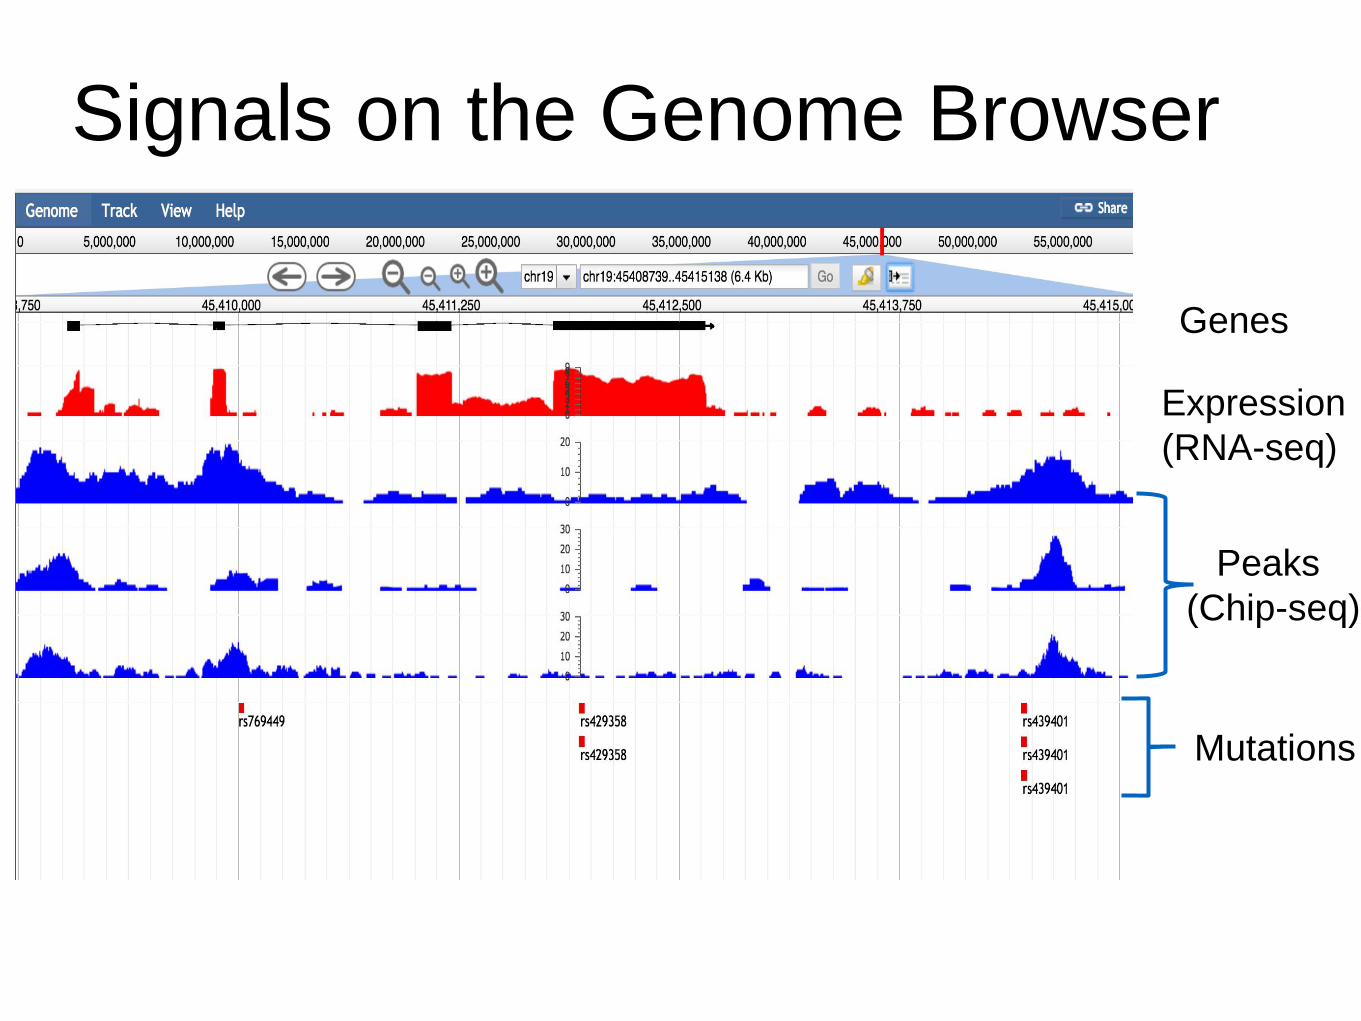
Expression
(RNA-seq)
Peaks
(Chip-seq)
Mutations
Genes
Signals on the Genome Browser

Source: http://blog.goldenhelix.com/grudy/a-hitchhiker%E2%80%99s-guide-to-next-generation-sequencing-part-2/
BIG DATA ANALYSIS WITH NEXT GENERATION SEQUENCING
• Analysis of hardware generated data, machine stats, etc.
• Production of sequence reads and quality scores
• QA filtering on raw reads
• Alignment/Assembly of reads
• QA and variant calling on aligned reads
• QA/QC of variant calls
Tertiary
analysis
• Annotation and filtering of variants
• Data aggregation and multi-sample processing
• Association analysis
• Population structure analysis
• Genome browser driven exploratory analysis
Primary
analysis
Secondary
analysis

A VIEW OF BIG DATA ANALYSIS PLAYERS
PRIMARY
ANALYSIS
TERTIARY
ANALYSISSECONDARY
ANALYSIS
• FireCloud
(Broad Inst.)
• Paradigm4
(Spinoff)
• GMQL/Geco
(PoliMi)
• DeepBlue
(Blueprint)

Which problems can we solve?
• Which cancer types can be explained by disregulation of
the tri-dimensional structure of the genome?
• Which co-occurring (killer) mutations cause the death of a
cell in given tumors?
• Which transcription factors (dimers) always occur
together?
• How can we assign predominant functions to each portion
of the genome?

A Short Story
of Genomic
Computing in
my Group at
Politecnico
(DEIB)
September 2012: Meeting at IEO-IIT; start of collaboration with
prof. Pier Giuseppe Pelicci et. Al.
March 2013 – current: Big group with: • Scientists: Daniele Braga, Alessandro Campi, Marco Masseroli, Matteo Matteucci,
Giampaolo Cugola, Heiko Muller
• PhD students: Anna Bernasconi ,Vahid Jalili, Fernando Palluzzi, Stefano Perna, Eirini
Stamoulakatou, Yuryi Vaskin, Francesco Venco
• Master strudents: Michele Bertoni, Ilaria Buonagurio, Simone Cattani, Andrea Gulino,
Luca Nanni, Ilaria Raciti,
• Post-docs: Arif Canakoglu, Abdulrahaman Kaitoua, Pietro Pinoli
March 2013 – Feb. 2016: PRIN Project Gendata 2020
(with: Math@PoliMi, Sapienza, Roma3, Unibo, PoliTo, UniBg, StataleMi,
UniSal, UniCal)
January 2015: first release of GMQL V1 (at Polimi and IEO-IIT)
March 2015: first accepted paper on BioInformatics
April 2016: GMQL V2 installed at CINECA
September 2106: kick-off advanced grant ERC
«Data-driven Genomic Computing»

DATA MODEL

Tumor_type = brca
Patient_age = 750.1 0.6
Tumor_type = brca
Patient_age = 63
Sex = Female0.5 0
Tumor_type = brca
Patient_age = 750.1 0 0.8 0.1
METADATA
GENOMIC DATA MODEL
REGIONS

MODEL RATIONALE
REGIONS
Meta-data are arbitrary attribute-value
pairs, independent from any
standardization attempt.
They trace the data provenance,
including biological and clinical aspects
Regions of the model describe processed
data, e.g. mutations, expression or
regulation; they have a schema, with 5
common attributes (ID, CHR, LEFT, RIGHT,
STRAND) and then arbitrary typed attributes.
They achieve interoperability across a
plethora of data formats
METADATA
SAMPLE AND DATASET
Every sample corresponds to an «experiment», with an ID.
Every dataset is a named collection of samples with the same schema.

Mutations (DNA-seq)
(id, (chr,start,stop,strand),
(A,G,C,T,del,ins,inserted,ambig,Max,Error,A2T,A2C,A2G,C2A,C2G,C2T))
(1, (chr1, 917179, 917180,*), (0,0,0,0,1,0,’.','.',0,0,0,0,0,0,0,0))
(1, (chr1, 917179, 917179,*), (0,0,0,0,0,1,G,'.',0,0,0,0,0,0,0,0))
GENOMIC DATA MODEL
Expression (RNA-seq)
(id, ((chr,start,stop,strand), (source,type,score,frame,geneID,transcriptID,RPKM1,RPKM2,iIDR))
(1, (chr8, 101960824, 101964847,-), ('GencodeV10', 'transcript', 0.026615, NULL, 'ENSG00000164924.11',
'ENST00000418997.1', 0.209968, 0.193078, 0.058))
Example of schemas
and instances

Annotations
(id, (chr,start,stop,strand), (proteinID,alignID,type))
(1, (chr1, 11873, 11873, +), ('uc001aaa.3', 'uc001aaa.3', 'cds'))
(1, (chr1, 11873, 12227, +), ('uc001aaa.3', 'uc001aaa.3', 'exon'))
(1, (chr1, 12612, 12721, +), ('uc001aaa.3', 'uc001aaa.3', 'exon'))
(1, (chr1, 13220, 14409, +), ('uc001aaa.3', 'uc001aaa.3', 'exon'))
ChIA-PET (denoting 3D genomic loops, head is assembled with coordinates, tail is in the schema)
(id,(chr,headstart,headstop,strand), (loopType, tailChr, tailStart, tailStop, PETcount, pValue, qValue))
(1, (chr1,7385626,7389841,*), ('Inter-Chromosome', chr17, 3081653, 3084755, 50, 0.0, 0.0)
GENOMIC DATA MODEL
Example of schemas
and instances
QUERY
LANGUAGE

QUERY
LANGUAGESEQUENCE OF
ALGEBRAIC
OPERATIONS
High-level, declarative operations which operate
both on regions and meta-data
→ each operation progressively builds the regions
and meta-data of its result
Inspired by Pig Latin and targeted towards cloud
computing
CLASSIC RELATIONAL OPERATIONS
SELECT
PROJECT
GROUP
ORDER/TOP
DOMAIN-SPECIFIC GENOMIC OPERATIONS
COVER
GENOMETRIC JOIN
MAP
UTILITIES
LOAD, MATERIALIZE
UNION
DIFFERENCE
MERGE
QUERY LANGUAGE

QUERY
LANGUAGE
OVERVIEW
PROMS = SELECT(annotationType == 'promoter') ANNOTATIONS;
PEAKS = SELECT(dataType == 'ChipSeq') ENCODE;
RESULT = MAP(peak_count AS COUNT) PROMS PEAKS;
# Samples # Regions Join(dist <0) Map(COUNT) Cover
10 ~1.9 M 14.66 sec. 20.29 sec. 19.25 sec.
50 ~8.8 M 23.86 sec. 43.08 sec 46.34 sec.
100 ~17.4 M 35.38 sec 74.43 sec. 79.02 sec.
1000 ~60 M 120.98 sec 473.39 sec 235.22 sec.
Executed over 2,423 ENCODE samples including a total of
83,899,526 peaks mapped to 131,780 promoters producing as
result 29 GB of data

Tumor_type = brca
Patient_age = 750.1 0.6
0.5 0
0.1 0 0.8 0.1
METADATA SELECTION
Selection of the samples
e.g. select patients younger than 70 years
QUERY LANGUAGE
Tumor_type = brca
Patient_age = 63
Sex = Female
Tumor_type = brca
Patient_age = 35

REGION SELECTION
Selection of the regions
e.g. select those regions which have a score greater than 0.5)
Tumor_type = brca
Patient_age = 75
Tumor_type = brca
Patient_age = 63
Sex = Female
0
Tumor_type = brca
Patient_age = 350.8
0.1 0.6
0.5
0.1 0 0.1
QUERY LANGUAGE

Left.feature = transcripts
Right.feature = enhancers
REGION JOIN (GenoMetric)
QUERY LANGUAGE
Join at min-distance:
Associate each region in the former dataset with the closest in the latter.
feature = transcripts
feature = enhancers
A B
1 2 3
A-1 B-3

Tumor_type = brca
Tumor_grade = g2
Tumor_grade = g3
COVER
Cover(2,ANY)
Find portions of the genome that are covered by at least two regions
Tumor_type = brca
Tumor_grade = g2
Tumor_type = brca
Tumor_grade = g2
Tumor_type = brca
Tumor_grade = g3
QUERY LANGUAGE
2 3 2 1 2 1 1

MAP
Region map
Compute an aggregate function (e.g. COUNT) on al the regions intersecting the reference
annotation = genes
provider = RefSeq
feature = SNP
A
Left annotation = genes
Left provider = RefSeq
Right features = SNP
2 4
B
QUERY LANGUAGE

QUERY LANGUAGE
Map operations, through
reference regions R, extract
and standardize genomic
features
Genomic Space Abstraction
MAP
HEAT MAP:
Visualization of the genome
space using intensity of colors
GENOMIC SPACE:
Simplified structured outcome,
ideal format for data analysis

QUERY LANGUAGE
GENOMIC SPACErepresents adjacency
matrices, i.e. networks
Genomic Space Abstraction
Network analysis
methods (e.g. page
rank, hub/authority,
community detection,..)

APPLICATIONS

Expression
(RNA-seq)
Peaks
(Chip-seq)
Mutations
Genes
Example of biological queryGiven three replicas of a Chip.Seq experiment, extract high-confidence
regions into one sample, identify which of these regions overlap with
given genes, and for each resulting region count ICG mutations and
select regions with at least one mutation.

Video
http://www.bioinformatics.deib.polimi.it/geco/?video

BIOLOGICAL
RESEARCH
joint work with
IEO (Pier
Giuseppe
Pelicci’s group)
and Harvard
IACS (Pavlos
Protopapas)

3D Structure and tumors
GENES = SELECT(tissue=="cortex") GTEx;
J1 = SELECT(cell=="imr90") TADs;
J2 = SELECT(cell=="gm12878") TADs;
PAIRS = JOIN(distance < 500000; CONTIG)
GENES GENES;
MAPPING_t = MAP() PAIRS J1;
MAPPING = MAP() MAPPING_t J2;
SAME = SELECT(left.id < right.id and L1.count == 0
and L2.count == 0) MAPPING;
CROSS = SELECT(left.id < right.id and L1.count > 1
and L2.count > 1) MAPPING;

Same/cross gene activity correlations
in normal vs tumor cells

Significantly disregulated
junctions in tumors

Other Biological Problems- DNA Sequencing of Microbioma in Cystic Fibrosis patients
who are colonized with mycobacterium abscessus [with D.
Costantini and L. Cariati (Policlinico Milano), Giovanni
Porta (U. Insubria), Rita Rossi Colwell (U. Maryland)].
- Identification of TFs that co-regulate genes in rigid and
compact pairs (dimers) [with Limsoon Wong (NUS
Singapore)].
- Search for “Killer Mutations” (pairs of mutations which
cannot be present together as they cause the death of the
cell [with Limsoon Wong (NUS Singapore)].
- Identification of TFs that co-occur with TEAD4 binding
sites [with Stefano Campaner (IEO-IIT)].
- Detect DNA areas where multiple TFs bind (dense TF
binding regions) [with Stefano Campaner (IEO-IIT)].

ARCHITECTURE

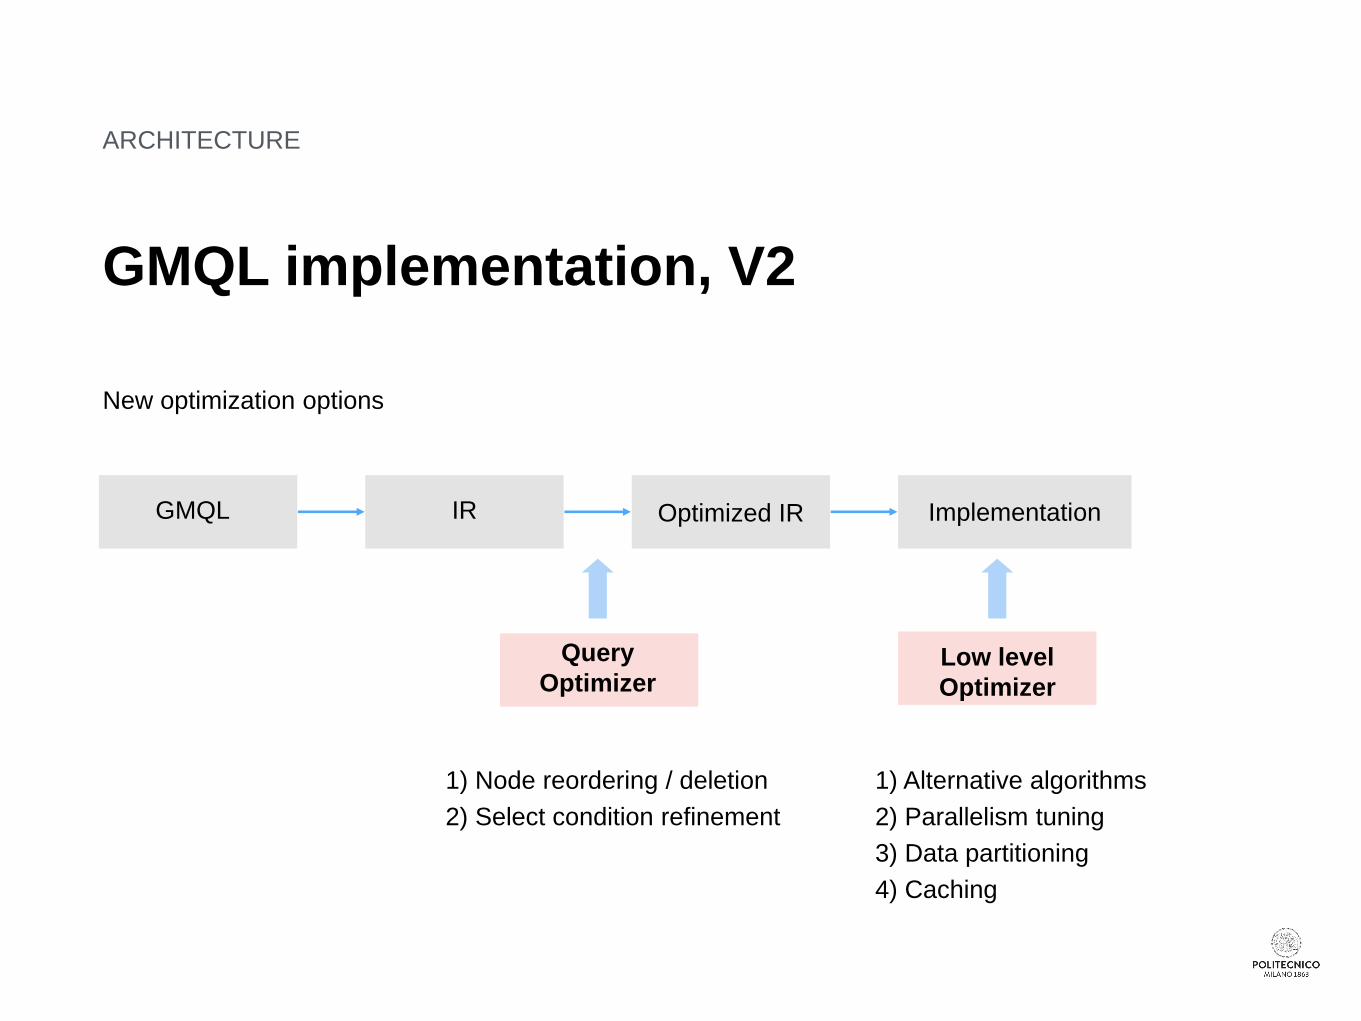
GMQL Implementation / V2
ARCHITECTURE
• A different approach, with language-independent intermediate representation
• Targeting also usability from within R and Galaxy
SEMANTICS
SYNTAX
IMPLEMENTATION
GMQLEmbedded
GMQL
Logical
GMQL
Flink SciDBSpark API TO IR
IR
ARCHITECTURE
GMQL implementation, V2
New optimization options
ImplementationOptimized IRIRGMQL
Query
OptimizerLow level
Optimizer
1) Node reordering / deletion
2) Select condition refinement
1) Alternative algorithms
2) Parallelism tuning
3) Data partitioning
4) Caching

ARCHITECTURE
Meta-first
ReadMD
StoreMD
ReadRD
StoreRD

VISION

Short-Term
Goals
DESCRIPTIVE STATISTICS
Provide automatic summarization describing result
samples; integrate classic significance or
regression tests within the query capabilities.
METADATA TRACING
Develop methods and tools supporting users in
explaining observed query outputs. The study of
data causality is based on determining data
lineage (or provenance), especially relevant with
queries over multiple sources
PATTERN-BASED REGION
EXTRACTION
Define complex patterns of genomic features
enabling the formulation of similarity queries (e.g.,
distal patterns, or using the notions of
similar/dense/sparse genomic regions).

Mid-Term
Goals
INTEGRATED REPOSITORY
Produce an integrated repository with semantically
well-defined and compatible metadata, by
integrating GDM with ENCODE, TCGA, 1000
Genomes and Roadmap Epigenomics (and
possibly other sources).
WEB SERVICES
Use GMQL for building several public web services
for solving general-purpose biological problems,
supporting powerful statistics to indicate the
significance of query results.
INTERACTION NETWORKS, MACHINE
LEARNING, DEEP LEARNING
Provide automatic interpretation of query results as
interaction networks or build tight integration with
data analysis methods, e.g., based upon machine
learning or deep learning.

Long-Term
Goals
SEMANTIC AND FEATURE-BASED
SEARCH
Develop semantic metadata search with semantic
query expansion (leveraging on available
ontologies e.g., OBO, UMLS) and region-based
search patterns. Provide results in ranking order
(as in classic search engines).
GENOMIC RECOMMENDERS
Trace query histories and build recommending
systems for the “best” ways of solving genomic
problems.
INTERNET OF GENOMES
Use GMQL as a basis for simple interaction
protocols for:
• Requesting information about remote datasets,
using both metadata and region schemas
• Sending a query and obtain data about its
compilation, (including also estimates of the data
sizes)
• Launching execution and then controlling the
staging resources and of communication load

Website:
http://www.bioinformatics.deib.polimi.it/geco/

COMPUTER SCIENCE COLLABORATIONS
• Roma1 University (Javier Fernandez, Maurizio
Lenzerini): Ontology-based meta-data
augmentation and query rewrite.
• Roma3 University (Emanuel Weitschek, Paolo
Atzeni, Riccardo Torlone): Integration with TCGA.
• University Bologna (Paolo Ciaccia, Ilaria Bartolini,
Piero Montanari): Supporting pattern-based
queries from the genome browser.
• Paradigm 4 (Marylin Matz, Mike Stonebraker):
SciDB Implementation.