data gone wrongtwvideo01.ubm-us.net/o1/vault/gdcnext2013/slides/emily... · 2013-11-12 · on this...
TRANSCRIPT

Data Gone Wrong Bad Tests,Terrible KPIs and Other Pitfalls
Emily Greer, Co-Founder & COO
$$$$$$$

Data is awesome

Data is also a hot mess

So who am I to talk? A shameless data geek! • Self-taught, not formally trained: I majored in Eastern European
Studies, not math or econ. • Stumbled into direct marketing after college and fell in love
with data • I taught myself SQL because I hated waiting for IT to pull my
data, took math & econ classes to understand a bit more theory • After 10 years in catalogs & e-commerce and a near-miss with
econ grad school I co-founded Kongregate

Don’t Be Intimidated You don’t need a PhD in stats to get data analysis right You can easily get it wrong even if you have one (I’m not saying it doesn’t help, just that it’s not essential)
Get Paranoid
Under an apparently solid surface data is usually a steaming pile of shit
And even when your data is accurate it’s still deceiving


These are two games in the same genre. Game 2 has a slightly (+5%) higher D1 & D7 retention. Game 1 has slightly higher conversion to paid (+15%). Daily ARPPU averages about $27 for both. Lifetime ARPU should be fairly close between the games since conversion and ARPPU are similar, right?
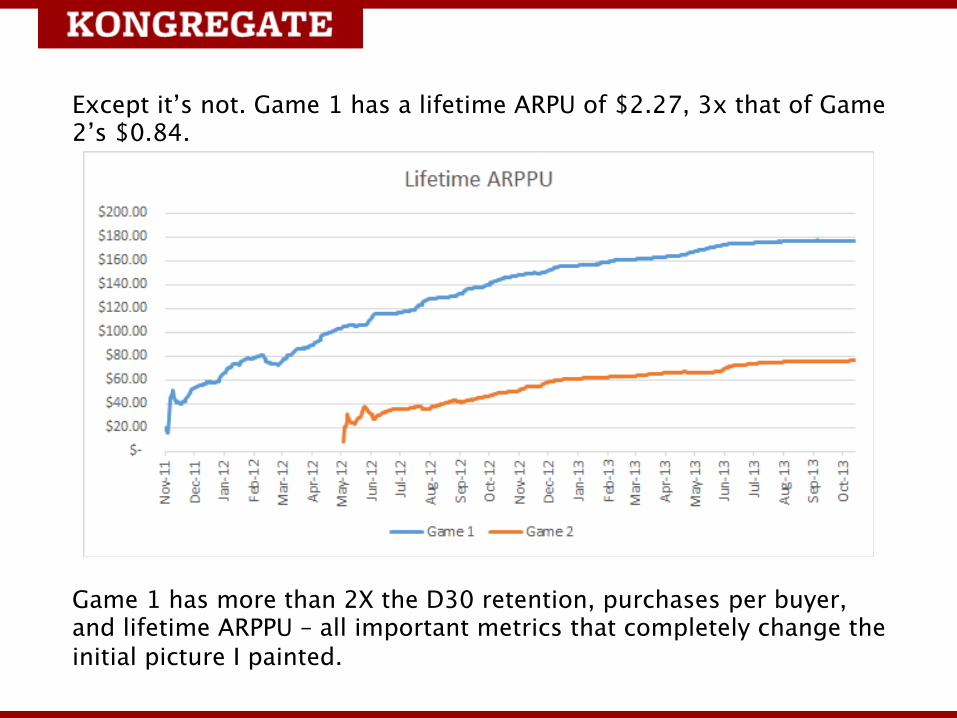
Except it’s not. Game 1 has a lifetime ARPU of $2.27, 3x that of Game 2’s $0.84.
Game 1 has more than 2X the D30 retention, purchases per buyer, and lifetime ARPPU – all important metrics that completely change the initial picture I painted.

You’re a detective
The witnesses may be lying or confused. The crime scene may have been tampered with. You can’t trust any one piece of evidence but by cross-checking them against each other you can figure out what’s true and false. Goal: create a 3-dimensional view of your players and game.
Trap #1: Ignoring Audience Mix
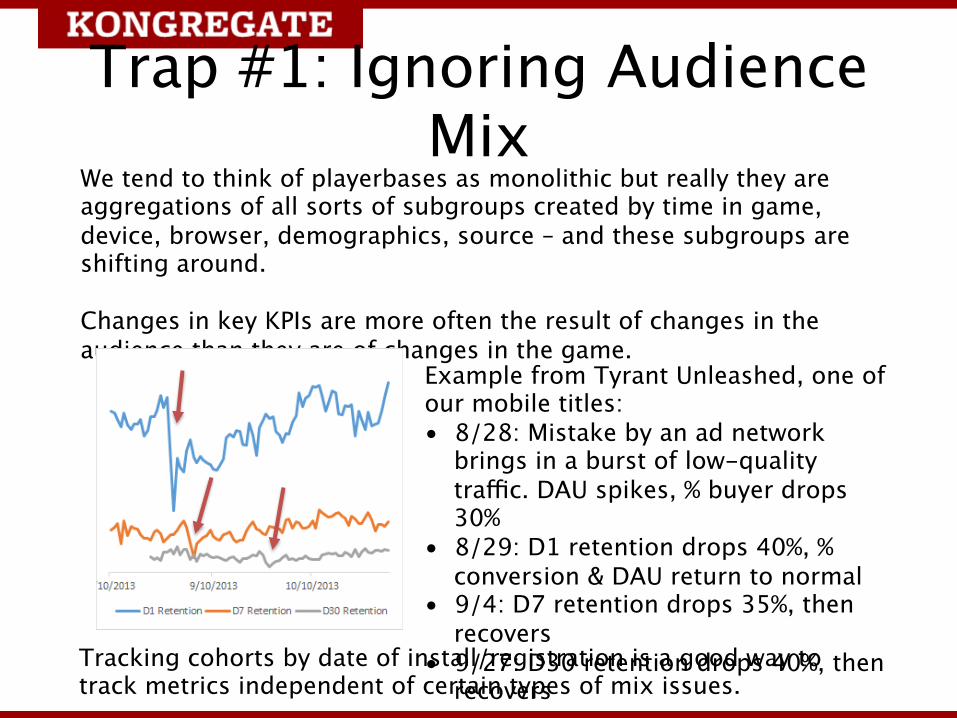
We tend to think of playerbases as monolithic but really they are aggregations of all sorts of subgroups created by time in game, device, browser, demographics, source – and these subgroups are shifting around. Changes in key KPIs are more often the result of changes in the audience than they are of changes in the game. Example from Tyrant Unleashed, one of
our mobile titles: • 8/28: Mistake by an ad network
brings in a burst of low-quality traffic. DAU spikes, % buyer drops 30%
• 8/29: D1 retention drops 40%, % conversion & DAU return to normal
• 9/4: D7 retention drops 35%, then recovers
• 9/27: D30 retention drops 40%, then recovers
Tracking cohorts by date of install/registration is a good way to track metrics independent of certain types of mix issues.
Audience Mix: Averages are Average
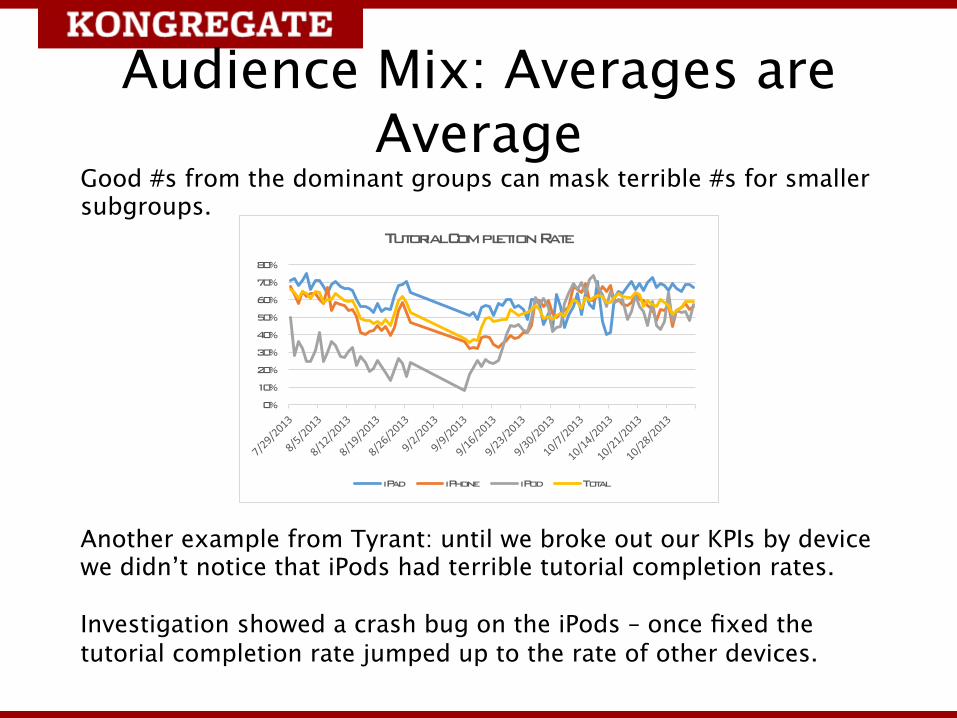
Good #s from the dominant groups can mask terrible #s for smaller subgroups.
Another example from Tyrant: until we broke out our KPIs by device we didn’t notice that iPods had terrible tutorial completion rates. Investigation showed a crash bug on the iPods – once fixed the tutorial completion rate jumped up to the rate of other devices.
0%
10%
20%
30%
40%
50%
60%
70%
80%
Tutorial Completion Rate
iPad iPhone iPod Total
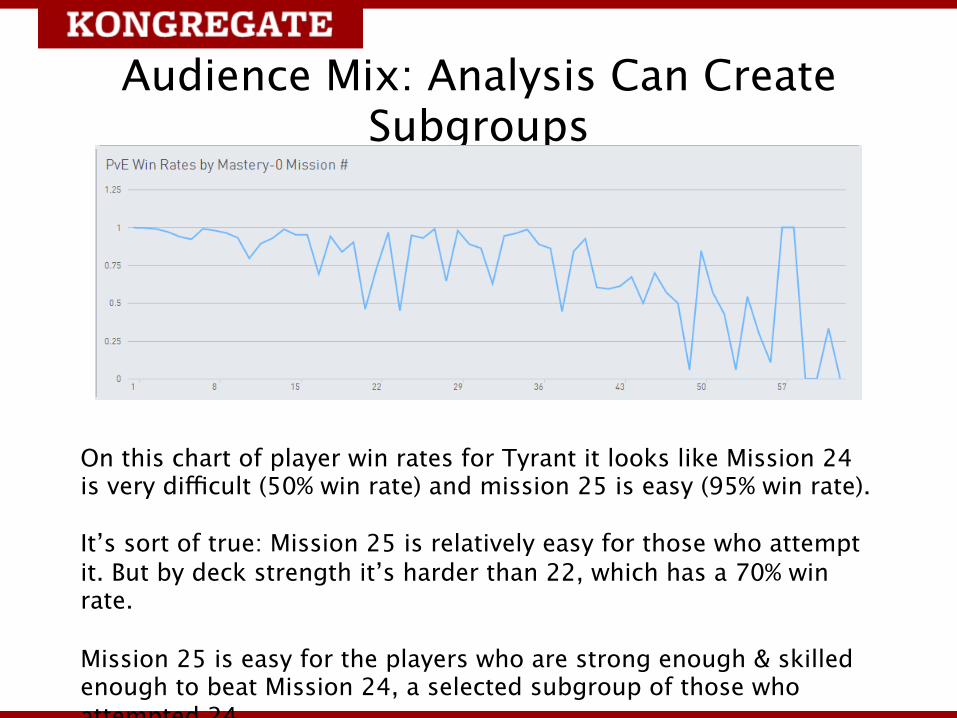
Audience Mix: Analysis Can Create Subgroups
On this chart of player win rates for Tyrant it looks like Mission 24 is very difficult (50% win rate) and mission 25 is easy (95% win rate). It’s sort of true: Mission 25 is relatively easy for those who attempt it. But by deck strength it’s harder than 22, which has a 70% win rate. Mission 25 is easy for the players who are strong enough & skilled enough to beat Mission 24, a selected subgroup of those who attempted 24.
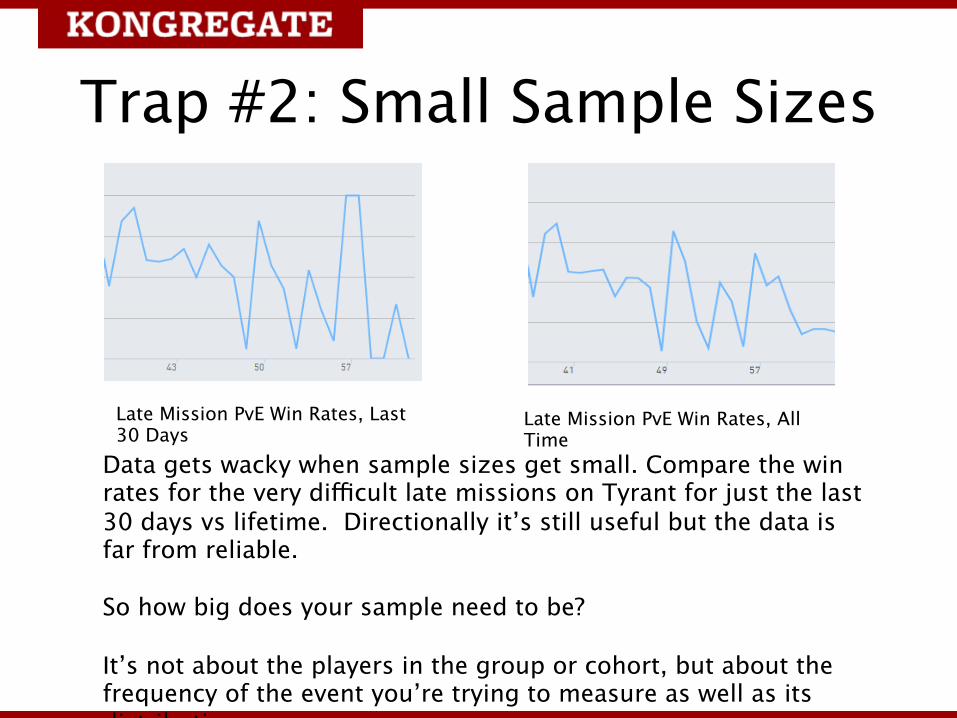
Trap #2: Small Sample Sizes
Data gets wacky when sample sizes get small. Compare the win rates for the very difficult late missions on Tyrant for just the last 30 days vs lifetime. Directionally it’s still useful but the data is far from reliable. So how big does your sample need to be? It’s not about the players in the group or cohort, but about the frequency of the event you’re trying to measure as well as its distribution.
Late Mission PvE Win Rates, Last 30 Days
Late Mission PvE Win Rates, All Time

Trap #3: Nothing is Normal The most important metrics (revenue, sessions, battles, etc) in games are all power distributions Your business is driven by outliers, and their presence or absence distorts almost any data you look at. Your outliers are your best players so it’s a good idea to do individual analysis on them to understand who they are, what drives them, and what they’re most likely to distort. Binary “yes/no” metrics like % buyer, D7 retention, tutorial completion are a lot more stable than averages involving revenue and engagement like ARPPU, $/DAU, Avg Sessions, and can be looked at in much smaller samples.

Trap #4: Correlation != Causation
We’ve all heard this a 1000 times but we need to keep hearing it because we all make this same mistake over and over and over.
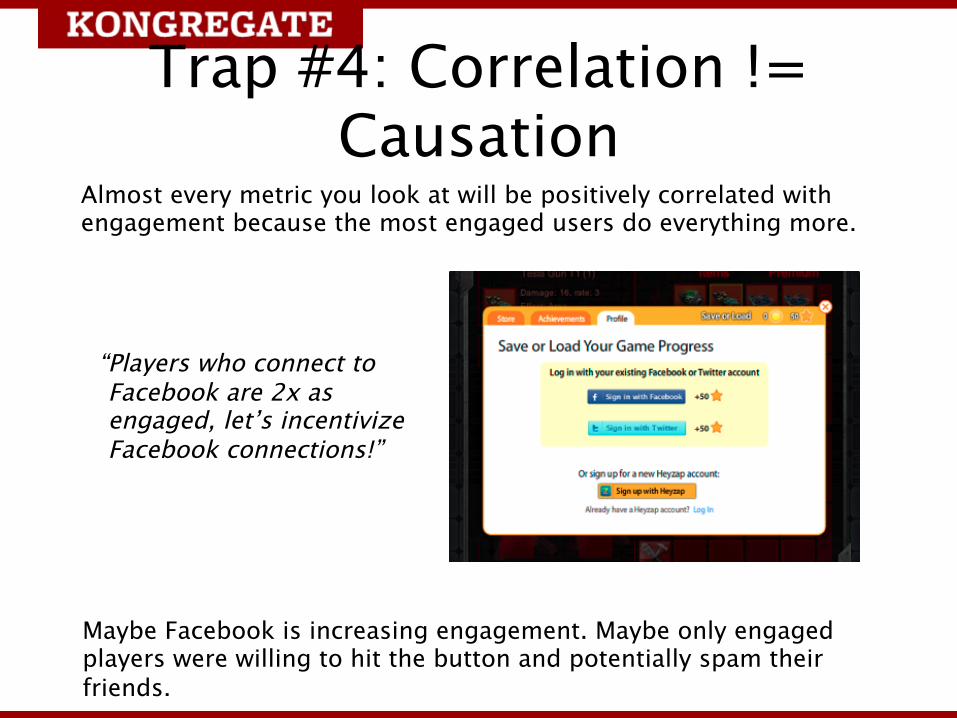
Trap #4: Correlation != Causation
Almost every metric you look at will be positively correlated with engagement because the most engaged users do everything more.
Maybe Facebook is increasing engagement. Maybe only engaged players were willing to hit the button and potentially spam their friends.
“Players who connect to Facebook are 2x as engaged, let’s incentivize Facebook connections!”

A/B Tests
But testing has real costs in engineering time & overhead, complexity, and divisions/confusions for the players, and the more you’re running the worse that gets. Concentrate on tests that answer important questions, not trivial optimizations.
This is the real way to separate correlation from causation and understand what’s really going on.
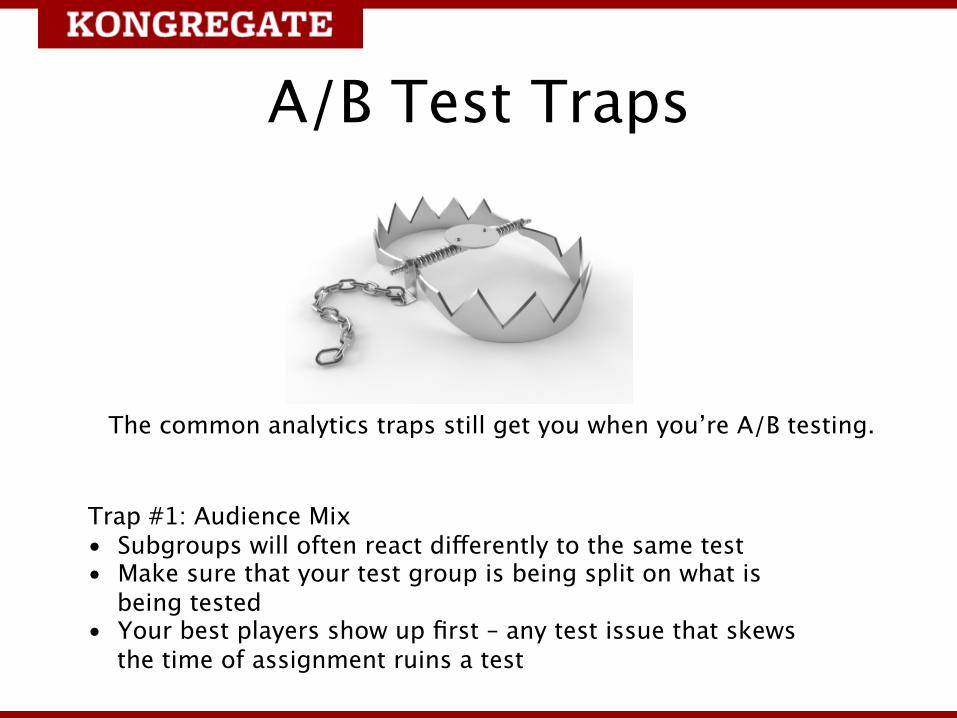
A/B Test Traps
Trap #1: Audience Mix • Subgroups will often react differently to the same test • Make sure that your test group is being split on what is
being tested • Your best players show up first – any test issue that skews
the time of assignment ruins a test
The common analytics traps still get you when you’re A/B testing.
A/B Test Traps #2 & #3: Small Sample Sizes & Power
Distributions
Don’t look at early test results except to make sure the test isn’t totally broken. Test on the most stable relevant metric, for example % Buyer rather than ARPU. If you’re testing something that has to be judged on a metric with a power distribution then check the distribution of your outliers. How big should your test sample be? The bigger the better.

A/B Test Trap #5: Blind Trust in Statistical Significance If you do a test that shows a 5% lift, and the test is statistically significant it doesn’t mean that there’s actually a 5% lift. There’s a small chance there’s no lift at all.
Conversely if you do a test that doesn’t show a lift, or doesn’t pass the significance test for a small lift that doesn’t mean there ISN’T a lift. Having a larger sample size is like running the test again and averaging the results.

A/B Test Trap #6: Ignoring Downstream Effects
Tests can have unintended consequences, you should look at additional metrics beyond the one being tested to make sure that you get the full picture. Commercial A/B products often make you choose one metric for a test to prevent you from fishing for the good result to decide the test on. I think it’s more important to understand the full effects of the change that you made (though fishing is bad, too.)

Not Everything is Testable Some changes are really not testable (or removable) without significant inconvenience or unfairness to the player. Some changes don’t have a high enough frequency of events to be tested. Some changes require very high amounts of engineering effort to test. Helpful tricks when testing is difficult: • Test the promotion/prominence of a feature (login options) • Look for natural experiments • Track changes in performance on a controlled subgroup

Stay Paranoid Lots of the issues are ones people understand when they stop to think, but forget about in the rush of day-to-day work. The ultimate key to good data analysis is to question every piece of information, every day.

Special thanks to Alex Jaffe, PhD for help with this talk.
For more talks & this data visit developers.kongregate.com For web games contact us at [email protected] If you’re interested in mobile publishing it’s [email protected] Follow us on Twitter: @EmilyG & @KongregateDevs