data independent radar beamforming algorithms for …jpier.org/pier/pier107/20.10061001.pdf ·...
TRANSCRIPT
Progress In Electromagnetics Research, Vol. 107, 331–348, 2010
DATA INDEPENDENT RADAR BEAMFORMINGALGORITHMS FOR BREAST CANCER DETECTION
D. Byrne, M. O’Halloran, M. Glavin, and E. Jones †
College of Engineering and InformaticsNational University of Ireland GalwayUniversity Road, Galway, Ireland
Abstract—Ultra wideband (UWB) Microwave imaging is one ofthe most promising emerging imaging technologies for breast cancerdetection, and is based on the dielectric contrast between normaland cancerous tissues at microwave frequencies. UWB radar imaginginvolves illuminating the breast with a microwave pulse and reflectedsignals are used to determine the presence and location of significantdielectric scatterers, which may be representative of cancerous tissuewithin the breast. Beamformers are used to spatially focus the reflectedsignals and to compensate for path dependent attenuation and phaseeffects. While these beamforming algorithms have often been evaluatedin isolation, variations in experimental conditions and metrics promptsthe assessment of the beamformers on common anatomically anddielectrically representative breast models in order to effectivelycompare the performance of each. This paper seeks to investigate thefollowing beamforming algorithms: Monostatic and Multistatic Delay-And-Sum (DAS), Delay-Multiply-And-Sum (DMAS) and ImprovedDelay-And-Sum (IDAS). The performance of each beamformer isevaluated across a range of appropriate metrics.
1. INTRODUCTION
In 2009, there were approximately 1.5 million new cases of breastcancer documented in the US alone [1], while the estimated mortalityrate in Europe was over 1.7 million [2]. The current de factobreast cancer screening method is X-Ray mammography, and despite
Received 10 June 2010, Accepted 30 June 2010, Scheduled 17 August 2010Corresponding author: D. Byrne ([email protected]).
† All are also with Bioelectronics Research Cluster, National Centre for BiomedicalEngineering Science (NCBES), National University of Ireland Galway, University Road,Galway, Ireland.
332 Byrne et al.
success in detecting early stage breast cancer, there are a numberof well documented limitations with the technology [3, 4]. MRIoffers improved image quality compared to X-Ray and although non-ionizing and non-invasive, high operating costs make it unsuitablefor mass screening. Ultrasound imaging, although less expensive, islimited by resolution and issues of speckle in the resultant images.Such limitations have prompted the investigation of improved breastimaging technologies, in order to accurately diagnose breast cancer atminimum risk and discomfort to the patient.
One such promising modality is microwave breast imaging,which uses backscattered radar signals to identify canceroustissue within the breast. Microwave imaging of the breastcan be categorized by three distinct approaches: UWB radarimaging [5–10], Microwave Tomography [11, 12] and Hybrid imagingtechniques [13, 14]. Microwave Tomography attempts to reconstructthe entire dielectric profile of the breast from the solution of aninverse scattering problem. Hybrid techniques like Microwave-InducedThermoacoustic Tomography [13] is based on the principle thatelectromagnetic (EM) energy absorbed by malignant tissue will inducesonic reverberations, which can be detected by a transducer.
Finally, UWB radar imaging involves illuminating the breast witha sub-nanosecond microwave pulse. The dielectric contrast betweentissue types, notably malignant and normal breast tissues, generateEM reflections within the breast. These reflections are recorded anda time-domain image-formation algorithm (beamformer) is applied todetermine the spatial location of any dielectric scatterer present. Data-Independent (DI) beamformers use an assumed propagation model tocompensate for path dependent attenuation and dispersion [5–8].
Several factors make it difficult to directly compare theperformance of beamforming algorithms:• The use of very different numerical breast phantoms, with 2D and
3D beamformer evaluations [7, 8, 15, 16] and significant variationsin the level of modeled heterogeneity [17–20].
• The use of different radar configurations (Monostatic [6, 7] andMultistatic [10, 15]).
• Variations in antenna array geometry [21].This paper attempts to examine the performance of several DIbeamforming algorithms using common anatomically-accurate breastmodels. The paper is organized as follows: Section 2 details thevarious DI beamforming algorithm, while the numerical breast modelmodel is documented in Section 3. Performance metrics are describedin Section 4 and results are presented and discussed in Section 5.Concluding remarks are outlined in the final section.
Progress In Electromagnetics Research, Vol. 107, 2010 333
2. DATA-INDEPENDENT METHODS
A DI beamformer uses an assumed propagation model to approximatea desired response independent of the input signal data. MostDI beamforming algorithms are based on a classical broadbandbeamformer, where the algorithm approximates the propagation delaysof the signals in order to focus the combined response at a specificlocation. In this section a detailed description of the Monostaticand Multistatic Delay-And-Sum (DAS), Delay-Multiply-And-Sum(DMAS) and Improved-Delay-And-Sum (IDAS) beamformers ispresented. DMAS and IDAS are Multistatic algorithms.
2.1. Delay-And-Sum
The original Monostatic Delay-And-Sum (DAS) beamformer is basedon the Confocal Microwave Imaging approach [5]. In a Monostaticbeamformer, a UWB microwave signal illuminates the breast andmicrowave energy scattered by potential tumor sites are recordedby the transmitting antenna array element. The DAS beamformerinvolves time-shifting and summing the backscattered signals fromthe breast to create a synthetic focus. If a tumor exists at aspecific focal point, then the returns from the tumor site will addcoherently. Returns from clutter due to variations in tissue types willadd incoherently, and therefore will be suppressed. The energy at thissynthetic focus is measured and stored, and an energy profile of thebreast is created by varying the position of the synthetic focus withinthe breast.
Consider M Monostatic antennas and let Sn denote the nthbackscattered signal, then the energy associated with the focal point(r = [x, y, z]
)within the breast is defined as:
I(r) =∫ Twin
0
[M∑
n=1
Sn
(t− τn(r)
)]2
dt (1)
with the nth discrete time delay is described as τn(r) = (2dn(r))/(vTs),where dn(r) = |r − rn| describes the discrete time distance betweenthe nth transmitting antenna rn and the focal point r, v describesthe average velocity of signal propagation in breast tissue, Twin is thewindow length and Ts is the sampling interval.
Li et al. [6] modified the traditional DAS algorithm in order tocompensate for 2D Radial spreading of the UWB pulse. Updating
334 Byrne et al.
(Eq. (1)) to:
I(r) =∫ Twin
0
[M∑
n=1
wnSn
(t− τn(r)
)]2
dt (2)
where wn is the weight component introduced. Furthermore,Fear et al. [7] compensated for radial spreading of the UWB pulse in a3D system with the application of a weight (1/(|r− rn|)) for a planarantenna configuration.
Nilavavan et al. [22] developed the first Multistatic DASbeamformer, where the breast is illuminated by each antennasequentially and the backscatter energy is recorded at all antennaarray elements. The increased number of recorded channels reflectedoutwards via various propagation paths through the tissue acquiresmore information about scatterers in the breast. M2 signals arerecorded in a Multistatic system but, due to reciprocity, onlyM(M + 1)/2 signals are required for the calculation of the energyprofile.
2.2. Improved Delay-And-Sum
Klemm et al. [23] atttempted to improve the traditional DASbeamformer by introducing an additional weighting factor, called theQuality Factor (QF), which is a measure of the coherence of UWBbackscattering at a particular focal point within the breast. At thefocal point (r), energy is collected across a window for each Multistaticsignal and stored. The energy from the focal point is then cumulativelysummed and plotted against the number of channels used in theprocess. A second order polynomial is fitted to the normalized energycollection curve (y = ax2 + bx + c) with a assumed to be the QualityFactor. To re-scale the energy collection curve, normalization is carriedout by the multiplication of
(1
1+σe
), where σe is the standard deviation
of the energy of all Multistatic radar signals. The Improved DAS(IDAS) energy equation is represented by:
I(r) = QF (r) ·∫ Twin
0
[M(M+1)/2∑
n=1
wnSn(t− τn(r))
]2
dt (3)
2.3. Delay-Multiply-And-Sum
Another variant of the DAS beamformer is the Delay-Multiply-and-Sum (DMAS) beamformer developed by Lim et al. [24]. This algorithminvolves signals being time-shifted (as in DAS), multiplied in pairs and
Progress In Electromagnetics Research, Vol. 107, 2010 335
their products summed in order to calculate the energy at a focal point.The energy at (r) can be described as:
I(r) =∫ Twin
0
[M−1∑
n=1
M∑
j=(n+1)
Sn
(t− τn(r)
)Sj
(t− τj(r)
)]2
dt (4)
where M describes the number of channels in the system. Lim’sapproach was tested on a homogenous breast model with dielectricdata similar to those used by Fear et al. [7].
3. NUMERICAL MODEL
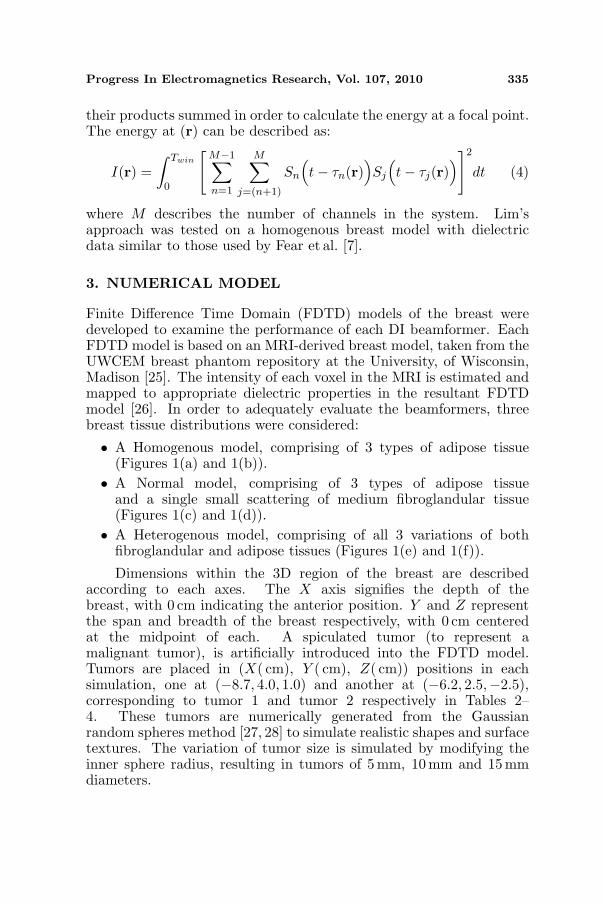
Finite Difference Time Domain (FDTD) models of the breast weredeveloped to examine the performance of each DI beamformer. EachFDTD model is based on an MRI-derived breast model, taken from theUWCEM breast phantom repository at the University, of Wisconsin,Madison [25]. The intensity of each voxel in the MRI is estimated andmapped to appropriate dielectric properties in the resultant FDTDmodel [26]. In order to adequately evaluate the beamformers, threebreast tissue distributions were considered:
• A Homogenous model, comprising of 3 types of adipose tissue(Figures 1(a) and 1(b)).
• A Normal model, comprising of 3 types of adipose tissueand a single small scattering of medium fibroglandular tissue(Figures 1(c) and 1(d)).
• A Heterogenous model, comprising of all 3 variations of bothfibroglandular and adipose tissues (Figures 1(e) and 1(f)).
Dimensions within the 3D region of the breast are describedaccording to each axes. The X axis signifies the depth of thebreast, with 0 cm indicating the anterior position. Y and Z representthe span and breadth of the breast respectively, with 0 cm centeredat the midpoint of each. A spiculated tumor (to represent amalignant tumor), is artificially introduced into the FDTD model.Tumors are placed in (X( cm), Y ( cm), Z( cm)) positions in eachsimulation, one at (−8.7, 4.0, 1.0) and another at (−6.2, 2.5,−2.5),corresponding to tumor 1 and tumor 2 respectively in Tables 2–4. These tumors are numerically generated from the Gaussianrandom spheres method [27, 28] to simulate realistic shapes and surfacetextures. The variation of tumor size is simulated by modifying theinner sphere radius, resulting in tumors of 5 mm, 10 mm and 15mmdiameters.
336 Byrne et al.
Z (cm)
Y (
cm
)
-4 -2 0 2 4 6
6.5
4.5
2.5
0.5
-1.5
-3.5
-5.5
-7.5Skin
Adipose High
Adipose Med
Adipose Low
Fibro Low
Fibro Med
Fibro High
Tumor
(a)
Y (cm)
X (
cm
)
6.5 4.5 2.5 0.5 -1.5 -3.5 -5.5 -7.5
-1.3
-3.3
-5.3
-7.3
-9.3
-11.3
-13.3
Skin
Adipose High
Adipose Med
Adipose Low
Fibro Low
Fibro Med
Fibro High
Tumor
(b)
Z (cm)
Y (
cm
)
-4 -2 0 2 4 6
6.5
4.5
2.5
0.5
-1.5
-3.5
-5.5
-7.5Skin
Adipose High
Adipose Med
Adipose Low
Fibro Low
Fibro Med
Fibro High
Tumor
(c)
Y (cm)
X (
cm
)
6.5 4.5 2.5 0.5 -1.5 -3.5 -5.5 -7.5
-1.3
-3.3
-5.3
-7.3
-9.3
-11.3
-13.3
Skin
Adipose High
Adipose Med
Adipose Low
Fibro Low
Fibro Med
Fibro High
Tumor
(d)
Z (cm)
Y (
cm
)
-4 -2 0 2 4 6
6.5
4.5
2.5
0.5
-1.5
-3.5
-5.5
-7.5Skin
Adipose High
Adipose Med
Adipose Low
Fibro Low
Fibro Med
Fibro High
Tumor
(e)
Y (cm)
X (
cm
)
6.5 4.5 2.5 0.5 -1.5 -3.5 -5.5 -7.5
-1.3
-3.3
-5.3
-7.3
-9.3
-11.3
-13.3
Skin
Adipose High
Adipose Med
Adipose Low
Fibro Low
Fibro Med
Fibro High
Tumor
(f)
Figure 1. Three breast tissue models with a tumor at (−8.7, 4.0, 1.0).(a) Homogenous model Y -Z slice. (b) Homogenous model X-Y slice.(c) Normal model Y -Z slice. (d) Normal model X-Y slice. (e)Heterogenous model Y -Z slice. (f) Heterogenous model X-Y slice.
The dispersive properties of breast tissue are incorporated intothe FDTD model using a single-pole Debye model [29] of the followingform:
ε∗r(ω) = εr +σ
jωε0+
χ1
1 + jωt0(5)
Progress In Electromagnetics Research, Vol. 107, 2010 337
The dielectric properties for the variations of adipose and fi-broglandular tissue are based on the results described by Zas-trow et al. [26]. Skin debye parameters are obtained from publisheddata by Gabriel et al. [30], while debye values representing malignant
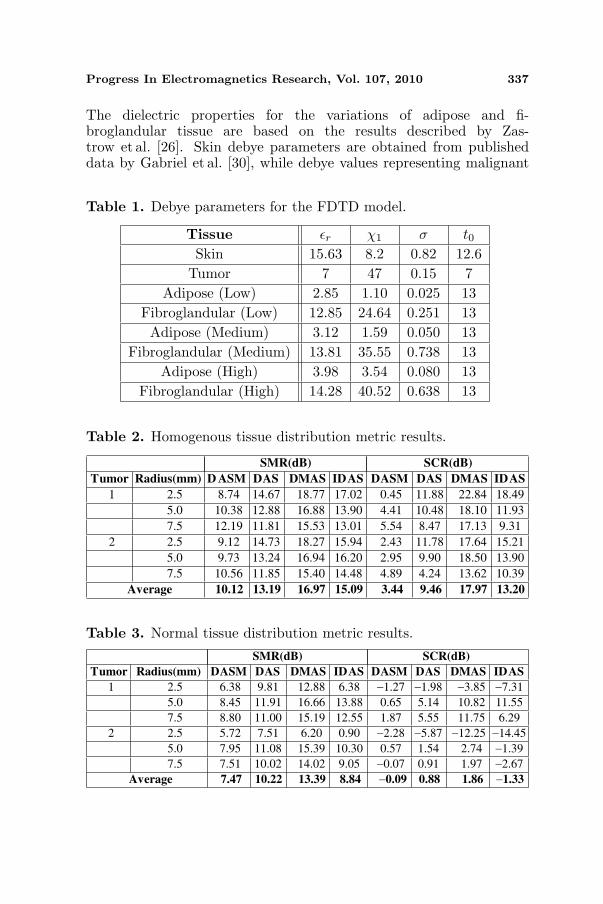
Table 1. Debye parameters for the FDTD model.
Tissue εr χ1 σ t0Skin 15.63 8.2 0.82 12.6
Tumor 7 47 0.15 7Adipose (Low) 2.85 1.10 0.025 13
Fibroglandular (Low) 12.85 24.64 0.251 13Adipose (Medium) 3.12 1.59 0.050 13
Fibroglandular (Medium) 13.81 35.55 0.738 13Adipose (High) 3.98 3.54 0.080 13
Fibroglandular (High) 14.28 40.52 0.638 13
Table 2. Homogenous tissue distribution metric results.
SMR (dB) SCR (dB)
Tumor Radius (mm) D ASM DAS DMAS IDAS DASM DAS DMAS IDAS
1 2.5 8.74 14.67 18.77 17.02 0.45 11.88 22.84 18.49
5.0 10.38 12.88 16.88 13.90 4.41 10.48 18.10 11.93
7.5 12.19 11.81 15.53 13.01 5.54 8.47 17.13 9.31
2 2.5 9.12 14.73 18.27 15.94 2.43 11.78 17.64 15.21
5.0 9.73 13.24 16.94 16.20 2.95 9.90 18.50 13.90
7.5 10.56 11.85 15.40 14.48 4.89 4.24 13.62 10.39
Average 10.12 13.19 16.97 15.09 3.44 9.46 17.97 13.20
Table 3. Normal tissue distribution metric results.
SMR(dB) SCR(dB)
Tumor Radius(mm) DASM DAS DMAS IDAS DASM DAS DMAS IDAS
1 2.5 6.38 9.81 12.88 6.38 −1.27 −1.98 −3.85 −7.31
5.0 8.45 11.91 16.66 13.88 0.65 5.14 10.82 11.55
7.5 8.80 11.00 15.19 12.55 1.87 5.55 11.75 6.29
2 2.5 5.72 7.51 6.20 0.90 −2.28 −5.87 −12.25 −14.45
5.0 7.95 11.08 15.39 10.30 0.57 1.54 2.74 −1.39
7.5 7.51 10.02 14.02 9.05 −0.07 0.91 1.97 −2.67
Average 7.47 10.22 13.39 8.84 −0.09 0.88 1.86 −1.33

338 Byrne et al.
Table 4. Heterogenous tissue distribution metric results.
SMR (dB) SCR(dB)
Tumor Radius(mm) DASM DAS DMAS IDAS DASM DAS DMAS IDAS
1 2.5 2.78 −4.71 −14.24 −18.95 −5.21 −12.23 −24.90 −28.76
5.0 4.99 2.19 0.19 −9.82 −3.21 −4.75 −10.01 −19.66
7.5 5.05 1.92 −0.15 −7.68 −3.03 −4.88 −10.39 −17.75
2 2.5 0.98 −1.96 −8.76 −13.58 −6.30 −9.58 −19.87 −24.88
5.0 2.81 3.55 2.99 −7.55 −4.41 −3.48 −7.73 −18.86
7.5 2.20 2.07 0.66 −8.00 −5.08 −4.74 −9.70 −19.19
Average 3.14 0.51 −3.22 −10.93 −4.54 −6.61 −13.77 −21.52
Figure 2. Antenna configuration.
tissue are taken from Bond et al. [8]. The breast is surrounded by asynthetic material matching the dielectric properties of skin. All sin-gle pole debye parameters are described in Table 1. The overall FDTDgrid size is approximately 28.8 million cubic cells, the grid resolution is(1mm(dx)× 1mm(dy)× 1mm(dz)) and the time step dt is defined as0.833 ps (dx/2c), where c is the speed of light in a vacuum. The FDTDgrid is terminated on each side by a 12 layer UPML [31] in order tominimize edge reflections. In total, 18 FDTD simulations were carriedout, based on three distributions of tissue, the two tumor locations andthe three different tumor sizes.
A cylindrical antenna array [7], consisting of half-wavelengthdipole antennas, is placed around the breast. Fifty three antennas

Progress In Electromagnetics Research, Vol. 107, 2010 339
are arranged on five rings, as illustrated in Figure 2. The antennaarray elements are placed on the skin, with a uniform spacing of22mm between each ring along the X axis. The UWB input pulseis a 120 ps differentiated Gaussian pulse, with a center frequency of7.5GHz and a −3 dB bandwidth of 9 GHz. The wavelength of thewaveguide in breast tissue is approximately 4 cm, dictating the lengthof the dipole at 2 cm. An ideal artifact removal algorithm is applied tothe backscattered signals to remove the input signal and any reflectionfrom the skinbreast interface, as previously used by Xie et al. [10].Prior to any signal processing, all FDTD signals are downsampledfrom 1200 GHz to 50GHz.
4. METRICS
The following metrics are used in order to evaluate each beamformersperformance:
• Signal to Mean ratio (SMR)• Signal to Clutter ratio (SCR)
The Signal to Mean ratio (SMR) describes the ratio of the tumorresponse to the average energy response of all tissue types within thebreast. The Signal to Clutter ratio (SCR) is defined as the ratio of thetumor response to the maximum clutter response in the same breast.This response is assumed to be the peak energy outside the area definedby twice the the physical extent of the tumor, or Full Width HalfMaximum (FWHM) [7]. The FWHM itself is defined as the distancefrom the tumor response to where the tumor response energy drops byhalf.
5. RESULTS
Resulting images from each beamformer are shown in Figures 3–6 asa Y -Z and associated X-Y cross-sectional slice (the tumor location isindicated by a pink circle for clarification in the case of the Normaland Heterogenous tissue models). Furthermore, the correspondingperformance metrics (SMR and SCR) are shown in Tables 2–4. Eachtable corresponds to a particular level of dielectric heterogeneity.
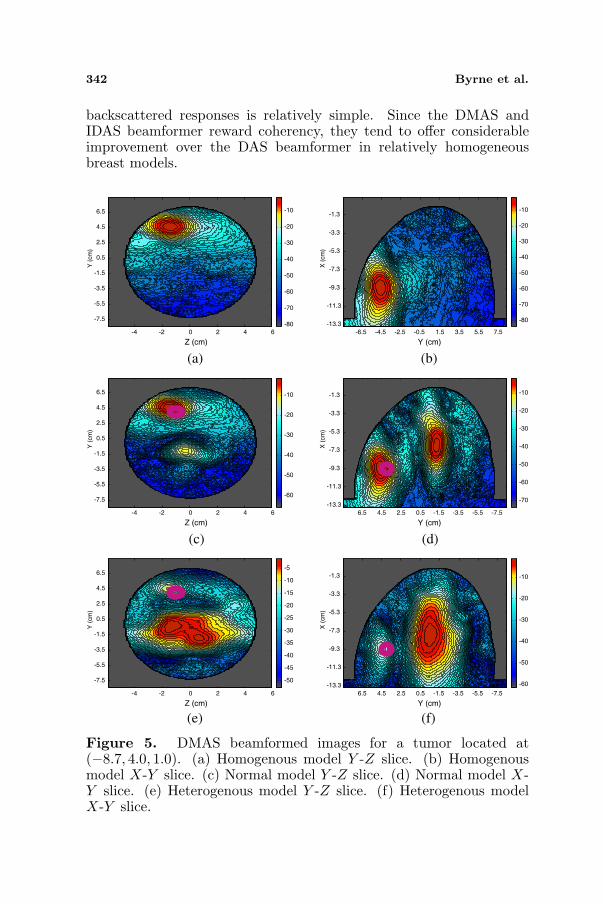
In the Homogenous model, both DMAS and IDAS significantlyoutperform the Multistatic and Monostatic DAS beamformer as shownin Table 2. DMAS and IDAS have an average SMR results of16.97 dB and 15.09 dB respectively compared to 13.19 dB and 10.12 dBfor Multistatic and Monostatic DAS respectively. On average, theSCR values for the IDAS and DMAS beamformers are respectively:

340 Byrne et al.
3.74 dB and 8.51 dB greater than for the Multistatic DAS. The weakestalgorithm is the Monostatic DAS with an average SMR of 10.12 dB andan SCR of 3.44.
Z (cm)
Y (
cm
)
-4 -2 0 2 4 6
6.5
4.5
2.5
0.5
-1.5
-3.5
-5.5
-7.5
-30
-25
-20
-15
-10
-5
(a)
Y (cm)X
(cm
)
-6.5 -4.5 -2.5 -0.5 1.5 3.5 5.5 7.5
-1.3
-3.3
-5.3
-7.3
-9.3
-11.3
-13.3 -35
-30
-25
-20
-15
-10
-5
(b)
Z (cm)
Y (
cm
)
-4 -2 0 2 4 6
6.5
4.5
2.5
0.5
-1.5
-3.5
-5.5
-7.5-30
-25
-20
-15
-10
-5
(c)
Y (cm)
X (
cm
)
6.5 4.5 2.5 0.5 -1.5 -3.5 -5.5 -7.5
-1.3
-3.3
-5.3
-7.3
-9.3
-11.3
-13.3
-30
-25
-20
-15
-10
-5
(d)
Z (cm)
Y (
cm
)
-4 -2 0 2 4 6
6.5
4.5
2.5
0.5
-1.5
-3.5
-5.5
-7.5-25
-20
-15
-10
-5
(e)
Y (cm)
X (
cm
)
6.5 4.5 2.5 0.5 -1.5 -3.5 -5.5 -7.5
-1.3
-3.3
-5.3
-7.3
-9.3
-11.3
-13.3
-35
-30
-25
-20
-15
-10
-5
(f)
Figure 3. DAS Monostatic beamformed images for a tumor locatedat (−8.7, 4.0, 1.0). (a) Homogenous model Y -Z slice. (b) Homogenousmodel X-Y slice. (c) Normal model Y -Z slice. (d) Normal model X-Yslice. (e) Heterogenous model Y -Z slice. (f) Heterogenous model X-Yslice.
Progress In Electromagnetics Research, Vol. 107, 2010 341
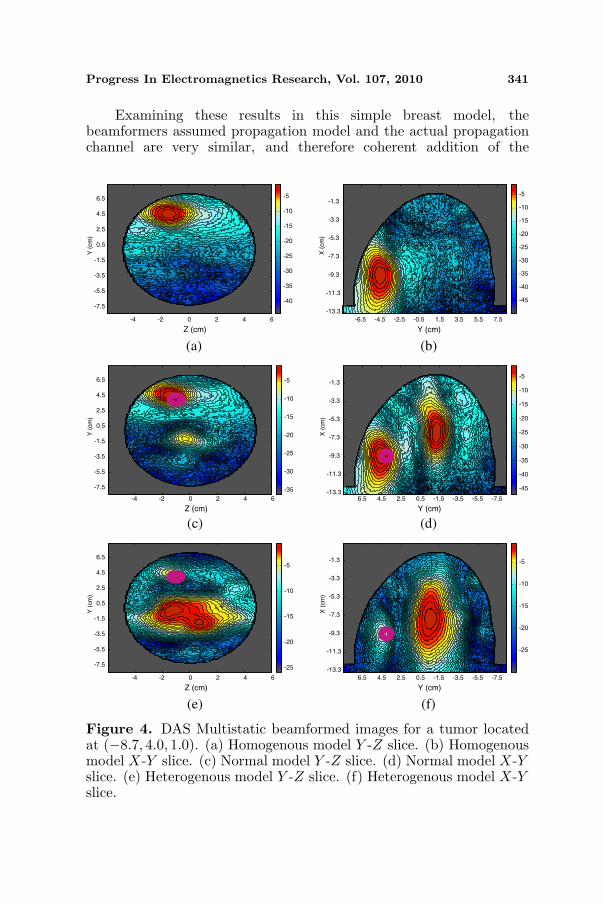
Examining these results in this simple breast model, thebeamformers assumed propagation model and the actual propagationchannel are very similar, and therefore coherent addition of the
Z (cm)
Y (
cm
)
-4 -2 0 2 4 6
6.5
4.5
2.5
0.5
-1.5
-3.5
-5.5
-7.5-40
-35
-30
-25
-20
-15
-10
-5
(a)
Y (cm)X
(cm
)
-6.5 -4.5 -2.5 -0.5 1.5 3.5 5.5 7.5
-1.3
-3.3
-5.3
-7.3
-9.3
-11.3
-13.3
-45
-40
-35
-30
-25
-20
-15
-10
-5
(b)
Z (cm)
Y (
cm
)
-4 -2 0 2 4 6
6.5
4.5
2.5
0.5
-1.5
-3.5
-5.5
-7.5 -35
-30
-25
-20
-15
-10
-5
(c)
Y (cm)
X (
cm
)
6.5 4.5 2.5 0.5 -1.5 -3.5 -5.5 -7.5
-1.3
-3.3
-5.3
-7.3
-9.3
-11.3
-13.3-45
-40
-35
-30
-25
-20
-15
-10
-5
(d)
Z (cm)
Y (
cm
)
-4 -2 0 2 4 6
6.5
4.5
2.5
0.5
-1.5
-3.5
-5.5
-7.5 -25
-20
-15
-10
-5
(e)
Y (cm)
X (
cm
)
6.5 4.5 2.5 0.5 -1.5 -3.5 -5.5 -7.5
-1.3
-3.3
-5.3
-7.3
-9.3
-11.3
-13.3
-25
-20
-15
-10
-5
(f)
Figure 4. DAS Multistatic beamformed images for a tumor locatedat (−8.7, 4.0, 1.0). (a) Homogenous model Y -Z slice. (b) Homogenousmodel X-Y slice. (c) Normal model Y -Z slice. (d) Normal model X-Yslice. (e) Heterogenous model Y -Z slice. (f) Heterogenous model X-Yslice.
342 Byrne et al.
backscattered responses is relatively simple. Since the DMAS andIDAS beamformer reward coherency, they tend to offer considerableimprovement over the DAS beamformer in relatively homogeneousbreast models.
Z (cm)
Y (
cm
)
-4 -2 0 2 4 6
6.5
4.5
2.5
0.5
-1.5
-3.5
-5.5
-7.5-80
-70
-60
-50
-40
-30
-20
-10
(a)
Y (cm)
X (
cm
)
-6.5 -4.5 -2.5 -0.5 1.5 3.5 5.5 7.5
-1.3
-3.3
-5.3
-7.3
-9.3
-11.3
-13.3-80
-70
-60
-50
-40
-30
-20
-10
(b)
Z (cm)
Y (
cm
)
-4 -2 0 2 4 6
6.5
4.5
2.5
0.5
-1.5
-3.5
-5.5
-7.5-60
-50
-40
-30
-20
-10
(c)
Y (cm)
X (
cm
)
6.5 4.5 2.5 0.5 -1.5 -3.5 -5.5 -7.5
-1.3
-3.3
-5.3
-7.3
-9.3
-11.3
-13.3-70
-60
-50
-40
-30
-20
-10
(d)
Z (cm)
Y (
cm
)
-4 -2 0 2 4 6
6.5
4.5
2.5
0.5
-1.5
-3.5
-5.5
-7.5 -50
-45
-40
-35
-30
-25
-20
-15
-10
-5
(e)
Y (cm)
X (
cm
)
6.5 4.5 2.5 0.5 -1.5 -3.5 -5.5 -7.5
-1.3
-3.3
-5.3
-7.3
-9.3
-11.3
-13.3 -60
-50
-40
-30
-20
-10
(f)
Figure 5. DMAS beamformed images for a tumor located at(−8.7, 4.0, 1.0). (a) Homogenous model Y -Z slice. (b) Homogenousmodel X-Y slice. (c) Normal model Y -Z slice. (d) Normal model X-Y slice. (e) Heterogenous model Y -Z slice. (f) Heterogenous modelX-Y slice.

Progress In Electromagnetics Research, Vol. 107, 2010 343
Z (cm)
Y (
cm
)
-4 -2 0 2 4 6
6.5
4.5
2.5
0.5
-1.5
-3.5
-5.5
-7.5 -55
-50
-45
-40
-35
-30
-25
-20
-15
-10
-5
(a)
Y (cm)
X (
cm
)
-6.5 -4.5 -2.5 -0.5 1.5 3.5 5.5 7.5
-1.3
-3.3
-5.3
-7.3
-9.3
-11.3
-13.3
-60
-50
-40
-30
-20
-10
(b)
Z (cm)
Y (
cm
)
-4 -2 0 2 4 6
6.5
4.5
2.5
0.5
-1.5
-3.5
-5.5
-7.5
-70
-60
-50
-40
-30
-20
-10
(c)
Y (cm)
X (
cm
)
6.5 4.5 2.5 0.5 -1.5 -3.5 -5.5 -7.5
-1.3
-3.3
-5.3
-7.3
-9.3
-11.3
-13.3
-80
-70
-60
-50
-40
-30
-20
-10
(d)
Z (cm)
Y (
cm
)
-4 -2 0 2 4 6
6.5
4.5
2.5
0.5
-1.5
-3.5
-5.5
-7.5
-60
-50
-40
-30
-20
-10
(e)
Y (cm)
X (
cm
)
6.5 4.5 2.5 0.5 -1.5 -3.5 -5.5 -7.5
-1.3
-3.3
-5.3
-7.3
-9.3
-11.3
-13.3 -80
-70
-60
-50
-40
-30
-20
-10
(f)
Figure 6. I-DAS beamformed images for a tumor located at(−8.7, 4.0, 1.0). (a) Homogenous model Y -Z slice. (b) Homogenousmodel X-Y slice. (c) Normal model Y -Z slice. (d) Normal model X-Y slice. (e) Heterogenous model Y -Z slice. (f) Heterogenous modelX-Y slice.
In the Normal breast model, the performance of the IDASbeamformer is particularly reduced, with an average SMR of 8.84 dBand an average SCR of −1.33 dB (compared to 15.09 dB and 13.20 dBfor the homogeneous model). DMAS outperforms Multistatic DAS by
344 Byrne et al.
an average of 3.19 dB and 0.98 dB for SMR and SCR across all tumors.Monostatic DAS offers a better average SCR than IDAS of 1.24 dB,but still performs poorly compared the Multistatic DAS beamformerwhich gives an improvement of 2.75 dB and 0.97 dB for SMR and SCRrespectively over it’s Monostatic counterpart.
The performance of all beamforming algorithms degrade withthe presence of a small region of fibroglandular tissue comparedto the Homogenous model, as shown in Table 3. The breast canno-longer be considered homogenous, and the contrast between theassumed and actual propagation channel affects the performance ofthe each beamformer. IDAS performance degrades significantly sincethe beamformer is based on the principle of weighting voxels wherecoherent addition occurs, and coherent addition is much more difficultwith increasing levels of dielectric heterogeneity.
Based on the results in Table 4, the DAS algorithm isthe most effective beamformer when applied to the dielectricallyheterogenous breast, with Monostatic DAS achieving an average SCRof −4.54 dB and an average SMR of 3.14 dB. Multistatic DAS offers animprovement in SMR of 3.73 dB and 11.44 dB over DMAS and IDASrespectively. Average SCR results for Multistatic DAS (−6.61 dB) are14.91 dB and 7.16 dB greater than the average IDAS and DMAS SCRresults respectively.
Visibly discerning between tumor and non-tumor locations in theHeterogenous model becomes very difficult, with the peak energyresponse often occurring within the region of fibroglandular tissue.Results for DMAS and IDAS are markedly reduced when comparedto the normal and homogenous breast results illustrating theirdependence on a dielectrically homogeneous propagation channel.
6. CONCLUSIONS
In this paper, four DI UWB radar breast imaging systems areevaluated. Beamforming algorithms are tested on signals taken from anumber of realistic and dielectrically accurate electromagnetic breastmodels. For test purposes 18 3D FDTD models were created, with atumor placed at two different locations within the breast. The DAS,DMAS and IDAS beamforming algorithms were examined using twometrics: SCR and SMR.
With a varying contrast in dielectric breast profiles in the breast,the performance of each DI approach degrades significantly. All DIbeamformers assume a homogenous dielectric breast structure for thecalculation of the propagation delay of the UWB pulse through breasttissue. In general, the shortcomings of this assumption are evident with
Progress In Electromagnetics Research, Vol. 107, 2010 345
each beamformer once the level of dielectric heterogeneity increaseswithin the breast, leading to inaccuracies between the assumed andactual channel model. The multiplication of time aligned peakresponses become distorted in the case of DMAS and the cumulativeenergy summation carried out by the IDAS algorithm is skewed.
DAS was found to be the most robust beamformer in difficultimaging scenarios with Monostatic DAS offering superior results in aheterogenetically dense breast. The distortion has less effect on thetime aligned summation of the tumor response than the multiplicationor energy summation employed by DMAS and IDAS respectively.
Future work will involve testing the other approaches to themicrowave imaging problem space, particularly investigating theperformance of Data-Adaptive beamforming algorithms on breastmodels with varying levels of dielectric heterogeneity.
REFERENCES
1. Society, A. C., “Cancer facts and figures 2009,” Tech. Rep.,American Cancer Society, Atlanta, 2009.
2. Ferlay, J., P. Autier, M. Boniol, M. Heanue, M. Colombet, andP. Boyle, “Estimates of the cancer incidence and mortality ineurope in 2006,” Annals of Oncology, Vol. 18, 581–592, 2007.
3. Nass, S. L., I. C. Henderson, and J. C. Lashof, Mammographyand Beyond: Developing Technologies for the Early Detection ofBreast Cancer, National Academy Press, 2001.
4. Huynh, P. H., A. M. Jarolimek, and S. Daye, “The false-negativemammogram,” RadioGraphics, Vol. 18, 1137–1154, 1998.
5. Hagness, S. C., A. Taflove, and J. E. Bridges, “Two-dimensionalfdtd analysis of a pulsed microwave confocal system for breastcancer detection: Fixed focus and antenna array sensors,” IEEETransactions on Biomedical Engineering, Vol. 45, 1470–1479,1998.
6. Li, X. and S. C. Hagness, “A confocal microwave imagingalgorithm for breast cancer detection,” IEEE Microwave andWireless Communications Letters, Vol. 11, 130–132, 2001.
7. Fear, E. C., X. Li, S. C. Hagness, and M. A. Stuchly, “Confocalmicrowave imaging for breast cancer detection: Localization oftumors in three dimensions,” IEEE Transactions on BiomedicalEngineering, Vol. 47, 812–812, 2002.
8. Bond, E. J., X. Li, S. C. Hagness, and B. D. V. Veen, “Microwaveimaging via space-time beamforming for early detection of breast
346 Byrne et al.
cancer,” IEEE Transactions on Antennas and Propagation, 1690–1705, 2003.
9. Kosmas, P. and C. M. Rappaport, “Time reversal with the fdtdmethod for microwave breast cancer detection,” Vol. 53, No. 7,2317–2323, 2005.
10. Xie, Y., B. Guo, L. Xu, J. Li, and P. Stoica, “Multi-staticadaptive microwave imaging for early breast cancer detection,”IEEE Transactions on Biomedical Engineering, Vol. 53, 1647–1657, 2006.
11. Meaney, P. M., M. W. Fanning, D. Li, S. P. Poplack, andK. D. Paulsen, “A clinical prototype for active microwave imagingof the breast,” IEEE Trans. Microwave Theory Tech., Vol. 48,No. 11, 1841–1853, Nov. 2000.
12. Meaney, P. M., M. W. Fanning, T. Raynolds, C. J. Fox, Q. Fang,C. A. Kogel, S. P. Poplack, and K. D. Paulsen, “Initial clinicalexperience with microwave breast imaging in women with normalmammography,” IEEE Trans. Microwave Theory Tech., Vol. 48,No. 11, 1841–1853, Nov. 2000.
13. Kruger, R. A., K. D. Miller, H. E. Reynolds, W. L. Kiser,D. R. Reinecke, and G. A. Kruger, “Breast cancer in vivo:Contrast enhancement with thermoacoustic ct at 434MHz —Feasibility study,” Radiology, Vol. 216, No. 1, 279–283, 2000.
14. Zhao, M., J. D. Shea, S. C. Hagness, D. W. van der Weide,B. D. V. Veen, and T. Varghese, “Numerical study of microwavescattering in breast tissue via coupled dielectric and elasticcontrasts,” IEEE Antennas and Wireless Propagation Letters,Vol. 7, 247–250, 2008.
15. O’Halloran, M., E. Jones, and M. Glavin, “Quasi-multistaticmist beamforming for the early detection of breast cancer,” IEEETransactions on Biomedical Engineering, Vol. 57, No. 4, 830–840,Apr. 2010.
16. O’Halloran, M., M. Glavin, and E. Jones, “Effects of fibroglan-dular tissue distribution on data-independent beamforming algo-rithms,” Progress In Electromagnetics Research, Vol. 97, 141–158,2009.
17. Jossinet, J., “The impedivity of freshly excised human breasttissue,” Physiol. Meas., Vol. 19, 61–75, 1998.
18. Gabriel, S., R. W. Lau, and C. Gabriel, “The dielectric propertiesof biological tissues: III. Parametric models for the dielectricspectrum of tissues,” Physics in Medicine and Biology, Vol. 41,2271–2293, 1996.
Progress In Electromagnetics Research, Vol. 107, 2010 347
19. Lazebnik, M., L. McCartney, D. Popovic, C. B. Watkins,M. J. Lindstrom, J. Harter, S. Sewall, A. Magliocco, J. H. Booske,M. Okoniewski, and S. C. Hagness, “A large-scale study of theultrawideband microwave dielectric properties of normal breasttissue obtained from reduction surgeries,” Physics in Medicine andBiology, Vol. 52, 2637–2656, 2007.
20. Lazebnik, M., D. Popovic, L. McCartney, C. B. Watkins,M. J. Lindstrom, J. Harter, S. Sewall, T. Ogilvie, A. Magliocco,T. M. Breslin, W. Temple, D. Mew, J. H. Booske, M. Okoniewski,and S. C. Hagness, “A large-scale study of the ultrawidebandmicrowave dielectric properties of normal, benign and malignantbreast tissues obtained from cancer surgeries,” Physics inMedicine and Biology, Vol. 52, 6093–6115, 2007.
21. Conceicao, R., M. O’Halloran, M. Glavin, and E. Jones,“Comparison of planar and circular antenna configurations forbreast cancer detection using microwave imaging,” Progress InElectromagnetics Research, Vol. 99, 1–19, 2009.
22. Nilavalan, R., S. C. Hagness, and B. D. V. Veen, “Numericalinvestigation of breast tumour detection using multi-static radar,”IEE Electronic Letters, Vol. 39, No. 25, 1787–1789, Dec. 2003.
23. Klemm, M., I. Craddock, J. Leendertz, A. Preece, andR. Benjamin, “Improved delay-and-sum beamforming algorithmfor breast cancer detection,” International Journal of Antennasand Propogation, Vol. 2008, 9, 2008.
24. Lim, H. B., N. T. T. Nhung, E.-P. Li, and N. D. Thang, “Confocalmicrowave imaging for breast cancer detection: Delay-multiplyandsum image reconstruction algorithm,” IEEE Transactions onBiomedical Engineering, Vol. 55, No. 6, 1697–1704, Jun. 2008.
25. Zastrow, E., S. K. Davis, M. Lazebnik, F. Kelcz, B. D. V. Veen,and S. C. Hagness, “Database of 3d grid-based numericalbreast phantoms for use in computational electromagneticssimulations,” Department of Electrical and Computer EngineeringUniversity of Wisconsin-Madison, [Online], 2008, Available:http://uwcem.ece.wisc.edu/home.htm.
26. Zastrow, E., S. K. Davis, M. Lazebnik, F. Kelcz, B. D. V. Veen,and S. Hagness, “Development of anatomically realistic numericalbreast phantoms with accurate dielectric properties for model-ing microwave interactions with the human breast,” IEEE Trans-actions on Biomedical Engineering, Vol. 55, No. 12, 2792–2800,Dec. 2008.
27. Davis, S. K., B. D. V. Veen, S. C. Hagness, and F. Kelcz, “Breasttumor characterization based on ultrawideband backscatter,”

348 Byrne et al.
IEEE Transactions on Biomedical Engineering, Vol. 55, No. 1,237–246, 2008.
28. Muinonen, K., “Introducing the gaussian shape hypothesis forasteroids and comets,” Astronomy and Astrophysics, Vol. 332,1087–1098, 1998.
29. Okoniewski, M., M. Mrozowski, and M. A. Stuchly, “Simpletreatment of multi-term dispersion in fdtd,” IEEE Microwave andGuided Wave Letters, Vol. 7, 121–123, 1997.
30. Gabriel, C., S. Gabriel, and E. Corthout, “The dielectricproperties of biological tissues: I. literature survey,” Phys. Med.Biol., Vol. 41, No. 11, 2231–2249, Nov. 1996.
31. Berenger, J. P., “A perfectly matched layer for the absorptionof electromagnetic waves,” Journal of Computational Physics,Vol. 114, 185–200, 1994.