data infrastructure and analytics in life sciences - … · 9:00 –9:30 data infrastructure and...
TRANSCRIPT

© Copyright 2017 OSIsoft, LLCUSERS CONFERENCE 2017 #OSIsoftUCosisoft@
Presented by
Data Infrastructure and
Analytics in Life Sciences
Petter Moree
Industry Principal
Life Sciences, Food & Beverage and Specialty Chemicals

© Copyright 2017 OSIsoft, LLCUSERS CONFERENCE 2017 #OSIsoftUCosisoft@
Time Title Presenter(s)
9:00 – 9:30 Data Infrastructure and Analytics Petter Moree –
OSIsoft
9:30 – 9:45 Transfer Time
9:45 – 10:15 Monitoring bioreactor cell culture data in real-time with the PI System Cassandra Murillo, Anthony DeBiase –
Regeneron
10:15 – 10:45 Break
10:45 – 11:15 Data Sharing in an OEM Environment Brian Goldinger, Abel Padilla, Christian Jaeger –
Eli Lilly & Process Automation
11:15 – 11:30 Transfer Time
11:30 – 12:15 Data Sharing in a Contract Manufacturing Environment Brian Goldinger, Abel Padilla, Christian Jaeger –
Eli Lilly & Process Automation
12:15 – 2:15 LUNCH – Grand Ballroom
2:15 – 2:45 Pharmaceutical Manufacturing Improvement through leverage of PI Data and
Analytical Tools
Robert Forest, Daniel Wasser –
Bristol Myers Squibb & Seeq
2:45 – 3:00 Transfer Time
3:00 – 3:30 The Value of the Novartis EA for the San Carlos Site and Novartis
Achievements/Goals of the PI System strategy
Serge De Grandpre –
Novartis
3:30 – 4:00 Break
4:00 – 4:45 Leveraging the PI System to Build a Biologics Analytics Tool for Laboratory-Scale
Bioreactor Data
Sohan Patel –
Bristol Myers Squibb
4:45 – 5:15 Wrap-Up Petter Moree – OSIsoft
2

© Copyright 2017 OSIsoft, LLCUSERS CONFERENCE 2017 #OSIsoftUCosisoft@
Life Sciences PI User Group
3
Join to discuss best practices, white papers, share news, and exchange ideas.
Objectives:
• Identify Best Practices
• Share knowledge and ideas across our industry
• Foster communication with OSIsoft regarding our industry needs
This is NOT an avenue for sales presentations or marketing
Want to opt in?https://pisquare.osisoft.com/groups/life-sciences
Or contact [email protected]
Have questions?
• Visit the PI Square Booth
263
Members

© Copyright 2017 OSIsoft, LLCUSERS CONFERENCE 2017 #OSIsoftUCosisoft@
Recap from PUG meeting Monday
4
Pharma PUG team has 260+ members
• Monday site visit Shire Hayward, CA
• Presentation regarding MVDA from Hugo Guerra, Shire
• PUG meeting and workshops related to
– EF visualization
• PUG dinner at Ideale
• New Chairperson

© Copyright 2017 OSIsoft, LLCUSERS CONFERENCE 2017 #OSIsoftUCosisoft@
Multi-Dimensional
Pharmaceutical Company
CDMO/
CMO
Equipment vendors
Service Partners
Regulatory
AgenciesCRO
Multiple sites
Material vendors
5
Communities
Enterprise
Plants
Units
Assets
Sensors
Time Corp.Ecosystem

© Copyright 2017 OSIsoft, LLCUSERS CONFERENCE 2017 #OSIsoftUCosisoft@
Pharmaceutical Trends

© Copyright 2017 OSIsoft, LLCUSERS CONFERENCE 2017 #OSIsoftUCosisoft@
Regulatory Trends from a data perspective
CPV and Data Integrity
7

© Copyright 2017 OSIsoft, LLCUSERS CONFERENCE 2017 #OSIsoftUCosisoft@
Process and Product
Development
8

© Copyright 2017 OSIsoft, LLCUSERS CONFERENCE 2017 #OSIsoftUCosisoft@
New Technology
Single Use
9

© Copyright 2017 OSIsoft, LLCUSERS CONFERENCE 2017 #OSIsoftUCosisoft@
Technology
Continuous Manufacturing
10

© Copyright 2017 OSIsoft, LLCUSERS CONFERENCE 2017 #OSIsoftUCosisoft@
Advanced Control
Data Driven control using MPC
11

© Copyright 2017 OSIsoft, LLCUSERS CONFERENCE 2017 #OSIsoftUCosisoft@
Outsourcing
CMO/CDMO and critical materials
12
What controls do YOU have over your data at or from your suppliers so that FDA and YOU can rely on your data?

© Copyright 2017 OSIsoft, LLCUSERS CONFERENCE 2017 #OSIsoftUCosisoft@
Summarized
OT
Descriptive
DiagnosticIT
Reports
Detailed
Visualization
Where is
your data?
How do you make the
data decision-ready?
Analytics
Ext
Notifications
How do you
consume the data?
Automations
Reactive
Proactive
Assisted
Unattended
What type of data
do you need?
Sensor
Equipment
Customer
Financial
Maintenance
Inventory
Process
Capture
Contextualize
Calculate
Combine
Correlate
Model
Apply Algorithms
What do you
want to do?
What is your
desired outcome?
Regulatory
Reporting
Optimized
Operating
Conditions
CBM
Daily Profit
Assessment
Process
Efficiency
Fleet-Wide
Analysis
Predictive
Quality
Describe a
current
state
Diagnose
a problem
Predict an
Event
Report a
completed
batch
LIMS

© Copyright 2017 OSIsoft, LLCUSERS CONFERENCE 2017 #OSIsoftUCosisoft@
Data supported business
KnowledgeProcess Understanding
Scale up/downTech transfer
Material influenceRisk AssessmentCPP, CMA, CQA
Golden batch analysisTime-to-market
CDMO
AnalyticsSite to site comparison
CAPADe-bottlenecking
Predict Quality attributesCapacity
CalibrationReal-time control (APC)Golden Batch analysis
Scale up/downSupply Chain Management
Operational Exc. Trouble Shooting
TrendingOut of Specification Investigation
Real-time monitoring/SPCEnd process
prediction/determinationOptimization
Process Analytical TechnologyEarly Fault detection
Asset Health
ComplianceReal time release testing (RTRt)
Batch releaseCPV/OPV
Annual Product and Quality ReviewsReporting & RBEQuality by Design
14
Pharma becomes data and analytics driven
© Copyright 2017 OSIsoft, LLCUSERS CONFERENCE 2017 #OSIsoftUCosisoft@
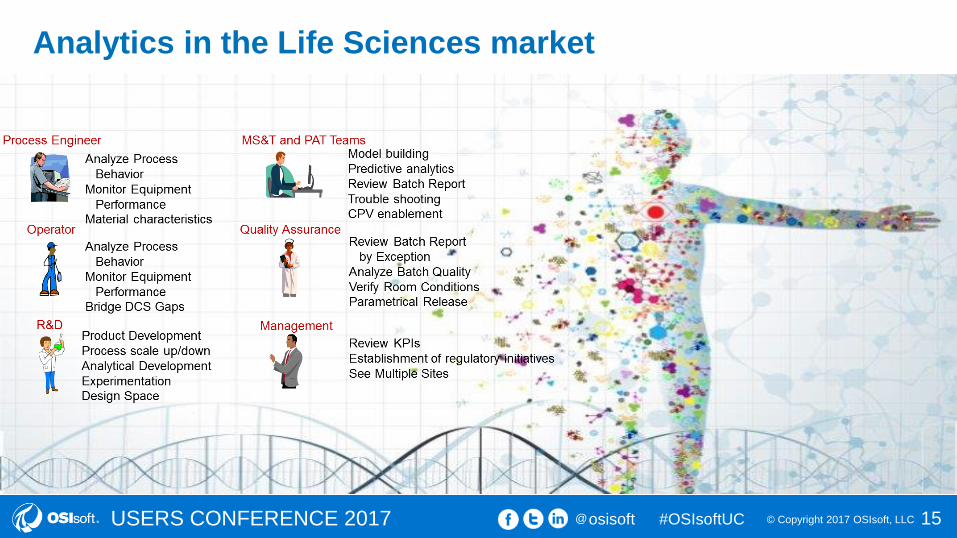
Analytics in the Life Sciences market
15

© Copyright 2017 OSIsoft, LLCUSERS CONFERENCE 2017 #OSIsoftUCosisoft@
Story
Product
High Revenue Product
Extended release, drug given
every XXth day
Global Market
Extended therapeutically
application
Challenge
All batches are not meeting
release criteria – use test
Release criteria known after
30 days!
Number of non conforming
batches increases in time

© Copyright 2017 OSIsoft, LLCUSERS CONFERENCE 2017 #OSIsoftUCosisoft@
The processes
Country 1 Country 2
Poor infrastructure
Paper driven
records
iFix
historians
Process
Biotech
Chemical
Pharmaceutical
Country 3

© Copyright 2017 OSIsoft, LLCUSERS CONFERENCE 2017 #OSIsoftUCosisoft@
Analytics
X0 X(t) y
Raw material
attributes
Initial conditions/time Independent
process parameters
Process Parameters X(t) Batch/Unit
operation/Phases
Product
properties
CQA
Focus DOE
Identify X0
f(x0) = y
Focus MVDA
Signature X(t)
f(x0,X(t)) = y
time
Stakeholders, managers, experts
“it is due to hygroscopic
material”
“particle size distribution”
“impurities”
“molecular weight”
“Reaction time”
“Starting materials
Investment
Paper to digital – 2 month, 3
persons
Historian alignment – 2 month
1 PhD.
Data preparation almost took
10 month
Modelling took 1-2 days!
Hierarchical Batch PLS models with time resolved
process data as X and QC/CQA test as Y
© Copyright 2017 OSIsoft, LLCUSERS CONFERENCE 2017 #OSIsoftUCosisoft@
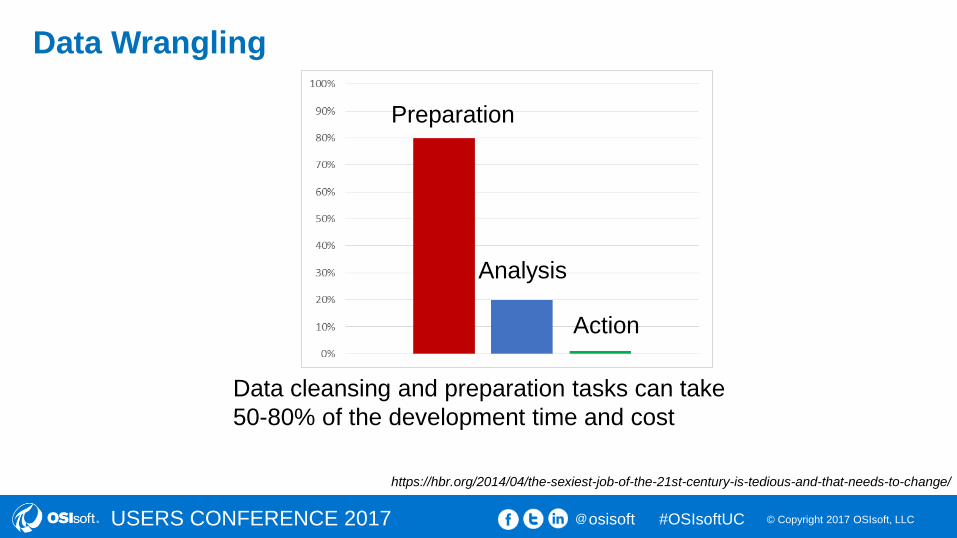
Data Wrangling
Data cleansing and preparation tasks can take
50-80% of the development time and cost
https://hbr.org/2014/04/the-sexiest-job-of-the-21st-century-is-tedious-and-that-needs-to-change/
Analysis
Preparation
Action

© Copyright 2017 OSIsoft, LLCUSERS CONFERENCE 2017 #OSIsoftUCosisoft@
Analytics
K
Time
N
M
Batch
conditions
(X0)
Process data
Chemical (X1)
IPC data
(X3)
Both actuators,
mesurments and
setpoints
Long
inhomogenious
sampling interval
N
Process data
Biotech (X2)
Multiple phases
Variating batch length
Calculated parameters
N
1
N
1
N
1
CQA (Y)
Hierarchical Batch modelling (PLS) combining all process
trajectories, IPC and initial conditions as X, CQA as Y

© Copyright 2017 OSIsoft, LLCUSERS CONFERENCE 2017 #OSIsoftUCosisoft@
Result – Data driven decision for release
CQA variation correlated to chemical process
Better control using batch trajectories enabled less variation in CQA
New control strategy developed based on Design Space
Distributed islands of operations, centralized analytics

© Copyright 2017 OSIsoft, LLCUSERS CONFERENCE 2017 #OSIsoftUCosisoft@
Knowledge Management
Source: Russ Ackoff “From Data to Wisdom”, Journal of Applied Systems Analysis, Volume 16, 1989 p 3-9.

© Copyright 2017 OSIsoft, LLCUSERS CONFERENCE 2017 #OSIsoftUCosisoft@
Data Integrity
QbD
CPV/OPV
PAT
Asset Health
KPIs

© Copyright 2017 OSIsoft, LLCUSERS CONFERENCE 2017 #OSIsoftUCosisoft@
Story
Product
High Revenue Product
Extended release, drug given
every XXth day
Global Market
Challenge
All batches are not meeting
release criteria
Release criteria known after
30 days
Number of non confirming
batches increases in time
QbD
Risk assessment to identify the
CQAs and how these are
related to CPPs and CMAs
would lead to:
Design Space – a
relationship between
process and material to
quality
Enables a control strategy to
meet specs and economical
benefits

© Copyright 2017 OSIsoft, LLCUSERS CONFERENCE 2017 #OSIsoftUCosisoft@
The processes
Country 1 Country 2
Poor infrastructure
Paper driven
records
iFix
historians
Process
Biotech
Chemical
Pharmaceutical
Country 3
Data IntegrityData Integrity are those elements
that give the data its trustworthiness
• Reliability: Completeness and
Accuracy
• Authenticity: It is what it claims to
be
• Reviewability: It can be
reviewed, analyzed and
interpreted with its full meaning
and context Applicable for
1. Research & Development
• Including CDMO
2. Clinical Trials
3. Manufacturing & Testing
• Including CMO and CMA

© Copyright 2017 OSIsoft, LLCUSERS CONFERENCE 2017 #OSIsoftUCosisoft@
Analytics
K
Time
N
M
Batch
conditions
(X0)
Process data
Chemical (X1)
IPC data
(X3)
Both actuators,
mesurments and
setpoints
Long
inhomogenious
sampling interval
N
Process data
Biotech (X2)
Multiple phases
Variating batch length
Calculated parameters
N
1
N
1
N
1
CQA (Y)
Hierarchical Batch modelling (PLS) combining all process
trajectories, IPC and initial conditions as X, CQA as YPATBenefits & Business Drivers
• Better process control / Lower
process variability
• Reduce number of OOS and
batch failures
• Process improvement
• Increase of yield, throughput &
quality
• Efficient and lean QC testing
• Replacement by faster
analytical technologies (on‐line
PAT tools)
• Real time release (RTRt)
• Prerequisite for continuous
manufacturing

© Copyright 2017 OSIsoft, LLCUSERS CONFERENCE 2017 #OSIsoftUCosisoft@
Importance of process data in biopharmaceutical

© Copyright 2017 OSIsoft, LLCUSERS CONFERENCE 2017 #OSIsoftUCosisoft@
Result – Data driven decision for release
CQA variation correlated to chemical process
Better control using batch trajectories enabled less variation in CQA
New control strategy developed based on Design Space
Distributed islands of operations, centralized analytics
CPV/OPVAn ongoing program for collecting
and analyzing product and process
data that relate to product quality
• Procedures for data collection
and trending
• Data collected should verify that
the quality attributes meet specs
• Intra-batch and inter-batch
variation
• Data should be collected to
evaluate process stability and
capability
• Data should be statistically
trended

© Copyright 2017 OSIsoft, LLCUSERS CONFERENCE 2017 #OSIsoftUCosisoft@
Result – Data driven decision for release
CQA variation correlated to chemical process
Better control using batch trajectories enabled less variation in CQA
New control strategy developed based on Design Space
Distributed islands of operations, centralized analytics
Asset HealthOptimizing asset health, minimizing
asset failures and understanding
optimal maintenance programs are
critical to reducing operation costs.
Going from calendar based to
situation based to condition based
maintenance is becoming common
in the process industry. Several
companies also adopt Predictive or
Prescriptive Maintenance.
E.g. When do we need to change the packaging
material in the chromatography column?
29

© Copyright 2017 OSIsoft, LLCUSERS CONFERENCE 2017 #OSIsoftUCosisoft@
Result – Data driven decision for release
CQA variation correlated to chemical process
Better control using batch trajectories enabled less variation in CQA
New control strategy developed based on Design Space
Distributed islands of operations, centralized analytics
30
KPIKey Performance Indicators are common tools
to track success and status of an organization,
process or system.
Common KPI’s in Pharma Manufacturing are:
• OEE, generated of Productivity, Availability and
Quality
• Cycle Time
• NC or OOS – Non Conformity or Out Of
Specification batches/lots
• Yield
Trending of KPIs gives insight in performance
and can highlight problems. It is often valuable
to be able to drill down into the elements
building a KPI to allow corrective actions
© Copyright 2017 OSIsoft, LLCUSERS CONFERENCE 2017 #OSIsoftUCosisoft@
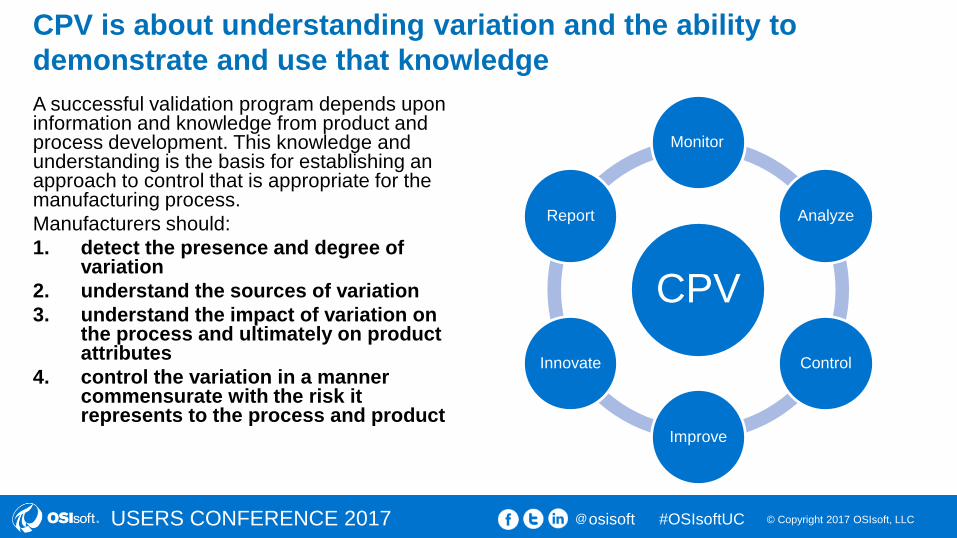
CPV is about understanding variation and the ability to
demonstrate and use that knowledge
A successful validation program depends upon information and knowledge from product and process development. This knowledge and understanding is the basis for establishing an approach to control that is appropriate for the manufacturing process.
Manufacturers should:
1. detect the presence and degree of variation
2. understand the sources of variation
3. understand the impact of variation on the process and ultimately on product attributes
4. control the variation in a manner commensurate with the risk it represents to the process and product
CPV
Monitor
Analyze
Control
Improve
Innovate
Report

© Copyright 2017 OSIsoft, LLCUSERS CONFERENCE 2017 #OSIsoftUCosisoft@
Common CPV requirements
• Data Management
– Data Integrity and Data Quality
– Fast and Secure access to data on demand
– Data search and analytics capabilities
– CMO data access
• Statistical and analytical
– Contextualization of batch data
– Flexibility of statistical tools
– Interactivity of visualizations and plots
• Processes improvements
– Storing data assessments and investigations
– CAPA and continuous improvements
– Non conformity documentations and follow ups
CQA Data with CpK
CPP Data using MVDA
Trending of CQA

© Copyright 2017 OSIsoft, LLCUSERS CONFERENCE 2017 #OSIsoftUCosisoft@ 33
PI Analytics vs. Batch Interfaces
PI Analytics – Simple Event FramesBatch Interfaces – Event Frame
Hierarchy Matching Batch Events

© Copyright 2017 OSIsoft, LLCUSERS CONFERENCE 2017 #OSIsoftUCosisoft@
Event Frames Roadmap – moving forward to 2017-2018
2H 1H 2H
EVENT DETAILS
AND ANALYSIS
PI Coresight 2016 R2
• Advanced Event search
• Event Details and
Analysis
REPORTING and
AGGREGATION
RtReports 4.0 – Release
PI System Connector
• Event Frame
Replication
RtReports 4.1 – Beta
• AF Attribute
2017 2018
EMEA UC (Berlin) EMEA UC (London)
1H
REPORTING
PI Vision 2018
Enhanced Event
Comparison Experience
RtReports 4.1 – Release
UC2017 (SF) UC2018 (SF)
PINNED EVENTS and
REPORTING
PI Vision 2017
• Pinned Events
• Events Table (CTP)
RtReports 4.0 - Beta
• Existing reports with
Event Frames support
• Client browser printing
2016

© Copyright 2017 OSIsoft, LLCUSERS CONFERENCE 2017 #OSIsoftUCosisoft@
We want to hear from you!
Golden
Batch
Dashboards
SQC Charts
https://feedback.osisoft.com/
Chris [email protected]
Director, Visualization Products
OSIsoft
Alicia [email protected]
Product Manager, Visualization Products
OSIsoft

© Copyright 2017 OSIsoft, LLCUSERS CONFERENCE 2017 #OSIsoftUCosisoft@
Contact Information
Petter [email protected]
+46736997999
Industry Principal
OSIsoft, LLC
36

© Copyright 2017 OSIsoft, LLCUSERS CONFERENCE 2017 #OSIsoftUCosisoft@ 37
Questions
Please wait for the
microphone before asking
your questions
Please remember to…
Complete the Online Survey
for this session
State your
name & company
http://bit.ly/uc2017-app

© Copyright 2017 OSIsoft, LLCUSERS CONFERENCE 2017 #OSIsoftUCosisoft@
Thank You