data management & scoring manual - credi.gse.harvard.edu
TRANSCRIPT

Data Management
& Scoring Manual October 15, 2021
Jonathan Seiden, EdM Harvard Graduate School of Education
Marcus Waldman, PhD University of Nebraska Medical Center
Dana Charles McCoy, PhD Harvard Graduate School of Education
Günther Fink, PhD Swiss Tropical and Public Health Institute

2
INTRODUCTION
The Caregiver Reported Early Development Instruments (CREDI) were designed to serve as
a population-level measure of early childhood development (ECD) for children from birth to age
three. As the name suggests, the CREDI exclusively relies on caregiver reports (most often a
parent of the child), and thus primarily focuses on milestones and behaviors that are easy for
caregivers to understand, observe, and describe.
This Data Management & Scoring Manual was developed to help users to calculate composite
CREDI scores to use in their data analysis, as well as to accurately interpret these scores. Users
can generate scores either by uploading data to the CREDI Scoring App, an easy-to-use web-
based application, or by downloading the credi package and scoring data locally using the
statistical software R. Both methods use the responses on each CREDI item (question) to
generate overall, domain, and norm-referenced scores for use in later analysis. This manual only
covers instructions for using the CREDI Scoring App, which we believe will be the preferred
method of scoring CREDI data for most users. For instructions on using the credi package,
please refer to the package documentation available on Git Hub.
We recommend that users review this document in full to understand how to prepare data for
score calculations, how to use the Scoring App, and how to interpret and use scores.
As we detail in the Interpretation sections below, there are several considerations to keep in
mind when using the CREDI scores. Depending on whether Long Form or Short Form data are
used, users will get different sets of scores.
1. Data collected via the CREDI Short Form will produce an “overall” score that
summarizes children’s developmental status based on skills across multiple domains. The
CREDI scoring package produces both an overall raw scaled score (whose units are not
easily interpretable, but are most appropriate for hypothesis testing) and an overall norm-
referenced standardized score (which can be interpreted as a Z-score in comparison to
a reference group).
2. Data collected via the CREDI Long Form will produce an “overall” score
comparable to the overall score reported with Short Form data. In addition, data collected
on the Long Form will produce domain scores for each of the four CREDI domains:
Motor, Cognitive, Language, and Social-Emotional. For each, both scaled scores and
norm-referenced standardized scores are provided by the scoring package.
3
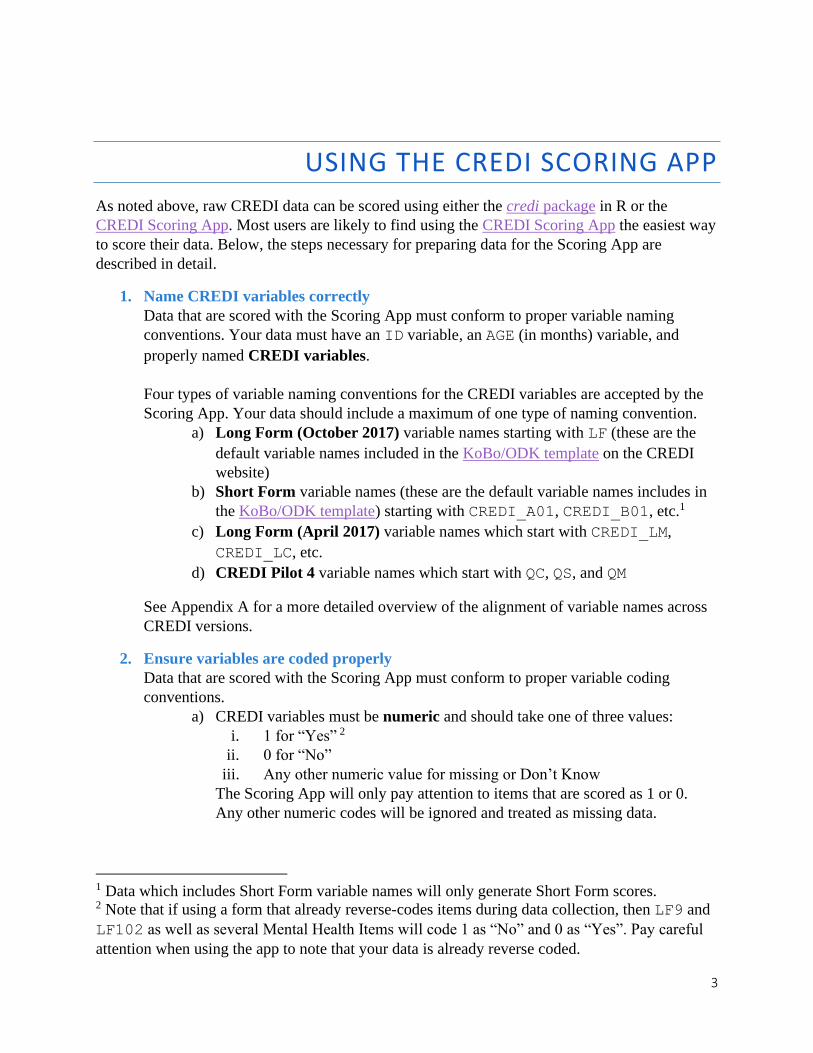
USING THE CREDI SCORING APP
As noted above, raw CREDI data can be scored using either the credi package in R or the
CREDI Scoring App. Most users are likely to find using the CREDI Scoring App the easiest way
to score their data. Below, the steps necessary for preparing data for the Scoring App are
described in detail.
1. Name CREDI variables correctly
Data that are scored with the Scoring App must conform to proper variable naming
conventions. Your data must have an ID variable, an AGE (in months) variable, and
properly named CREDI variables.
Four types of variable naming conventions for the CREDI variables are accepted by the
Scoring App. Your data should include a maximum of one type of naming convention.
a) Long Form (October 2017) variable names starting with LF (these are the
default variable names included in the KoBo/ODK template on the CREDI
website)
b) Short Form variable names (these are the default variable names includes in
the KoBo/ODK template) starting with CREDI_A01, CREDI_B01, etc.1
c) Long Form (April 2017) variable names which start with CREDI_LM,
CREDI_LC, etc.
d) CREDI Pilot 4 variable names which start with QC, QS, and QM
See Appendix A for a more detailed overview of the alignment of variable names across
CREDI versions.
2. Ensure variables are coded properly
Data that are scored with the Scoring App must conform to proper variable coding
conventions.
a) CREDI variables must be numeric and should take one of three values:
i. 1 for “Yes” 2
ii. 0 for “No”
iii. Any other numeric value for missing or Don’t Know
The Scoring App will only pay attention to items that are scored as 1 or 0.
Any other numeric codes will be ignored and treated as missing data.
1 Data which includes Short Form variable names will only generate Short Form scores. 2 Note that if using a form that already reverse-codes items during data collection, then LF9 and
LF102 as well as several Mental Health Items will code 1 as “No” and 0 as “Yes”. Pay careful
attention when using the app to note that your data is already reverse coded.

4
b) The ID variable must be unique for each observation/row. There cannot be
observations with missing ID values. If you have data with duplicate IDs, you
will need to either recode observations, or drop duplicates.
c) The AGE variable with only numeric values that indicates the child’s age in
months. Observations with missing AGE values will not result in an error;
however, scores will not be calculated for these children. Please note that the
Scoring App currently only creates scores for children under the age of 3
years (36 months).
3. Remove personally identifiable information from your data
Please DO NOT upload any personally identifiable information (PII) to the CREDI App.
The CREDI team regularly flushes temporary files of its servers, but we cannot guarantee
data security. To prevent any issues with data protection, please remove any PII from
your data. Save this information in a separate file including the ID to facilitate re-merging
with your original data later.
By using the CREDI Scoring App you are confirming any data uploaded have been
anonymized and do not include any PII or sensitive information.
4. Save your data as an .xlsx or .csv file
The Scoring App accepts Excel workbooks and Comma Separated Files. Ensure that the
first row of your data is the variable name.
5. Access the CREDI Scoring App
Confirm that your data does not have any PII by Clicking “I agree”
6. Indicate whether your data are already reverse-coded or not
Several items on the CREDI are negatively worded, so that responding “Yes” means that
the child should get a lower score – e.g., “LF2: Does the child hold his/her hands in fists

5
all the time?” and “LF102: Does the child frequently act impulsively or without thinking
(e.g., running into the street without looking)?” Some users code all “Yes” responses as 1
and all “No” responses as 0, whereas other users may have reverse-coded their data
earlier. The user must indicate whether the data are already reverse-coded to ensure these
items are scored properly.
a) If you coded all “Yes” responses as 1 and all “No” responses as 0, then you should
select “My data are not reverse coded”.
b) If you already re-coded the negatively worded items so that “Yes” is 0 and 1 is “No”,
then you should NOT select this option. If you used the default KoBo/ODK form to
collect data, then your data are already reverse coded and you should leave this
box empty.
7. Indicate if you wish to preserve item-level responses
Users can select to preserve the item-level responses (i.e., the responses to individual
items) in the downloaded data, or to only export the composite scores.
a) Select “I want to preserve item-level data.” if you want the resulting dataset to
include the original responses to individual CREDI items in addition to the composite
scores.
b) Do not select “I want to preserve item-level data.” if you only want to include
composite scores.
8. Upload and score data
a) Click the “Browse…” button and select the .csv or .xlsx file that you saved in Step 4.

6
b) Data will begin processing automatically after you upload your file. Note that scoring
CREDI data can take several seconds. While the program is running, a blue bar will
flash on the screen to let you know the program is still working.
9. Download data or diagnose and correct errors
a) If your data were unable to be scored, an error message will appear along with log
output that should help you diagnose the error. For example, in the screenshot below,
the ID variable was not unique across observations, leading to an error. You can also
download the log in order to easily share this information with others.
If you are unable to resolve errors using the message in the log, please get in touch
with the CREDI team at [email protected] describing your error and providing a
copy of the anonymized dataset.
b) If your data were scored successfully, a success message will appear along with two
buttons with download links.
i. The “Download processed data” button will initiate the download of an .xlsx file
with the CREDI composite scores merged back into your data. See Interpreting
CREDI Scores, below, for more information on understanding the various
composite scores produced by the Scoring App.
ii. The “Download Log” button will initiate a download of a .txt file that includes
information about the performance of the scoring algorithm. This provides details
about which (if any) observations were unable to be scored and why.
10. Examine scoring outcomes
After your data have been successfully scored, the CREDI Scoring App generates a series
of tables and plots to help you review your results.
a) The Results by Age Band table summarizes the total number of observations
(children) by age band, and indicates what percentage of these observations were able
to be scored. If the percentage scored is below 100%, then this means that at least one
observation in this age band had fewer than 5 observed (non-missing) CREDI items,
and therefore could not be scored.

7
b) The Flagged Observations table indicates the proportion of observations within each
domain that have been flagged due to a low response rate. While the CREDI Scoring
app calculates scores for all domains regardless of response rates, observations with
fewer than 5-domain relevant items responded to are flagged. See the downloaded
data and the _flag variables to determine which observations had a low number of
items responded to. See Appendix C for more information on how to deal with
flagged observations.
c) The CREDI Domain Score Averages plot is a visual representation of the average
score by age band on the Overall and CREDI domain raw scaled scores. (Note that
Short Form data will only produce one bar chart of the Overall score.) In this case,
consistent with expectations, we see that older children have consistently higher raw
scaled scores than younger children.

8
d) The Distribution of normed CREDI Z-scores displays the spread of the norm-
referenced Z-scores. In this case, we can see that the average score for all domains in
this particular sample was well below the CREDI reference sample average (0), but
that the current sample scored, on average, slightly higher in the Motor domain than it
did in the Language domain. Since Z-scores control for age, we include children of all
ages in these density plots.

9
USING AND INTERPRETING CREDI SCORES
Background
Before going into the details of the variables the Scoring App provides and how to use and
interpret them, we first explain the basic logic behind the multidimensional factor analysis
process that was used in the calculation of CREDI domain and overall scores3.
Most early childhood assessments assume that a question/item (or an activity) is related to one
domain of early childhood development. This assumption is made for practical reasons and
makes calculating scores easier. However, developmental psychologists agree that, in reality,
domains of development are highly interrelated in a complex manner. Being able to complete a
developmental milestone often requires skills from numerous domains of early development
simultaneously.
As illustrated below in Figure 1, by using multidimensional domain loadings, the CREDI
attempts to reflect this complexity by allowing individual items to contribute information about
multiple domains of development. For example, CREDI item “LF90. Can the child count up to
five objects (e.g., fingers, people)?” loads onto both the Cognitive and the Language domains.
This makes intuitive sense because a child who can complete this item is using both verbal skills
to articulate numbers aloud and cognitive skills internalizing numeracy and order.
Figure 1: Unidimensional vs. Multidimensional domain loading
Unidimensional domain loadings Multidimensional domain loadings
The loadings of items onto domains that were used to score the CREDI were determined after
both a rigorous review by subject matter experts and an empirical analysis of more than 14,000
children whose caregivers had responded to the CREDI. Although many items on the CREDI
3 See Waldman et al., 2021 for a technical description of the item factor analysis used to create
the CREDI scoring process.
Item
1
Item
2 Item
3
Item
4
Domain 2 Domain 1
Item
1
Item
2 Item
3
Item
4
Domain 2 Domain 1

10
load onto two or even three domains, some items only contribute information about a single
domain.
Given the various domain loadings of the items on the CREDI, the Scoring App uses Maximum
Likelihood Estimation for each child to find the developmental level on each domain that is most
likely given the child’s age and response patterns on CREDI items.
CREDI Scores
The Scoring App generates an .xlsx file with the following variables. When scoring Short Form
data, only variables in red are generated. When scoring Long Form data, all variables are
generated.:
COG A raw scaled (factor) score for the Cognitive domain LANG A raw scaled (factor) score for the Language domain MOT A raw scaled (factor) score for the Motor domain SEM A raw scaled (factor) score for the Social-Emo. domain OVERALL A raw scaled (factor) score for Overall development (all items) Z_COG A norm-referenced standardized Z-score for the Cognitive domain Z_LANG A norm-referenced standardized Z-score for the Language domain Z_MOT A norm-referenced standardized Z-score for the Motor domain Z_SEM A norm-referenced standardized Z-score for the Social-Emo. domain Z_OVERALL A norm-referenced standardized Z-score for Overall development (all items) COG_SE The standard error of measurement of the score for the Cognitive domain LANG_SE The standard error of measurement of the score for the Language domain MOT_SE The standard error of measurement of the score for the Motor domain SEM_SE The standard error of measurement of the score for the Soc.-Emo. domain OVERALL_SE The standard error of measurement of the score for Overall development (all) COG_flag An indication that fewer than 5 Cognitive items had non-missing responses LANG_flag An indication that fewer than 5 Language items had non-missing responses MOT_flag An indication that fewer than 5 Motor items had non-missing responses SEM_flag An indication that fewer than 5 Social-Emo. items had non-missing responses OVERALL_flag An indication that fewer than 5 items had non-missing responses NOTES Notes about the scoring of the observation generated by the application
Raw scaled scores (also called [MAP] factor scores, ability estimates, or person location
estimates) do not include a prefix or suffix in their variable name and are reported in COG, LANG,
MOT, SEM, and OVERALL. The units for these scores are specific to the CREDI, and do not
correspond to any particular metric (e.g., standard deviations, IQ points, etc.). Average raw
scaled scores increase with age, reflecting developmental progressions.
It is almost always more appropriate to use the (raw) scaled scores for hypothesis testing (e.g.,
regression analysis, ANOVA, etc.) instead of using the z-scores. This is because hypothesis tests
require that variables exhibit interval properties of measurement, which the raw scaled scores do.
An interval scale is one where the difference between values is meaningful and consistent across
the range of values (e.g., the difference between 54 and 55 on the raw scaled scores is the same
as the difference between 49 and 50). A practical example of an interval scale is temperature—

11
the difference between 5 and 8 degrees Celsius is the same as the difference between 17 and 20
degrees Celsius. Although we are confident that the raw scaled scores demonstrate an interval
scale, the transformation required to generate the z-scores described below almost certainly
results in a non-interval scale. These z-scores are therefore less trustworthy for hypothesis
testing.
Norm-referenced standardized scores are marked with a prefix Z_. These scores are
constructed by comparing the raw scores of any given sample to the raw scores of a CREDI
reference sample consisting of 4,652 children with “advantageous” home environments4.
Specifically, we subtract the average raw score of children of the same age from the CREDI
reference sample from the observed raw score of a given child and then divide the difference by
the age-specific standard deviation. A Z-score of 0 thus means that a given child has a similar
developmental status on that domain as the average child in the CREDI reference sample of the
same age. A score of -1 means that the child’s raw score is 1 standard deviation below the same-
age average of the reference sample. These scores are useful for generating effect size metrics, as
each “unit” can be interpreted as a reference-group standard deviation. They can also be used for
across-age and across-domain comparisons.
Preliminary analysis of the CREDI database suggests that the norm-referenced scores are
generally normally distributed around the mean value at each age. However, as discussed further
in Appendix B, our confidence in estimates for very young children (under the age of six
months) is lower given a smaller sample size in our reference sample and noisier estimates of the
mean and standard deviation for these children. We believe that the norm-referenced
standardized score between +/-2 roughly translates to a region where 95% of the scores from the
same-age reference group are located. The norm-reference scores therefore behave largely as
typical “Z-scores.”
Appendix B has additional information on the reference group, how it was constructed, and
where the children included in the reference group come from.
Standard error of measurement (or conditional standard error of measurement) are marked
with a suffix _SE. These variables refer to the estimated precision of the raw scaled score
estimates described above. We recommend using these variables as weights when conducting
statistical tests comparing scores across groups (see Appendix C). The smaller the standard error
of measurement, the more precise the estimate of an individual child’s score. In Item Response
Theory, “extreme” scores at the tail of the distribution of scores (i.e., a score below 40 or above
55) are generally less precise than scores near the mean of the distribution of scores (i.e., a score
around 45-55). Missing responses to age-appropriate items can also decrease precision. By
weighting analyses by the inverse of the squared standard error of measurement (1
𝑆𝐸2), more
precise group mean values can be obtained.
4 The CREDI reference population comprises children in the cross-country CREDI database with
advantageous home environments. To be included in the reference group, maternal educational attainment
(completed secondary school or higher), as well as through the number of activities done by adults with
the child in the last three days (at least 4 out of the 6 MICS home stimulation activities).

12
Informational variables are variables that are not intended for use directly in analysis, but are
provided to help users understand the resulting scores and any issues that might arise for
individual responses. The NOTES variable is a human-readable summary of any issues that arose
during the scoring process that resulted in either 1) a score not being able to be processed for a
given child or 2) questions about the degree of confidence of the obtained score. Children will
not receive a CREDI score if they are missing an AGE value or have fewer than five non-missing
responses. A total of five items must be responded to with a 1 or a 0 for the Scoring App package
to produce a score.
Variables with the _flag suffix also represent a warning to users about specific scores, even
when they were successfully calculated and reported. In particular, observations where the
_flag variable is coded as 1 are observations that had fewer than five non-missing responses
available to calculate a given score. For example, if a caregiver responded with either “yes” or
“no” to only 4 motor items for a given child (with the rest of motor items coded as missing), the
_flag variable should include a value of 1. In cases like this, a score for the given domain was
produced, but since so few valid item responses were available, we may have lower confidence
in these scores. See Appendix C for more guidance about interpreting domain scores with a low
number of responded items.

13
FREQUENTLY ASKED QUESTIONS
Q: I get the following error about missing ID when I upload my data. What should I do?
A: At least one of the observations in your dataset is missing an ID variable. The Scoring App
will consider each row an observation in your data unless that row is completely missing.
Try “filtering” your in Excel and click the dropdown on your ID variable. If you see
(Blanks) as an option, select and correct these rows.
Q: I get the following error about unique ID when I upload my data. What should I do?
A: At least one of the observations in your dataset has a duplicated ID variable. Try selecting
your ID column in Excel and applying Conditional Formatting to identify duplicated ID
values.

14
Q: Can I compare scores calculated from an earlier version of the credi package to scores
created by the Scoring App (version date August, 2021)?
A: The raw scaled scores calculated by the Scoring App should by identical to scores
produced by earlier versions of the credi package in R. However, the normed reference
standardized scores produced by the current credi package are not comparable to earlier
normed reference standardized scores. This is for two reasons: 1) The population of the
reference group has dramatically expanded since the original reference group was created
due to the addition of many new datasets with children that meet the criteria for inclusion
and 2) We used an improved methodology to flexibly estimate the conditional mean and
variance by age of the scores in order to calculate the Z-scores. See Appendix B Reference
Group Creation for additional details.
Q: Can I compare raw scores across domains?
A: It is not possible to directly compare raw scores across domains. The four domains in
CREDI have different age-specific means and standard deviations, which means that a
score of 57 in the motor domain and a score of 55 in the Cognitive domain does not
necessarily mean that the child is more developed in the motor domain than in the cognitive
domain. If you want to compare differences across domains, you can use Z-scores – they
tell you how each domain-specific score compares to the reference sample.
Q: Are the Overall scores the same as the average of the domain scores?
A: No. The Overall score calculated from Short Form and Long Form data represents a single
developmental score, which captures the overall development of the child. This overall
score will be highly correlated with all four domains, but is computed based on a model
combining all items, and cannot be directly computed from the domain-specific scores.
15
FOR MORE INFORMATION
A. ACADEMIC PAPERS
For a broad overview of the goals of CREDI, limitations of the tool, and intended uses of scores,
see:
McCoy, D. C., Seiden, J., Waldman, M., & Fink, G. (2021). Measuring early childhood
development: Considerations and evidence regarding the Caregiver Reported Early
Development Instruments. Annals of the New York Academy of Sciences, 3–10.
https://doi.org/10.1111/nyas.14598
For information on the technical validation of the multidimensional item factor analysis approach
derived to create CREDI scores, see below. (Note also that this publication should be cited as the
validation paper for the CREDI Long Form.)
Waldman, M., McCoy, D. C., Seiden, J., Cuartas, J., CREDI Field Team, & Fink, G. (2021).
Validation of motor, cognitive, language, and socio-emotional subscales using the
Caregiver Reported Early Development Instruments: An application of multidimensional
item factor analysis. International Journal of Behavioral Development, 23(1), 1–10.
https://doi.org/10.1177/01650254211005560
For preliminary psychometric work on the validation of the items used in the CREDI in a large
cross-country validation sample, see below. (Note also that this publication should be cited as the
validation paper for the CREDI Short Form.)
McCoy, D. C., Waldman, M., & Fink, G. (2018). Measuring early childhood development at a
global scale: Evidence from the Caregiver-Reported Early Development Instruments. Early
Childhood Research Quarterly, 45, 58–68. https://doi.org/10.1016/j.ecresq.2018.05.002
For initial psychometric work on the initial validation of the items used in the CREDI in Tanzania,
see:
McCoy, D. C., Sudfeld, C., Bellinger, D. C., Muhihi, A., Ashery, G., Weary, T. E., Fawzi, W., &
Fink, G. (2017). Development and validation of an early childhood development scale for
use in low-resourced settings, Population Health Metrics, 15(3).
For background on the motivation and goals of creating the CREDI, see:
McCoy, D. C., Black, M., Daelmans, B., & Dua, T. (2016). Measuring population-level
development in 0-3. Early childhood matters. The Hague, Netherlands: Bernard van Leer
Foundation.
B. WEBSITE

16
https://credi.gse.harvard.edu/
A. CONTACT INFORMATION
Jonathan Seiden, EdM
PhD Student, Education Policy and Program Evaluation
Harvard Graduate School of Education
Marcus Waldman, EdD
Post-Doctoral Fellow
University of Nebraska Medical Center [email protected]
Dana Charles McCoy, PhD
Associate Professor
Harvard Graduate School of Education
Günther Fink, PhD
Head of Research Unit
Swiss Tropical and Public Health Institute
Associate Professor
University of Basel

17
APPENDIX A: NAMING CONVENTIONS
Table 1: Long Form naming conventions allowed in the CREDI Scoring App
Pilot 4 Long Form
20 Apr 2017 Long Form
29 Jan 2018 Reverse Coded Item
(i.e. negatively worded)
QM08 CREDI_LM01 LF1 FALSE
QM07 CREDI_LM02 LF2 FALSE
QC06 CREDI_LC01 LF3 FALSE
QS01 CREDI_LS02 LF4 FALSE
QS04 CREDI_LS01 LF5 FALSE
QM06 CREDI_LM03 LF6 FALSE
QM03 CREDI_LM04 LF7 FALSE
QC14 CREDI_LC02 LF8 FALSE
QM01 CREDI_LM05 LF9 TRUE
QC04 CREDI_LC03 LF10 FALSE
QM10 CREDI_LM06 LF11 FALSE
QC05 CREDI_LC04 LF12 FALSE
QS17 CREDI_LS03 LF13 FALSE
QM12 CREDI_LM08 LF14 FALSE
QC08 CREDI_LC06 LF15 FALSE
QM09 CREDI_LM09 LF16 FALSE
QC09 CREDI_LC05 LF17 FALSE
QM05 CREDI_LM07 LF18 FALSE
QC07 CREDI_LC08 LF19 FALSE
QM11 CREDI_LM10 LF20 FALSE
QC11 CREDI_LC07 LF21 FALSE
QC10 CREDI_LC11 LF22 FALSE
QC13 CREDI_LC10 LF23 FALSE
QC12 CREDI_LC09 LF24 FALSE
QM14 CREDI_LM12 LF25 FALSE
QM16 CREDI_LM11 LF26 FALSE
QM20 CREDI_LM14 LF27 FALSE
QM13 CREDI_LM13 LF28 FALSE
QM15 CREDI_LM15 LF29 FALSE
QC15 CREDI_LC12 LF30 FALSE
QM19 CREDI_LM16 LF31 FALSE
QM22 CREDI_LM17 LF32 FALSE
QM23 CREDI_LM18 LF33 FALSE
QM18 CREDI_LM19 LF34 FALSE
QC21 CREDI_LC13 LF35 FALSE
QM17 CREDI_LM20 LF36 FALSE
QC20 CREDI_LC14 LF37 FALSE
QS07 CREDI_LS04 LF38 FALSE

18
QS20 CREDI_LS06 LF39 FALSE
QM21 CREDI_LM21 LF40 FALSE
QM24 CREDI_LM22 LF41 FALSE
QS06 CREDI_LS05 LF42 FALSE
QC18 CREDI_LC15 LF43 FALSE
QM26 CREDI_LM23 LF44 FALSE
QC22 CREDI_LC16 LF45 FALSE
QS14 CREDI_LS07 LF46 FALSE
QM25 CREDI_LM24 LF47 FALSE
QC17 CREDI_LC17 LF48 FALSE
QM27 CREDI_LM25 LF49 FALSE
QC19 CREDI_LC18 LF50 FALSE
QM30 CREDI_LM27 LF51 FALSE
QM28 CREDI_LM26 LF52 FALSE
QC16 CREDI_LC19 LF53 FALSE
QM29 CREDI_LM28 LF54 FALSE
QS25 CREDI_LS08 LF55 FALSE
QC26 CREDI_LC20 LF57 FALSE
QC23 CREDI_LC21 LF58 FALSE
QM31 CREDI_LM29 LF60 FALSE
QS21 CREDI_LS12 LF61 FALSE
QC25 CREDI_LC23 LF62 FALSE
QC28 CREDI_LC24 LF64 FALSE
QM37 CREDI_LM30 LF67 FALSE
QS24 CREDI_LS11 LF68 FALSE
QM32 CREDI_LM31 LF69 FALSE
QC34 CREDI_LC26 LF72 FALSE
QC24 CREDI_LC28 LF73 FALSE
QC33 CREDI_LC25 LF74 FALSE
QS19 CREDI_LS18 LF75 FALSE
QC27 CREDI_LC29 LF76 FALSE
QM35 CREDI_LM32 LF77 FALSE
QM34 CREDI_LM33 LF82 FALSE
QC29 CREDI_LC32 LF83 FALSE
QM33 CREDI_LM34 LF86 FALSE
QC31 CREDI_LC34 LF88 FALSE
QC35 CREDI_LC37 LF92 FALSE
QM36 CREDI_LM35 LF93 FALSE
QM38 CREDI_LM36 LF98 FALSE
QM39 CREDI_LM37 LF105 FALSE
QS09 CREDI_LMH01 LFMH1 TRUE
QS23 CREDI_LMH02 LFMH2 TRUE
QS16 CREDI_LMH03 LFMH3 TRUE
QS11 CREDI_LMH04 LFMH4 TRUE

19
QS18 CREDI_LMH07 LFMH7 TRUE
QC37 - LF81 FALSE
QC50 - LF95 FALSE
QS43 - LF56 FALSE
QC36 - LF84 FALSE
QS46 - LF85 FALSE
QS45 - LF59 FALSE
QC42 - LF87 FALSE
QS50 - LF101 FALSE
QC46 - LF89 FALSE
QC41 - LF90 FALSE
QS58 - LF91 FALSE
QC40 - LF65 FALSE
QS44 - LF66 FALSE
QC44 - LF94 FALSE
QC47 - LF108 FALSE
QC43 - LF100 FALSE
QC39 - LF97 FALSE
QC38 - LF71 FALSE
QS30 - LF63 FALSE
QS51 - LF104 FALSE
QS29 - LFMH6 FALSE
QS53 - LF102 TRUE
QC45 - LF107 FALSE
QS55 - LFMH8 TRUE
QS41 - LF78 FALSE
QS38 - LF79 FALSE
QC49 - LF96 FALSE
QS35 - LF80 FALSE
QS33 - LFMH5 TRUE
QS36 - LF70 FALSE
QS57 - LFMH9 TRUE
QC51 - LF99 FALSE
QC48 - LF106 FALSE
QS52 - LF103 FALSE

20
APPENDIX B: REFERENCE GROUP CREATION
Evidence suggests that, for children benefiting from advantageous home environments including
educated parents and exposure to stimulating activities, many cross-country differences in
developmental trajectories are minimized5. Villar et al. (2019) find that “neurodevelopmental
milestones and associated behaviours in early childhood are… likely innate and universal, as
long as nutritional and health needs are met” (p. 1). Inspired by the usefulness of the World
Health Organization’s Weight-for-age and Height-for-age Z-scores (WAZ and HAZ) in framing
the conversation around nutrition and development, the CREDI team wanted to create a
reference group with which to create “development-for-age” Z-scores that would give
information about how a given child’s development compares with a group of same-age children
with advantageous home environments.
The full cross-country CREDI database comprises 19,165 children from 17 countries. We
selected a subset of these children for inclusion in the CREDI reference group based on our
review of the literature and aiming to capture those children with advantageous home
environments. To quality for inclusion in our reference group, children had to have 1) a mother
that completed secondary school or higher education and 2) be in a household where least one
adult had engaged in 4 or more of the 6 “Play activities” from the Family Care Indicators with
the child. These indicators are part of UNICEF’s Multiple Indicator Cluster Survey (MICS)
Questionnaire for Children Under Five and are commonly used as a measure of stimulating
activities in the home6. As Table 2 shows, at total of 4,652 children (24% of our full cross-
country sample) met the criteria for inclusion in the reference group, with broad representation
across countries and contexts.
Table 2: Country distribution of children in reference group
5 See Fink, McCoy, and Yousafzai, 2020 6 See Hamadani, et al., 2010; Kariger, et al., 2012; McCoy et al., 2016; and Cuartas et al., 2020
for examples.
Country Number of children
Bangladesh 280
Brazil 1399
Cambodia 66
Chile 171
Colombia 215
Ghana 175
Guatemala 25
India 165
Jordan 35
Laos 43
Lebanon 72

21
In addition to geographical representation, Figure 1 displays the age distribution of children in
the reference group. For children 6-35 months of age, there were at least 100 children in the
reference group. This means our confidence in capturing an accurate mean and standard
deviation is higher in this age range. We are slightly less confident in our estimates of younger
children under six months of age, where we had fewer than 200 children in total with which to
estimate the mean and standard deviation.
Figure 2: Age distribution of children in reference group
To estimate the reference group mean and standard deviation by age, we fit a loess model using
the R package gamlss allowing the mean and the variance to vary as a function of the age of
children unconstrained by a parametric form. Given the non-parametric nature of this analysis,
we fit a k-fold validation procedure to select an optimal bandwidth for the loess function, and
found that .4 minimized RMSE error in a test set.
Using our loess model, we then fit the mean and standard deviation for each domain, the Overall,
and the Short Form scores. The results are presented below in Figure 3.
Nepal 54
Pakistan 55
Philippines 365
Tanzania 155
USA 793
Zambia 584
Total 4,652

22
Figure 3: Estimated mean and standard deviation of CREDI scores as a function of age
As Figure 3 shows, the mean and variance function follow a monotonic but non-linear trend,
with a steeper slope for young children in most domains, and variances that fluctuate slightly as
children age. Using the models fit above, we then extract estimates of the mean and standard
deviation for children 0-36 months old, and use these estimates to calculate normed reference Z-
scores for children.
The subset of children used in this reference group analysis is a convenience sample and is not
nationally representative of any countries included. Further, while we are confident that we have
captured two important aspects of children’s home environments critical to their development,
we do not have any measures of nutritional status, physical health status, or other key predictors
of healthy development. Despite the limitations of this convenience sample, we believe that the
use of this reference group provides a reasonable (if conservative) estimate of typical
developmental growth trajectories for children with advantageous environments. As more users
collect data with CREDI, we will periodically update the CREDI reference group. As such, we
recommend re-calculating scores based on raw data whenever attempting to compare Z-scores to
newly scored data to ensure they are calculated using the same reference group.

23
APPENDIX C: DOMAIN SCORES & IMPRECISION
As noted in the main document, not all CREDI items load onto all domains. This can mean that
even though a given observation (child) has responses to more than five items, it is possible that
fewer than five items loading onto a particular domain were responded to. In this case, the
Scoring App will calculate the scores for all domains, but we may have lower confidence in the
scores obtained for some domains. Understanding this (potential) source of imprecision can be
helpful when attempting to analyze CREDI data and interpret results
Flag variables
When fewer than five responses were recorded for items loading onto a particular domain, the
domain _flag variable for the observation will contain a 1. The child’s score will still be
reported, but will rely more heavily on their age, potentially resulting in mean-bias in the
estimated score.
The flexible start and stop rules of the CREDI Long Form can create situations in which it is
difficult to obtain a sufficient number of items responded to for some domains and that many
children will have one or more domain scores “flagged”. This concern is also related to age.
CREDI Long Form items are ordered by “difficulty” (i.e., the expected level of development
required to have a high probability of responding “Yes”) and are responded to until 5
consecutive “No” responses are received. “Easier” items often load more on Motor development,
whereas most Language items are more difficult. Starting at the given start point for each age
group, the minimum number of items needed to progress through in order to ensure 5 domain-
relevant items is listed in Table 3.
Table 3: Required number of items responded to avoid “flagged” domain scores by domain
Age Group Motor Cognitive Language Social-
Emotional
0-5 months
(starting at LF1)
7 21 35 23
6-11 months
(starting at LF5)
9 16 30 37
12-17 months
(starting at LF11)
9 12 25 36
18-23 months
(starting at LF29)
6 18 15 40
24-29 months
(starting at LF38)
11 12 15 30
30-35 months
(starting at LF51)
13 8 10 17
Even many children in the CREDI reference group (see Appendix B) did not have the minimum
required number of items observed to avoid a “flag”. Specifically, whereas just 1.1% of children

24
did not have sufficient observations to avoid a flag on the Motor domain score, 20.9% of Social-
Emotional Domain scores, 20.9% of Language domain scores, and 19.5% of Cognitive domain
scores in the reference group had flags. Given this, we anticipate that “flags” will be common in
most users’ data.
Incorporating imprecision into analysis
Even though domains with a _flag may be less precisely estimated that those without, we do
not recommend listwise deletion in analysis and restriction to non-flagged observations. Instead,
we recommend incorporating the imprecision into the analysis through two approaches: 1) using
the standard error of measurement and 2) conducting sensitivity analyses.
Weighting by the standard error of measurement. The main recommended approach to
incorporating imprecision into the analysis is by weighting all analyses by the inverse of the
squared standard error of measurement (variables marked with _SE). As mentioned in the main
document, this weighting procedure downplays the influence of imprecise observations when
calculating group statistics. Flagged domain scores will typically have a larger standard error of
measurement because there are fewer observed items and the confidence in the estimated score is
lower. To weight, first calculate the inverse of the squared standard error of measurement (1
𝑆𝐸2)
for each domain/score and then use these weights when calculating any statistic7. While this
procedure is recommended for all analyses of CREDI, it is particularly important when a high
proportion of observations are flagged.
Conducting sensitivity analyses. Conducting a sensitivity analysis is also a good way to ensure
that your results are not overly influenced by flagged observations. First run the analyses as
described above with weighting and including all observations. Then run the same analyses, but
with using listwise deletion and excluding flagged observations. Results are unlikely to change
substantially, but in the event they do, it is an indication that imprecise observations may be
clouding any conclusions your data may be suggesting. If this happens, we recommend reporting
both full and restricted results, and highlighting the limitation of the imprecise data.
7 Procedures to weight vary by statistical software used and statistic generated. A sample procedure to
calculate the weighted mean for the cognitive domain would be (in Stata): gen cog_weight = 1 / cog_se^2
summarize cog [aw=cog_weight]
In R, a similar result would be generated by scores$cog_weight <- 1 / scores$cog_se^2
weighted.mean(x = scores$cog, w = scores$cog_weight)