data modelling for a etter analytics environment · measure/categorical matrix and example data...
TRANSCRIPT

1
Paper 3127-2019
Data Modelling for a Better Analytical Environment
Linus Hjorth, Infotrek
ABSTRACT
Developing and maintaining an analytical environment can be hard—especially if your area
of interest is complex, involves more than one subject area, and has several source systems
that needs to be integrated. There are several tools available to us when developing and
maintaining such an environment, usually a data warehouse; examples are data and
analytical processes, and documentation. One of the neatest parts of documentation (and
communication) is the use of information and data models. In this paper, I discuss how to
use information models and some of the data modeling techniques that can be used in a
data warehouse. I also show how to exchange data models between data modeling tools
and SAS® metadata, and tools like the ETL tool in SAS® Data Integration Studio.
INTRODUCTION
So, in what ways can data models contribute to a better analytics environment, and at the
end, better analytics? If we look from the perspective – the one goal to support business
needs, one prime tool to help understand and communicate those is information models.
With information models we can both capture direct business report and analysis
requirements, as well document the business landscape. Information models is hard to
strictly define. Also, they tend to be used when needed.
To give business value over time, we need a functioning IT infrastructure and governance.
In IT, physical data models have been used as long there have been databases. A physical
data model shows how a system is, or should be, implemented in a database.
Logical data models haven’t been regarded as mandatory. A logical data model defines the
data, their relationships and other constraints. Naming in the logical model could be in
business terms, to ease verification by subject matter experts.
To conclude, if your concern is
• Communication – use information models
• Data integrity – use logical data models
• Performance – use physical data models
INFORMATION MODELLING
Information models are usually not seen as mandatory, and therefore not used very often.
This fact makes it an underused and undervalued resource. Consider that the failure of
many analytical and BI projects can be related to the lack of communication. And by
communication, we usually relate to communication between business stakeholders, subject
matter experts, and the development teams. Here information models can play an
important part.
There are several names for information models, some being:
• Subject Model
• Logical Business Model
• Conceptual Model
• Domain Model

2
A subject model is usually on a
high level, where you document
the main entities, relationships
and only crucial attributes. But
still it will give you crucial infor-
mation about your business.
Like in the diagram, you can
observe that a customer can
hold several accounts and must
hold at least one. From this we
can conclude you cannot be
considered a customer unless
you hold an account. A subject
model is perfect to use in the
assessment phase of a project.
When you go to the implemen-
tation phases you want to detail
the models, as outlined below.
There are typically two areas of use for information models: analytical requirements and
domain modelling.
MODELLING ANALYTICAL REQUIREMENTS
You usually start off documenting what the business wants to achieve with the analytical
initiatives. This boils down to what information is required, the level of detail (granularity)
and the information structure. In many scenarios, this will result in a dimensional model.
The reason for this is that most analytical requirements can be described with measures
(facts) and categories (dimensions). Even if your application would be somewhat different,
like an analytical base table, you can still use a dimensional model as base for defining the
requirements.
Figure 2: Example dimensional model
Figure 1: Example subject model

3
DOMAIN MODELLING
If we wish to source data and build the foundation of our analytical environment for multi-
purpose, and reusability, we need to understand the details about the data that we wish to
store.
A domain model (or a Business Logical Model) tells us how the business works. This
comprises identifying business entities, relationships and rules how different information
relates to each other. It should be source system independent. But you can use source
systems as one input to build such a model. These models tend to look like logical data
models using standard third normal form (in non-data warehouse environments where data
temporality is implemented).
Figure 3: Example domain model
A domain model is a great starting point when building your data model for your data
warehouse detail layer.
If the domain model is developed driven by specific business requirements (e.g. analytical
initiatives), it has a higher probability to succeed. Without this driver, domain modelling can
be perceived as an academic exercise with little or no business value. Some sites are trying
to create an enterprise information model, which of course can beneficial for many use
cases. However, this is quite rare, probably because this requires a quite high effort, both in
terms of competence and the amount of work that need to be invested. And any develop-
ment processed must be aligned with such model, or else it will become quickly obsolete.
THE CASE FOR INFORMATION MODELLING
As you might already have sensed, because information models are for communication, its
main value is to bring different perspectives together. That can be represented in different
user cases, data from disparate systems, and different applications using the same
analytical environment.

4
This will lower the risk of misunderstandings, which could lead to failed, if not projects, at
least sprints. An information model is also good to visualize complexity in different areas –
which is something that can be helpful when prioritizing and estimating development
efforts.
Another powerful use is mapping analysis requirements towards the domain model, and
then towards source systems, so you can quickly verify if the requirements can be fulfilled
with existing data or requires further sourcing.
INFORMATION MODEL CONSIDERATIONS
Abstraction
In most modelling (data and
information) you will frequently decide
the level of abstraction. Let’s say that
you model case management. Then
you might have different kind of cases,
like incident, change request, request
for information etc. Will you model
them as separate entities, or by a
Case Type attribute? If the set of
attributes for these differ significantly,
you might go with separate entities.
Another situation could be
classifications that might change over
time, like status. Here you can either
model with a set of different
attributes, or perhaps as status and
status time attributes. The former is
clearer for the reader, whereas it will make the model more vulnerable for change (i.e. if we
add more statuses, or if a status can reoccur).
Some flexible modelling tools adds the possibility to display domain values as enumerations.
This will give god visibility of the model, still give the flexibility to add new domain values
without changing entity structures.
Homo- and Synonyms
Homonyms can be quite “dangerous”. You think you are talking about the same thing, when
you’re not. Something that can be discovered way into a project, and can be costly and lead
to failures, and distrust.
Synonyms might not be as damaging as homonyms but adds to confusion and depressing
efficiency both system wise and in the line of business.
Class vs Instance
Class is another word for keeping taxonomies, like abstract structures. Instances refer to an
actual “real”. Domestic cat is a class, my cat Max is my instance of a domestic cat.
Especially in verbal communication I have often found that we are not sure if we refer to a
class or instance. This seems to occur especially when talking about products, like a
telephone model, vs the phone our customer buy/use. But when implementing this in the
information model, it is usually not difficult, but you need to consider this distinction when
naming entities.
Figure 4: Abstractions: classification vs attribufication

5
Figure 5: Class vs instance - naming distinction
Aggregations and Calculations
One key feature of analytical and BI systems is the ability to create aggregations and
calculations. This is true in many of the layers in our systems. I have noticed a reflexive
behavior to include the information that a term is aggregated in its name. But the problem
is that you could aggregate your measures in tons of ways, and in many applications
dynamically. The term “Total sales” doesn’t really tell you total of what? My suggestion is
that you leave this naming either to be obvious by the context (i.e. a star schema with
customer and date as granular levels for sales) or managed by the report layer.
Calculations on the other hand enriches and transforms data in not always obvious ways. So
the term should include a notion of the definition/result of the calculation. Here is the
challenge to come up with crisp names.
GETTING STARTED - MODELLING METHODOLOGIES
Understanding models and being able to edit one is one thing. But where to start, and get
your models accurate? If you need help with the process, there are some methodologies
that can guide.
ENHANCING THE SAS ANALYTICS LIFE CYCLE
The SAS Analytics Life cycle was
created mainly to deal with the
80-20-0 situation: a lot of work
spent on preparing data, some
on statistical modelling, none in
deploying them. The framework
itself has no clear data/
information modelling
guidelines, but I think they
come in handy in this process.
When doing the Ask phase, you
should be able to do an infor-
mation model that corresponds
to the question you are asking.
Also, a preliminary data model
can be produced here. In the
Prepare phase, refine the phy-
sical model. And finally based on the
Exploration phase you should able to
set a final model.
Figure 6: Data models and Analytics Life Cycle

6
BUSINESS EVENT ANALYSIS & MODELLING – BEAM
This methodology is public domain and documented in the book “Agile Data Warehouse
Design – Collaborative Dimensional Modeling, from Whiteboard to Star Schema”. As the title
implies, the method is directed towards dimensional modelling.
One of the core concepts is the “7 W’s”: Who, What, When, Where, hoW (many/much),
Why, hoW (did it happen), six of them inspired by journalistic methods. In workshops the
audience will answer these questions applied to the area of interest. The hoW (many/much)
will be modelled as facts/measures. The other W’s will result in dimensions. In the process
there are many more deliverables than a dimensional model, like hierarchical ontologies,
measure/categorical matrix and example data sheets.
ENSEMBLE LOGICAL MODELLING – ELM
This method is based on BEAM,
but one major difference – the
result is a logical ensemble
model. Ensemble here refers to a
logical grouping of entities that as
whole describes a core business
concept: the identifier(s),
attributes, and relationships to
other core business concepts.
ELM springs out from the data
vault community (see later in this
paper). In nature this is directed
to model domain model rather
than end user report require-
ments. ELM is not public domain
– apart from YouTube clips docu-
mentation is available by taking a
course.
Figure 7: Sample ELM postit model

7
BIP: BUSINESS NEEDS – INFORMATION MODEL – PROTOTYPE
This method (crated by the consultancy Infotrek) is also based on BEAM. But with major
extension of the mandatory step of building a prototype. Going all the way from business
requirements, mapping towards sources and present the result in one sprint, boosts
stakeholder engagement. Also, you get direct feedback if the requirement was properly
defined, and the data to support it is sufficient.
Figure 8: The BIP cycles, from analyzing business requirements, to information model and build prototype
DATA MODELLING
Data Modelling describes what to do and how to implement it. Data models can be used
throughout the analytical environment and the analytical process. Sometimes it’s not
necessary to maintain graphical models separately; especially physical data models are
quite simple to generate from a data base schema directly. Usually in the beginning of an
analytical system life cycle, data models are being worked upon the mostly in the beginning.
Depending on the nature of the solution, you may not need data models in every layer.
Also, some solution includes semantic layers in the architecture – these can usually replace
or act as an information or logical data model.
DATA MODEL PARADIGMS
Different layers of the analytical environment serve different purposes. Therefore, different
modelling approaches are typically used.
The analytical layer is usually designed as star schemas. Other pattern exists (especially
physically) like analytic base tables, de-normalized information marts, or OLAP cubes. Even
if not all your end user will not use the star schema, it’s still often created. It will support
multi-use-cases, and reusability of data structures and ETL logic. The down side is that you
implement another physical data layer that adds data latency to your ETL process.

8
Third Normal Form – 3NF
For the detail layer, historically Bill Inmon inspired 3rd Normal Form (3NF) models with
added temporality, has been widely used and earlier seen as a de-facto standard.
Introducing data temporality usually means that the physical data model cannot be
implemented using standard referential constraints. This because the prime key (PK) of a
table consists both business key (surrogate or natural) and a timestamp for temporality. A
foreign key (FK) to another table should comprise the whole PK, but this is awkward, this
will lead to unnecessary inserts and complicated joins. The solution is often that you just
skip the timestamp in FK and turn off referential integrity in the data base.
Figure 9: 3NF PK - FK without temporal date column
3NF is also considered somewhat inflexible. Changes in business rules can drive structural
change in existing tables and ETL process which makes maintenance hard. Examples that
drive changes in the schema, and ETL jobs are adding new attributes, or change a 1-M
relationship to M-M.
Dimensional Modelling and Star Schemas
Star Schemas has its strength in simplicity. Most experienced data user can understand the
concept of facts and dimensions. But it is not ideal for all situations. For instance, it can be
hard to design N-occurrences (an example if a doctor’s visit results in multiple diagnosis). In
those situations, you need to compromise, or use a different pattern than a strictly
dimensional model.
Also, there are problems when trying to implement dimensional models for multi-use-case
detail data. The world is much more complex than just facts and dimensions (with
hierarchies with 1-M relationships between each level). Such detail data layer introduces
bridge tables and snow flaking (normalization of dimensions), which eventually will make
this kind of model as hard to understand and use as 3NF model.
EMPLOYEE
POSITION
Employee_IdPK
Employee_Name
Date_Hired
Position_IdPK
Position_Start_Date
Position_End_Date
Job_Code
Employee_IdFK
Valid_From_DatePK
Valid_From_DatePK
Valid_To_Date
Valid_To_Date
Employee_NoPosition_No

9
Figure 10: Non-standard relationships and design for detail data adds complexity to dimensional models
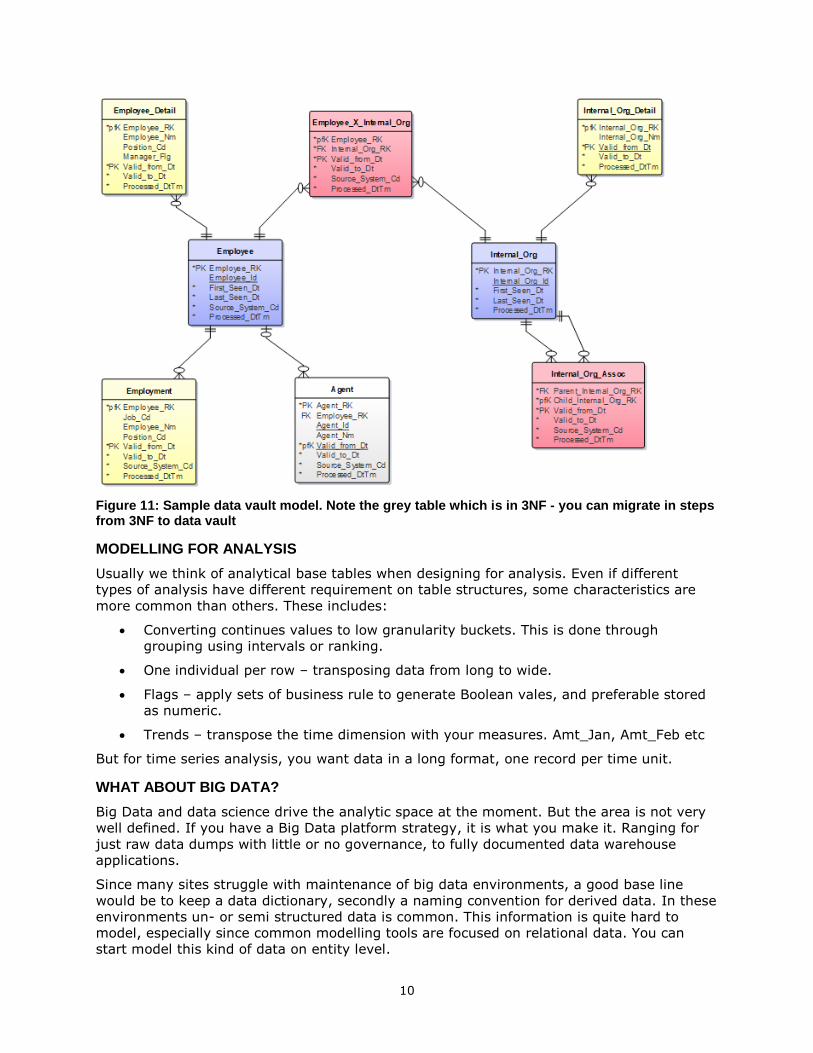
DATA VAULT
One emerging data modelling approach is data vault and is nowadays almost de-facto
standard for new data warehouse implementations. Its main characteristic is that you
separate the concepts of business keys (“Hub”), relationships (“Link”) and attributes
(“Satellite”) into separate tables. Any temporality is applied only to attributes (satellites), so
you don’t have to consider that when creating relationships (FK’s). Also, since relationships
are in separate tables, its PK is always the combination of the FK from the hubs that are
involved. In 3NF when modelling a relation as 1-M, and M-M you’ll get different structures.
In data vault both cases are implemented with the same construct as a link table. If the
business rule change (let’s say from 1-M to M-M) the data vault model doesn’t need to
change, and chances are, no or few to the ETL.
Data vault also allows to group attributes into separate satellite tables, based on the
characteristics of the solution and data sources. This design is pro maintainability and help
ETL deployment work smoothly over time.
10
Figure 11: Sample data vault model. Note the grey table which is in 3NF - you can migrate in steps from 3NF to data vault
MODELLING FOR ANALYSIS
Usually we think of analytical base tables when designing for analysis. Even if different
types of analysis have different requirement on table structures, some characteristics are
more common than others. These includes:
• Converting continues values to low granularity buckets. This is done through
grouping using intervals or ranking.
• One individual per row – transposing data from long to wide.
• Flags – apply sets of business rule to generate Boolean vales, and preferable stored
as numeric.
• Trends – transpose the time dimension with your measures. Amt_Jan, Amt_Feb etc
But for time series analysis, you want data in a long format, one record per time unit.
WHAT ABOUT BIG DATA?
Big Data and data science drive the analytic space at the moment. But the area is not very
well defined. If you have a Big Data platform strategy, it is what you make it. Ranging for
just raw data dumps with little or no governance, to fully documented data warehouse
applications.
Since many sites struggle with maintenance of big data environments, a good base line
would be to keep a data dictionary, secondly a naming convention for derived data. In these
environments un- or semi structured data is common. This information is quite hard to
model, especially since common modelling tools are focused on relational data. You can
start model this kind of data on entity level.

11
USING DATA MODELS WITH SAS
Now you have created some nice data models and want to use them when creating
databases. You could either have the tool generating your data base (forward engineering)
or import the model as metadata.
FORWARD ENGINEERING
Forward engineering can be done in two ways, connect to the data base and create/update
the schema, or generate DDL (Data Description Language) code which you could execute
yourself from SAS. For the later, your model tool needs to be able to connect to SAS (or any
database of your choice) using e.g. ODBC. For DDL, you need your modelling tool to
generate SQL that is compatible for your data base. For Base SAS libraries specifically Erwin
has that support, most other tools don’t.
Forward engineering is usually feasible in new systems, or when you implement new areas
in your system. For updating existing entities its’s usually quite cumbersome – so usually
the maintenance organization write scripts on their own to enforce model changes.
METADATA INTEGRATION
For the below discussion I refer to SAS 9.4 Intelligence Platform. For Viya, full data
management capability isn’t yet available.
SAS has some addon licenses for Data Integration and Data Management Server called SAS
Metabridges. Literarily hundreds of formats are available. With Metabridges interface you
have wizards that lets you compare and analyze changes down to column level and chose
what to. But, don’t expect that everything that you specify in the modelling will be
translated correctly to SAS metadata. The version of your modelling tool, and capability of
the Metabridge for your specific tool have impact on the result.
Display 1. Examining differences during metadata import & compare

12
CONCLUSION
Creating and updating documentation is task that is seldom at an usable level. It’s either too detailed – which can lead to mismatch with reality over time. Or it’s to scarce. Data models can act as a center piece in your documentation. It can reveal your most important resource in your system – your data! And this in level of detail that’s required. The use of information models can reduce risk and give more business value during
development. Also, data models are useful suing maintenance to protect the consistency
and quality of your system.
REFERENCES
Inmon, W.H. 2005. Building the Data Warehouse. 4th ed.: Wiley
Kimball, R. and Ross, M. 2013. The Data Warehouse Toolkit. 3rd ed.: Wiley
Linstedt, D. 2011. Supercharge Your Data Warehouse: CreateSpace Independent Publishing
Platform
Hultgren, H. 2012. Modeling the Agile Data Warehouse with Data Vault (Volume 1):
Brighton Hamilton
Cuba, P. 2018. “Integrating SAS and Data Vault.”Proceedings of the SAS Global Forum
2018, 1898-2018. Denver, CO: SAS Institute.
ACKNOWLEDGMENTS
Ylva Andersson, Siavoush Mohammadi and Saiam Mufti for valuable feed-back throughout
the process of writing this paper.
CONTACT INFORMATION
Your comments and questions are valued and encouraged. Contact the author at:
Linus Hjorth
Infotrek
+46 705651833
infotrek.se