data needs for achieving high-performance buildings
TRANSCRIPT
An Authoritative Source of Innovative Solutions for the Built Environment
Data Needs for Achieving High-Performance Buildings
National Institute ofBUILDING SCIENCES
High-Performance Building Data Collection Initiative
With support from the New Buildings Institute and theNational Environmental Balancing Bureau

1
DATA NEEDS FOR ACHIEVING HIGH-PERFORMANCE BUILDINGS
TABLE OF CONTENTS EXECUTIVE SUMMARY .................................................................................................................................. 4
CBECS Starts Discussion ............................................................................................................................ 4
Identifying Data Needs.............................................................................................................................. 5
Who Needs Data ....................................................................................................................................... 6
Making Data Useful ................................................................................................................................... 6
What is Already Available? ....................................................................................................................... 6
Collecting Additional Data ........................................................................................................................ 7
Who Should Do It and at What Cost? ....................................................................................................... 8
Recommendations .................................................................................................................................... 8
INTRODUCTION ............................................................................................................................................. 9 About This Report ................................................................................................................................... 10
CBECS is the Spark ................................................................................................................................... 11
Emerging Codes, Tools and Technologies ............................................................................................... 13
IDENTIFYING DATA NEEDS .......................................................................................................................... 14 Energy ..................................................................................................................................................... 15
Building Characteristics ........................................................................................................................... 17
High-Performance Building Attributes .................................................................................................... 18
WHO NEEDS DATA? .................................................................................................................................... 21 Building Owners ...................................................................................................................................... 21
Facility Managers .................................................................................................................................... 21
Educators ................................................................................................................................................ 22
Design Professionals ............................................................................................................................... 22
Codes and Standards Developers ........................................................................................................... 23
Regulators ............................................................................................................................................... 23
Voluntary Programs ................................................................................................................................ 23
Manufacturers and Software Developers ............................................................................................... 24
Other Data Users..................................................................................................................................... 25
2
MAKING DATA USEFUL ............................................................................................................................... 25 WHAT DATA ARE AVAILABLE AND HOW CAN THEY BE USED? ................................................................... 29
Database for Analyzing Sustainable and High-Performance Buildings (DASH) ...................................... 29
EPA Portfolio Manager ............................................................................................................................ 31
USGBC’s Building Performance Partnership and Other Programs ......................................................... 31
Building Owners and Managers Association EER and 360 Programs ..................................................... 33
International Facility Management Association ..................................................................................... 34
Sector-Specific Data Efforts .................................................................................................................... 35
State and Local Data Initiatives ............................................................................................................... 36
Utilities .................................................................................................................................................... 38
Private Monitoring Services .................................................................................................................... 38
Manufacturers ........................................................................................................................................ 39
Evaluation Services and Testing Labs ...................................................................................................... 39
AIA 2030 Commitment ........................................................................................................................... 40
CoStar ...................................................................................................................................................... 40
Greenprint Foundation ........................................................................................................................... 40
Data Reporting Companies ..................................................................................................................... 41
Individual Building Owners ..................................................................................................................... 41
Other Data Sources ................................................................................................................................. 41
HOW CAN ADDITIONAL DATA BE COLLECTED? .......................................................................................... 42 Integration of Existing Datasets .............................................................................................................. 43
Post Occupancy Evaluations ................................................................................................................... 43
Commissioning and Audits ...................................................................................................................... 43
Benchmarking and/or Disclosure ............................................................................................................ 44
Incentives ................................................................................................................................................ 44
Sensors, Building Automation Systems and Field Instruments .............................................................. 45
Sub-Metering .......................................................................................................................................... 45
Permits Database and Building Information Modeling (BIM)................................................................. 45
Modeling ................................................................................................................................................. 46
Utilities .................................................................................................................................................... 47
Smart Grid and Smart Meters ................................................................................................................. 47
Surveys .................................................................................................................................................... 48
Energy Service Companies (ESCOs) ......................................................................................................... 48
3
ASTM Building Energy Performance Assessment ................................................................................... 48
Other Methods........................................................................................................................................ 49
WHO SHOULD DO IT AND HOW OFTEN? .................................................................................................... 49 WHAT WILL IT COST? .................................................................................................................................. 50 RECOMMENDATIONS ................................................................................................................................. 52 APPENDIX A: ORAL HEARING PARTICIPANTS .............................................................................................. 54 APPENDIX B: WRITTEN TESTIMONY ............................................................................................................ 55 APPENDIX C: ABOUT THE SPONSORS .......................................................................................................... 56
National Environmental Balancing Bureau ............................................................................................. 56
National Institute of Building Sciences ................................................................................................... 56
New Buildings Institute ........................................................................................................................... 57
APPENDIX D: HEARING PANELIST BIOGRAPHIES ........................................................................................ 58 Henry L. Green, Hon. AIA ........................................................................................................................ 58
Gordon V.R. Holness, P.E ........................................................................................................................ 58
Ronald L. Skaggs, FAIA, FACHA, FHFI, LEED AP ....................................................................................... 59
4
DATA NEEDS FOR ACHIEVING HIGH-PERFORMANCE BUILDINGS
EXECUTIVE SUMMARY Buildings are complex and becoming more so as owners and policymakers demand particular levels of performance. The focus is no longer on single building characteristics but providing high performance through the optimization of numerous attributes including safety and security, accessibility, historic preservation, functionality, productivity, sustainability, cost effectiveness, aesthetics, and resiliency.1 Despite the push to achieve high performance by building community leaders, policymakers and building owners, such attempts will stall unless all members of the building team trust the data demonstrating achievement of the intended results or identification of problems identifying necessary adjustments. This trust is built on the availability of credible data. Recognizing the impacts of data on the future of the entire building community, the National Institute of Building Sciences (the Institute) focused on data needs to produce high-performance buildings. The Institute announced The High-Performance Building Data Collection Initiative on May 3, 2011. To assure that the Initiative represented the diverse needs of the building community, the Institute solicited testimony from all interested stakeholders. An oral hearing was held July 18, 2011 where 21 building community representatives from diverse segments provided testimony.2 Written testimony also was accepted.3 The representative hearing and this report are the result of support from the New Buildings Institute (NBI) and the National Environmental Balancing Bureau (NEBB).4
CBECS Starts Discussion
In late April and early May, 2011, the Energy Information Administration (EIA) made two announcements related to the Commercial Building Energy Consumption Survey (CBECS). First, EIA suspended the 2011 version of the survey due to a lack of funding.5 Next, EIA would not release the long awaited 2007 survey results due to statistical errors in the results.6
1 Energy Independence and Security Act of 2007, §401(12) defines a high-performance buildings: “The term ‘high-
performance building’ means a building that integrates and optimizes on a life cycle basis all major high performance attributes including energy conservation, environment, safety, security, durability, accessibility, cost-benefit, productivity, sustainability, functionality, and operational considerations.” 2 A list of those providing oral testimony is available in Appendix A of this report.
3 A list of those providing written testimony is available in Appendix B of this report.
4 Information on the sponsoring organizations is available in Appendix C of this report.
5 http://www.eia.gov/pressroom/releases/press362.cfm
6 http://www.eia.gov/emeu/cbecs/
5
While CBECS provides valuable data in its own right, it also serves as fundamental information for many building programs. Most notably, the Energy Star program for commercial buildings jointly sponsored by the Environmental Protection Agency (EPA) and Department of Energy (DOE), the U.S. Green Building Council’s (USGBC) Leadership in Energy and Environmental Design (LEED) program and the Green Building Initiative’s (GBI) Green Globes program. CBECS has not been without critics, particularly in the data collection frequency, scope, robustness, interoperability and data exchange. However, CBECS has represented the best data on building energy use available to date. In addition to the CBECS announcements, leaders within numerous sectors of the building community have begun to recognize the emergence of codes, tools and technologies that will ultimately transform the industry. These codes, tools and technologies intimately relate to the accessibility of credible building data.
Identifying Data Needs
Members of the building community require numerous types of data to achieve high-performance building goals. Given the recent announcements from EIA, many witnesses focused on energy as a specific area of needed data. However, witnesses identified additional need areas—including those that address many of the high-performance building attributes. Support for continuing to fund a regular CBECS type survey by the federal government was widespread.7 However, many witnesses expressed the need to address several shortcomings and expand the scope of energy and building characteristic data—either through CBECS or by an expanded data collection process. Any data related to building performance (whether energy or another high-performance attribute) must include building characteristic data. Such characteristic data informs the reasons behind particular results and increases the value of performance data in comparing results across buildings with similar characteristics. Truly understanding a building’s performance and the interactions among various design, construction and operational choices requires information about other high-performance building attributes.8 Within many of the high-performance building attributes, some specific recommended data points were identified. Attributes with the greatest interest included indoor environmental quality (IEQ), water use, waste, security, accessibility, cost and finance.
7 Dorey Testimony (Daikin-McQuay), Burr Testimony (IMT), Lewis Testimony (NEMA), BOMA Greater Phoenix
Testimony, Deodhar Testimony (Autodesk), Zatz Testimony (EPA Energy Star) 8 Rossola Testimony (GREENGuard)
6
Who Needs Data
With the diversity of perspectives provided in both written and oral testimony and the number of disciplines engaged in the design, construction, operations and maintenance of buildings, it is obvious that there are numerous users of building-related data, each with different requirements. Understanding these users and their needs will allow development of datasets with the greatest buy-in and acceptance across the building community. Users identified by witnesses include:
Building Owners
Facility Managers
Tenants
Occupants
Educators
Researchers
Design Professionals
Codes and Standards Developers
Regulators
Voluntary Programs
Manufacturers and Software Developers
Real Estate Professionals and Appraisers
Making Data Useful
The existence of data points without information on the source, the sample set and the ability to integrate datasets severely limits its usefulness. Almost all witnesses emphasized that datasets must be of sufficient quality to facilitate their use. Achieving such quality across the numerous datasets existing today and those developed in the future will require a common protocol for data acquisition.9 In addition to protocols for acquisition, individual data points must have sufficient embedded information to allow integration with other datasets.10 Such embedded information relies on the establishment of common definitions and labeling requirements for metrics of interest.11 In addition to standards on collection and verification of data and the definitions for such metrics, standards are required on how data should be aggregated and anonymized to protect individual data sources and their business information.12
What is Already Available?
Numerous repositories of building related data already exist. However, they often are designed for use by a specific sector of the building community to fulfill a specific need. In general, the
9 Woods Testimony (IEQ Consultant), Wiggins Testimony (NEBB/Newcomb & Boyd)
10 Dunning Testimony (Sphere E)
11 Turner Testimony (NBI), Dunning Testimony (Sphere E)
12 Lewis testimony (NEMA), Pauley Testimony (Schneider Electric)
7
data included within such repositories cannot be combined to produce broader datasets—whether because the repository is proprietary or because the metrics, collection methods or definitions are incompatible. To date, the most recognized13 attempt to provide a structure for comprehensive building data system has been the “Database for Analyzing Sustainable and High-Performance Buildings” or DASH. 14 In addition to DASH, existing and potential future data sources identified by witnesses include:
EPA Portfolio Manager
USGBC’s Building Performance Partnership
Building Owners and Managers Association’s EER and 360 Programs
International Facility Management Association Surveys
Sector Specific Data Efforts
State and Local Initiatives (including New York City, San Francisco, Massachusetts and Minnesota)
Utilities
Private Monitoring Services
Manufacturers
Evaluation Services and Testing Labs
American Institute of Architects 2030 Commitment
ASTM International Building Energy Performance Assessment
CoStar
Data Reporting Companies
Individual Building Owners
Collecting Additional Data
Witnesses identified numerous avenues to gather the types of data identified in their testimony. Some approaches are outside the methods used today, while others expand on long-standing design and operations and maintenance tools. Likely, no single approach will produce the credible, comprehensive, evidence-based data the building community desires. A multi-faceted approach is required. Potential sources of data include:
Integration of existing datasets
Deeper and more granular data from existing or new sample sets using advanced statistical methods
Post occupancy evaluations
Commissioning and audits
Benchmarking and/or disclosure
Requirements tied to incentives
Sensors, building automation systems and field instruments
Sub-metering
Permits databases and building information modeling
13
Turner Testimony (NBI), Lewis Testimony (NEMA), Pauley Testimony (Schneider Electric) 14
Compiled from Read Testimony (ASHRAE) and Bruce Hunn, Consultant to ASHRAE, Correspondence

8
Modeling
Utilities
Smart grid and smart meters
Surveys
Energy service companies
Who Should Do It and at What Cost?
One of the biggest concerns raised by witnesses was that any collection effort be overseen by a neutral third party that can ensure results are fair, open and defensible.15 Assurance that the necessary data is submitted and outcomes represent the needs of the broad community requires the buy in of all relevant stakeholders from both the public and private sector.16 A central repository for existing building information databases could be created. Funding for establishing the underlying protocols and performing data collection represents the biggest hurdle in the establishment of a comprehensive, evidence-based database of high performance attributes. The estimated cost for the 2011 CBECS is about $12 million spread over four years. Expanding beyond just energy related data could require even greater funding.
Recommendations
Based on the testimony received, the Institute makes the following recommendations on the establishment of a database reflecting all high performance building attributes and the diverse needs of the building community.
Continue to pursue CBECS funding, but with requested modifications.
Support development of standards for integration and interoperability.
Establish accepted protocols for data acquisition, storage and retrieval, and confidentiality.
Encourage data providers and collectors to post data availability on a common website, allowing for the eventual performance of “super searches”.
Form a building data working group with key stakeholders. Build on the effort underway to develop DASH. Develop a new system for the submission, collection and compilation of building data.
15
Zatz Testimony (EPA Energy Star), Lewis Testimony (NEMA) 16
Lewis Testimony (NEMA), Pauley Testimony (Schneider Electric), Woods Testimony (IEQ Consultant)

9
DATA NEEDS FOR ACHIEVING HIGH-PERFORMANCE BUILDINGS
Not everything that counts can be counted, and not everything that can be counted counts. –
Albert Einstein
If you don’t know where you’re going, any road will take you there. – Cheshire Cat, Alice in Wonderland
INTRODUCTION Buildings are complex and becoming more so, as owners and policymakers demand particular levels of performance. The focus is no longer on individual characteristics of a building but providing high performance through the optimization of numerous attributes, including safety and security, accessibility, historic preservation, functionality, productivity, sustainability, cost effectiveness, aesthetics and resiliency.17
The building sector is approaching a tipping point in how buildings are procured, designed, constructed, operated and deconstructed. Despite the push to achieve high performance by building community leaders, policymakers and building owners, such attempts will stall unless all members of the building team trust the data demonstrating achievement of the intended results or identification of problems recognizing necessary adjustments. This trust is built on the availability of credible data.
The National Institute of Building Sciences (Institute) held a hearing in June 2011 to seek input from building community stakeholders on building community data needs. A representative from the New Buildings Institute (NBI) indicated, “To achieve deep energy savings, all parties—policymakers, program managers, designers, owners, tenants and the real estate community—must all have access to data that shows the strategies that are working and areas needing improvement.”18
A representative from the American Institute of Architects (AIA) provided the following characterization, “Significant improvements have been made over the past decade to limit how buildings, their construction and their operation impact the environment. The highest levels of government have made policy decisions regarding the use of materials, the development of our natural resources and the rising demand for energy. Many if not all of these decisions have
17
Energy Independence and Security Act of 2007, §401(12) defines a high-performance building as follows: “The term ‘high-performance building’ means a building that integrates and optimizes on a life cycle basis all major high performance attributes including energy conservation, environment, safety, security, durability, accessibility, cost-benefit, productivity, sustainability, functionality, and operational considerations.” 18
Turner Testimony (NBI)

10
been made based on the information provided to all of us in the industry by independent and reliable sources, like the U.S. Environmental Protection Agency, the U.S. Department of Energy, and the Energy Information Administration, as well as independent nonprofit organizations and private-public partnerships. Without confidence in the resources developed by these entities, we all risk losing a focused direction and making progress.”19
However, there is almost universal agreement within the building community that current datasets are inadequate to achieve the established goals, as testified below:
“To do better as a community of design professionals and as a society in making energy efficient buildings, we need to know more than our current sets of data permit us to know.”20
“With the support of a sound, regularly updated, national repository of performance data, realistic future goals and intermediate targets could be set on the basis of demonstrated performance levels achieved by the leaders in the current building stock.”21
“If we are to make measurable strides in addressing the environmental impact of the built environment, we must have appropriate and adequate information with which to make the right decisions. That can only happen with the much-needed resources of informed education and research.”22
About This Report
Recognizing the impacts of data on the future of the entire building community, the National Institute of Building Sciences chose to focus on the data needs to produce and operate high-performance buildings. The High-Performance Building Data Collection Initiative was announced on May 3, 2011.
The Institute was established in 1974 by the U.S. Congress to “encourage and provide for the maximum feasible participation of public and private scientific, technical, and financial organizations, institutions, and agencies now engaged in activities pertinent to the development, promulgation, and maintenance of performance criteria, standards, and other technical provisions for building codes and other regulations.”23
In order to assure that any future data collection activities address the broad needs of the building community and are cost effective, the Institute solicited testimony from all interested stakeholders. An oral hearing was held July 18, 2011. More than 20 building community representatives from diverse segments provided testimony.24 Presiding over the hearing were Gordon Holness, past president of the American Society of Heating, Refrigerating and Air-
19
Andrejko Testimony (YRG Sustainability) 20
Eijadi Testimony (The Weidt Group) 21
Turner Testimony (NBI) 22
Andrejko Testimony (AIA) 23
12 USC 1701j-2(b)(2) 24
A list of those providing oral testimony is available in Appendix A of this report.
11
conditioning Engineers (ASHRAE); Ron Skaggs, past president of AIA; and Henry L. Green, Institute president and past president of the International Code Council (ICC).25 Written testimony also was accepted.26
The representative hearing and this report are the result of support from NBI and the National Environmental Balancing Bureau (NEBB).27 While both organizations provided funding for this activity, they provided no input or influence beyond their testimony. Therefore, the contents of this report may not reflect their policies or recommendations.
CBECS is the Spark
The inadequacy of current datasets became even more apparent following recent announcements from the Energy Information Administration (EIA) on the availability of data from the Commercial Building Energy Consumption Survey (CBECS). In late April and early May, 2011, EIA made two announcements related to CBECS that upset many members of the building community. First, EIA suspended the 2011 version of the survey due to a lack of funding.28 Next, EIA announced it would not release the long-awaited 2007 survey results due to statistical errors in the results.29 This means the 2003 survey will remain the most current building stock energy use data available for the foreseeable future. This disconcerting news on the future of CBECS prompted considerable attention from the building community and served as the backdrop for the examination of overall building data needs. “The AIA believes this decision [no 2007 or 2011 CBECS] will not only undermine critical work in the near future, but indicates a failure to deliver on a promised effort to help focus on more appropriate decision-making processes by state and local community leaders, owners, developers, designers, builders and the public.”30 While CBECS provides valuable data in its own right, it also serves as fundamental information for many building programs. Most notably, the Energy Star program for commercial buildings jointly sponsored by the Environmental Protection Agency (EPA) and U.S. Department of Energy (DOE) relies on CBECS to allow comparison across buildings. According to testimony provided by EPA, “Our [Energy Star’s] primary source of data is the Commercial Building Energy Consumption Survey (CBECS). The CBECS data is unique because of its broad categorization of the entire market. It is extremely important to be able to assess the total energy consumption and expenditures of all commercial buildings in the country and to determine how different sectors contribute. This type of broad knowledge is important for setting long-term market transformation goals and evaluating progress towards those goals.”31 25
Biographies of the hearing panelists are available in Appendix D of this report. 26
A list of those providing written testimony is available in Appendix B of this report. 27
Information on the sponsoring organizations is available in Appendix C of this report. 28
The EIA news release can be found at http://www.eia.gov/pressroom/releases/press362.cfm 29
http://www.eia.gov/emeu/cbecs/ 30
Andrejko Testimony (AIA) 31
Zatz Testimony (EPA Energy Star)

12
One local building owners group characterized CBECS and the Energy Star program as the “cornerstone” of their sustainability programs.32 A representative from the Northeast reported that schools and public buildings throughout the region have relied heavily on the accuracy and relevancy of Energy Star to benchmark their buildings and gain recognition.33 In addition to the tools provided through the Energy Star program, building owners rely on other tools to differentiate and market their buildings, including the U.S. Green Building Council’s (USGBC) Leadership in Energy and Environmental Design (LEED) program and the Green Building Initiative’s (GBI) Green Globes program—both of which rely on Energy Star (and thus CBECS) to set required performance levels for existing buildings. Codes and standards developers also rely on CBECS data to evaluate how code-compliant buildings actually perform. “Initial baselines and subsequent calibration points of codes to energy performance are fundamental to effective energy code policies. . . Not knowing how buildings built to code really perform represents a problem for increasing code stringency for two reasons: First, if we assume the code is already delivering low‐energy‐use buildings, then the savings associated with additional code stringency are reduced (each successive strategy saves a percentage of a smaller pie). By underestimating available savings, we alter the cost‐benefit analysis of additional strategies, suggesting potential savings that are lower than actual relative to the cost of the strategy. Second, by assuming everything in the code works as intended, we forgo the opportunity to address known problems with these systems.”34 Software developers also use CBECS data to validate their products. “We also use the CBECS data to benchmark our analyses during quality control and to provide intelligent defaults (system types, constructions, lighting systems, etc.) to streamline whole building performance analyses to enable its wider adoption at a time when its use desperately needs to be expanded in the existing building market.”35 CBECS has not been without critics, particularly in the data collection frequency, scope, robustness, interoperability and data exchange. “The current database is lacking. What’s missing is a broad base of sample buildings and a sufficient number of buildings. It is not uncommon to select parameters to identify true peer buildings only to be warned about insufficient sampling.”36
32
BOMA Greater Phoenix Testimony 33
Jones Testimony (NEEP) 34
Turner Testimony (NBI) 35
Deodhar Testimony (Autodesk) 36
Meyer Testimony (ESCO Group)

13
However, CBECS has represented the best data on building energy use available to date. “Other than CBECS, there is surprisingly little commercial building data that has been made available to the general public. While particular organizations and/or regions have chosen to conduct their own building surveys and in some cases published the results, there is nothing on a national scale that covers such a diversity of facility types.”37 “Although many have argued that the CBECS data is lacking in some sample sets, it is also one of the most looked-to resources for comparative data and for seeing important market trends in energy usage. In addition, the loss of the datasets is also a blow to building rating systems that rely on comparative data to establish quartile performance of buildings.”38
One witness identified potential opportunities to expand the utility of CBECS and address the high relative standard of error (RSE) through the application of advanced statistical, sampling and computing methods that could provide a deeper and more granular cause and effect relationship from which to measure performance improvement. 39
Emerging Codes, Tools and Technologies
In addition to the CBECS announcement, leaders within numerous sectors of the building community have begun to recognize the emergence of codes, tools and technologies that will ultimately transform the industry. These codes, tools and technologies intimately relate to the accessibility of credible building data.
Green codes and standards, such as the ICC’s International Green Construction Code (IgCC) and ASHRAE/IES/USGBC Standard 189.1, are under development or already entering the marketplace. Many of the jurisdictions adopting these or other green requirements will likely monitor whether their implementation has produced the desired results. Also, the documents themselves provide criteria on metering, controls, benchmarking and commissioning that could assist in data collection.
Integrated design increasingly is recognized as a potential method to assure all performance criteria are considered and optimized in the design and construction of buildings. As indicated above, the participating disciplines must trust the validity of the information provided by other collaborators.
Policies based on performance outcomes rather than prescriptive requirements are being developed. For example, Seattle and Vancouver are implementing pilot programs. Achieving actual post-retrofit performance outcomes, rather than prescriptive requirements will serve as the basis for code compliance in participating existing buildings.40 Setting the desired performance level required depends on assessment of the performance of existing buildings
37
Younger Testimony (CLEAResult) 38
Pauley Testimony (Schneider Electric) 39
Sands Testimony (Performance Building Systems) 40
See http://www.leonardo-energy.org/seattle-taking-performance-based-approach-energy-efficiency-building-codes
14
and the potential for cost-effective improvements to the baseline. Technology improvements such as advances in sensors and controls and the development of the smart grid and smart meters have significant implications for the collection of data on building performance. An in-depth discussion of opportunities utilizing these technologies appears below.
Many state and local governments are beginning to require benchmarking and disclosure of energy use information—often relying on Energy Star benchmarking tools. According to research from the Institute for Market Transformation (IMT), the policies already enacted could impact more than 4 billion square feet of floor space in more than 60,000 buildings.41 Organizations such as the International Facility Management Association (IFMA) and the Building Owners and Managers Association (BOMA) have been encouraging their members to benchmark their buildings.42
Governments at all levels have implemented transparency initiatives to demonstrate the effective use of taxpayer funds. For example, states and communities that received federal Energy Efficiency and Conservation Block Grants are expected to have accurate, transparent and compelling energy data that reflects the improvements made to buildings with taxpayer dollars. The State of Pennsylvania, for example, required all local governments that received block grants to use EPA’s Portfolio Manager to track their facility energy usage. Cities such as Cranston, Rhode Island, and Springfield, Massachusetts, invested millions of dollars to improve the efficiency of their aging infrastructure—upgrading old boilers and lighting, installing solar hot water heaters and energy managements systems, and implementing other energy efficiency strategies—and currently utilize Portfolio Manager software to measure their progress.43
At the federal level, agencies are subject to numerous requirements related to energy and water use and greenhouse gas emissions. Executive Orders and legislation established benchmarking and annual improvement requirements.
The recent upheaval in energy use data collection activities should serve as an opportunity to rethink the community’s needs, data users and data contributors.44
IDENTIFYING DATA NEEDS Members of the building community require numerous types of data to achieve high-performance building goals. Given the recent announcements from EIA, many witnesses focused on energy as a specific area of needed data. However, witnesses identified additional need areas—including those that address many of the high-performance building attributes.
41
Burr Testimony (IMT) 42
Epstein Testimony (IFMA), Burton Testimony (BOMA) 43
Jones Testimony (NEEP) 44
Harris Testimony (ASE)
15
Energy
As recognized above, CBECS has long served as the major source of information on the energy use of the nation’s existing building stock. There was widespread support for continued funding of a regular CBECS-type survey by the federal government.45 However, many witnesses expressed the need to address several shortcomings and expand the scope of energy and building characteristic data—either through CBECS or by an expanded data collection process.
One witness indicated, “Use the time between now and reinstatement to improve the method of data collection and processing, expand types and quantity of sample buildings, and data collected to include water and other critical reporting points.”46 Another witness suggested scrapping CBECS altogether in favor of a more holistic survey, including acquisition of data on other attributes.47
Whether funding for CBECS is reinstated or a new data mechanism is developed, energy related data should focus on providing additional granularity and data points.
“This new version should be more accessible, and it should begin with the collection of building metrics that allow for scientific, side-by-side comparisons of pEUI [proposed Energy Use Intensity], as reported by the design teams through programs like the AIA 2030 Commitment, the USGBC Building Performance Portfolio and ASTM’s BEPA Standard.”48
“One of the greatest needs . . . is the ability to compare the energy performance of buildings against similar buildings at a local or regional level. Energy Star’s benchmarking tool makes national comparisons between buildings (normalizing for climate and other factors) but cannot compare buildings by geographic region due to statistical data limitations in CBECS.”49
“We recommend collecting additional data that keeps in mind future energy modeling needs as well as information needed to satisfy energy performance disclosure laws, conduct appraisals and property condition assessments, and perform large-scale, state‐wide asset rating pilots.”50
“Data should cover additional building types or further sub-categories under the survey. Examples include airport facilities and higher education buildings and laboratories. Further distinction could be made even within a category such as within office buildings where high rise energy use could differ from a small office.”51
“What seems most advisable is the development of a comprehensive data quality plan for building energy performance. In any other field of environmental science, this would
45
Dorey Testimony (Daikin-McQuay), Burr Testimony (IMT), Lewis Testimony (NEMA), BOMA Greater Phoenix Testimony, Deodhar Testimony (Autodesk), Zatz Testimony (EPA Energy Star) 46
Meyer Testimony (ESCO Group) 47
Woods Testimony (IEQ Consultant) 48
Andrejko Testimony (AIA) 49
Burr Testimony (IMT) 50
Deodhar Testimony (Autodesk) 51
West Testimony (Jacobs Engineering)
16
be a critical step, one that may affect the choices made by owners, design teams and operators about the technologies and extent of application of data gathering in buildings.”52
Opportunities to expand the data presented by CBECS or another subsequent data set to include more granularity for particular building types or systems may exist through carefully developed modeling protocols. However, establishing strong correlations between energy consumption and building characteristics—especially the functional space EUI—requires access to a subset of buildings and data within the original data set.53 Currently, EIA does not provide access to such information. While some witnesses expressed concern about the use of modeled data (as discussed below), in the absence of in-depth measured building data, such results may provide a preliminary indication of energy use for particular building sub-types and systems. Currently, CBECS provides estimates of measured building consumption data essential to programs like Energy Star54 and evaluation of achievements under energy codes,55 but there also is interest in exploring the site-specific relation between actual and expected energy use.56 Such exploration largely focuses on the need to advance modeling science, improve code and standard development and establish feedback loops throughout the design, construction and operations processes.
Currently, significant variations often exist between modeled or predicted performance and actual performance. Understanding these variations and bringing model results into line with actual results will require a deeper analysis of cause and effect relationships, access to both data points and their underlying causes, and additional development of modeling science. While each data type serves a different purpose, datasets must identify whether included data represent measured or modeled results. In the case of modeled results, the methodology and criteria used for such results must be clearly identified and available to data users.
Variations in the granularity of energy data at the individual building level can help facilitate decision-making processes. Whole building energy use data for all fuels provides the first order of data needs.57 However, energy consumption data broken down by end use (including plug loads and building systems) can inform energy targets, facilitate a greater understanding of occupant-driven components and provide tenant specific feedback.58
52
Weber Testimony (Weber Sustainability Consulting) 53
Sands Testimony (Performance Building Systems) 54
Zatz Testimony (EPA Energy Star) 55
Turner testimony (NEEP) 56
West Testimony (Jacobs Engineering), Andrejko Testimony (AIA), Bakshi Testimony (YRG Sustainability), Deodhar Testimony (Autodesk) 57
Zatz Testimony (EPA Energy Star) 58
Rainey Testimony (SOM), Turner Testimony (NBI), Pauley Testimony (Schneider Electric), Younger Testimony (CLEAResult), Weber Testimony (Weber Sustainability Consulting)

17
In furtherance of attempts to meet energy performance goals and provide feedback mechanisms, future surveys could include information on specific energy conservation measures (ECMs) used within buildings and the validity and reliability of the projected life-cycle cost and resulting energy savings.59 Such information also would benefit financial institutions looking for the financial performance of ECMs to support financing of retrofit projects.60 Large-scale research on the returns and paybacks associated with building energy conservation will help financial institutions develop loan underwriting standards.61
Additional recommended data points that could assist in the production of energy-efficient buildings include the ability to group building locations by climate zones as determined in ASHRAE Standard 90.162 and information on the code or standard and other requirements for the design and construction of a particular building.63 Information on greenhouse gas emissions (GHG) and CO2 along with relevant utility and renewable energy source data were seen as a growing data need.64 Specifically the types and quantities of renewable energy generation incorporated into the building stock along with their relative energetic and economic effectiveness can influence future deployment of such technologies.65
Building Characteristics
Any data related to building performance (whether energy or another high-performance attribute) must include building characteristic data. Such characteristic data informs the reasons behind particular results and increases the value of performance data in comparing results across buildings with similar characteristics.
Characteristics identified by numerous witnesses included:
Geographic information—including zip code and climate zone—which also can be used to determine annual heating and cooling degree days.66 Designers find additional weather information, including rainfall by month and measured solar data, useful.67
Building type and primary activity—with specific sub-categories to the extent possible.68
Operation and behavioral parameters—such as occupancy levels, operational hours, thermal set-points, and ambient and task lighting levels.69
59
Rainey Testimony (SOM) 60
Tobias Testimony (Malachite) 61
Tobias Testimony (Malachite) 62
West Testimony (Jacobs Engineering) 63
Sands Testimony (Performance Building Systems), Bakshi Testimony (YRG Sustainability), Turner Testimony (NBI) 64
Epstein Testimony (IFMA), Woods Testimony (IEQ Consultant) 65
Weber Testimony (Jacobs Engineering) 66
Zatz Testimony (EPA Energy Star), Pauley Testimony (Schneider Electric), Younger Testimony (CLEAResult), Borchardt Testimony (Honeywell), Tobias Testimony (Malachite) 67
Rainey Testimony (SOM) 68
Younger Testimony (CLEAResult), Rainey Testimony (SOM), Borchardt Testimony (Honeywell), Zatz Testimony (EPA Energy Star), Tobias Testimony (Malachite) 69
Zatz Testimony (EPA Energy Star), Pauley Testimony (Schneider Electric), Younger Testimony (CLEAResult), Borchardt Testimony (Honeywell)
18
Physical building characteristics, including square footage/conditioned floor area, number of floors, age, glazing percentage and type, exterior wall area and type, total roof area, exterior door area and type, and ceiling heights.70
Equipment and systems information, such as primary heating plant, primary cooling plant, insulation type and thickness, existence of building management systems, lighting power density, equipment power density and ventilation rates.71
Witnesses identified additional building and system characteristics that would fulfill data needs for their specific sectors. For instance, the heating, ventilation and air-conditioning (HVAC) sector could use specific information on equipment, including refrigerant used, the size of the largest component, the compression type and the age.72
High-Performance Building Attributes
While energy performance has garnered significant attention within the building community, the public and policy makers, it is just one piece of the overall performance expected of buildings. Truly understanding a building’s performance and the interactions among various design, construction and operational choices requires information about other high-performance building attributes.73 As indicated by one witness, “Management of building energy consumption is a necessary, but not sufficient, means to assure acceptable building performance.”74
A few witnesses recommended development of a holistic, integrated dataset across multiple dimensions.75 The Database for Analyzing Sustainable and High Performance Buildings (DASH) being led by the Green Building Alliance (GBA) and American Society of Heating, Refrigerating and Air-conditioning Engineers (ASHRAE) was cited as a potential starting point for such a holistic dataset.76 Details on DASH are provided within the section on existing data sources.
A number of representatives identified some specific recommended data points within many of the high-performance building attributes. Attributes with the greatest interest included indoor environmental quality (IEQ), water use, waste, security, accessibility, cost and finance.
The connection between IEQ and energy performance provides an example of how data on each can improve overall building performance. Many attempts to improve energy performance can have adverse impacts on IEQ if done in isolation. Therefore, IEQ should be
70
Rainey Testimony (SOM), Zatz Testimony (EPA Energy Star), Turner Testimony (NBI), Borchardt Testimony (Honeywell), Younger Testimony (CLEAResult), Tobias Testimony (Malachite), Weber Testimony (Weber Sustainability Consulting) 71
Borchardt Testimony (Honeywell), Pauley Testimony (Schneider Electric), Turner Testimony (NBI), Dorey Testimony (Daikin-McQuay), Rossola Testimony (GREENGuard) 72
Dorey Testimony (Daikin-McQuay) 73
Rossola Testimony (GREENGuard) 74
Woods Testimony (IEQ Consultant) 75
Woods Testimony (IEQ Consultant), Pyke Testimony (USGBC), Deodhar Testimony (Autodesk), Read Testimony (ASHRAE) 76
Read Testimony (ASHRAE)

19
CASE STUDY: LARGE ANALYSIS AND REVIEW OF EUROPEAN HOUSING AND HEALTH STATISTICS
The World Health Organization (WHO) housing and health program initiated a Pan-European housing and health survey from 2002 to 2003 in eight European cities following a proposal of the WHO European Housing and Health task force. The LARES Survey (Large Analysis and Review of European Housing and Health Status), coordinated by the European Centre for Environment and Health, Bonn Office of the WHO Regional Office for Europe was designed to achieve the following objectives:
to improve knowledge of the impacts of existing housing conditions on health and mental and physical well-being;
to assess the quality of the housing stock in a holistic way and to identify housing priorities in each of the surveyed cities, and possibly common trends;
to develop an “easy to use” tool to assess the impact of housing on health in any city or region in Europe; and
to prepare the fourth Ministerial Conference on Environment and Health (June 2004, Hungary).
The survey has been carried out in each city according to the same methodology and based on three consistent survey documents:
1. housing questionnaire, used by trained surveyors during the face-to-face interview of a representative of the surveyed households to collect data on the perceived quality and condition of the dwelling and the immediate environment in which they lived;
2. inspection form, used by trained surveyors to collect technical and objective data on the surveyed dwelling; and
3. individual health questionnaire, filled in by/for each inhabitant (including children) of the surveyed dwelling.
Each municipality has been equally supported by WHO to assure use of the same procedures:
before the survey: communication and press release, training of surveyors, guidelines for municipalities on how to provide the sample, recruitment of the surveyors and data entry operators, and the logistic support;
during the survey: coordination of the field work, contacting of selected households, dwelling visits, quality control of the filled questionnaires/data entry; and
after the survey: database cleaning, data analysis, preparation of city report.
Each local survey aimed to collect data on roughly 400 dwellings and 1,000 inhabitants to achieve statistically significant results. The local surveys were carried out in Angers (France), Bonn (Germany), Bratislava (Slovakia), Budapest (Hungary), Ferreira do Alentejo (Portugal), Forlì (Italy), Geneva (Switzerland) and Vilnius (Lithuania).
After the local surveys had been undertaken, and city reports for each individual city had been produced, an expert consortium was established to work on the merged international data set of all eight cities to precise links between housing and health.
More detailed information, providing the methodology of the project and statistical analyses as well as discussing and interpreting the results, are currently being compiled in a LARES book edited by members of the expert consortium.
Further information on the LARES project, the participating cities, the applied methodology and survey tools, and the experts and topics of the LARES analysis consortium, can be found on the Regional Office website (http://www.euro.who.int/Housing/activities/20020711_1).

20
monitored alongside energy performance.77 In addition to quantitative data, like the measurements of the presence and concentrations of pollutants [Volatile Organic Compounds (VOCs) and Carbon Dioxide (CO2)] and the measurements of ventilation rates, temperature and humidity conditions, illumination levels and acoustic levels, IEQ also includes qualitative information like measurements of thermal comfort, visual comfort and overall occupant acceptability. Access to both quantitative and qualitative types of data will provide a more complete picture of how buildings perform and whether they are meeting the objectives placed upon them.78
Water use and energy also are inextricably linked and should be collected simultaneously. “Potable water has embedded energy and is a dwindling resource. The energy efficiency of any building must include metrics for this type of ‘energy’ consumption.”79 Whole building water use also is of interest to EPA, as they have a strong interest in developing comparative metrics similar to what has been done in the Energy Star program.80 Designers also are interested in having access to data on water saving technologies and strategies, including the water savings impact and life-cycle cost for such actions.81
EPA also expressed interest in waste disposal as another potential comparative metric the agency could develop if such data existed.82 Others also thought such data could assist in getting a complete picture of building performance.83
The definition of a high-performance building clearly identifies safety and security as essential. A comprehensive database should include evidence-based data for these attributes.84 Such data can be valuable in comparing design predictions and preparing for ongoing building operations. Of specific importance is empirical data addressing interactions of safety and security characteristics with energy use and occupant response during both normal and extraordinary conditions.85
Accessibility is related to safety and security, as provisions must be provided for occupants during both normal and extraordinary conditions.86While building performance data for various high-performance building attributes are important, the cost effectiveness of achieving such performance is crucial. These measures of cost effectiveness should include first cost and operation and maintenance costs.87 Members of the finance sector also require specific metrics to inform their business decisions. “Such metrics should incorporate information meaningful to
77
Jones Testimony (NEEP) 78
Woods Testimony (IEQ Consultant) 79
Meyer Testimony (ESCO Group) 80
Zatz Testimony (EPA Energy Star) 81
Rainey Testimony (SOM) 82
Zatz Testimony (EPA Energy Star) 83
West Testimony (Jacobs Engineering), Epstein Testimony (IFMA) 84
Yudenfriend Testimony (Security Consultant) 85
Woods Testimony (IEQ Consultant) 86
Woods Testimony (IEQ Consultant) 87
Woods Testimony (IEQ Consultant)

21
property lenders, including first costs, energy savings in dollar and consumption terms relative to baseline, changes in related operating costs, and associated payback periods and financial returns. Ideally, databases and studies on high-performance buildings would collect standardized financial performance data alongside data on energy consumption to produce metrics that are useful to the finance sector, as well as to the engineering, design and construction communities.”88
WHO NEEDS DATA? With the diversity of perspectives provided at the hearing in both written and oral testimony and the number of disciplines engaged in the design, construction, operations and maintenance of buildings, it is obvious that there are numerous users of building related data, each with different requirements. Understanding these users and their needs will allow development of datasets with the greatest buy-in and acceptance across the building community. The discussion below identifies how various sectors use existing data and potential future uses.
Building Owners
A letter to Congressional appropriators signed by 72 organizations, which addresses the importance of data like CBECS, clearly identifies the value building owners find in such data. “For the real estate sector, these programs are the primary benchmarking and information mechanism for energy efficiency and sustainability. Business owners use them to compare their buildings and make capital expenditure decisions, while office tenants use Energy Star and other programs to assess the energy efficiency of buildings where they lease space. In addition, there is growing pressure on the CBECS data set because major U.S. cities have started to require ENERGY STAR ratings (which are based on CBECS data) for government-owned and large private sector buildings. Lack of robust CBECS data will make the real estate sector's compliance with state and local laws increasingly difficult.” 89
Government owners have the increased burden of assuring taxpayers that investments are effective. Increased transparency requirements tied to government grants require demonstration of improved performance. Many communities use programs like Energy Star and its Portfolio Manager to measure their progress.90
Any tools developed must be practical, easy to use and applicable in the daily work of the building owner and the building manager.91
Facility Managers
Facility managers often have a two-pronged role when it comes to data. They are instrumental in tracking individual building performance data and making the data useful for building
88
Tobias Testimony (Malachite) 89
Desiderio Testimony (Real Estate Roundtable) 90
Jones Testimony (NEEP) 91
BOMA Greater Phoenix Testimony
22
stakeholders. They also often consult data on the stock of similar building types to assess the relative performance of their buildings.
According to IFMA, “More than ever, today’s environment requires that facility managers track building performance related to energy consumption and sustainability policies, as well as the building’s ability to cost-effectively support the mission of the organization. Facility managers have also become much more sophisticated in recent years in documenting and reporting on operational effectiveness, maintenance efficiencies, safety/security issues and building resilience. Most importantly, facility managers understand and are collecting the data regarding the interrelationships between effective operations and maintenance and high-performance facilities performance.”92
The ability to track such performance requires specific training on energy management systems and utility data tracking and assessment. Beyond the ability to track data, facilities need someone able to perform the analysis and create a strategic plan to make improvements.93
Educators
Providing training for both existing and up-and-coming building professionals is important to achieving the numerous goals placed on buildings, as enumerated above. Statements from both a professional organization (AIA) and an education provider (ESCO Group) illustrate the important role data plays in informing the industry:
“Although our participation and use of CBECS is not as obvious as others testifying
today, we rely on its currency and accuracy as much, if not more. Instead of using CBECS
to build a single building, we use CBECS to build minds—the next generation who will
create, improve and operate thousands of buildings.”94
“AIA’s position statement on carbon neutrality focuses our efforts to educate the industry and the public about the impact of buildings on the environment and in providing our architect members with the knowledge and the resources to transform the way we design and construct buildings.”95
Design Professionals
Beyond the needs to build general awareness within the design professions, data provides important inputs to the design process. Designers (and owners) should look to answer the following questions about their particular projects, which rely on access to datasets like CBECS:
1. How much energy should my building be using compared to its peer group? 2. What is the estimated operational breakdown of building energy usage and therefore
greatest area of opportunity for retrofits?
92
Epstein Testimony (IFMA) 93
Jones Testimony (NEEP) 94
Meyer Testimony (ESCO Group) 95
Andrejko Testimony (AIA)

23
3. How does energy usage vary in different parts of the country, or between building types?
4. Should I invest in energy management projects in my existing building? 5. How is my building performing over time?96
The availability of valid, clear and focused information can help establish direction for designing, building and maintaining high-performance buildings as well as sustainable, livable communities.97
Codes and Standards Developers
In addition to providing input to individual building designs, the availability of information on building performance should reveal whether codes and standards are producing the desired results. Such data could serve to validate requirements within existing codes or identify the need for new approaches to achieve the intended results. “By assuming everything in the code works as intended, we forgo the opportunity to address known problems with these systems. . . The solution to many of these problems is to calibrate energy codes and performance goals to actual measured building performance. By determining how buildings that are built to code are really performing, a wide range of new opportunities for code improvement becomes available.”98
Regulators
Regulators also use data to measure the effectiveness of implemented policies or identify areas where additional policies are necessary to achieve community goals. As discussed above, communities implementing energy benchmarking requirements require a robust program like Energy Star and Portfolio Manager, which provide accurate, reliable and robust building energy performance metrics and comparisons.99
While building energy use is an important metric, communities have additional goals related to high-performance attributes, including safety, security, accessibility, public health and historic preservation. Policies to achieve these goals also should be based on valid and reliable datasets.
Voluntary Programs
Both the public and private sector have developed voluntary building performance programs to encourage the design, construction and operation of buildings that reach for specific goals. This includes the Energy Star program and programs like USGBC’s LEED and GBI’s Green Globes programs.
As one manufacturer put it, “We believe that the development and use of strong building labeling/rating systems is a key element to driving better building performance. Having visibility of the building performance allows potential users/occupants of the building to see how the
96
Bakshi Testimony (YRG Sustainability) 97
Andrejko Testimony (AIA) 98
Turner Testimony (NBI) 99
Burr Testimony (IMT)
24
building is performing and make informed decisions about whether a particular building’s approach to energy performance is suitable for their business and operational needs. However, good rating systems cannot exist without a good dataset used for benchmarking. From our view, this is one of the most critical reasons for having a strong national collection system of building energy data.”100
“The EPA’s ENERGY STAR commercial buildings program relies on market data to assess energy efficiency in the commercial market and to analyze potential market strategies. EPA also analyzes data within specific commercial building sectors to understand key drivers of energy use within those sectors. Analysis of key operational parameters can help to understand what factors (such as size, hours of operation and climate) contribute to energy consumption. This can often reveal important trends, when empirical evidence contradicts conventional wisdom with respect to key drivers. Finally, EPA uses national data to provide comparative metrics for building owners and operators so that they can assess their energy performance against that of their peers.”101
Manufacturers and Software Developers
Naturally, equipment manufacturers are interested in providing the products that meet owner and designer needs. Developing such equipment requires feedback on the existing equipment in use. Data on equipment types, size and capacity can help determine trends that would enable product refinement or new product development. Linking such data with energy usage and other high-performance building attributes could provide the necessary information to evaluate actual system performance based on system type.102
Other manufacturers and service providers also provided insight into the value of comparison data for their companies and their customers.
Schneider Electric, a corporation with energy management expertise, indicated, “Having appropriate data to benchmark building performance for our customers is critical. Although we can offer many solutions to help a building achieve a higher level of energy performance than it does today, being able to characterize that performance by comparing to other buildings of similar type and use helps to drive a better understanding of the potential that may still be available to our customer.”103
Honeywell, a corporation focused on energy efficient products and solutions, stated, “We are largely dependent on industry data resources to provide a credible baseline for comparison of targeted building performance. The CBECS database provides the baseline of data in a single source of information segmented in a fashion that makes it relevant and consistent across market segments and regions. . . Access to a reliable database of information provides our customers with a comparison they can rely on so when they make investments in those energy
100
Pauley Testimony (Schneider Electric) 101
Zatz Testimony (EPA Energy Star) 102
Dorey Testimony (Daikin-McQuay) 103
Pauley Testimony (Schneider Electric)

25
efficiency solutions they have some added assurance they will actually achieve those savings.”104
For the software used by building designers and operators, data like CBECS is used during quality control and to provide intelligent defaults to streamline whole building performance analysis to foster wider adoption.105
Other Data Users
Sectors outside the traditional building community, including researchers, utilities, financers and insurers, also use CBECS and other data sources to inform their work. For example, information on product VOC emissions and building concentrations can be used by scientists as they study the health effects of certain chemicals. Utility providers in the Northeast such as National Grid and NSTAR, and program administrators, such as Efficiency Vermont utilize energy data as a way to assess building performance and build customer relations.106 Detailed financial performance data on specific high-performance development and retrofit projects may also be beneficial to finance, insurance and real estate executives who seek additional understanding of the financial returns associated with high-performance buildings.107 In Texas, CBECS data is being used as part of the evidence to demonstrate compliance with outdoor pollution reduction requirements due to designation as an ozone non-attainment area.108
MAKING DATA USEFUL The existence of data points without information on their source, the sample set and the ability to integrate datasets severely limits their usefulness. Almost all witnesses emphasized that datasets must be of sufficient quality to facilitate their use. Achieving such quality across the numerous datasets existing today and those developed in the future will require a common protocol for data acquisition.109 Today, consistent collection methods across tools do not exist.110 A high level of data verification and validation would be crucial for any data collection effort.111
In addition to protocols for acquisition, individual data points must have sufficient embedded information to allow integration with other datasets.112 Such embedded information relies on the establishment of common definitions and labeling requirements for metrics of interest.113
104
Borchardt Testimony (Honeywell) 105
Deodhar Testimony (Autodesk) 106
Jones Testimony (NEEP) 107
Tobias Testimony (Malachite) 108
Correspondence with Jeff Haberl, Energy Systems Laboratory, Texas A&M University 109
Woods Testimony (IEQ Consultant), Wiggins Testimony (NEBB/Newcomb & Boyd) 110
Read testimony (ASHRAE) 111
Zatz Testimony (EPA Energy Star), Lewis Testimony (NEMA), Dunning Testimony (Sphere E) 112
Dunning Testimony (Sphere E) 113
Turner Testimony (NBI), Dunning Testimony (Sphere E)
26
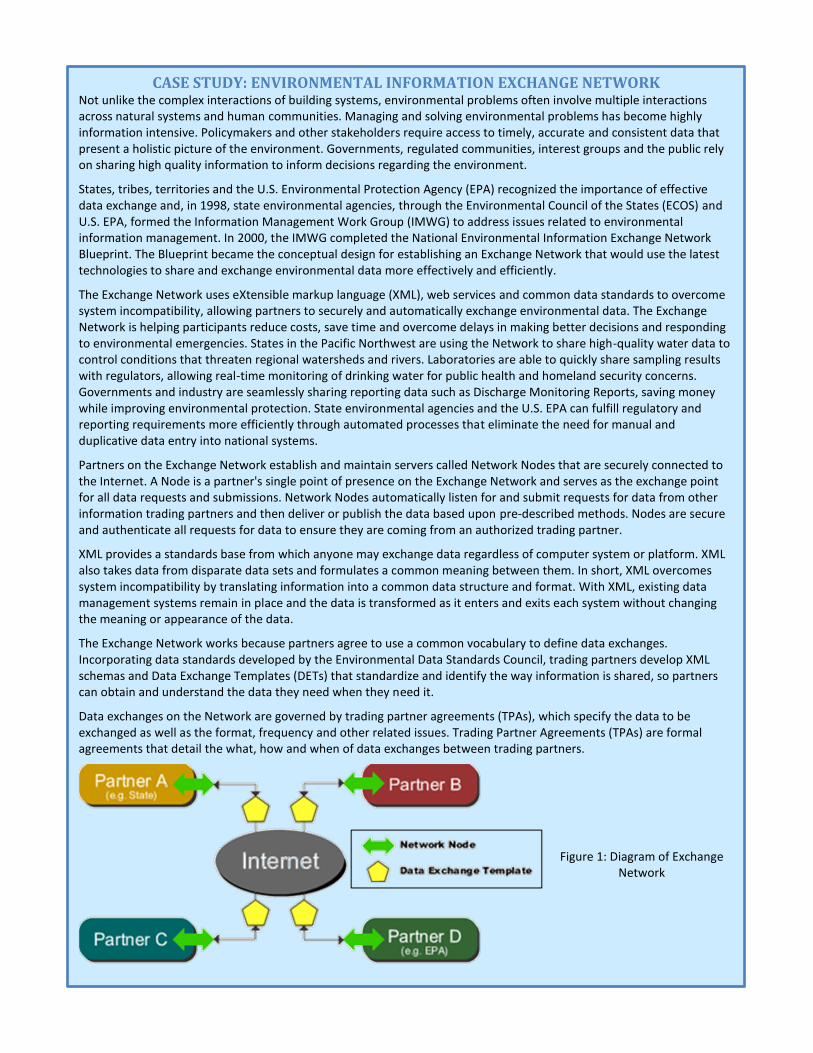
CASE STUDY: ENVIRONMENTAL INFORMATION EXCHANGE NETWORK Not unlike the complex interactions of building systems, environmental problems often involve multiple interactions across natural systems and human communities. Managing and solving environmental problems has become highly information intensive. Policymakers and other stakeholders require access to timely, accurate and consistent data that present a holistic picture of the environment. Governments, regulated communities, interest groups and the public rely on sharing high quality information to inform decisions regarding the environment.
States, tribes, territories and the U.S. Environmental Protection Agency (EPA) recognized the importance of effective data exchange and, in 1998, state environmental agencies, through the Environmental Council of the States (ECOS) and U.S. EPA, formed the Information Management Work Group (IMWG) to address issues related to environmental information management. In 2000, the IMWG completed the National Environmental Information Exchange Network Blueprint. The Blueprint became the conceptual design for establishing an Exchange Network that would use the latest technologies to share and exchange environmental data more effectively and efficiently.
The Exchange Network uses eXtensible markup language (XML), web services and common data standards to overcome system incompatibility, allowing partners to securely and automatically exchange environmental data. The Exchange Network is helping participants reduce costs, save time and overcome delays in making better decisions and responding to environmental emergencies. States in the Pacific Northwest are using the Network to share high-quality water data to control conditions that threaten regional watersheds and rivers. Laboratories are able to quickly share sampling results with regulators, allowing real-time monitoring of drinking water for public health and homeland security concerns. Governments and industry are seamlessly sharing reporting data such as Discharge Monitoring Reports, saving money while improving environmental protection. State environmental agencies and the U.S. EPA can fulfill regulatory and reporting requirements more efficiently through automated processes that eliminate the need for manual and duplicative data entry into national systems.
Partners on the Exchange Network establish and maintain servers called Network Nodes that are securely connected to the Internet. A Node is a partner's single point of presence on the Exchange Network and serves as the exchange point for all data requests and submissions. Network Nodes automatically listen for and submit requests for data from other information trading partners and then deliver or publish the data based upon pre-described methods. Nodes are secure and authenticate all requests for data to ensure they are coming from an authorized trading partner.
XML provides a standards base from which anyone may exchange data regardless of computer system or platform. XML also takes data from disparate data sets and formulates a common meaning between them. In short, XML overcomes system incompatibility by translating information into a common data structure and format. With XML, existing data management systems remain in place and the data is transformed as it enters and exits each system without changing the meaning or appearance of the data.
The Exchange Network works because partners agree to use a common vocabulary to define data exchanges. Incorporating data standards developed by the Environmental Data Standards Council, trading partners develop XML schemas and Data Exchange Templates (DETs) that standardize and identify the way information is shared, so partners can obtain and understand the data they need when they need it.
Data exchanges on the Network are governed by trading partner agreements (TPAs), which specify the data to be exchanged as well as the format, frequency and other related issues. Trading Partner Agreements (TPAs) are formal agreements that detail the what, how and when of data exchanges between trading partners.
Figure 1: Diagram of Exchange Network
27
Integration of data from multiple sources requires a common building identifier embedded within a data point. Addresses typically are not sufficiently clear in the case of commercial buildings and, for confidentiality reasons, may not be a desired identifier for particular pieces of data. Without the ability to match buildings, merged datasets cannot eliminate duplicates or combine same-building information from multiple sources.
For product-specific data, all manufacturers of a given category must use the same “rules of the road” or product category rules (PCRs).114 One such piece of information embedded within each data point is whether or not the related building source has undergone commissioning to achieve the highest levels of performance.115 For energy metrics, such efforts already are underway through ASHRAE Standard 105-2007 and Commercial Energy Services Network (COMNET).116 The DASH effort also has identified these issues and is in the process of developing and proposing potential standardized protocols.117
The establishment of common definitions for data elements and data types will help differentiate how such data can be used and for what purpose. “Different types of data generation lead, in part, to different knowledge. Survey-based, statistical data that are used to compare “like” buildings to one another, as CBECS does, are not the same as data that compares a building to itself over time or data that compares a building to its own potential.”118 This also illustrates why data must clearly indicate whether it is measured or modeled data.
Even within specific performance metrics like energy use, a variety of data uses and methodologies exist including:
Statistical: A building’s energy performance can be compared on a statistical basis to a population of comparable buildings. The Energy Star energy performance scale uses a statistical benchmarking approach based on CBECS.
Same Building or Portfolio: A building’s energy performance can be benchmarked against itself using pre- or post-construction or renovation data to track that particular building’s performance over time. A specific portfolio of buildings may also track portfolio data to compare against the same portfolio of buildings at different times.
Energy Simulation: A building’s energy performance can be benchmarked against an energy-simulation of a similar building based on both the physical building and operational attributes of that building.
Technical Scale: A technical scale is based directly on energy use rather than on a comparison to peers.
114
Dunning Testimony (Sphere E) 115
Wiggins Testimony (NEBB/Newcomb & Boyd) 116
Deodhar Testimony (Autodesk), See http://www.ashrae.org, http://www.comnet.org 117
Read Testimony (ASHRAE) 118
Eijadi Testimony (Weidt Group)
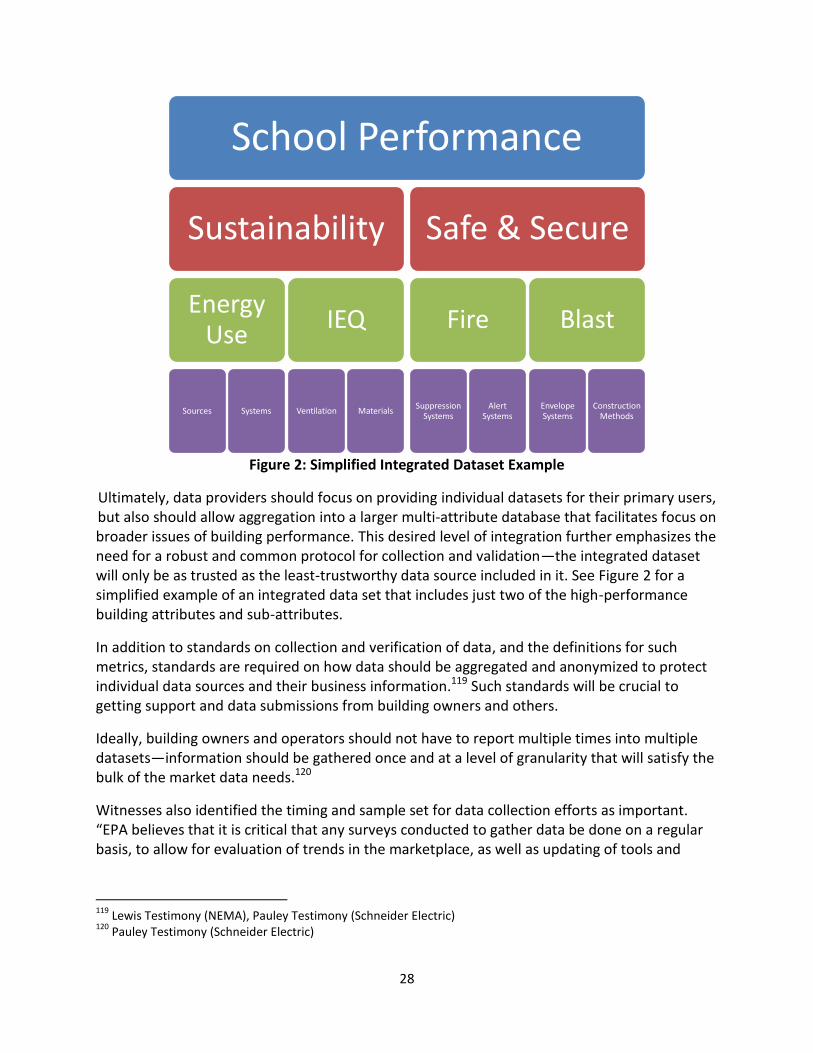
28
School Performance
Sustainability
Energy Use
Sources Systems
IEQ
Ventilation Materials
Safe & Secure
Fire
Suppression Systems
Alert Systems
Blast
Envelope Systems
Construction Methods
Figure 2: Simplified Integrated Dataset Example
Ultimately, data providers should focus on providing individual datasets for their primary users, but also should allow aggregation into a larger multi-attribute database that facilitates focus on broader issues of building performance. This desired level of integration further emphasizes the need for a robust and common protocol for collection and validation—the integrated dataset will only be as trusted as the least-trustworthy data source included in it. See Figure 2 for a simplified example of an integrated data set that includes just two of the high-performance building attributes and sub-attributes.
In addition to standards on collection and verification of data, and the definitions for such metrics, standards are required on how data should be aggregated and anonymized to protect individual data sources and their business information.119 Such standards will be crucial to getting support and data submissions from building owners and others.
Ideally, building owners and operators should not have to report multiple times into multiple datasets—information should be gathered once and at a level of granularity that will satisfy the bulk of the market data needs.120
Witnesses also identified the timing and sample set for data collection efforts as important. “EPA believes that it is critical that any surveys conducted to gather data be done on a regular basis, to allow for evaluation of trends in the marketplace, as well as updating of tools and
119
Lewis Testimony (NEMA), Pauley Testimony (Schneider Electric) 120
Pauley Testimony (Schneider Electric)
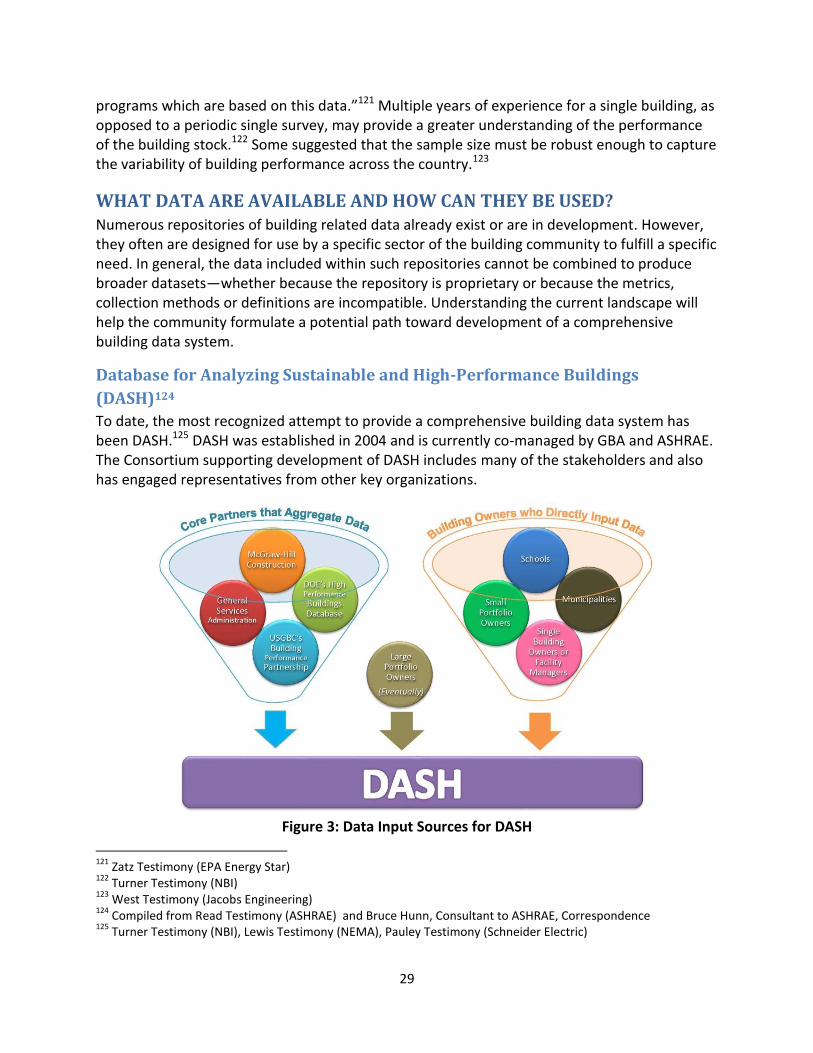
29
programs which are based on this data.”121 Multiple years of experience for a single building, as opposed to a periodic single survey, may provide a greater understanding of the performance of the building stock.122 Some suggested that the sample size must be robust enough to capture the variability of building performance across the country.123
WHAT DATA ARE AVAILABLE AND HOW CAN THEY BE USED? Numerous repositories of building related data already exist or are in development. However, they often are designed for use by a specific sector of the building community to fulfill a specific need. In general, the data included within such repositories cannot be combined to produce broader datasets—whether because the repository is proprietary or because the metrics, collection methods or definitions are incompatible. Understanding the current landscape will help the community formulate a potential path toward development of a comprehensive building data system.
Database for Analyzing Sustainable and High-Performance Buildings
(DASH)124
To date, the most recognized attempt to provide a comprehensive building data system has been DASH.125 DASH was established in 2004 and is currently co-managed by GBA and ASHRAE. The Consortium supporting development of DASH includes many of the stakeholders and also has engaged representatives from other key organizations.
Figure 3: Data Input Sources for DASH
121
Zatz Testimony (EPA Energy Star) 122
Turner Testimony (NBI) 123
West Testimony (Jacobs Engineering) 124
Compiled from Read Testimony (ASHRAE) and Bruce Hunn, Consultant to ASHRAE, Correspondence 125
Turner Testimony (NBI), Lewis Testimony (NEMA), Pauley Testimony (Schneider Electric)
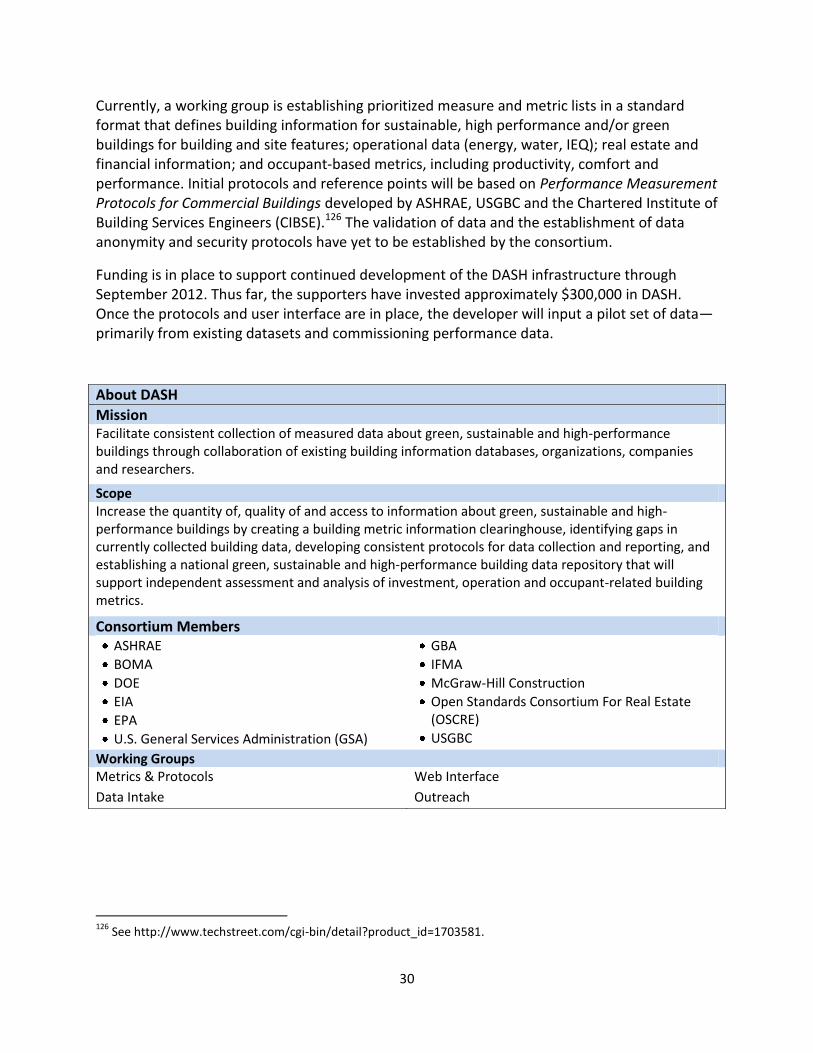
30
Currently, a working group is establishing prioritized measure and metric lists in a standard format that defines building information for sustainable, high performance and/or green buildings for building and site features; operational data (energy, water, IEQ); real estate and financial information; and occupant-based metrics, including productivity, comfort and performance. Initial protocols and reference points will be based on Performance Measurement Protocols for Commercial Buildings developed by ASHRAE, USGBC and the Chartered Institute of Building Services Engineers (CIBSE).126 The validation of data and the establishment of data anonymity and security protocols have yet to be established by the consortium.
Funding is in place to support continued development of the DASH infrastructure through September 2012. Thus far, the supporters have invested approximately $300,000 in DASH. Once the protocols and user interface are in place, the developer will input a pilot set of data—primarily from existing datasets and commissioning performance data.
126
See http://www.techstreet.com/cgi-bin/detail?product_id=1703581.
About DASH
Mission Facilitate consistent collection of measured data about green, sustainable and high-performance buildings through collaboration of existing building information databases, organizations, companies and researchers.
Scope Increase the quantity of, quality of and access to information about green, sustainable and high-performance buildings by creating a building metric information clearinghouse, identifying gaps in currently collected building data, developing consistent protocols for data collection and reporting, and establishing a national green, sustainable and high-performance building data repository that will support independent assessment and analysis of investment, operation and occupant-related building metrics.
Consortium Members ASHRAE
BOMA
DOE
EIA
EPA
U.S. General Services Administration (GSA)
GBA
IFMA
McGraw-Hill Construction
Open Standards Consortium For Real Estate (OSCRE)
USGBC
Working Groups Metrics & Protocols
Data Intake
Web Interface
Outreach
31
EPA Portfolio Manager
The Portfolio Manager tool from EPA serves as a benchmarking tool of choice for energy consumption comparisons in existing commercial buildings.127 The current database includes data on approximately 300,000 buildings. However, only about 15,000 of the entries are verified (often by those seeking to earn the Energy Star designation and thus representing only the top energy performing buildings). Further, building owners and operators who use benchmarking tools—like Portfolio Manager—represent only a portion of owners and operators, thus resulting in a dataset that fails to capture data representing the entire building stock. The expansion of disclosure requirements in some jurisdictions would expand the availability of building stock data for these particular localities but still would be largely unverified energy consumption data (i.e., verified data on other HPB attributes also are not available).
Currently, due to confidentiality agreements with building owners submitting to Portfolio Manager, individual data points are not public and limited aggregated data has been made available. However, EPA has established protocols for third-party input of data, including directly from utilities.
USGBC’s Building Performance Partnership and Other Programs128
In 2009, USGBC set out to establish a feedback loop for owners of LEED-certified buildings and for the future evolution of the LEED system. The goals of the Building Performance Partnership (BPP) are based on educating building owners and managers on the performance of their buildings and informing USGBC and the wider green building and real estate communities of the ongoing performance of LEED-certified buildings. Data collected from BPP will be used to inform USGBC’s development of LEED, to support marketplace development of green building tools and technologies, and to help building owners and managers optimize the performance of their buildings.
Beginning in April 2010, USGBC launched phase 1 of BPP. This phase focused specifically on energy and water use. Phase 2 will incorporate automated tracking and reporting capabilities as well as an expanded list of performance metrics. Submitted data is stored in a secure database and individual data can only be accessed by the building owner and USGBC personnel unless otherwise allowed by the submitter. USGBC does anticipate issuing aggregated data and potentially sharing the dataset with researchers once it is adequately anonymized.
A minimum program requirement within LEED 2009 requires the collection of whole building energy and water use data for a period of at least five years. The next version of LEED (LEED 2012) is expected to include requirements for the conduct of post-occupancy evaluations (POEs).
127
BOMA Greater Phoenix Testimony, Younger Testimony (CLEAResult), Desiderio Testimony (Real Estate Roundtable), Burton Testimony (BOMA), Burr Testimony (IMT) 128
Pyke Testimony (USGBC), BPP FAQs: http://www.usgbc.org/ShowFile.aspx?DocumentID=7743
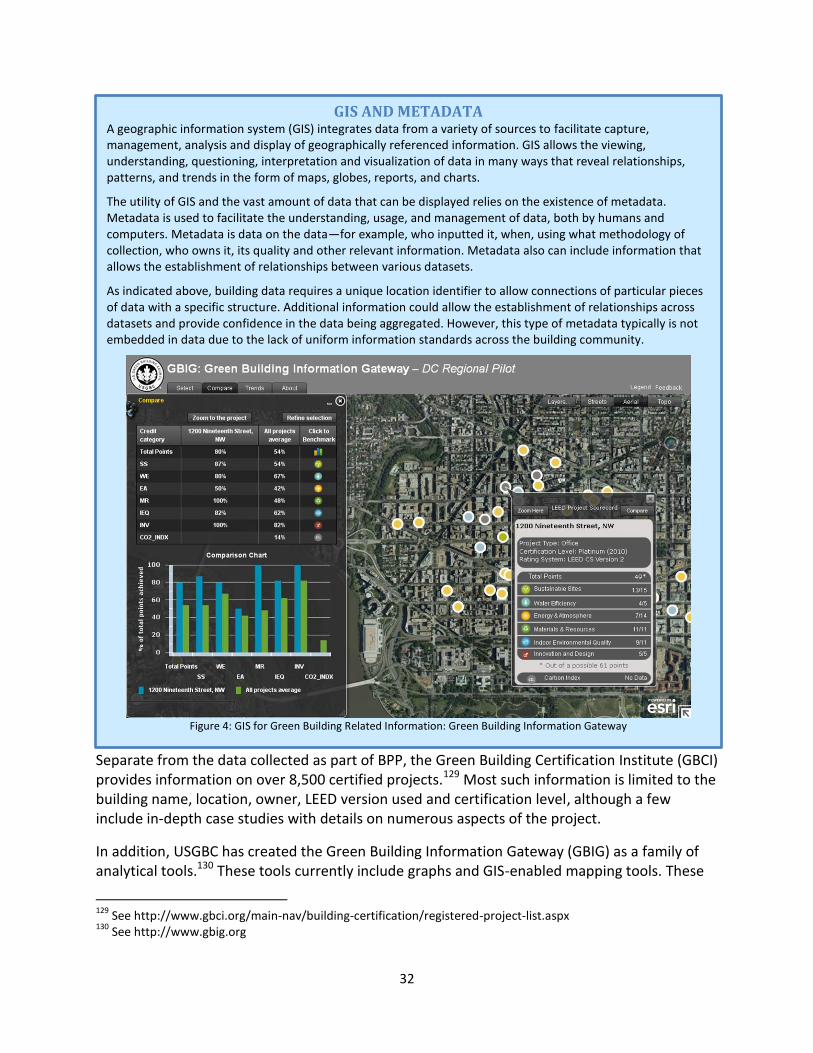
32
GIS AND METADATA A geographic information system (GIS) integrates data from a variety of sources to facilitate capture, management, analysis and display of geographically referenced information. GIS allows the viewing, understanding, questioning, interpretation and visualization of data in many ways that reveal relationships, patterns, and trends in the form of maps, globes, reports, and charts.
The utility of GIS and the vast amount of data that can be displayed relies on the existence of metadata. Metadata is used to facilitate the understanding, usage, and management of data, both by humans and computers. Metadata is data on the data—for example, who inputted it, when, using what methodology of collection, who owns it, its quality and other relevant information. Metadata also can include information that allows the establishment of relationships between various datasets.
As indicated above, building data requires a unique location identifier to allow connections of particular pieces of data with a specific structure. Additional information could allow the establishment of relationships across datasets and provide confidence in the data being aggregated. However, this type of metadata typically is not embedded in data due to the lack of uniform information standards across the building community.
Figure 4: GIS for Green Building Related Information: Green Building Information Gateway
Separate from the data collected as part of BPP, the Green Building Certification Institute (GBCI) provides information on over 8,500 certified projects.129 Most such information is limited to the building name, location, owner, LEED version used and certification level, although a few include in-depth case studies with details on numerous aspects of the project.
In addition, USGBC has created the Green Building Information Gateway (GBIG) as a family of analytical tools.130 These tools currently include graphs and GIS-enabled mapping tools. These
129
See http://www.gbci.org/main-nav/building-certification/registered-project-list.aspx 130
See http://www.gbig.org
33
tools allow users to visualize green building trends over time or within particular localities and compare individual buildings with the project average. The project currently is limited in scope, with map-based data for Chicago and Washington, D.C., but will be expanded in the future. Current formats include PC-based and mobile applications. More details on this type of data are discussed in the GIS and Metadata sidebar.
Building Owners and Managers Association EER and 360 Programs
BOMA produces several resources to assist members and others in evaluating specific building related needs. The Experience Exchange Report (EER) provides market level data for more than 140 cities.131 The EER includes verified data on income and operating expenses from over 6,500 buildings. Data is collected via an online survey. Individual inputs are aggregated to present information in terms of averages, medians, and upper and lower quartiles. Because the data is in the form of cost, its utility for users outside the real estate or financial sectors may be limited. The captured data includes pricing for:
office rents
retail and other rental income
telecom and wire access income
real estate taxes
energy and other utilities costs
repairs and maintenance
cleaning
administrative costs
security
roads and grounds
BOMA also implemented the 360 Program in 2009 to provide members with the capability to benchmark buildings on six major areas of building operations and management.132 Those buildings that achieve the required number of points are recognized as BOMA 360 Performance Buildings. As part of the submission requirements for the 360 Program, owners must submit data to the EER survey.
131
See http://www.boma.org/Resources/benchmarking/Pages/default.aspx 132
See http://www.boma.org/GETINVOLVED/BOMA360/Pages/default2.aspx
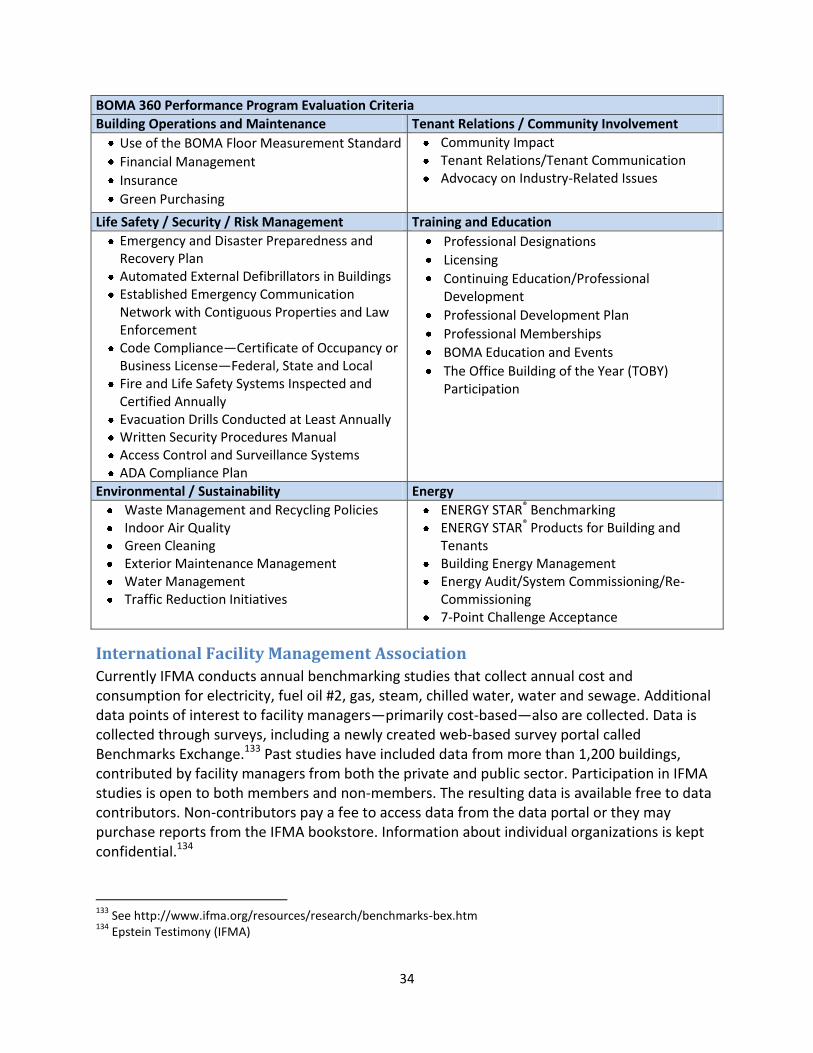
34
BOMA 360 Performance Program Evaluation Criteria
Building Operations and Maintenance Tenant Relations / Community Involvement
Use of the BOMA Floor Measurement Standard
Financial Management
Insurance
Green Purchasing
Community Impact Tenant Relations/Tenant Communication Advocacy on Industry-Related Issues
Life Safety / Security / Risk Management Training and Education Emergency and Disaster Preparedness and Recovery Plan
Automated External Defibrillators in Buildings Established Emergency Communication Network with Contiguous Properties and Law Enforcement
Code Compliance—Certificate of Occupancy or Business License—Federal, State and Local
Fire and Life Safety Systems Inspected and Certified Annually
Evacuation Drills Conducted at Least Annually Written Security Procedures Manual Access Control and Surveillance Systems ADA Compliance Plan
Professional Designations
Licensing
Continuing Education/Professional Development
Professional Development Plan
Professional Memberships
BOMA Education and Events
The Office Building of the Year (TOBY) Participation
Environmental / Sustainability Energy Waste Management and Recycling Policies Indoor Air Quality Green Cleaning Exterior Maintenance Management Water Management Traffic Reduction Initiatives
ENERGY STAR® Benchmarking ENERGY STAR® Products for Building and
Tenants Building Energy Management Energy Audit/System Commissioning/Re-
Commissioning 7-Point Challenge Acceptance
International Facility Management Association
Currently IFMA conducts annual benchmarking studies that collect annual cost and consumption for electricity, fuel oil #2, gas, steam, chilled water, water and sewage. Additional data points of interest to facility managers—primarily cost-based—also are collected. Data is collected through surveys, including a newly created web-based survey portal called Benchmarks Exchange.133 Past studies have included data from more than 1,200 buildings, contributed by facility managers from both the private and public sector. Participation in IFMA studies is open to both members and non-members. The resulting data is available free to data contributors. Non-contributors pay a fee to access data from the data portal or they may purchase reports from the IFMA bookstore. Information about individual organizations is kept confidential.134
133
See http://www.ifma.org/resources/research/benchmarks-bex.htm 134
Epstein Testimony (IFMA)
35
Sector-Specific Data Efforts
Most business sectors across the economy have associations that assist members in tackling issues of mutual concern and interest for the benefit of the entire sector. For the sectors where buildings are crucial parts of their business, some associations have made efforts to allow benchmarking of their building types. EPA has worked with a few of these associations to develop an Energy Star Performance Scale for particular building types. Examples include senior
CASE STUDY: AMERICAN HOUSING SURVEY AND OTHER DATASETS The U.S. Census Bureau conducts the American Housing Survey (AHS) to obtain up-to-date housing statistics for the U.S. Department of Housing and Urban Development (HUD). The AHS is the most comprehensive national housing survey in the United States. It provides data on a wide range of housing subjects, including single-family homes, apartments, manufactured housing, vacant units, family composition, income, housing and neighborhood quality, housing costs, equipment, fuel type and recent moves.
The AHS has much more data than the U.S. Census, though in less geographic detail. The AHS focuses on the size and composition of the housing inventory. For example, it asks about the number of stories in structures, water leakage and external building conditions. It also collects data on heating− and cooling−degree days and fuels. It looks at financial characteristics, such as monthly housing costs (that is, the sum of all housing costs including utilities, the ratio of housing costs to income, and payment plans of primary and secondary mortgages).
Questions on neighborhood quality, such as presence or lack of crime, litter or housing deterioration, give valuable qualitative data to social scientists, health officials and other analysts. The survey is redesigned from time to time to make sure it meets current needs. Some recently added items include information about gated communities and about home equity loans.
The survey asks homeowners about repairs and mortgages; renters about rent control and rent subsidies; recent movers about the homes they left and why they moved; and workers about their commutes. National data are collected every 2 years from a sample of housing units.
The national survey, which began in 1973, has sampled the same units since 1985; it also samples new construction to ensure continuity and timeliness of the data. Data from the AHS allow researchers and policy analysts, both inside and outside the government, to document housing problems and to evaluate the operation of the housing market and of policies designed to improve housing.
The AHS is a household survey conducted using a laptop survey questionnaire. Data are collected by census enumerators by telephone or personal visit. For unoccupied units, data are collected from landlords, rental agents or neighbors.
The AHS conducts a national survey and a metropolitan area survey. The national survey includes about 60,000 housing units. The metropolitan survey has changed many times, mostly in response to changes in the AHS budget.
In 2009, for example, estimates for the following metropolitan areas are available: Chicago, Detroit, New Orleans, New York City, Northern New Jersey, Philadelphia and Seattle. Only New Orleans and Seattle were designed as metropolitan surveys in the traditional sense. The other five areas were surveyed as part of the 2009 national survey, where the existing national sample was supplemented with new samples in order to produce reliable metropolitan estimates.
Each housing unit in the AHS sample represents a large number of other units. Sample units are weighted and represent about 2,000 other units in the national survey. The weighting is designed to minimize sampling error and utilize independent estimates of occupied and vacant housing units.
36
care and assisted living, hospitals and automobile dealerships.135 Most recently, EPA announced the establishment of a similar program for multifamily housing through coordination with Fannie Mae and a working group of stakeholders.
State and Local Data Initiatives
As indicated above, several jurisdictions have implemented benchmarking and disclosure requirements that could produce useful data on buildings within a particular geographic area. However, some jurisdictions have gone further to either develop their own survey data or implement programs that could provide useful data.
California’s Commercial End Use Survey (CEUS) is probably the best known state-level consumption survey.136 CEUS is a comprehensive study of commercial sector energy use, primarily designed to support the state's energy-demand forecasting activities. A stratified random sample of 2,790 commercial facilities was collected from the service areas of Pacific Gas and Electric, San Diego Gas & Electric, Southern California Edison, Southern California Gas Company and the Sacramento Municipal Utility District. The sample was stratified by utility service area, climate region, building type and energy consumption level. For each utility service area, floor stocks, fuel shares, electric and natural gas consumption, energy-use indices (EUIs), energy intensity, and 16-day hourly end-use load profiles were estimated for 12 common commercial building type categories. The state conducted the most recent CEUS in 2006.
The CEUS methodology included on-site collection of building characteristics and utility billing records. Time-of-use data loggers monitored HVAC and lighting systems at about 500 properties. This data was then used to develop calibrated energy simulation models for all CEUS premises. This modeling allowed further in-depth analysis for items of interest, including hourly end-use energy consumption and segmented end-use load profiles for all major commercial building types. Details on the CEUS methodology are presented in the final survey report and should be reviewed for potential use in future survey efforts. The contractor responsible for CEUS also identified recommendations that could be helpful in informing future data collection efforts.137
New York City recently enacted legislation as part of its “Greener, Greater Buildings Plan” to require energy audits at least every 10 years for existing buildings greater than 50,000 sq.ft.138 San Francisco implemented the “Existing Commercial Buildings Energy Performance Ordinance” which also requires regular audits for buildings and tracking of energy use in Portfolio Manager.139 Along with benchmarking and disclosure requirements, results from these audits could become the basis for a city-wide consumption survey.
135
Zatz Testimony (EPA Energy Star) 136
See http://www.energy.ca.gov/ceus/ 137
See http://www.energy.ca.gov/2006publications/CEC-400-2006-005/CEC-400-2006-005.PDF 138
Rainey Testimony (SOM) 139
Rainey Testimony (SOM)

37
Massachusetts offers a free web-based tool called Mass Energy Insight that allows cities and towns to monitor their municipal energy usage and costs. Municipalities can create an energy use baseline, compare energy usage across building types in order to identify prime candidates for improvements, and communicate this information to the public. The hope is that this tool will eventually enable cities and towns to benchmark their buildings against other municipal buildings in the state on a weather-normalized basis. The distinguishing feature of this tool is that utility data (electricity and gas usage) is directly downloaded into the system, relieving cities and towns of the burden of entering this data themselves. Currently, 222 communities have been trained on how to use Mass Energy Insight.140
Probably not as well-known as activities currently going on in California, New York and Massachusetts, the state of Minnesota has implemented SB2030, which covers over 6,000 public buildings in the state.141 In 2008, the Minnesota Legislature passed a bill requiring the state to develop a regionalized program based on the energy reduction schedule for the 2030 Challenge. The program is mandatory for building projects receiving state bond funds and requires the incorporation of these standards in utility conservation programs. The program also required development of procedures for ongoing monitoring of energy use in buildings that have adopted the performance standards—the Buildings, Benchmarks and Beyond (B3) program. The Weidt Group was instrumental in the development of the B3 tool and offered the following summary of its utility:
“The B3 program is a high-level screening tool for existing buildings that uses a simulation-based benchmark to extend the functionality of Energy Star into un-surveyed building configurations. B3 also sends data on buildings in Minnesota to Energy Star. While B3’s initial function was to auto-generate energy simulation results for all 6,800 public buildings in Minnesota and Iowa and compare actual use to an acceptable target, it has since been used to target energy efficiency investment dollars, and, over the past seven years, it has also become the site for tracking the on-going value of energy efficiency improvements. The web-based B3 tool compares actual energy consumption to a modeled expectation for each specific building. We are certain that the initial model data will not match the actual data in many cases since the initial models contain a very large number of assumptions. We are simply looking for the worst matches—the bigger the delta, the greater the opportunity to improve and refine the building and improve the model. With a functioning model, the owner can explore cause and effect relationships, propose improvements and track results. This program initially focused on setting standards and helping design teams achieve “reach-goals” in new construction, but has the potential to dramatically improve benchmarking among existing buildings as well and to serve as a model for rating and labeling programs across the country.”142
In New Hampshire, all K-12 schools (both public and private) receive free access to the New Hampshire EnergySmart Schools Program. Thus far, about one-third (146) of schools in the
140
Jones Testimony (NEEP) 141
See http://www.mnbenchmarking.com/ 142
Eijadi Testimony (Weidt Group)
38
state take advantage of the program. To participate, schools submit data on energy use, number of students, square footage and number of computers. The school then receives a report analyzing energy consumption and utility costs. The report compares a school’s data against similar schools in New Hampshire and across the country (by integrating with Portfolio Manager) to assess performance relative to other buildings.143
Utilities
Naturally, utilities have some data about their customers and the energy and water they use. However, such data often is strictly associated with a particular meter, with few details on the actual premises the meter is connected to. Also, utility data generally is considered confidential unless the user authorizes sharing such data with third parties (such as for submission to Portfolio Manager) or if disclosure is required by law. Such confidentiality has even challenged building owners’ ability to benchmark some buildings where tenants are responsible for their utility use. A program in Chicago through Commonwealth Edison (ComEd) provides building owners with a streamlined tool to input whole building energy data from multi-tenant buildings in to Portfolio Manager and assess building energy use and monitor the results of improvement projects.144
In addition to data on utility usage, many utilities or entities receiving funding from utility fees provide services to assist customers in improving energy or water usage. Requiring the recipients of incentives through these types of programs to provide the data would ease data collection and provide a verification method for the utility or incentive programs.145 Minnesota’s largest utility has adopted use of a tool for implementation of the 2030 Challenge as part of its energy design assistance program. Once the buildings are built, the same tool and database, containing all the modeling parameters, will be populated with all the operating data available from each building.146
The emergence of the Smart Grid and Smart Meters, and dynamic pricing and automated demand response, could provide expanded data sources through the utility sector, as discussed below.
Private Monitoring Services
With the expanded focus on energy use and the growing availability of building automation systems (BAS), sensors, sub-meters and internet-based services, a variety of companies now provide benchmarking services. Such services can provide real-time access to building energy use, down to the individual piece of equipment. Other services can monitor monthly utility bills for potential issues with equipment; identify potential cost savings; and recommend improvements. In the process of providing these services, energy use and other data points for the covered building can be retained by the service provider.
143
Jones Testimony (NEEP) 144
Desiderio Testimony (Real Estate Roundtable) 145
Bakshi Testimony (YRG Sustainability) 146
Eijadi Testimony (Weidt Group)
39
While such data could be useful in determining the state of the building stock, several hurdles must be overcome. As with the data in Portfolio Manager, owners who procure such services do not represent the broad spectrum of building owners and their buildings. Also, with the numerous service providers in the market, this type of data is not available from a single source or necessarily in a manner that can be easily aggregated. Finally, proprietary and business interests discourage providers from sharing the data they obtain.
Manufacturers
Though not yet prevalent in the United States, some building equipment manufacturers have linked their equipment to service and monitoring centers. In Japan, Daikin currently remotely monitors HVAC systems throughout the country. Technicians are dispatched based on signals sent from equipment, which constantly runs self-diagnostics. The equipment’s onboard computer will determine if there is a reason for a maintenance call and send the appropriate information to the local technician, who can gather the correct part or equipment necessary to perform the preventative maintenance required and to avert an equipment failure.147 Having direct connections to particular pieces of equipment can allow on-going collection of performance data. BAS and energy management systems (EMS) providers could also take advantage of similar technology to monitor whole building performance. Such data could be invaluable in determining performance of particular building systems and the whole building.
Evaluation Services and Testing Labs
Before individual products enter the marketplace, they often go through a variety of tests to determine their safety, energy use and other characteristics. Additional tests may be conducted to demonstrate compliance with voluntary, third-party certifications. Reported results to regulators or the public often reflect only a yes or no answer, but evaluation and testing services and the individual product manufacturer have much more in-depth results due to testing. As an example of such data, “GREENGUARD has tested thousands of products for VOC emissions, including furniture, flooring, adhesives and paint, and can provide data showing which products tend to be high-emitters of a given chemical (such as formaldehyde) or of all chemicals found (total VOC or TVOC). This information is confidential and proprietary, though it could be used to help identify problems and associated solutions. However this data would be much more useful if there is sufficient and reliable data that first shows which buildings have high amounts of VOCs (either individual chemicals and/or the total) in the air.”148
Marrying the performance and characteristics of individual building components with building characteristics and the overall performance of the building may reveal correlations not immediately apparent through a focus on only whole building performance. The availability of individual component data also may lead to increased understanding of the synergies across building systems.
147
Dorey Testimony (Daikin-McQuay) 148
Rossola Testimony (GREENGuard)
40
AIA 2030 Commitment149
In December 2005, AIA adopted a position statement calling for achievement of zero fossil fuel consumption in buildings by 2030. As part of this call, AIA established the 2030 Commitment to engage firms and demonstrate progress toward the 2030 goals. To date, more than 170 firms of all sizes have made the commitment. As part of the commitment, firms are asked to provide data annually on all design work conducted by the firm in the prior year. Such reporting is in the form of an Excel-based tool. For 2010, 56 firms submitted data, including predicted Energy Use Intensity (pEUI) data on real estate equaling one-third of all LEED-certified buildings to date. The power of this reporting tool is clear, and the method for collecting this data is simple, scalable and builds upon data collection already required or that will be required as part of the forthcoming adoption of advanced, high-performance building codes. 150
As part of the submission process, each project must include an indication of whether or not a process is in place to collect actual building data upon project completion. In reporting for 2010, only 38 percent of projects will collect actual building data upon completion.
CoStar151
CoStar has developed an extensive database of commercial properties both in the United States and internationally. As of October 2011, their databases included nearly 80 billion sq. ft. The data largely focuses on real estate-related information, including tenant history, available space for lease and market data. Recently, CoStar began including information on third-party certifications like Energy Star and LEED. The CoStar data can be used to identify trends within the commercial building market, but probably even more valuable and of greater interest to the building community as a whole is the ability to characterize the building stock in terms of building type, floor area, occupancy, vintage and location. Such data could also assist in identifying properties to include within a particular survey.
Greenprint Foundation152
The Greenprint Foundation maintains a database and produces an annual Greenprint Performance Report covering 1,623 properties and 31 million sq. m of commercial space globally. Buildings in the database represent select assets of Greenprint members including GE Capital, Hines, Jones Lang LaSalle, Prudential and TIAA-CREF. The report primarily focuses on greenhouse gas emissions associated with the reported buildings. Since the initial data collection and report in 2009, the dataset has expanded considerably in terms of properties (170% increase) and space (93% increase). All included data is collected based on an open standard for measuring, benchmarking and tracking energy usage and resulting emissions down to the individual building. Greenprint Foundation employs a data collection, verification and calculation process aligned with the Greenhouse Gas Protocol and the principles of ISO 14064.
149
See http://www.aia.org/about/initiatives/AIAB079458 150
Andrejko Testimony (AIA) 151
See http://www.costar.com 152
See http://www.greenprintfoundation.org
41
Data Reporting Companies
Companies like McGraw-Hill,153 Reed154 and ZweigWhite155 provide ongoing data collection and reporting on a variety of topics of importance to the building community. The Dodge database from McGraw-Hill has served as a source of data on the scope of the building stock and as the foundation of survey sample development. Additional data and analysis on market outlooks, trends in design and construction, and costs are available from these entities.
Individual Building Owners
Building owners with large portfolios and those particularly interested in building performance often have databases of building characteristics and ongoing operational data. Autodesk, for instance, collects information on a dozen of its own buildings as part of a “Living Lab” program where they test novel technologies and methodologies. Buildings in the program represent commercial office buildings of various shapes, sizes and ages in different geographies across the world.156 ASHRAE’s recent headquarters renovation also incorporated a vast array of sensors to monitor multiple aspects of building performance. The General Sevices Administration (GSA) and other federal agencies also collect and maintain data on the buildings they own or lease.
Other Data Sources
Witnesses also identified other possible sources of existing data including the Department of Energy’s High Performance Buildings Database,157 the Industrial Asset Management Council (IAMC)158 and Energy Service Companies (ESCOs). NBI has compiled a substantial internal database of high-performance buildings used in its analyses of the actual performance levels achieved and in the development of tools to better interpret energy use data.159 As part of their preliminary assessment, participants in the DASH program developed a spreadsheet of data sets they identified.
153
See http://www.construction.com 154
See http://www.reedconstructiondata.com 155
See http://www.zweigwhite.com 156
Deodhar Testimony (Autodesk) 157
See http://eere.buildinggreen.com 158
See http://www.iamc.org 159
Turner Testimony (NBI)
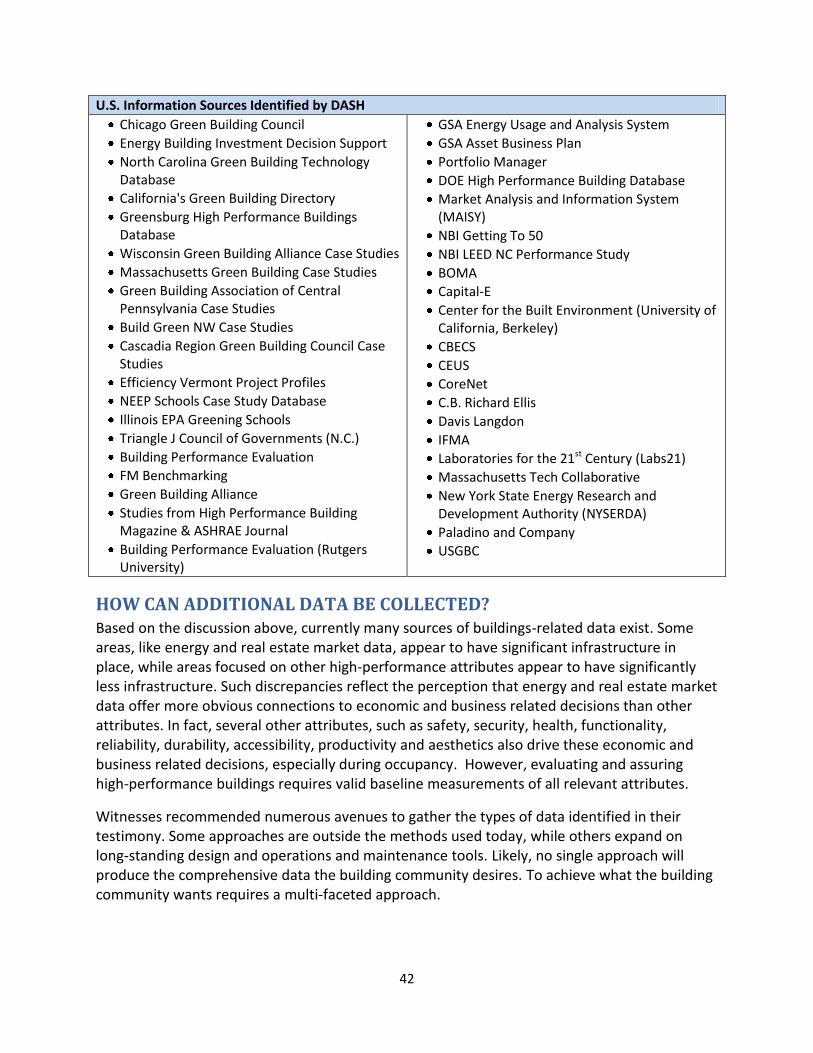
42
U.S. Information Sources Identified by DASH
Chicago Green Building Council
Energy Building Investment Decision Support
North Carolina Green Building Technology Database
California's Green Building Directory
Greensburg High Performance Buildings Database
Wisconsin Green Building Alliance Case Studies
Massachusetts Green Building Case Studies
Green Building Association of Central Pennsylvania Case Studies
Build Green NW Case Studies
Cascadia Region Green Building Council Case Studies
Efficiency Vermont Project Profiles
NEEP Schools Case Study Database
Illinois EPA Greening Schools
Triangle J Council of Governments (N.C.)
Building Performance Evaluation
FM Benchmarking
Green Building Alliance
Studies from High Performance Building Magazine & ASHRAE Journal
Building Performance Evaluation (Rutgers University)
GSA Energy Usage and Analysis System
GSA Asset Business Plan
Portfolio Manager
DOE High Performance Building Database
Market Analysis and Information System (MAISY)
NBI Getting To 50
NBI LEED NC Performance Study
BOMA
Capital-E
Center for the Built Environment (University of California, Berkeley)
CBECS
CEUS
CoreNet
C.B. Richard Ellis
Davis Langdon
IFMA
Laboratories for the 21st Century (Labs21)
Massachusetts Tech Collaborative
New York State Energy Research and Development Authority (NYSERDA)
Paladino and Company
USGBC
HOW CAN ADDITIONAL DATA BE COLLECTED? Based on the discussion above, currently many sources of buildings-related data exist. Some areas, like energy and real estate market data, appear to have significant infrastructure in place, while areas focused on other high-performance attributes appear to have significantly less infrastructure. Such discrepancies reflect the perception that energy and real estate market data offer more obvious connections to economic and business related decisions than other attributes. In fact, several other attributes, such as safety, security, health, functionality, reliability, durability, accessibility, productivity and aesthetics also drive these economic and business related decisions, especially during occupancy. However, evaluating and assuring high-performance buildings requires valid baseline measurements of all relevant attributes.
Witnesses recommended numerous avenues to gather the types of data identified in their testimony. Some approaches are outside the methods used today, while others expand on long-standing design and operations and maintenance tools. Likely, no single approach will produce the comprehensive data the building community desires. To achieve what the building community wants requires a multi-faceted approach.

43
Integration of Existing Datasets
With the extensive number of existing datasets identified previously, it would be beneficial (both in terms of cost and time) to integrate such datasets to the extent practical.160 This would require the development of standards and protocols for data collection, data quality, anonymization, metrics and definitions already outlined.
Post Occupancy Evaluations
Manifestations of the high-performance attributes of concern to the building community are primarily evident following occupancy of the building. Expanding the use of post-occupancy evaluations (POEs) can help establish a mechanism for data collection. These points of contact between professionals and buildings, in conjunction with commissioning, re-commissioning and retro-commissioning as discussed below, could offer ideal opportunities to collect and submit data to a central repository.
However, building owners need to see the value of conducting POEs in order to assure their widespread use.161 Results from POEs can help determine the successes and flaws in emerging high-performance building protocols. For example, a 2009 post-occupancy survey of Massachusetts’ high-performance schools revealed a variety of issues, both with data collection and actual performance.162
Commissioning and Audits
Both New York City and San Francisco have implemented mandatory audits on a regular schedule. Federal agencies have similar requirements for their buildings. However, no requirements currently exist to collect the results of such audits—they just track the fact that they occurred. A central repository for the results of audited buildings and the results of any actions taken due to such audits could be established.
Additionally, as buildings are commissioned, relevant data could be filed. Such data could serve both as an as-built characterization of the buildings and its systems, and as documentation of relevant performance. Subsequent re-commissioning and retro-commissioning could assist in establishing a long-term record for a particular building, including any ECMs utilized and their results, changes in use, and an ongoing data stream. A database of commissioning activities and results should be established with input from commissioning-related professional groups like NEBB.163 Formation of such a database also would require establishing an expectation among commissioning practitioners on specific reporting protocols and submission of reports to the database.
Expanding the use of commissioning can provide the dual benefits of optimizing building performance and providing a data collection mechanism. Programs like LEED already include provisions to encourage commissioning. Codes and standards also are beginning to incorporate 160
Tobias Testimony (Malachite) 161
Woods Testimony (IEQ Consultant) 162
Jones Testimony (NEEP) 163
Wiggins Testimony (NEBB/Newcomb & Boyd), Meyer Testimony (ESCO Group)

44
commissioning requirements. Working with certification programs and codes and standards developers, provisions for reporting of commissioning results should be incorporated into their requirements.164
Benchmarking and/or Disclosure
In addition to auditing requirements, many jurisdictions are implementing benchmarking and disclosure requirements. Such requirements may provide an opportunity for data gathering.165 Jurisdictions will require reporting of energy performance metrics for billions of square feet of floor space in the coming years. In many cases, that information will include annualized energy consumption, energy use intensity, building square footage and building type.166 In addition to the data obtained through such mandatory requirements, mechanisms for voluntary submission of benchmark data should be established.167
Massachusetts and New Hampshire have developed statewide tools to help communities and school districts assess their energy usage. Both state systems were developed using funds from the Regional Greenhouse Gas Initiative (RGGI). The Massachusetts system, called Mass Energy Insight, is available to all municipalities and helps communities track and assess energy use. The New Hampshire system is solely for school districts and is specifically a benchmarking tool. Both models illustrate the ability of states to lead the energy data collection efforts.168 The Collaborative for High Performance Schools (CHPS) also has a benchmarking tool that tracks the current performance of existing schools, provides a report card of results and makes suggestions for improvement. Assessments take place in five categories: energy efficiency, thermal comfort, visual comfort, indoor air quality and acoustics.169
In its testimony, Schneider Electric stated that development and use of a strong energy-focused rating program is key to driving better building performance. However, the company recognizes that a good rating system cannot exist without a good dataset used for benchmarking.170
Incentives
Beyond the implementation of requirements, state and local governments (along with utilities) can incentivize participation in data collection efforts. Building owners that receive grants, rebates, loans or other funding from government agencies or utilities could be required to participate in data collection efforts as a condition of receiving funding. Results of such requirements would be two-fold: first, the funding agency would have a method to monitor the effectiveness of its programs, and second, the amount of data available on building performance would increase.171 The entity undertaking the data collection could offer other
164
Wiggins Testimony (NEBB/Newcomb & Boyd), Meyer Testimony (ESCO Group) 165
Deodhar Testimony (Autodesk) 166
Burr Testimony (IMT) 167
Lewis Testimony (NEMA) 168
Jones Testimony (NEEP) 169
Jones Testimony (NEEP) 170
Pauley Testimony (Schneider Electric) 171
Bakshi Testimony (YRG Sustainability)
45
incentives, including providing free access to the aggregated results for all those submitting qualified data.172
Sensors, Building Automation Systems and Field Instruments
Commercial buildings increasingly use building automation systems (BAS) to manage various systems, from mechanical to lighting to life safety. The BAS can use existing networks of sensors and controls to conduct ongoing data collection.173 Even older buildings with pneumatic or low-voltage controls are becoming capable of providing increasing amounts of digital data that can become the cornerstone of intelligent, advanced IEQ and energy management and maintenance strategies. Today, building owners can derive far more value from a BAS than they ever could before.174 Autodesk reported on a project underway, Project Dasher, which seeks to tie live streaming data from sensors, sub-meters and BAS systems directly into the building information model (BIM) (more discussion on data collection opportunities through BIM are discussed below).175 Utilization of BAS collected data requires that periodic calibration procedures be followed to assure accuracy.176
In addition to on-site sensors and BAS, field measurements may be required for data on particular high-performance building attributes or for buildings where BAS data is insufficient or non-existent. When such portable field-type instrumentation is used, documentation of its calibration and validation should be required.177
Sub-Metering
Sub-metering can provide the type of end use data many within the building community desire and will become more prevalent.178 Sub-metering plug loads and tenant energy use is important for tenant-specific feedback.179 However, the meters should be commissioned to assure that metering is accurate.180
Permits Database and Building Information Modeling (BIM)
Most construction within the United States occurs following receipt of a building permit. This initial submission of data to a jurisdiction can result in the creation of a new database record and provide information on trends in new construction and major renovations. Initial information available at the time of permitting should include square footage, primary building systems and general occupancy characteristics.181 The required submission of a BIM with a building permit will provide even greater building characterization and allow long-term
172
Pauley Testimony (Schneider Electric) 173
Pauley Testimony (Schneider Electric), Woods Testimony (IEQ Consultant) 174
Shattuck Testimony (Scientific Conservation) 175
Deodhar Testimony (Autodesk) 176
Woods Testimony (IEQ Consultant) 177
Woods Testimony (IEQ Consultant) 178
Pauley Testimony (Schneider Electric), Sands Testimony (Performance Building Systems) 179
Turner Testimony (NBI) 180
Wiggins Testimony (NEBB/Newcomb & Boyd) 181
Turner Testimony (NBI)

46
BIM AND INFORMATION EXCHANGES A building information model (BIM) is a digital representation of the physical and functional characteristics of a facility. As such, it serves as a shared knowledge resource for information about a facility, forming a reliable basis for decisions during its life cycle from inception onward. A basic premise of BIM is collaboration by different stakeholders at different phases of the life cycle of a facility to insert, extract, update or modify information in the BIM process to support and reflect the roles of that stakeholder. The BIM is a shared digital representation founded on open standards for interoperability.
To capture the value—or information—embodied in a BIM requires the ability to input and extract data from different sources in a format that allows use by participants. The use of information exchanges is a critical part of a data gathering structure. The goal is to turn data into information, then turn information into knowledge. An information exchange initially will provide structure to data and ultimately can provide a data flow.
To facilitate this exchange of information, the Institute’s buildingSMART alliance and Facilities Maintenance and Operations Committee (FMOC) are developing information exchange protocols for various uses. The Construction Operations Building information exchange (COBie) is a common framework for the input of data identified during design to be of value to the owner—such as warranty information about a manufactured part. The information is expanded during construction through the addition of details, such as serial number, manufacturer, warranty information and the date of installation, with the intent of delivering all the information to the facility manager for use over the facility life cycle. Currently, the information exchanges are focused on providing utility within a BIM, but if the infrastructure and partnerships are developed effectively, an exchange for buildings related data could be established.
management of building systems and performance data in a single repository.182 Real estate and tax records also could provide some data for sampling and characterization of buildings.183
Modeling
Despite the strong preference by some witnesses to only acknowledge actual, not modeled, data, there is clear value in providing modeled data for certain uses. As recommended above, any data based on modeling, engineering models or statistical models, should explicitly state so and provide a detailed description of how it was developed. Ideally, some underlying assumptions for such models should be standardized to allow comparisons across models for some purposes. Providing access to this type of data should ultimately result in improved correlation between the design process and actual performance.184
Obtaining a statistically significant dataset with the required quality and proper classifications has been elusive. However, building modeling and energy simulation can serve to fill this gap. Modeling and energy simulation allow large numbers of buildings to be quickly and inexpensively created and analyzed to provide detailed feedback on what strategies work and when. This utility is the reason so many other science-based performance engineering industries, such as electronics and aerospace, utilize models and simulation. Modeling and simulation provide a means to scientifically test prototypes and forecast the results due to particular choices. It also provides mechanisms to evaluate parameters difficult or impossible to measure in the physical world.
182
Deodhar Testimony (Autodesk) 183
Harris Testimony (ASE) 184
Sands Testimony (Performance Building Systems)

47
Autodesk has found that statistical studies, energy benchmarking, pro‐forma analyses or preliminary site evaluations often need to be augmented by energy models. Energy models help establish a baseline of a building’s current performance and estimate potential performance. They also are needed to optimize building energy performance on an ongoing basis and evaluate energy-related retrofits. Further, models inform prioritization and optimization of ECMs and setting of long‐term plans for Net Zero Energy.185
For India, The Weidt Group developed a web-based tool for projects seeking performance compliance under the energy code. The tool builds simulation models of designs, along with comparative code runs, and returns a detailed performance report. The data runs are retained within the system for future use to evaluate actual performance and test planned changes in codes or policies or to evaluate new technologies.186 In the United States, modeling often is used to demonstrate performance compliance with a code or rating system, but the model and resulting data often are not retained in a central repository or even provided to building owners to allow evaluation of actual performance.
The 2009 post-occupancy study of Massachusetts’ schools reported that Energy Star and Portfolio Manager only provided limited utility as a rough indicator of impacts on performance because it was not sophisticated enough to account for nuances in school operation and design. The study found that energy modeling was a more effective tool.187
Utilities
Building energy and water use (and sometimes steam and chilled water) often comes from a centralized utility with metering and billing infrastructures. This information would be valuable in developing a database of building performance if it can link to other building characteristics and HPB performance attributes. However, challenges remain as outlined above. The development of standardized protocols for automated utility data submissions to a central repository with necessary confidentiality provisions would allow a streamlined process for building owners to participate in data collection activities.188
The ComEd program discussed above could serve as an example of how whole building level data can be shared in a manner acceptable to building owners and tenants. It streamlines the submission process and saves both utilities and building managers time and money. 189
Smart Grid and Smart Meters
There has been considerable interest within the building community on the potential of the smart grid and smart meters to serve as data collection points.190 Efforts are underway at the National Institute of Standards and Technology (NIST) to standardize data collection and
185
Deodhar Testimony (Autodesk) 186
Eijadi Testimony (Weidt Group) 187
Jones Testimony (NEEP) 188
Turner Testimony (NBI) 189
Desiderio Testimony (Real Estate Roundtable) 190
Dorey Testimony (Daikin-McQuay), Pauley Testimony (Schneider Electric)
48
interoperability for smart grid communication.191 In response to capabilities of the smart grid and smart meters, individual pieces of equipment within buildings are likely to see increased communication abilities which can be utilized to obtain more detailed information on system performance.
Surveys
EIA has long been conducted the CBECS using a survey protocol. Continued collection of energy data and expanded data points will rely to some extent on surveys of building occupants and building management teams. Obtaining measurable, valid, repeatable, reliable and referenceable data will require validated and standardized protocols for interviews, surveys, system diagnostics and economic analyses.192 For its data collection and survey efforts, IFMA has developed an interactive web-based portal which collects the data in an SQL database. The portal allows respondents to filter data using common variables and unique industry variables and masks the identity of the submitter within the final results.193
Energy Service Companies (ESCOs)
Institutional and government building owners are looking to Energy Service Companies (ESCOs) to provide financing for energy and water savings improvements without compromising the performance of other HPB attributes (e.g., health, safety, accessibility, productivity, maintainability, reliability, durability). The ESCO model depends on the implementation of known effective savings measures and monitoring their effectiveness to assure the initial investment is paying off. Based on this data intensive requirement, ESCOs could participate in collecting and sharing data on the energy saving impacts and associated lifecycle costs of ECMs by climate zone and building type. Similarly, data on water saving impacts and associated lifecycle costs of water conservation measures by climate zone and building type also could be collected and shared. This database could provide designers and building operators a valuable reference source for appropriate, cost-effective energy and water saving strategies for their building type in specific climate zones.194 However, ESCOs have an inherent interest in protecting information on the most effective ECMs as part of their business model.
ASTM Building Energy Performance Assessment
ASTM International recently completed the development of ASTM E2797-11, Standard Practice for Building Energy Performance Assessment for a Building Involved in a Real Estate Transaction. 195 The standard is meant to complement additional guides and practices for property condition assessments and phase I environmental site assessments. While the standard itself does not provide for collection of results in a particular repository, it does
191
Deodhar Testimony (Autodesk) 192
Woods Testimony (IEQ Consultant) 193
Epstein Testimony (IFMA) 194
Rainey Testimony (SOM) 195
See http://www.astm.org/Standards/E2797.htm
49
provide for consistency and transparency in metrics and methodologies. The standard is slowly gaining traction in the appraisal community.196
Other Methods
Obtaining data on human response, occupant performance and productivity requires different collection and evaluation methods than metered data. “Some of these can be measured with more accuracy than others: 1) objective measures of human responses can be obtained with clinical procedures that have been tested for validity and reliability; 2) cost factors can be obtained with valid accounting procedures; and 3) some occupant performance measures can be obtained with independent, reliable and valid industrial engineering techniques (e.g., time and motion studies). However, most of the human response and occupant performance data available today from field studies and investigations are obtained by using survey and interview instruments that have not been pretested for reliability or validity.”197
Internet and laser-based methods for obtaining building information also were proposed. Google Earth could potentially provide details on building footprint, floors, glazing and other data points.198 Autodesk’s Project Photofly can convert photographs of building exteriors to building models in a short amount of time.199 Other technologies exist to convert satellite images, laser distance information and laser scanner data into building models.200 Autodesk has used these types of tools along with their Building Performance Analysis products to construct BIMs for a number of their facilities.201 Such tools also have been used to develop rapid energy models useful for quick and cost-effective energy assessments that overcome many of the current barriers to such assessments.202
WHO SHOULD DO IT AND HOW OFTEN? One of the biggest concerns witnesses raised was that any collection effort be overseen by a neutral third-party that can ensure results are fair, open and defensible.203 Assurance that the necessary data is submitted and outcomes represent the needs of the broad community requires the buy in of all relevant stakeholders from both the public and private sector.204
Witnesses highlighted the role of agencies like EIA in providing the necessary unbiased information and some witnesses preferred such government-sponsored data collection if funding can be secured and the process improved.205 While such an option could fulfill the need
196
Deodhar Testimony (Autodesk) 197
Woods Testimony (IEQ Consultant) 198
Harris Testimony (ASE) 199
Deodhar Testimony (Autodesk) 200
Deodhar Testimony (Autodesk) 201
Deodhar Testimony (Autodesk) 202
Deodhar Testimony (Autodesk) 203
Zatz Testimony (EPA EnergyStar), Lewis Testimony (NEMA) 204
Lewis Testimony (NEMA), Pauley Testimony (Schneider Electric), Woods Testimony (IEQ Consultant) 205
Meyer Testimony (ESCO Group), Andrejko Testimony (AIA)

50
for building energy performance data and some characteristic data, many of the other data points identified above will go uncollected.
A central repository for existing building information databases should be created. Such a repository should co-locate data currently collected by EIA, USGBC, Energy Star, New York City, San Francisco and others.206 However, these data should be validated and rationalized among the databases as part of the co-location. Mechanisms for incorporating additional datasets on performance of HPB attributes should be included after they have been validated and rationalized. The National Institute of Building Sciences was cited numerous times as a potential organizer of such an activity based on its establishment by Congress and the mission to work with the diverse participants within the building community.
“The repository for this new database should be the Whole Building Design Guide (WBDG) [of the Institute], which now provides comprehensive design and operational guidance to government agencies, private sector owners, developers and planners, financiers, realtors, designers, policy-makers, facilities managers, educators and other stakeholders. Based on previous experience, [the Institute] should serve as the Clearinghouse. Responsible and accountable parties should be authorized to acquire and submit data to the Clearinghouse for entry into the database, in accordance with the protocol. This process would be similar to that being used today in the public health community.”207
“The best role of [the Institute] will emerge from the discussions begun today. Logical components could include defining and communicating the standards and definitions, hosting the repository and spearheading the addition of information for targeted segments of the marketplace or types of information.”208
The timely availability of data is essential to providing feedback to the building community.209 Annual reporting of aggregate data appears to be preferable.210 However, there was recognition that an initial dataset may take a few years (ideally within the timeframe anticipated for the 2011 CBECS).211 Development and implementation of an evidence-based, empirical and accurate database for all the primary attributes and their interactions, may take four or five years.212
WHAT WILL IT COST? Funding for establishing the underlying protocols and performing data collection represents the biggest hurdle in the establishment of a comprehensive database of high-performance
206
Rainey Testimony (SOM), Pauley Testimony (Schneider Electric) 207
Woods Testimony (IEQ Consultant) 208
Turner Testimony (NBI), see also Rainey Testimony (SOM) 209
Turner Testimony (NBI), Deodhar Testimony (Autodesk) 210
Lewis Testimony (NEMA) 211
Woods Testimony (IEQ Consultant) 212
Woods Testimony (IEQ Consultant)

51
attributes. The estimated cost for the 2011 CBECS is about $12 million spread over four years. Expanding beyond just energy-related data could require even greater funding.
While the availability of data would greatly benefit government building programs (both internal and external), in the current political and fiscal environment it is unlikely that significant funding would come from federal agencies. Contributions from the private sector and foundations will be necessary.
Based on the utility provided by access to such information, users may be willing to pay a subscription fee to access it. Organizations that help supply data can be compensated either through free or reduced cost access.213
Understandably, few witnesses shared information on the cost of their existing data collection activities, making an accurate assessment of potential costs difficult. However, IFMA did indicate that their survey portal alone cost approximately $20,000.214 The DASH effort already invested approximately $300,000. The overall cost of establishing a data collection scheme from scratch may be significant.
Using experiences from work with the National Center for Energy Management and Building Technologies (NCEMBT), James Woods provided the following estimate of cost and timeline for development of a multi-attribute database.
1. Development of a draft protocol is expected to take approximately one year with a cost estimate of $750,000 to $1,250,000.
2. A shell for the database must be specifically designed to accept the data acquired in accordance with the draft protocol. Delivery of the shell, including the computer hardware and software, is expected to occur simultaneously with Task 1. A cost estimate is $500,000 to $700,000.
3. The draft protocol and shell should be pilot tested and evaluated for accuracy of the performance data to be entered and retrieved. Data should initially be acquired in approximately 30 buildings. Based on the pilot data, accuracy testing and resultant revisions to the protocol would be conducted. Delivery of the revised protocol and shell with an acceptable accuracy is expected to take two years after completion of Tasks 1 and 2, at a cost of $8,000,000 to $10,000,000.
4. Sustaining the database through the standardized protocol and shell would begin a long-term process of data acquisition, data entry and data retrieval by the building community. Data acquisition and submission to the Clearinghouse, in accordance with the standardized protocol, could be funded for each building by resources from each building’s owning and operating budget. Screening and entry of the data by staff could be funded through funds obtained by the Institute.215
213
Shattuck Testimony (Scientific Conservation) 214
Epstein Testimony (IFMA) 215
Woods Testimony (IEQ Consultant)
52
RECOMMENDATIONS The Institute, based on the testimony received, recommends the establishment of a database reflecting all high-performance building attributes and the diverse needs of the building community. It also recommends the following:
Continue to pursue CBECS funding, but with requested modifications: Data on energy use of the building stock is an essential piece of any database focused on high-performance building attributes. Despite the identified shortcomings, CBECS provides validated and accepted data on building stock energy performance. However, any resumption of CBECS should include an expanded and more diverse sample set include additional data points, such as water use and allow for integration and correlation with other datasets. A subset of CBECS data also should be made available to allow advanced statistical computing.
Support development of standards for integration and interoperability: Taking advantage of the multiple existing databases requires the establishment of standards and protocols that allow such databases to work together to produce usable results. Development of these standards and protocols must include the owners of all relevant databases. Existing interoperability efforts, including those currently underway related to BIM and meta-data efforts in GIS, could provide examples and infrastructures to accomplish development of such standards and protocols.
Establish accepted protocols for data acquisition, storage and retrieval, and confidentiality. In order for building owners and others to contribute data to a central repository, they must have assurance that the source and integrity of the data is protected. A common security protocol followed by all data collectors would assure that any combination of databases would provide sufficient protections to submitters.
Encourage data providers and collectors to post data availability on a common website, allowing for the eventual performance of “super searches”: As indicated by the summaries in this report, there already exists numerous datasets maintained by many entities for a variety of purposes. However, lack of public access to such data (and even the knowledge that such data exists) limits its widespread utility. In the near term, a central hub providing information on the availability of data would expand its utility considerably. Eventual integration of such data and the ability to search for particular types of data would further increase utility. The National Renewable Energy Laboratory (NREL) already maintains an open energy data portal that was established as part of the Open Government Initiative.216 Current content is limited, but, through its wiki format, data holders can submit information on their available data.
Form a building data working group with key stakeholders: The recommendations in the testimony received by the Institute represent a fraction of the broader building data stakeholders. However, the recommendations of this limited group already make the case for convening a larger working group of stakeholders who can guide future activities in this area. Such a working group should include both public and privates
216
See http://en.openei.org.

53
sector representatives and all types of data users and providers. Through a cooperative approach, the data collection process can be efficient and allow for integration and aggregation across datasets.
Build on the effort underway to develop DASH: Participants in the DASH program already represent key stakeholders in data collection and utilization. The program has incorporated existing work by ASHRAE and others to identify some metrics of interest. Efforts to establish common collection and anonymization protocols also have begun. Rather than establishing a new data effort, data stakeholders should consider working within the existing DASH program to expand the scope to incorporate additional high-performance attributes and the desired outputs identified in this report.
Develop a new system for the submission, collection and compilation of building data: Individual building systems, occupants and owners do not exist in isolation. To understand how whole buildings perform with respect to the multiple expectations placed on them requires an understanding of how these entities interact. Existing datasets often focus on single attributes with limited to no ability to link to other datasets to evaluate correlations with other attributes. A new data survey system allowing connections across data sets, and ideally only burdening building owners and managers with a single data collection effort, would provide the building community with the greatest benefit for the least overall cost.

54
APPENDIX A: ORAL HEARING PARTICIPANTS The National Institute of building Sciences divided the participants at the oral hearing on July 18, 2011 into sectors. Written summaries and presentations from most of the hearing witnesses are available at http://www.nibs.org/index.php/newsevents/HPBData/HPBHearing/. Below are the sectors and participants represented, including : Architects/Engineers/Contractors/Specifiers
Doug Read, American Society of Heating, Refrigerating and Air-conditioning Engineers (ASHRAE)
David Eijadi, The Weidt Group
Teresa Rainey, Skidmore, Owings & Merrill
Dennis Andrejko, American Institute of Architects
Arpan Bakshi, International Building Performance Simulation Association (IBPSA), New York Chapter / YRG Sustainability
James E. Woods, Indoor Environmental Quality Consultant Building Owners/Facility Managers/Commissioning
Ron Burton, Building Owners and Managers Association (BOMA)
Herbert Yudenfriend
Stephen Wiggins, Newcomb & Boyd / National Environmental Balancing Bureau (NEBB)
Duane Desiderio, Real Estate Roundtable Codes & Standards/Rating Systems
Chris Pyke, U.S. Green Building Council (USGBC)
Tom Meyer, ESCO Group Government
Michael Zatz, U.S. Environmental Protection Agency (EPA) Energy Star Program Software Vendors and Manufacturers
Jim Lewis, National Electrical Manufacturers Association (NEMA)
Bruce Dorey, Daikin-McQuay
Mark Sands, Performance Building Systems Data Managers/Collectors/Reporters/Statisticians/Researchers
Andrew Burr, Institute for Market Transformation (IMT)
Cathy Turner, New Buildings Institute (NBI)
Jeff Harris, Alliance to Save Energy (ASE)
Deborah Dunning, Sphere E Insurance & Finance
Leanne Tobias, Malachite

55
APPENDIX B: WRITTEN TESTIMONY Written testimony is available at http://www.nibs.org/index.php/newsevents/HPBData/HPBHearing/. Testimony was submitted by:
Arpan Bakshi, YRG Sustainability
BOMA Phoenix
Jerry Borchardt, Commercial Control Systems, Honeywell International Inc.
Aniruddha Deodhar, Autodesk, Inc.
Shari Epstein, International Facility Management Association (IFMA)
Susy Jones, Northeast Energy Efficiency Partnerships (NEEP)
Jim Lewis, High-Performance Buildings, National Electrical Manufacturers Association (NEMA)
Jim Pauley, P.E., Schneider Electric
Mark Rossola, GREENGUARD Environmental Institute
Katie Shattuck, Scientific Conservation
Leanne Tobias, LEED AP, Managing Principal, Malachite LLC
Ivan Weber, Weber Sustainability Consulting
Scott West, P.E., BEMP, LEED AP BD+C, Jacobs Engineering
James E. Woods, Ph.D., P.E., Fellow/Life Member ASHRAE, IEQ Consultant
Bill Younger, CLEAResult
56
APPENDIX C: ABOUT THE SPONSORS
National Environmental Balancing Bureau
Established in 1971, the National Environmental Balancing Bureau (NEBB) is the premier international certification association for firms that deliver high-performance building systems. Our members perform testing, adjusting and balancing (TAB) of heating, ventilating and air-conditioning (HVAC) systems; commission and retro-commission building systems; execute sound and vibration testing; and test and certify laboratory fume hoods and electronic and biological cleanrooms. Building owners, engineers and contractors seeking ways to cut costs through the proper design, installation and optimal performance of HVAC and refrigeration systems, benefit from working with NEBB certified professionals, who are required to complete extensive training and testing programs in order to attain certification status. NEBB exists to help architects, engineers, building owners and contractors produce high-performance buildings with HVAC systems that perform as they were visualized and designed. Each discipline uses a NEBB Procedural Standard that provides guidelines for work to be performed. NEBB has also created technical manuals, training materials and seminars to enhance and support each discipline. NEBB certifies firms that meet specified criteria, ensuring strict conformance to its high standards and procedures. See www.nebb.org.
National Institute of Building Sciences
The National Institute of Building Sciences was authorized by the U.S. Congress in the Housing and Community Development Act of 1974, Public Law 93-383. In establishing the Institute, Congress recognized the need for an organization that could serve as an interface between government and the private sector. The Institute's public interest mission is to serve the nation by supporting advances in building science and technology to improve the built environment. Through the Institute, Congress established a public/private partnership to enable findings on technical, building-related matters to be used effectively to improve government, commerce and industry. The Institute is a non-profit, non-governmental organization that brings together representatives of government, the professions, industry, labor and consumer interests to focus on the identification and resolution of problems and potential problems that hamper the construction of safe, affordable structures for housing, commerce and industry throughout the United States. The Institute provides an authoritative source of advice for both the private and public sector of the economy with respect to the use of building science and technology. Congress recognized that the lack of such an authoritative voice was a burden on all those who plan, design, procure, construct, use, operate, maintain and retire physical facilities, and that this burden frequently resulted from failure to take full advantage of new useful technology that could improve our living environment. See www.nibs.org.

57
New Buildings Institute
New Buildings Institute (NBI) is a nonprofit organization working to improve the energy performance of commercial buildings. We work collaboratively with commercial building market players—governments, utilities, energy efficiency advocates and building professionals—to remove barriers to energy efficiency, including promoting advanced design practices, improved technologies, public policies and programs that improve energy efficiency. We also develop and offer guidance to individuals and organizations on designing and constructing energy-efficient buildings through our Advanced Buildings® suite of tools and resources. While NBI is working to achieve net-zero energy buildings—those that meet all power needs through renewable resources—we recognize that they are not easily attainable today. The good news is that buildings with significantly better performance than current standards are possible. NBI’s current efforts are working to provide the policy and program direction and promote design practices and technologies that will result in buildings that are better for people and the environment. NBI works nationally with offices located in Washington state—White Salmon and Vancouver. See www.newbuildings.org.

58
APPENDIX D: HEARING PANELIST BIOGRAPHIES
Henry L. Green, Hon. AIA
The National Institute of Building Sciences appointed Henry L. Green, Hon. AIA, as President and CEO in August 2008. Prior to this appointment, Henry L. Green served as Executive Director of the Bureau of Construction Codes in the Michigan Department of Labor for more than 19 years.
Green was a founding member of the International Code Council Board of Directors, completing a term as President in 2006. He served as a member of the National Institute of Building Sciences Board of Directors for eight years, completing a term as Chairman in 2003. Green was a member of the Building Officials and Code Administrators (BOCA) Board of Directors for 10 years, holding the position of President in 1997.
In 2005, Green was recognized by the United States House of Representatives for his work as “…a tireless advocate for building safety and enforcement of codes.”
The Automatic Fire Alarm Association (AFFA) named him “Man of the Year” for his contributions to life safety as Chairman of the BOCA Ad Hoc Committee for Fire Protection. AFFA acknowledged, “…under his fine leadership, the committee developed numerous code changes to the BOCA National Building and Fire Prevention Codes ... and significantly improved life safety in both new and existing construction.”
He received the “Distinguished Service to Government” award from the Building Industry Association of Southeastern Michigan and was awarded the Walker S. Lee Award in recognition of outstanding service to BOCA International.
He was named an Honorary Architect by the American Institute of Architects in 2008 for his role as “… as a skillful consensus builder in the building codes and standards arena a perpetual advocate for bringing architects into leadership roles.”
Green received the “Building Safety Community Partnership Award” in 2010. The Fairfax County Board of Supervisors presented it in recognition of exemplary contributions to the advancement of Building Safety in Fairfax County.
Gordon V.R. Holness, P.E.
Gordon V.R. Holness, P.E., is Chairman Emeritus of Albert Kahn Associates, Inc., a 400 person Architectural and Engineering Company, in Detroit. He retired from the firm in 2001 having served for over 32 years including roles as Chief Mechanical Engineer, Treasurer, Board Member, President and CEO. He currently serves in a consulting capacity and as an expert witness for design and construction issues. He is a Professional Engineer, registered in 42 states and five provinces. He is a chartered engineer in the United Kingdom (UK). He has over 50 years of experience in design and construction, specifically in mechanical engineering and HVAC&R services for commercial, industrial, health care and institutional buildings in England, Canada and the United States.

59
He has been active in professional societies for most of his career, including service as a director for the Economic Club of Detroit, the American Consulting Engineers Council, the Construction Industry Presidents Forum and the Engineering Society of Detroit, and was recognized as a fellow in the Michigan Society of Professional Engineers, for services to that society. He is a past member of the Chartered Institute of Building Services Engineers (CIBSE) in the UK. He joined The American Society of Heating Refrigerating and Air Conditioning Engineers (ASHRAE) in 1965 and served as Society President in 2009-10 while serving on the Board of Directors and the Executive Committee. His presidential theme, “Sustaining Our Future by Rebuilding Our Past,” focused on energy efficiency in existing buildings as the greatest opportunity for a sustainable future. Holness currently serves as a member of the Board of Directors of the National Institute of Building Sciences. He has Chaired ASHRAE’s Publishing and Education Council, Members Council, the Advocacy Committee and the Steering Committee on Building Information Modeling and Interoperability. He has won 12 Regional and National Awards for Technology and Energy Conservation. He has written numerous articles and is a frequent speaker in such areas as improving energy efficiency in existing buildings, building information modeling, integrated building design and sustainable development.
Ronald L. Skaggs, FAIA, FACHA, FHFI, LEED AP
Ronald L. Skaggs, FAIA, FACHA, FHFI, LEED AP, is immediate past chair of the National Institute of Building Sciences Board of Directors. An architect, he was elected to the Board in 2003 to serve in the public interest category. He is a member of the National Building Information Modeling Standard Committee.
Skaggs is Chairman Emeritus of HKS Architects headquartered in Dallas, Texas. With 41 years of experience, he has directed the overall activities of HKS, Inc. as Chairman and CEO. As principal-in-charge of various healthcare projects at HKS, he has actively engaged in the design of more than 650 health-related institutions including hospitals, clinics and academic health centers.
Skaggs earned both his bachelor and master degrees in architecture from Texas A&M University and was honored as a Distinguished Alumnus of the University. He is also an outstanding alumnus of the College of Architecture, where he was as an adjunct professor.
As an officer in the U.S. Army Surgeon General’s Office, Skaggs worked with the Health Facility Planning Agency in programming and designing a wide range of Army medical facilities and was awarded the Army Commendation Medal for his contributions. Skaggs holds a diploma in healthcare administration from the U.S. Army Academy of Health Sciences. He served as a faculty member and lecturer on the subject of health facility design.

60
Skaggs is a registered architect in a number of states. He is a Fellow of the American Institute of Architects (AIA) and was president of the AIA for the year 2000. Skaggs is past president of the AIA Academy of Architecture for Health, past president of the Dallas Chapter AIA and a former member of the Board of Regents of the American Architectural Foundation. He is also a Fellow of the American College of Healthcare Architects, a Fellow of the Health Facility Institute, a member of the American Hospital Association and past president of the Forum for Health Care Planning. He has served on the board of the Construction Industry Round Table. Skaggs is a recipient of the Silver Medal from the Tau Sigma Delta honor fraternity and lifetime achievement awards from the Texas Society of Architects, American College of Healthcare Architects, Healthcare Symposium and AIA Dallas.
Skaggs previously served as a member of the National Architectural Accrediting Board. He has authored numerous articles and has co-authored several monographs including Building Type Basics for Healthcare Facilities, The Business of Architecture, Architecture for Healing and The Architecture of Hospitals “Centers of Excellence.”

National Institute of Building Sciences1090 Vermont Avenue, NW, Suite 700Washington, DC 20005-4950www.nibs.org