data on internationally-educated physicians in canada 2011 img symposium monday 17 october, 2011...
TRANSCRIPT

Data On Internationally-Educated Physicians in Canada2011 IMG SymposiumMonday 17 October, 2011
Toronto, Ontario, Canada
Steve Slade, VP, Research and Analysis CAPER-ORIS
Linda Bourgeois, Research Associate
Canadian Post-MD Education Registry
Association of Faculties of Medicine of Canada

Evolving IMG-IEP Context
• Many people, organizations, complex processes
• Balancing need for physicians with public safety
• Standards of Canadian vs. international medical schools (accreditation, curriculum, graduate preparedness, etc.)
• Growing domestic and international demand for UGME and PGME in Canada
• Ethical recruitment and treatment of IMGs

Evolving IMG-IEP Context
• Canadian Task Force on Licensure of IMGs - 2004– Increase capacity to assess IMGs– Work toward standardization– Expand/Develop programs to support IMGs– Develop capacity to track and recruit IMGs– Develop a national research agenda

Evolving IMG-IEP Context
• More recently:– Agreement on Internal Trade- Chapter 7- Labour
Mobility– Framework for Foreign Credential Recognition– National Regulatory Coordination
• Physician Credentials Repository of Canada• Application for Medical Registration in Canada
– National Assessment Collaboration

Data in an Evolving ContextPhysician to Population Ratio – Canada Vs. OECD Average

Data in an Evolving ContextPhysician to Population Ratio – Canada Vs. OECD Average
19941995
19961997
19981999
20002001
20022003
20042005
20062007
20082009
2010
0.0
0.5
1.0
1.5
2.0
2.5
3.0
3.5
CMGs + IMGs CMGs OECD average
Den
sity
Per
100
0 Po
pula
tion

Data in an Evolving ContextNumber of IMGs in the Active Physician Workforce, Canada, 1994-2008
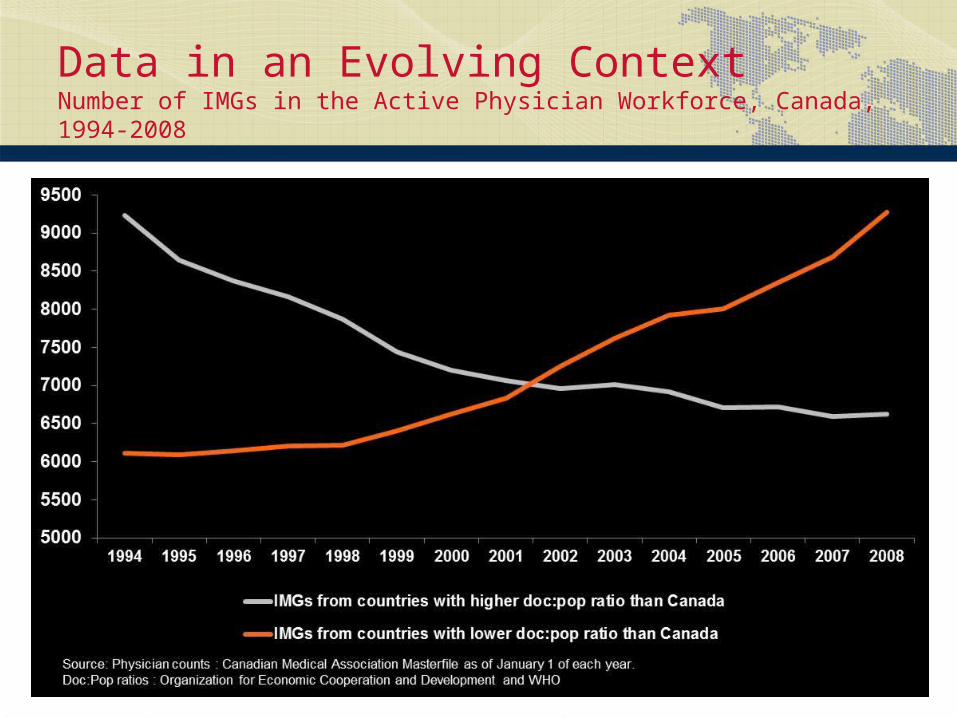
Data in an Evolving ContextNumber of IMGs in the Active Physician Workforce, Canada, 1994-2008

Data in an Evolving Context Increased MD Program Applicants Per 100K Population
19
80
/81
19
81
/82
19
82
/83
19
83
/84
19
84
/85
19
85
/86
19
86
/87
19
87
/88
19
88
/89
19
89
/90
19
90
/91
19
91
/92
19
92
/93
19
93
/94
19
94
/95
19
95
/96
19
96
/97
19
97
/98
19
98
/99
19
99
/20
00
20
00
/01
20
01
/02
20
02
/03
20
03
/04
20
04
/05
20
05
/06
20
06
/07
20
07
/08
20
08
/09
0
50
100
150
200
250
300
350
400
450
500
550
600
MD Program Applicants Per 100,000 Population Aged 20-24 Years, by Sex, Canada, 1980/81-2008/09
Male Female
Ap
pli
can
ts P
er 1
00K
Po
pu
lati
on
Ag
ed 2
0-24
Source: ORIS,AFMC, 2011.Note: Male and female applicant rates are expressed in relation to the male and female population.

Data in an Evolving Context Increased First Year MD Program Enrolment
00/01
01/02
02/03
03/04
04/05
05/06
06/07
07/08
08/09
09/10
10/11
0
250
500
750
1,000
1,250
1,500
1,750
2,000
2,250
2,500
2,750
3,000
1763
1921
2028
2096
2193
2380
2460
2569
2660
2742
2829
First Year MD Program Enrolment, Canada, 2000/01 - 2010/11
First Year Enrolment, up 60%Source: ORIS, AFMC, 2011

Data in an Evolving Context Increased Number of First Year Post-MD Trainees
Source: CAPER, AFMC, 2010. Note: Excludes visa trainees.
1471 1436 1447 1579 1640 1799 1894 1976 20882273 2419
77 138 197185
289259
360404
416
467426
0
500
1000
1500
2000
2500
3000
2000-01 2001-02 2002-03 2003-04 2004-05 2005-06 2006-07 2007-08 2008-09 2009-10 2010-11
Number of PGY1 Post-MD Trainees by Place of MD Graduation, Canada, 2000-01 to 2010-11
MD Outside Canada (up 453%) MD in Canada (up 64%)

Data in an Evolving Context Increased Number of Clinical Teachers
Family Medicine
Psychiatry
Internal Medicine
Paediatrics
General Surgery
Emergency Medicine
All Other Departments
0 500 1,000 1,500 2,000 2,500 3,000 3,500 4,000
3,498
617
573
440
357
245
2,875
Growth in the Number of Part-Time Faculty of Medicine Faculty Members, Canada, 2004/05 to 2008/09
Source: AFMC, ORIS, 2011.Note: Part-Time faculty includes paid and volunteer faculty members.

IMGs in Canada ProjectNational IMG Database

The IMGs in Canada Project: Brief History
• Key Task Force Recommendations (2004)– Develop capacity to track and recruit IMGs
– Develop a national research agenda
• Phase I: 2005-2009– Foundational activities
• Phase II: 2010-2013– Maintain, enhance, create, support
– User guided

National IMG DatabaseData Collection Framework
• Medical Council of Canada (MCC)
• 7 IMG assessment centres
• 17 Faculties of Medicine
• The College of Family Physicians of Canada (CFPC)
• The Royal College of Physicians and Surgeons of Canada (RCPSC)
• Collège des médecins du Québec (CMQ)
• 9 regulatory authorities

National IMG DatabaseCurrent Data Status – Exam, Training, Certifying Bodies
CMQ
RCPSC
CFPC
FOM
MCC
2005 2006 2007 2008 2009
2005-2009
2006-2009
2005-2009
2005-2009
2005-2009

National IMG DatabaseCurrent Data Status - Assessment Centres
British Columbia (IMG-BC)
Alberta (AIMGP)
Saskatchewan (CPL)
Manitoba (MLPIMG, CAPE)
Ontario (CEHPEA)
Nova Scotia (CAPP)
NF and Labrador (CSAT)
2005 2006 2007 2008 2009
2005-2009
2005-2009
2005-2009
2005-2009
2007-2009
2005-2009
2005-2009

National IMG DatabaseCurrent Data Status – Medical Regulatory Authorities
QuebecBritish Columbia
AlbertaSaskatchewan
ManitobaOntario
New BrunswickNova Scotia
NF and Labrador
2005 2006 2007 2008 2009
2005-2009
2005-2009
2005-2009
2005-2009
2005-2009
2005-2009
2005-2009
2007-2009
2005-2009

National IMG DatabaseCurrent Data Status – Missing MRAs
Non-participants:• Prince Edward Island• Health And Social
Services, Government of Northwest Territories
• Health And Social Services, Government of Nunavut
Aggregate Data:• Yukon Medical Council
as of Sept 1, 2010

Sample of Data Variables Collected
Requested Data Variables

IMGs in CanadaEmerging Picture from the National IMG Database

Cumulative Number of Distinct IMGs in the National IMG Database
2005 2006 2007 2008 2009 20100
5,000
10,000
15,000
20,000
25,000
30,000
7,607 11,937 15,971 19,340 22,722 27,093
Source: National IMG Database, 2011
Most are non-Citizens, writing the Evaluating Exam overseas and/or training in Canada under Visa status.

Number of IMGs who passed MCC Examinations, by Self-Reported Citizenship, 2005-2009
EE QEI QEII0
2000
4000
6000
8000
10000
12000
8306 4414 2890
2666
1622
1305
Source: IMG Database, 2010.Note: Citizenship is self-reported by IMGs and not necessarily source-verified.

Number of IMGs who passed MCC Examinations, by Birth Country, 2005-2009
EE QEI QEII0
2000
4000
6000
8000
10000
12000
9789 5452 3829
1183
584
366
Source: IMG Database, 2010

Number of IMG Assessments in Canada, 2005-2009
CSAT-NL
CAPP-NS
CEHPEA-ON
MLPIMG-M
B
CPL-SK
AIMGP-A
B
IMG-B
C0
200
400
600
800
1000
1200
1400
1600
74
189
1549
557
132
791
385
Source: National IMG Database, 2010

First Year Post-MD IMG Trainees
2005 2006 2007 2008 20090
100
200
300
400
500
600
259 360 404 416 467
159
129108 111
94
Canadian Citizen/Permanent ResidentVisa Trainee

Number of IMGs Certified by College of Family Physicians of Canada, Royal College of Physicians and Surgeons of Canada, College des Medecins du Quebec, 2006-2009
2006 2007 2008 20090
50
100
150
200
250
300
350
400
450
500
275251
326
258
375
417433 439
29 28 3243
CFPC RCPSC CMQ
Source: IMG Database, 2010

Number of IMGs Certified by College of Family Physicians of Canada, Royal College of Physicians and Surgeons of Canada, College des Medecins du Quebec, 2006-2009
2006 2007 2008 20090
50
100
150
200
250
171160
192185
109 110
136
155
24 25 2632
CFPC RCPSC CMQ
Source: IMG Database, 2010
Excluding Visa Trainees

Number of First-Time Licenses Issued to IMGs By Medical Regulatory Authorities, 2005-2009
CPSNL CPSNS (07-09)
CPSNB CMQ CPSO CPSM CPSS CPSA CPSBC0
100
200
300
400
500
600
700
128
3
166145
507
196
72100
160
299
107130
262
433
207
515
586
498
Full/Regular All Other
Source: IMG Database, 2010. Note: “All Other” includes provisional, temporary, academic, locum and other types of non-full licenses.

2005-2009
2005-2007
Post MD training
411
Assessment Centre
218
Certifying Body
97
Regulatory Authority
77
MCC EE1491
Following the Progress of a Cohort of Canadian Citizen IMGs
62
Source: IMG Database, 2010
2 35

Cohort Progress to Post-MD Training
Entry to Post-MD Training Gender Number Average Age
(years)
No Female 558 39.59Male 522 38.87
No Total 1080 39.24
Yes Female 185 36.52Male 226 35.57
Yes Total 411 36.00Grand Total 1491 38.35
Source: IMG Database, 2010

Cohort in Post-MD Training
Gender PostMD Total% of Gender
Group % of Total
Female
Family Medicine 97 52.4% 23.6%Laboratory 6 3.2% 1.5%Medicine 72 38.9% 17.5%Surgery 10 5.4% 2.4%
Female Total 185 100.0% 45.0%
Male
Family Medicine 98 43.4% 23.8%Laboratory 10 4.4% 2.4%Medicine 87 38.5% 21.2%Surgery 31 13.7% 7.5%
Male Total 226 100.0% 55.0%Grand Total 411 100.0%

Percent of Cohort Entering Post-MD Training, By Country of MD Graduation
Source: IMG Database, 2010.Note: Countries with >=10 IMGs in MCC EE 2005-2007 cohort.
Irela
nd
United K
ingdom
Austra
lia
Czech
Rep
ublic
Poland
South A
frica
Trinid
ad a
nd Tobag
o
Saint K
itts
and N
evis
Nether
lands
Antille
s
Ukrai
ne
Roman
ia
Domin
ican
Rep
ublicIn
dia
Isra
el
Alger
ia
Domin
ica
Grenad
a
Pakis
tan
Caym
an Is
lands
Iran
Russia
China
(PRC)
Bosnia
-Her
zegovi
na
Hungary
Philippin
es
Egypt
Bangla
desh
0%
10%
20%
30%
40%
50%
60%
70%

Percent of Cohort Entering Post-MD Training, By School of MD Graduation
0%
20%
40%
60%
80%
100%
Source: IMG Database, 2010.Note: Countries with >=10 IMGs in MCC EE 2005-2007 cohort.

Cohort With Full or Provisional License
Licensed (Full or Provisional)
77
Certification(CFPC/RCPSC/CMQ)
35 (46%)
QEII (Not Certified Yet)
23 (30%)
QEI (No Cert, No QEII Yet)
9 (12%)
No Cert, QEs, Assessment
10 (13%)
31 QEI & II
23 QEI7 Assessment
4 Assessment
? Provisional? Data Timeframe
? Missing Data
2 PGME
43/77 (56%) PGME

License Status by Field of Practice
Source: IMG Database, 2010.

Practice location at 2 and 5 years after PGME graduation, 2000-2004
2 years 5 years 2 years 5 years0%
20%
40%
60%
80%
100%
77.1 78.1
91.7 91.6
22.9 21.9
8.3 8.4
Outside CanadaIn Canada
IMG CMG
Source: CAPER Database, 2010

Distribution of Licensed IMGs in Urban/ Rural Canada
Large Urban Centres
Small Cities Towns Rural Places and Territories
0%
10%
20%
30%
40%
50%
60%
70%62.5%
4.8%
16.8% 15.9%
44.0%
5.4%
25.0% 25.6%
Full licenses All other licenses
Source: IMG Database, 2010.

Thank you
This project is funded by the Government of Canada's Foreign Credential Recognition Program.