data portraits
TRANSCRIPT
Data portraits
Judith Donath
Alex Dragulescu Aaron Zinman
Fernanda Viégas
Rebecca Xiong
Yannick Assogba
Academic Artist Researcher Researcher Entrepreneur Researcher
Harvard Berkman Center25 Everett StreetCambridge, MA 02138
1653 Andalusia WaySan Jose, CA 95125
MIT Media Lab75 Amherst StE14-548Cambridge, MA 02142
IBM Research1 Rogers WayCambridge, MA 02142
22 Chestnut St., Cambridge, MA 02139
23 Elm St Cambridge MA 02139
[email protected] [email protected] [email protected] [email protected]
[email protected] [email protected]
AbstractData portraits depict their subjects’ accumulated data rather than their faces. They can be visualizations of discussion contributions, browsing histories, social networks, travel patterns, etc. They are subjective renderings that mediate between the artist’s vision, the subject’s self-presentation and the audience’s interest. . Designed to evocatively depict an individual, a data portrait can be a decorative object or be used as an avatar, one’s information body for an online space.
Data portraits raise questions about privacy, control, aesthetics and social cognition. These questions become increasingly important as more of our interactions occur online, where we exist as data not bodies.
1. IntroductionWe live in an increasingly digital world. We work, shop and socialize online, and in the process we accumulate, often unknowingly, vast shadow bodies of data. Our online discussions are archived, our purchases tracked, our locations sensed and our educational and medical histories recorded. These data bodies extend in time, reaching into the past, charting the evolution of one’s ideas, career and style. By visualizing this data, we can create portraits of people that depict not the subject’s face, but a rendering of their words and actions.
Portraits have long used “data” in their depictions. In Renaissance paintings, richly rendered and highly symbolic garments and possessions portrayed social position (e.g. Hans Holbein’s The French Ambassadors); in contemporary work, the person may be evoked only through their personal possessions (e.g. Christian Boltanski’s Missing House). The data portraits in this paper depict a person through their digital archive.
Calling these representations “portraits” rather than “visualizations” shifts the way we think about them. A portrait is an evocative depiction, meant to convey something about the subject’s character or role in society. The term “portrait” also highlights the subjectivity of the representation. The goal of most data visualization is to be as objective as possible. With a portrait however, the artist’s personal style and interpretation are important aspects of the work [1].
A portrait involves negotiations between the subject and artist: the subject may wish to be portrayed in an ideal light, while the artist may want to show what they think the subject is really like. This tension, as well as the beliefs and conventions of the culture in which it is created, shape the portrait.
Creating data portraits raises many questions. Does the subject or artist controls what data should be included? What should such a representation look like? How can it be designed to make intuitive sense to the viewer?
2. Functions of data portraitsThe data body is not readily perceivable. Even if you can see, for instance, all the comments that someone has made in an ongoing discussion, this unwieldy archive does not easily provide you with a clear picture of their role in the community. You would need to spend hours of poring through transcripts, piecing an impression together through scattered remarks. Visualization reifies and condenses this data into something we can easily perceive. A graphical representation can compactly embody a tremendous amount of information, making it possible to see years of activity in a single glance.
One use for data portraits is in online communities where difficulty in forming impressions of people is often a problem [2]. .AuthorLines for example, portrays an individual in terms of their posting and response pattern in a discussion group [3],. Data portraits such as this can help members of a community keep track of who are the other participants, showing the roles they play and creating a concise representation of the things they have said and done. Here, the portraits act as proxies for the subjects, affecting how others in the community act towards them.
Data portraits may reveal information about us, but they can also help us control it. They can function as mirrors, showing us the patterns in our data. Today, increasing amounts of information, including health records, purchases, travel patterns, etc. are being kept about us, but we have little sense of what it says about ourselves. The “data mirror”, a portrait designed to be seen only by the subject, is a tool for self-understanding. Like a physical mirror it lets you assess your appearance -- and may be a catalyst for changing it.
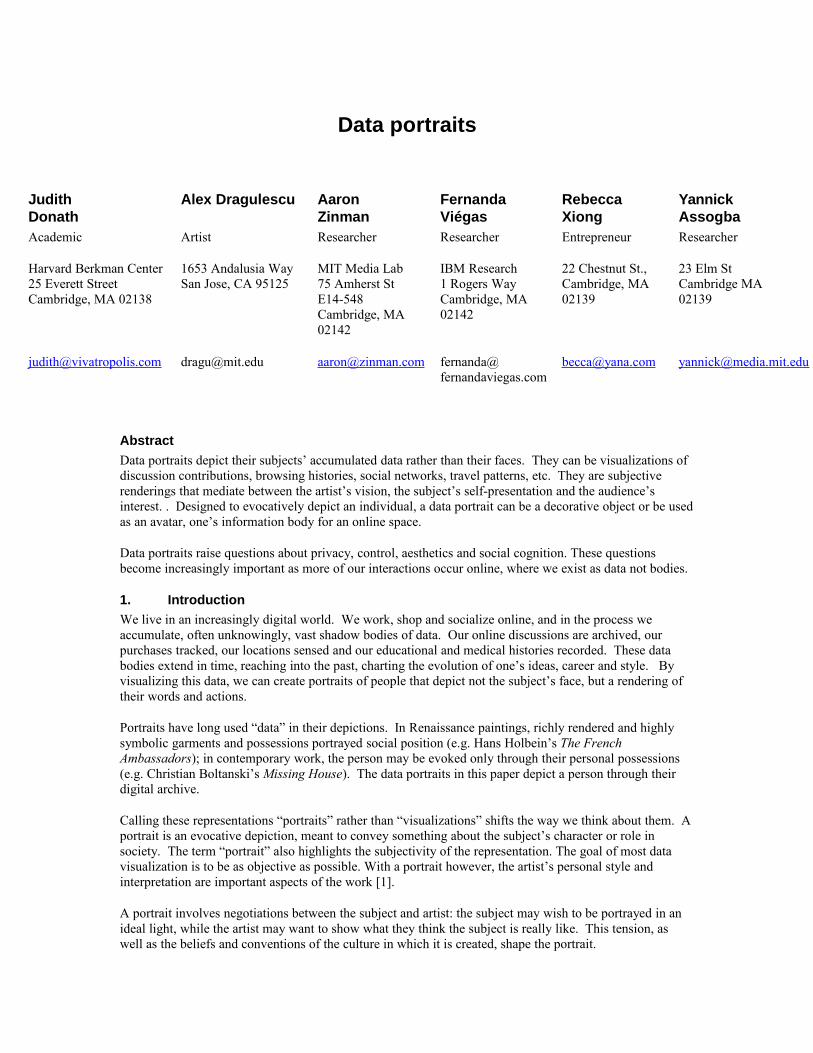
Themail [4] uses email correspondence to portray its subject’s changing relationship with another person. It highlights words they use more frequently with each other than is typical in the subject’s other correspondence and in general English usage. Themail was originally created to be a personal data-mirror – a visualization one would use to make sense of one’s own correspondence. But the users liked to publicly display the images. These visualizations function as portraits of a relationship, and displaying them is akin to the way people display pictures of themselves with friends and family. Here the portrait functions both as data-mirror (a tool to help someone make sense of a vast trove of personal data) and as decorative object imbued with personal meaning
Fig. 1. Themail
As artistic works, data portraits can, like traditional portraits, be decorative objects commemorating the subject’s social status and affiliations. They can also function as social critiques, highlighting the loss of privacy and control in world of increasingly ubiquitous surveillance. While data portraits may look very
different than traditional facial portraits, their uses echo the role of portraiture throughout history: as works of art, biographies, proxies, and evidence [5].
3. Visual designData portraits come in all forms. Some look very much like statistical graphs; others are more figurative. With faces, we are neurologically wired and social trained to infer meaning from structure and expression. Data does not have this inherent legibility; making data portraits meaningful is a key challenge.
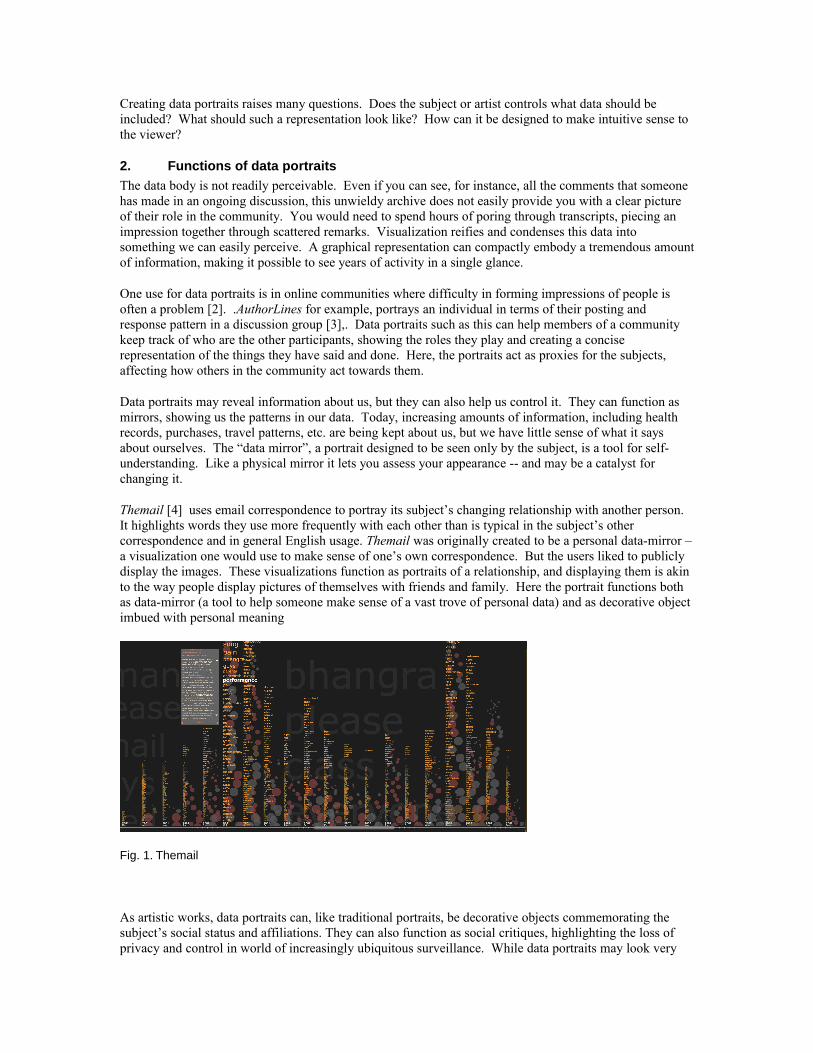
The form of the portrait is itself part of the message-bearing content. Statistical graphs appear authoritative and objective. Author Lines, for instance, uses bubble graphs, a form usually associated with financial reports. For all the starkness of its graphics, it is a very expressive group portrait. Carefully chosen statistics let the audience see the different roles individuals play within the group. However, without knowing what the data is, one would never guess that it represented people rather than, say, mortgage failure rates or gross national product.
Fig. 2. AuthorLines
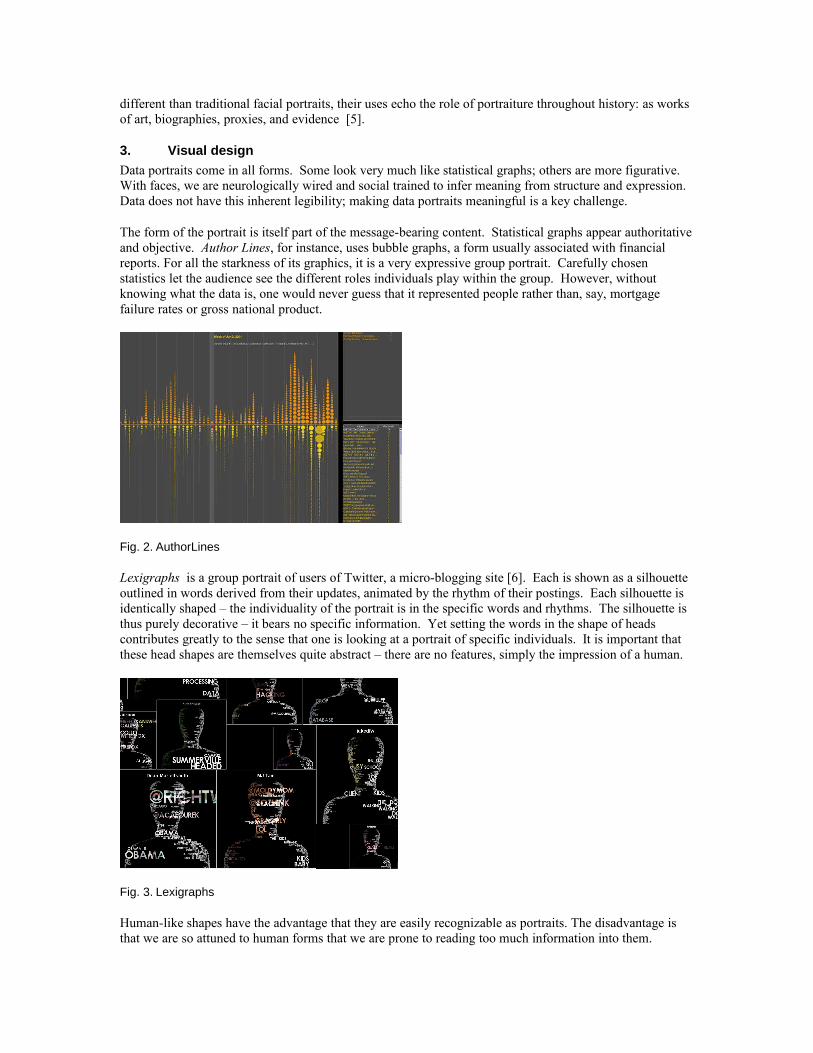
Lexigraphs is a group portrait of users of Twitter, a micro-blogging site [6]. Each is shown as a silhouette outlined in words derived from their updates, animated by the rhythm of their postings. Each silhouette is identically shaped – the individuality of the portrait is in the specific words and rhythms. The silhouette is thus purely decorative – it bears no specific information. Yet setting the words in the shape of heads contributes greatly to the sense that one is looking at a portrait of specific individuals. It is important that these head shapes are themselves quite abstract – there are no features, simply the impression of a human.
Fig. 3. Lexigraphs
Human-like shapes have the advantage that they are easily recognizable as portraits. The disadvantage is that we are so attuned to human forms that we are prone to reading too much information into them.
Anything face-like is perceived as a face, often with gender and expression, even if made from cloud shapes or moon craters. In making data-portraits that reference the human form we need to be careful not to create an inadvertent picture of a person.
The meaning of a portrait is the impression it evokes of its subject. Traditional portraits use the familiar language of facial structure and expression – we read the image as we would read a face seen in person. Abstract data portraits do not have this everyday familiarity. When one is creating a visualization to be used for statistical analysis, it is reasonable to require the audience to read the axis and study the data. But for a portrait, the meaning – the impression it creates of its subject – needs to be more immediately and intuitively accessible. Three key ways of doing so are to incorporate text, use metaphor, and create multiples.
Incorporating text: Many data portraits are based on their subjects’ texts, and incorporating some of these words into the portrait provides immediate context and detail. The key is in choosing the most evocative ones. Several portrait discussed here (e.g. Themail, Lexigraphs) analyze word usage to find ones the subjects use with unusual frequency. The technique is similar to that of creating a caricature: one finds the norm and highlights the ways that the subject deviates from it [7].
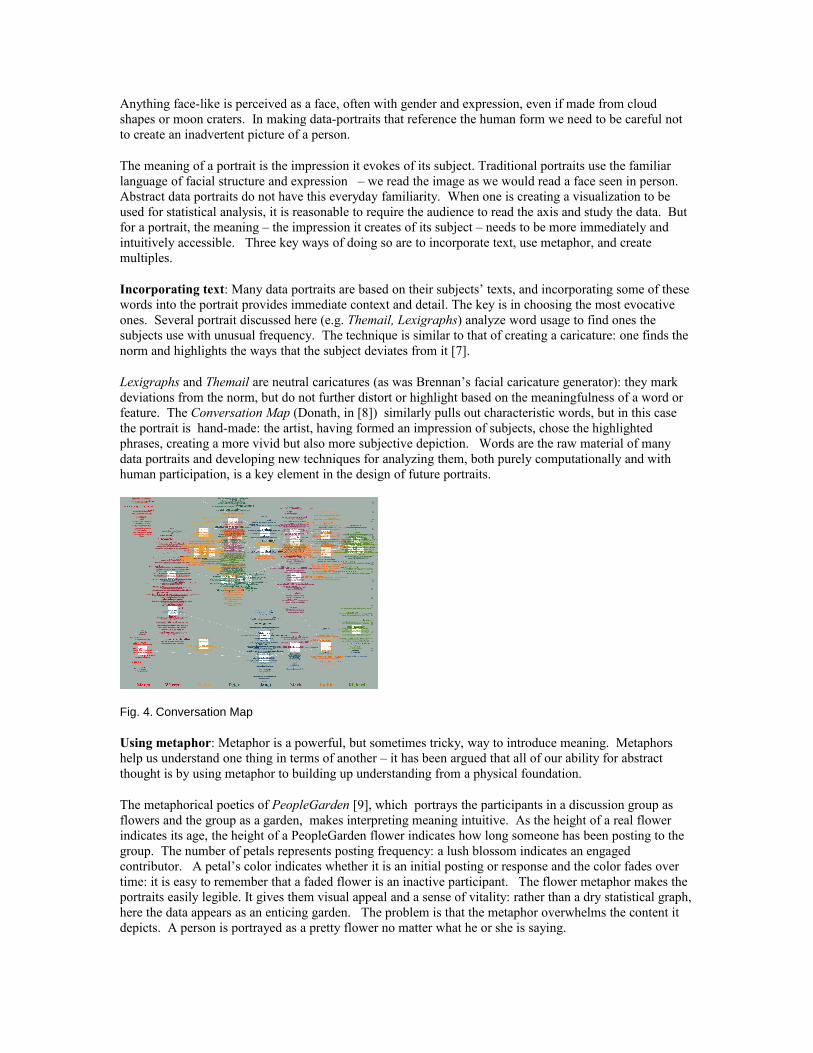
Lexigraphs and Themail are neutral caricatures (as was Brennan’s facial caricature generator): they mark deviations from the norm, but do not further distort or highlight based on the meaningfulness of a word or feature. The Conversation Map (Donath, in [8]) similarly pulls out characteristic words, but in this case the portrait is hand-made: the artist, having formed an impression of subjects, chose the highlighted phrases, creating a more vivid but also more subjective depiction. Words are the raw material of many data portraits and developing new techniques for analyzing them, both purely computationally and with human participation, is a key element in the design of future portraits.
Fig. 4. Conversation Map
Using metaphor: Metaphor is a powerful, but sometimes tricky, way to introduce meaning. Metaphors help us understand one thing in terms of another – it has been argued that all of our ability for abstract thought is by using metaphor to building up understanding from a physical foundation.
The metaphorical poetics of PeopleGarden [9], which portrays the participants in a discussion group as flowers and the group as a garden, makes interpreting meaning intuitive. As the height of a real flower indicates its age, the height of a PeopleGarden flower indicates how long someone has been posting to the group. The number of petals represents posting frequency: a lush blossom indicates an engaged contributor. A petal’s color indicates whether it is an initial posting or response and the color fades over time: it is easy to remember that a faded flower is an inactive participant. The flower metaphor makes the portraits easily legible. It gives them visual appeal and a sense of vitality: rather than a dry statistical graph, here the data appears as an enticing garden. The problem is that the metaphor overwhelms the content it depicts. A person is portrayed as a pretty flower no matter what he or she is saying.

h
Fig. 5. PeopleGarden
The challenge in using metaphor is to abstract sufficiently from the source. Much of the legibility of these portrayals could be preserved in a less literal representation, with growth and height indicating age, brightness and fading showing recent presence, denseness of detail indicating activity – meanings drawn from, but not literally depicted as, our familiarity with natural forms.
Creating multiples: Most data portraits are created in a series; the creativity is in the algorithm creation, which can be applied to numerous subjects. This also helps make these abstract depictions legible, for it is primarily in the context of other portraits made in the same fashion - by comparing them to each other - that one can understand the nuances and vocabulary of the portrait’s design. Lexigraphs, for instance, shows a group of Twitter users, portraying each with salient words from their current and past updates. It animates with the rhythm of each user’s postings. While one would get some sense of a person seeing only their portrait, it is only upon seeing the whole group that one can judge whether the person is prolific or personal etc. in their postings, for one needs a community to compare with.
4. The automated artistData portraits can be individually created, with the artist active in the depiction of each subject (e.g. Conversation Map). But many are created algorithmically. The artist designs a program for making portraits, rather than the portraits themselves. There are several steps- mining for data, analyzing it and then depicting it – all of which involve creative choices. But it is still an automated process – a final stage, perhaps, in the increasing mechanization of portraiture.
The traditional painted portrait is made by hand, the artist consciously shaping each brush stroke. The advent of photography changed the artist’s relationship with the work’s creation: the artist’s eye and intention remained actively involved, but creating the image itself became the job of a machine. Data portraits automate the process even further, raising questions about the artist’s role in their creation and about the source of meaning and artistic interpretation in these works.
The algorithmic artist expresses a vision for society by choosing what patterns to highlight and how to depict them. PeopleGarden depicts active participation positively; by using a different algorithm, the artist could commend the use of first person pronouns, or supportive affect. Lexigraphs maintains a neutral stance about its subjects’ words; by using color to highlight angry words or to separate political positions, the artist could create a more pointed depiction of the community.
4.1. Objective/subjective/accurate
In the world of information visualization, the goal is to depict the data as objectively as possible. This is the opposite of art, where the artist’s subjective vision is central. Data portraits sit between these extremes: their techniques come from the world of statistical analysis, but their purpose is artistic. Some may be closer to one extreme or the other – neither is “right”, but understanding where a particular portrait falls in this subjectivity continuum is a key element in understanding its function.
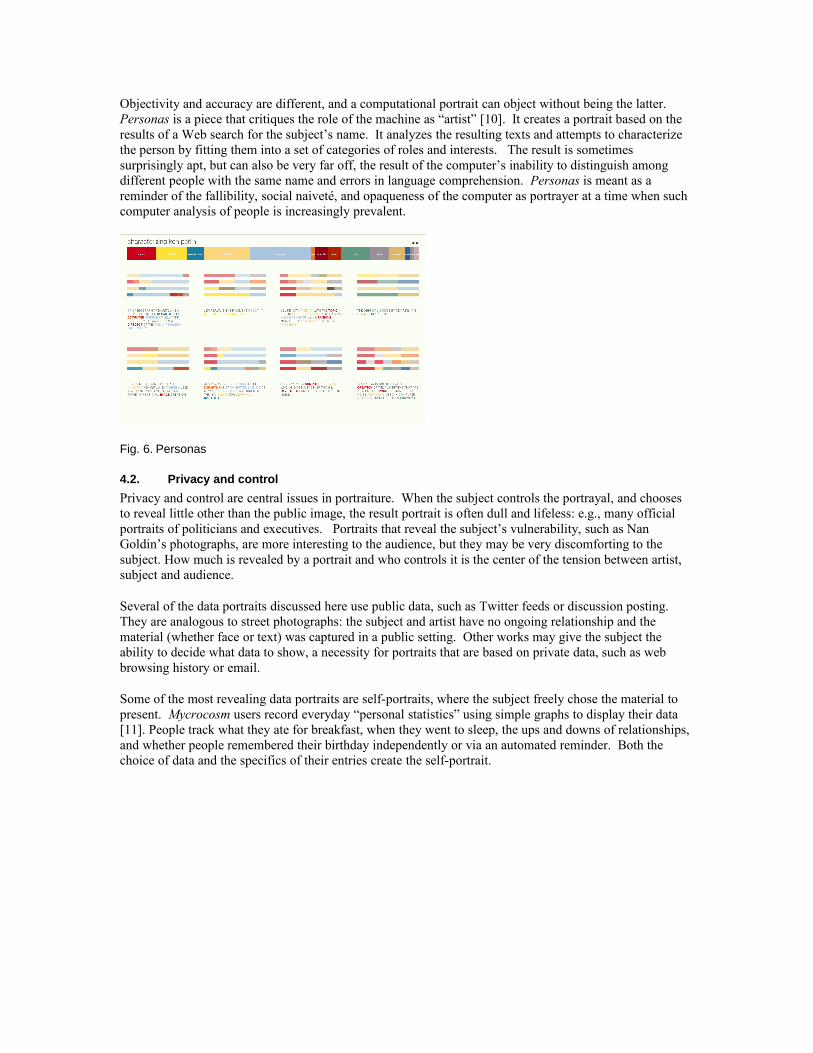
Objectivity and accuracy are different, and a computational portrait can object without being the latter. Personas is a piece that critiques the role of the machine as “artist” [10]. It creates a portrait based on the results of a Web search for the subject’s name. It analyzes the resulting texts and attempts to characterize the person by fitting them into a set of categories of roles and interests. The result is sometimes surprisingly apt, but can also be very far off, the result of the computer’s inability to distinguish among different people with the same name and errors in language comprehension. Personas is meant as a reminder of the fallibility, social naiveté, and opaqueness of the computer as portrayer at a time when such computer analysis of people is increasingly prevalent.
Fig. 6. Personas
4.2. Privacy and control
Privacy and control are central issues in portraiture. When the subject controls the portrayal, and chooses to reveal little other than the public image, the result portrait is often dull and lifeless: e.g., many official portraits of politicians and executives. Portraits that reveal the subject’s vulnerability, such as Nan Goldin’s photographs, are more interesting to the audience, but they may be very discomforting to the subject. How much is revealed by a portrait and who controls it is the center of the tension between artist, subject and audience.
Several of the data portraits discussed here use public data, such as Twitter feeds or discussion posting. They are analogous to street photographs: the subject and artist have no ongoing relationship and the material (whether face or text) was captured in a public setting. Other works may give the subject the ability to decide what data to show, a necessity for portraits that are based on private data, such as web browsing history or email.
Some of the most revealing data portraits are self-portraits, where the subject freely chose the material to present. Mycrocosm users record everyday “personal statistics” using simple graphs to display their data [11]. People track what they ate for breakfast, when they went to sleep, the ups and downs of relationships, and whether people remembered their birthday independently or via an automated reminder. Both the choice of data and the specifics of their entries create the self-portrait.
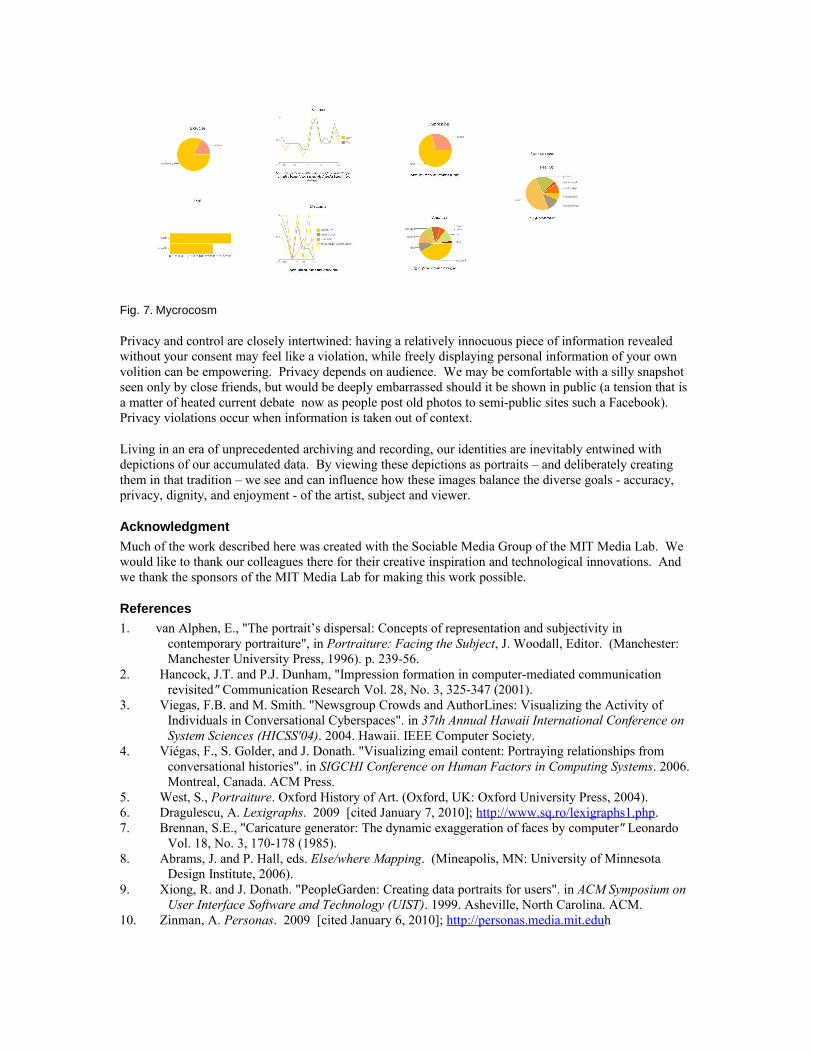
Fig. 7. Mycrocosm
Privacy and control are closely intertwined: having a relatively innocuous piece of information revealed without your consent may feel like a violation, while freely displaying personal information of your own volition can be empowering. Privacy depends on audience. We may be comfortable with a silly snapshot seen only by close friends, but would be deeply embarrassed should it be shown in public (a tension that is a matter of heated current debate now as people post old photos to semi-public sites such a Facebook). Privacy violations occur when information is taken out of context.
Living in an era of unprecedented archiving and recording, our identities are inevitably entwined with depictions of our accumulated data. By viewing these depictions as portraits – and deliberately creating them in that tradition – we see and can influence how these images balance the diverse goals - accuracy, privacy, dignity, and enjoyment - of the artist, subject and viewer.
Acknowledgment Much of the work described here was created with the Sociable Media Group of the MIT Media Lab. We would like to thank our colleagues there for their creative inspiration and technological innovations. And we thank the sponsors of the MIT Media Lab for making this work possible.
References1. van Alphen, E., "The portrait’s dispersal: Concepts of representation and subjectivity in
contemporary portraiture", in Portraiture: Facing the Subject, J. Woodall, Editor. (Manchester: Manchester University Press, 1996). p. 239-56.
2. Hancock, J.T. and P.J. Dunham, "Impression formation in computer-mediated communication revisited" Communication Research Vol. 28, No. 3, 325-347 (2001).
3. Viegas, F.B. and M. Smith. "Newsgroup Crowds and AuthorLines: Visualizing the Activity of Individuals in Conversational Cyberspaces". in 37th Annual Hawaii International Conference on System Sciences (HICSS'04). 2004. Hawaii. IEEE Computer Society.
4. Viégas, F., S. Golder, and J. Donath. "Visualizing email content: Portraying relationships from conversational histories". in SIGCHI Conference on Human Factors in Computing Systems. 2006. Montreal, Canada. ACM Press.
5. West, S., Portraiture. Oxford History of Art. (Oxford, UK: Oxford University Press, 2004).6. Dragulescu, A. Lexigraphs. 2009 [cited January 7, 2010]; http://www.sq.ro/lexigraphs1.php.7. Brennan, S.E., "Caricature generator: The dynamic exaggeration of faces by computer" Leonardo
Vol. 18, No. 3, 170-178 (1985).8. Abrams, J. and P. Hall, eds. Else/where Mapping. (Mineapolis, MN: University of Minnesota
Design Institute, 2006).9. Xiong, R. and J. Donath. "PeopleGarden: Creating data portraits for users". in ACM Symposium on
User Interface Software and Technology (UIST). 1999. Asheville, North Carolina. ACM.10. Zinman, A. Personas. 2009 [cited January 6, 2010]; http://personas.media.mit.eduh

11. Assogba, Y. and J. Donath. "Mycrocosm: Visual microblogging". in 42nd Hawaii International Conference on System Sciences. 2009. Big Island, Hawaii.
Figure 1 Themail (2005) Fernanda Viégas, Scott Golder, Judith DonathFigure 2. Authorlines (2003) Fernanda Viégas and Marc SmithFigure 3 Lexigraphs I (2009) Alex Dragulescu and Judith DonathFigure 4 Conversation Map (2005) Judith DonathFigure 5 PeopleGarden (1999) Rebecca Xiong and Judith Donath,Figure 6 Personas (2009) Aaron Zinman and Judith Donath, Figure 7. Mycrocosm (2009) Yannick Assogba and Judith Donath,