data representation and interpretation: year 9 · data representation and interpretation: year 9 |...
TRANSCRIPT

Data representation and interpretation: Year 9
MATHEMATICS CONCEPTUAL NARRATIVELeading Learning: Making the Australian Curriculum work for us
by bringing CONTENT and PROFICIENCIES together
www.acleadersresource.sa.edu.au
ContentsWhat the Australian Curriculum says about ‘Data representation and interpretation’ 3Content descriptions, year level descriptions, achievement standards and numeracy continuum
Working with Data representation and interpretation 4Important things to notice about this sub-strand of the Australian Curriculum: Mathematics and numeracy continuum
Engaging learners 6Classroom techniques for teaching Data representation and interpretation
From tell to ask 7Transforming tasks by modelling the construction of knowledge (Examples 1–11)
Proficiency: Problem-solving 21Proficiency emphasis and what questions to ask to activate it in your students (Examples 12–14)
Connections between ‘Data representation and interpretation’ and other maths content 28A summary of connections made in this resource
‘Data representation and interpretation’ from Foundation to Year 10A 29
Resources 31
Data representation and interpretation: Year 9 | MATHEMATICS CONCEPTUAL NARRATIVE2
Res
ourc
e ke
y
The ‘AC’ icon indicates the Australian Curriculum: Mathematics content description(s) addressed in that example.
The ‘From tell to ask’ icon indicates a statement that explains the transformation that is intended by using the task in that example.More information about ‘Transforming Tasks’: http://www.acleadersresource.sa.edu.au/index.php?page= into_the_classroom
Look out for the purple pedagogy boxes, that link back to the SA TfEL Framework.
The ‘Bringing it to Life (BitL)’ tool icon indicates the use of questions from the Leading Learning: Making the Australian Curriculum Work for Us resource.
Bringing it to Life (BitL) key questions are in bold orange text.
Sub-questions from the BitL tool are in green medium italics – these questions are for teachers to use directly with students.More information about the ‘Bringing it to Life’ tool: http://www.acleadersresource.sa.edu.au/index.php?page= bringing_it_to_life
◆ ◆ ◆ ◆Throughout this narrative—and summarised in ‘Data representation and interpretation’ from Foundation to Year 10A (see page 29)—we have colour coded the AC: Mathematics year level content descriptions to highlight the following curriculum aspects of working with Data representation and interpretation:
◆ Posing a question
◆ Collecting and organising data
◆ Summarise and represent data
◆ Interpretation and inference.
Socratic questioning
Student voice
Explore before explain
Use dialogue
From tell to ask
Data representation and interpretation: Year 9 | MATHEMATICS CONCEPTUAL NARRATIVE 3
Content descriptionsStrand | Statistics and probability.
Sub-strand | Data representation and interpretation.
Year 9 ◆ ◆ | ACMSP228 Students identify everyday questions and issues involving at least one numerical and at least one categorical variable, and collect data directly and from secondary sources.
Year 9 ◆ | ACMSP282 Students construct back-to-back stem-and-leaf plots and histograms and describe data, using terms including ‘skewed’, ‘symmetric’ and ‘bimodal’.
Year 9 ◆ ◆ | ACMSP283 Students compare data displays using mean, median and range to describe and interpret numerical data sets in terms of location (centre) and spread.
Year level descriptionsYear 9 ◆ ◆ | Students collect data from secondary sources to investigate an issue.
Year 9 ◆ | Students evaluate media reports and use statistical knowledge to clarify situations.
Achievement standardsYear 9 ◆ ◆ | Students compare techniques for collecting data in primary and secondary sources.
Year 9 ◆ ◆ | Students make sense of the position of the mean and median in skewed, symmetric and bimodal displays to describe and interpret data.
Year 9 ◆ | Students construct histograms and back-to-back stem-and-leaf plots.
Numeracy continuumInterpreting statistical information
End of Year 10 ◆ | Students evaluate media statistics and trends by linking claims to data displays, statistics and representative data (Interpreting statistical information: Interpret data displays).
What the Australian Curriculum says about ‘Data representation and interpretation’
Source: ACARA, Australian Curriculum: Mathematics
Working with Data representation and interpretationImportant things to notice about this sub-strand of the Australian Curriculum: Mathematics and numeracy continuum
What we are building on and leading towards in Year 9 ‘Data representation and interpretation’Through Foundation to Year 10A, students identify questions, collect, represent and interpret data using increasingly sophisticated methods.
In Year 7 students construct graphs including stem-and-leaf plots. Students investigate issues about the collection of data and they calculate mean, median, mode and range for interpreting data.
In Year 8 students explore the practicalities of different techniques for data collection such as census, sampling and observation, and the variation in random samples from the same population.
In Year 9 students identify an issue where they need to collect both categorical and numerical data directly or from secondary sources. They graph back-to-back stem-and-leaf plots and histograms, and use mean, median and range to compare them. They also calculate these values from histograms, stem-and-leaf diagrams or dot plots.
In Year 10/10A students use terminology, including the terms ‘quartile’ and ‘interquartile range’, they then use these measures to enable them to create box plots. Students compare data that has been represented in the different forms that they have become familiar with in the last couple of years, for example, comparing the shapes of a box plot to its corresponding histogram. Students develop approaches to investigate relationships between two numerical variables over time. Students in Year 10 apply their understanding of statistics to evaluate statistical reports found in the media. In 10A standard deviation is used as a measure of spread and students use mean and standard deviation to compare data sets. Students also investigate techniques for establishing the ‘line of best fit’ when using digital technologies to investigate bivariate data sets.
• Why do we conduct statistical investigations? In any context where there is variation, people seek to measure, represent and describe the variations. This can help us to predict changes, or to use the knowledge to control things like global warming, extinction of animal species, or the spread of disease. Statistical investigations can be used to improve performance in sport, develop medical treatments, improve profits and plan for the future.
• Statistics can also be used to deceive, or persuade us, through advertising scamming. We need to be critical users and consumers of statistics, so we can use it to improve our decision making.
• Statistical investigations help us gain a better understanding of an observed variation. It involves a series of important processes:
– posing a question – collecting and organising data – summarising and representing data – interpreting the results – drawing inferences based on the evidence. We give students a lot of opportunity to practise
summarising (finding mean, medians, mode and range) and representing data (drawing a graph), but not always in a meaningful context. Sometimes we ask them to collect their own data (eg the number of cars that go past the school), but we have to ask, ‘Who would be interested in this information?’ It might be a meaningful exercise if the school were approaching the
council to have a school crossing placed out the front. Often as teachers, we see that it important to tell students when a task ‘might’ be meaningful, but it is far more powerful to do a task that ‘is’ important to them.
• Statistical investigations as a tool, supporting inquiry-based learning. Students should be posing questions that they would like to know the answer to, conducting their own investigations and generating a new understanding based on the evidence they collected.
Students can collect data to: – make generalisations to develop their own rules
in algebra and patterning, derive formulae in measurement, or discover properties in shape.
– support a lot of exploration in chance, as students investigate the outcomes when conducting experiments and compare them to theoretical probabilities (see the Chance: Year 9 narrative).
– apply their knowledge of statistics in sport, science, history and English to provide evidence to support arguments in their persuasive writing.
Statistics engages students when they are posing questions that interest them and are relevant to their lives. It is a valuable tool to help them make decisions and reasonable choices. They generate their own new knowledge and understanding, based on evidence from the data they have collected.
Data representation and interpretation: Year 9 | MATHEMATICS CONCEPTUAL NARRATIVE4

Data representation and interpretation: Year 9 | MATHEMATICS CONCEPTUAL NARRATIVE 5
• Year9studentsarerequiredtoinvestigatethefeaturesof continuous data across categories:– Graphical comparisons must be made across
the same scale. Using back-to-back stem-and-leaf plots and side-by-side histograms is a way of achieving this. Show students graphs for comparisons that do not have the same scale and ask them to compare their first impression with information they get from closer, more critical reading.
– Not all standardised measures are useful for all contexts (mean, median, mode). Expect students to justify their choice to use a mean, or a median, etc for comparison. Encourage them to devise a non-standardised measure to suit the context (compare the number of times the soccer team scored over 3 goals, as this is considered a good team performance).
– Students should comment on the shape and spread of data using statistical language (eg skewed or symmetrical, bimodal and range) and also clearly explain what significance these features have in the context of the question (the team has more high scores (positively skewed) but performs inconsistently (large range), etc.) Students need to understand what these measures mean for the data and be able to draw inferences to answer the questions they posed.
• Experimentaldataisanaturalcontextforthesecomparisons and engages students with investigations that interest and relate to themselves. Statistical investigations relating to school students can be accessed from the Australian Mathematical Sciences Institute (AMSI) at http://schools.amsi.org.au/times-modules/.
Data representation and interpretation: Year 9 | MATHEMATICS CONCEPTUAL NARRATIVE6
Statistics engage students when they are posing questions that interest them and are relevant to their lives. It is a valuable tool to help them make decisions and reasonable choices. They generate their own new knowledge and understanding based on evidence from the data they have collected.
Statistical investigationStatistical investigation is an important real-life human endeavour and students should appreciate and experience this. Where there is variation, we seek to measure, represent and describe the variations. This helps us to predict changes, or to use this knowledge to control things like global warming, extinction of animal species, or the spread of disease.
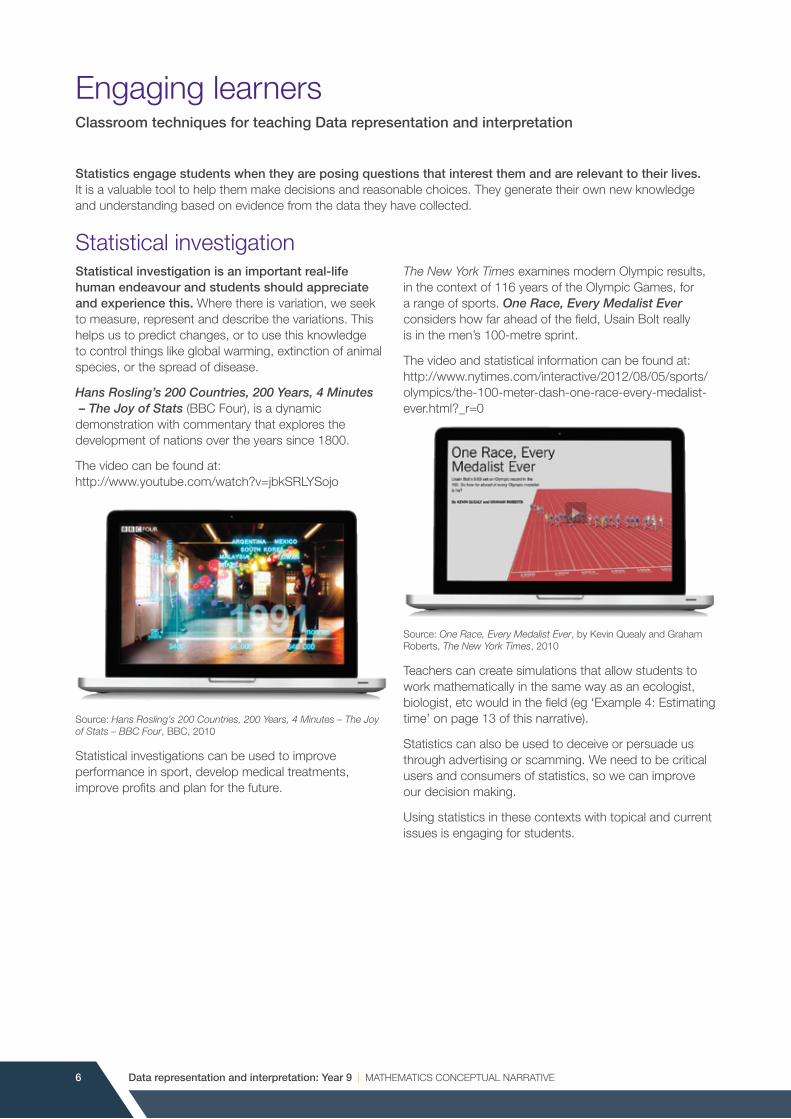
Hans Rosling’s 200 Countries, 200 Years, 4 Minutes – The Joy of Stats (BBC Four), is a dynamic demonstration with commentary that explores the development of nations over the years since 1800.
The video can be found at: http://www.youtube.com/watch?v=jbkSRLYSojo
Source: Hans Rosling’s 200 Countries, 200 Years, 4 Minutes – The Joy of Stats – BBC Four, BBC, 2010
Statistical investigations can be used to improve performance in sport, develop medical treatments, improve profits and plan for the future.
The New York Times examines modern Olympic results, in the context of 116 years of the Olympic Games, for a range of sports. One Race, Every Medalist Ever considers how far ahead of the field, Usain Bolt really is in the men’s 100-metre sprint.
The video and statistical information can be found at: http://www.nytimes.com/interactive/2012/08/05/sports/olympics/the-100-meter-dash-one-race-every-medalist-ever.html?_r=0
Source: One Race, Every Medalist Ever, by Kevin Quealy and Graham Roberts, The New York Times, 2010
Teachers can create simulations that allow students to work mathematically in the same way as an ecologist, biologist, etc would in the field (eg ‘Example 4: Estimating time’ on page 13 of this narrative).
Statistics can also be used to deceive or persuade us through advertising or scamming. We need to be critical users and consumers of statistics, so we can improve our decision making.
Using statistics in these contexts with topical and current issues is engaging for students.
Engaging learnersClassroom techniques for teaching Data representation and interpretation
Socratic questioning
Student voice
Explore before explain
Use dialogue
From tell to ask
From tell to askTransforming tasks by modelling the construction of knowledge (Examples 1–11)
The idea that education must be about more than transmission of information that is appropriately recalled and applied, is no longer a matter for discussion. We know that in order to engage our students and to support them to develop the skills required for success in their life and work, we can no longer rely on a ‘stand and deliver’ model of education. It has long been accepted that education through transmission of information has not worked for many of our students. Having said this, our classrooms do not necessarily need to change beyond recognition. One simple, but highly effective strategy for innovation in our classrooms involves asking ourselves the question:
What information do I need to tell my students and what could I challenge and support them to develop an understanding of for themselves?
For example, no amount of reasoning will lead my students to create the name ‘mean’ or ‘histogram’ for themselves. They need to receive this information in some way. However, it is possible for students to be challenged to identify their own question about something of interest and design their own investigation to answer it, so we don’t need to design and instruct the details of the investigation for them.
When we are feeling ‘time poor’ it’s tempting to believe that it will be quicker to fully design a statistical investigation, or set tasks, that we want students to experience rather than ask a question (or series of questions) and support them to planning the stages of the investigation for themselves. Whether this is true or not really depends on what we have established as our goal. If our goal is to have students use a specific set the skills, knowledge and procedures during the current unit of work, then it probably is quicker to tell them what to do. However, when our goal extends to wanting students to develop conceptual understanding, to learn to think mathematically, to have a self-concept as a confident and competent creator and user of mathematics, then telling students the formulae is a false economy of time.
On the other hand, we could start with a problem and support students in the design of an investigation, to explore a question that interests them. They will still practise skills and procedures, but in an authentic context while they are engaged in a problem that has some meaning for them, with the opportunity to think and work mathematically. Telling students how to conduct a statistical investigation removes a natural opportunity for students to create their own knowledge. When students plan and conduct their own investigation, they are in a much better position to analyse results and report on findings. This is the part of the process that students find most difficult.
Curriculum and pedagogy linksThe following icons are used in each example:
The ‘AC’ icon indicates the Australian Curriculum: Mathematics content description(s) addressed in that example.
The ‘Bringing it to Life (BitL)’ tool icon indicates the use of questions from the Leading Learning: Making the Australian Curriculum Work for Us resource.The Bringing it to Life tool is a questioning tool that supports teachers to enact the AC: Mathematics Proficiencies: http://www.acleadersresource.sa.edu.au/index.php?page=bringing_it_to_life
The ‘From tell to ask’ icon indicates a statement that explains the transformation that is intended by using the task in that example.This idea of moving ‘From tell to ask’ is further elaborated (for Mathematics and other Australian Curriculum learning areas) in the ‘Transforming Tasks’ module on the Leading Learning: Making the Australian Curriculum work for Us resource: http://www.acleadersresource.sa.edu.au/index.php?page=into_the_classroom
Look out for the purple pedagogy boxes, that link back to the SA TfEL Framework.
Data representation and interpretation: Year 9 | MATHEMATICS CONCEPTUAL NARRATIVE 7
Data representation and interpretation: Year 9 | MATHEMATICS CONCEPTUAL NARRATIVE8
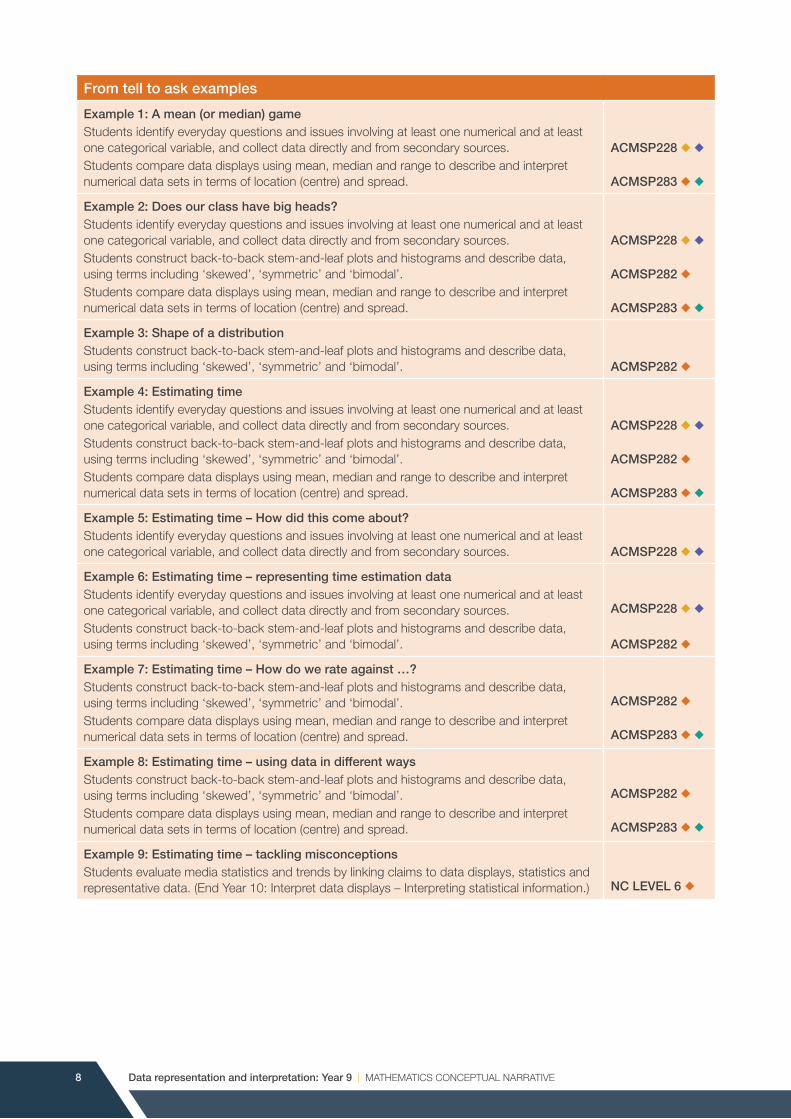
From tell to ask examples
Example 1: A mean (or median) gameStudents identify everyday questions and issues involving at least one numerical and at least one categorical variable, and collect data directly and from secondary sources. Students compare data displays using mean, median and range to describe and interpret numerical data sets in terms of location (centre) and spread.
ACMSP228 ◆ ◆
ACMSP283 ◆ ◆
Example 2: Does our class have big heads?Students identify everyday questions and issues involving at least one numerical and at least one categorical variable, and collect data directly and from secondary sources. Students construct back-to-back stem-and-leaf plots and histograms and describe data, using terms including ‘skewed’, ‘symmetric’ and ‘bimodal’. Students compare data displays using mean, median and range to describe and interpret numerical data sets in terms of location (centre) and spread.
ACMSP228 ◆ ◆
ACMSP282 ◆ ACMSP283 ◆ ◆
Example 3: Shape of a distributionStudents construct back-to-back stem-and-leaf plots and histograms and describe data, using terms including ‘skewed’, ‘symmetric’ and ‘bimodal’.
ACMSP282 ◆
Example 4: Estimating timeStudents identify everyday questions and issues involving at least one numerical and at least one categorical variable, and collect data directly and from secondary sources.Students construct back-to-back stem-and-leaf plots and histograms and describe data, using terms including ‘skewed’, ‘symmetric’ and ‘bimodal’.Students compare data displays using mean, median and range to describe and interpret numerical data sets in terms of location (centre) and spread.
ACMSP228 ◆ ◆
ACMSP282 ◆
ACMSP283 ◆ ◆
Example 5: Estimating time – How did this come about?Students identify everyday questions and issues involving at least one numerical and at least one categorical variable, and collect data directly and from secondary sources.
ACMSP228 ◆ ◆
Example 6: Estimating time – representing time estimation dataStudents identify everyday questions and issues involving at least one numerical and at least one categorical variable, and collect data directly and from secondary sources. Students construct back-to-back stem-and-leaf plots and histograms and describe data, using terms including ‘skewed’, ‘symmetric’ and ‘bimodal’.
ACMSP228 ◆ ◆
ACMSP282 ◆
Example 7: Estimating time – How do we rate against …?Students construct back-to-back stem-and-leaf plots and histograms and describe data, using terms including ‘skewed’, ‘symmetric’ and ‘bimodal’.Students compare data displays using mean, median and range to describe and interpret numerical data sets in terms of location (centre) and spread.
ACMSP282 ◆
ACMSP283 ◆ ◆
Example 8: Estimating time – using data in different waysStudents construct back-to-back stem-and-leaf plots and histograms and describe data, using terms including ‘skewed’, ‘symmetric’ and ‘bimodal’. Students compare data displays using mean, median and range to describe and interpret numerical data sets in terms of location (centre) and spread.
ACMSP282 ◆
ACMSP283 ◆ ◆
Example 9: Estimating time – tackling misconceptionsStudents evaluate media statistics and trends by linking claims to data displays, statistics and representative data. (End Year 10: Interpret data displays – Interpreting statistical information.)
NC LEVEL 6 ◆

Data representation and interpretation: Year 9 | MATHEMATICS CONCEPTUAL NARRATIVE 9
From tell to ask examples continued
Example 10: Estimating time – drawing inferences from dataStudents construct back-to-back stem-and-leaf plots and histograms and describe data, using terms including ‘skewed’, ‘symmetric’ and ‘bimodal’. Students compare data displays using mean, median and range to describe and interpret numerical data sets in terms of location (centre) and spread.
ACMSP282 ◆
ACMSP283 ◆ ◆
Example 11: Estimating time – encourage students to generaliseStudents construct back-to-back stem-and-leaf plots and histograms and describe data, using terms including ‘skewed’, ‘symmetric’ and ‘bimodal’. Students compare data displays using mean, median and range to describe and interpret numerical data sets in terms of location (centre) and spread.
ACMSP282 ◆
ACMSP283 ◆ ◆
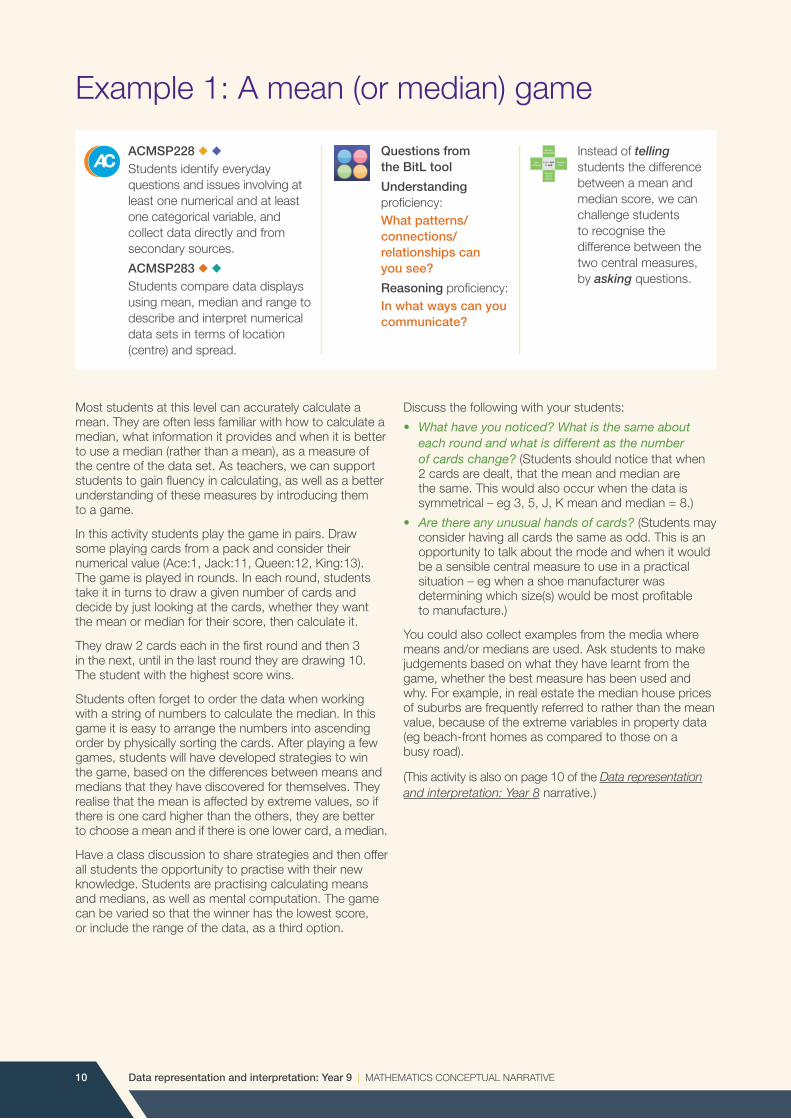
ACMSP228 ◆ ◆
Students identify everyday questions and issues involving at least one numerical and at least one categorical variable, and collect data directly and from secondary sources.
ACMSP283 ◆ ◆
Students compare data displays using mean, median and range to describe and interpret numerical data sets in terms of location (centre) and spread.
Questions from the BitL tool
Understanding proficiency: What patterns/connections/relationships can you see?
Reasoning proficiency: In what ways can you communicate?
Instead of telling students the difference between a mean and median score, we can challenge students to recognise the difference between the two central measures, by asking questions.
Socratic questioning
Student voice
Explore before explain
Use dialogue
From tell to ask
Data representation and interpretation: Year 9 | MATHEMATICS CONCEPTUAL NARRATIVE10
Example 1: A mean (or median) game
Most students at this level can accurately calculate a mean. They are often less familiar with how to calculate a median, what information it provides and when it is better to use a median (rather than a mean), as a measure of the centre of the data set. As teachers, we can support students to gain fluency in calculating, as well as a better understanding of these measures by introducing them to a game.
In this activity students play the game in pairs. Draw some playing cards from a pack and consider their numerical value (Ace:1, Jack:11, Queen:12, King:13). The game is played in rounds. In each round, students take it in turns to draw a given number of cards and decide by just looking at the cards, whether they want the mean or median for their score, then calculate it.
They draw 2 cards each in the first round and then 3 in the next, until in the last round they are drawing 10. The student with the highest score wins.
Students often forget to order the data when working with a string of numbers to calculate the median. In this game it is easy to arrange the numbers into ascending order by physically sorting the cards. After playing a few games, students will have developed strategies to win the game, based on the differences between means and medians that they have discovered for themselves. They realise that the mean is affected by extreme values, so if there is one card higher than the others, they are better to choose a mean and if there is one lower card, a median.
Have a class discussion to share strategies and then offer all students the opportunity to practise with their new knowledge. Students are practising calculating means and medians, as well as mental computation. The game can be varied so that the winner has the lowest score, or include the range of the data, as a third option.
Discuss the following with your students:
• Whathaveyounoticed?Whatisthesameabout each round and what is different as the number of cards change? (Students should notice that when 2 cards are dealt, that the mean and median are the same. This would also occur when the data is symmetrical – eg 3, 5, J, K mean and median = 8.)
• Arethereanyunusualhandsofcards?(Students may consider having all cards the same as odd. This is an opportunity to talk about the mode and when it would be a sensible central measure to use in a practical situation – eg when a shoe manufacturer was determining which size(s) would be most profitable to manufacture.)
You could also collect examples from the media where means and/or medians are used. Ask students to make judgements based on what they have learnt from the game, whether the best measure has been used and why. For example, in real estate the median house prices of suburbs are frequently referred to rather than the mean value, because of the extreme variables in property data (eg beach-front homes as compared to those on a busy road).
(This activity is also on page 10 of the Data representation and interpretation: Year 8 narrative.)

Data representation and interpretation: Year 9 | MATHEMATICS CONCEPTUAL NARRATIVE 11
Example 2: Does our class have big heads?
ACMSP228 ◆ ◆
Students identify everyday questions and issues involving at least one numerical and at least one categorical variable, and collect data directly and from secondary sources.
ACMSP282 ◆ Students construct back-to-back stem-and-leaf plots and histograms and describe data, using terms including ‘skewed’, ‘symmetric’ and ‘bimodal’.
ACMSP283 ◆ ◆ Students compare data displays using mean, median and range to describe and interpret numerical data sets in terms of location (centre) and spread.
Questions from the BitL tool
Understanding proficiency: What patterns/connections/relationships can you see?
Reasoning proficiency: In what ways can you communicate?
Instead of telling students to show data sets are the same or different, we can challenge students to compare the sets in as many ways as they can, by asking questions.
Socratic questioning
Student voice
Explore before explain
Use dialogue
From tell to ask
This activity by the Australian Mathematical Sciences Institute (AMSI) is from the TIMES Project, Data investigation and interpretation Year 9, Module 7, Example F: Body statistics.
Students can extend their learning by comparing two data sets for the head circumferences of male and female students. The Body statistics example outlines an investigation that models techniques for summarising and representing the comparisons of two data sets.
The Body statistics activity can be accessed at: http://amsi.org.au/teacher_modules/Data_Investigation-year_9.html
Source: Australian Mathematical Sciences Institute (2011) Data investigation and interpretation: A guide for teachers –Year 9, Statistic and probability: Module 7, The Improving Mathematics Education in Schools (TIMES) Project, The University of Melbourne, p.22
There are some conventions in mathematics, which students cannot develop by themselves with reasoning and deduction. Particular terms describing the shapes of distributions are examples of this. As teachers, we can provide experiences that allow students to develop their understanding of these terms in a conceptual way and then ask them to expand, apply, or transfer this knowledge to a similar context.
In this task, the students explore the use of a template to illustrate the shape descriptions for histograms, and then they are asked to develop a similar technique for stem-and-leaf and box plots.
Most often students have an understanding of the term ‘symmetrical’ from their fluency in Shape: Year 4. Bimodal suggests there will be two modes, and so two peaks in the shape of the data. The term ‘skewed’ implies the lack of symmetry, but students often are confused by the terms ‘positively skewed’ and ‘negatively skewed’.
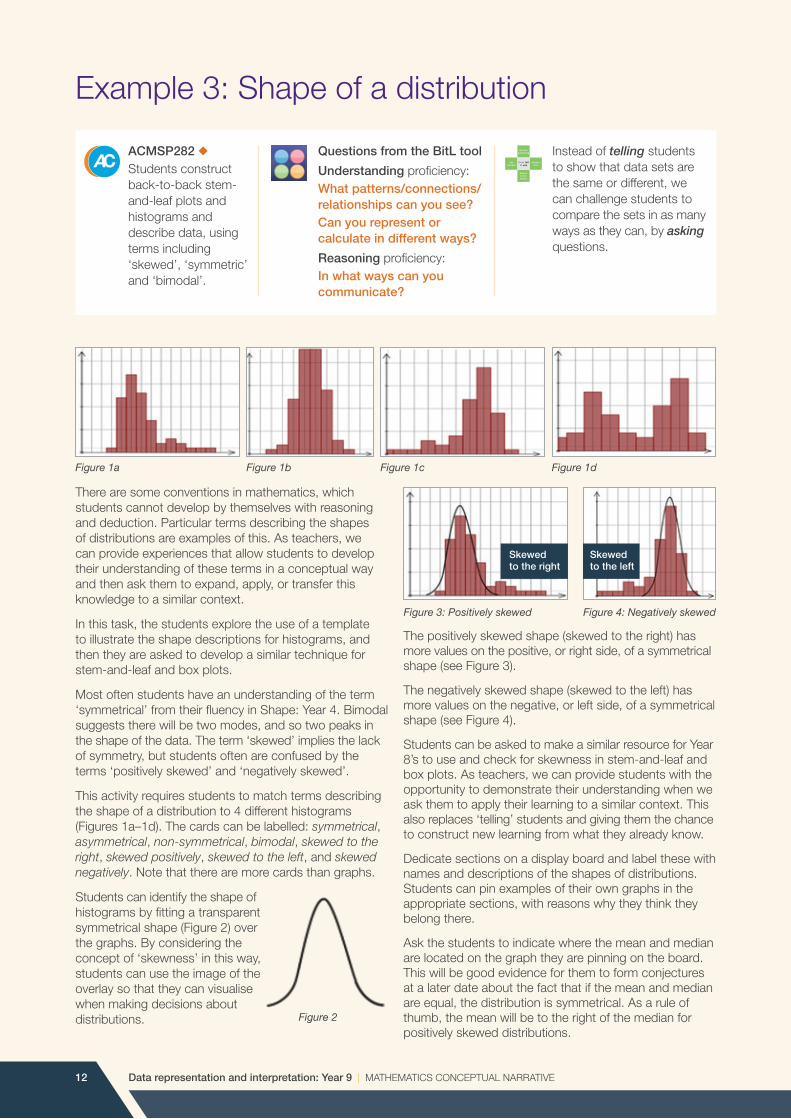
This activity requires students to match terms describing the shape of a distribution to 4 different histograms (Figures 1a–1d). The cards can be labelled: symmetrical, asymmetrical, non-symmetrical, bimodal, skewed to the right, skewed positively, skewed to the left, and skewed negatively. Note that there are more cards than graphs.
Students can identify the shape of histograms by fitting a transparent symmetrical shape (Figure 2) over the graphs. By considering the concept of ‘skewness’ in this way, students can use the image of the overlay so that they can visualise when making decisions about distributions.
The positively skewed shape (skewed to the right) has more values on the positive, or right side, of a symmetrical shape (see Figure 3).
The negatively skewed shape (skewed to the left) has more values on the negative, or left side, of a symmetrical shape (see Figure 4).
Students can be asked to make a similar resource for Year 8’s to use and check for skewness in stem-and-leaf and box plots. As teachers, we can provide students with the opportunity to demonstrate their understanding when we ask them to apply their learning to a similar context. This also replaces ‘telling’ students and giving them the chance to construct new learning from what they already know.
Dedicate sections on a display board and label these with names and descriptions of the shapes of distributions. Students can pin examples of their own graphs in the appropriate sections, with reasons why they think they belong there.
Ask the students to indicate where the mean and median are located on the graph they are pinning on the board. This will be good evidence for them to form conjectures at a later date about the fact that if the mean and median are equal, the distribution is symmetrical. As a rule of thumb, the mean will be to the right of the median for positively skewed distributions.
Figure 1cFigure 1a Figure 1b Figure 1d
Data representation and interpretation: Year 9 | MATHEMATICS CONCEPTUAL NARRATIVE12
Example 3: Shape of a distribution
ACMSP282 ◆Students construct back-to-back stem-and-leaf plots and histograms and describe data, using terms including ‘skewed’, ‘symmetric’ and ‘bimodal’.
Questions from the BitL tool
Understanding proficiency: What patterns/connections/relationships can you see?Can you represent or calculate in different ways?
Reasoning proficiency: In what ways can you communicate?
Instead of telling students to show that data sets are the same or different, we can challenge students to compare the sets in as many ways as they can, by asking questions.
Socratic questioning
Student voice
Explore before explain
Use dialogue
From tell to ask
Figure 2
Figure 3: Positively skewed Figure 4: Negatively skewed
ACMSP228 ◆ ◆ Students identify everyday questions and issues involving at least one numerical and at least one categorical variable, and collect data directly and from secondary sources. ACMSP282 ◆ Students construct back-to-back stem-and-leaf plots and histograms and describe data, using terms including ‘skewed’, ‘symmetric’ and ‘bimodal’. ACMSP283 ◆ ◆ Students compare data displays using mean, median and range to describe and interpret numerical data sets in terms of location (centre) and spread.
Questions from the BitL tool
Understanding proficiency: What patterns/connections/relationships can you see?Can you represent or calculate in different ways?
Reasoning proficiency: In what ways can you communicate?
Instead of telling students to show that data sets are the same or different, we can challenge students to compare the sets in as many ways as they can, by asking questions.
Socratic questioning
Student voice
Explore before explain
Use dialogue
From tell to ask
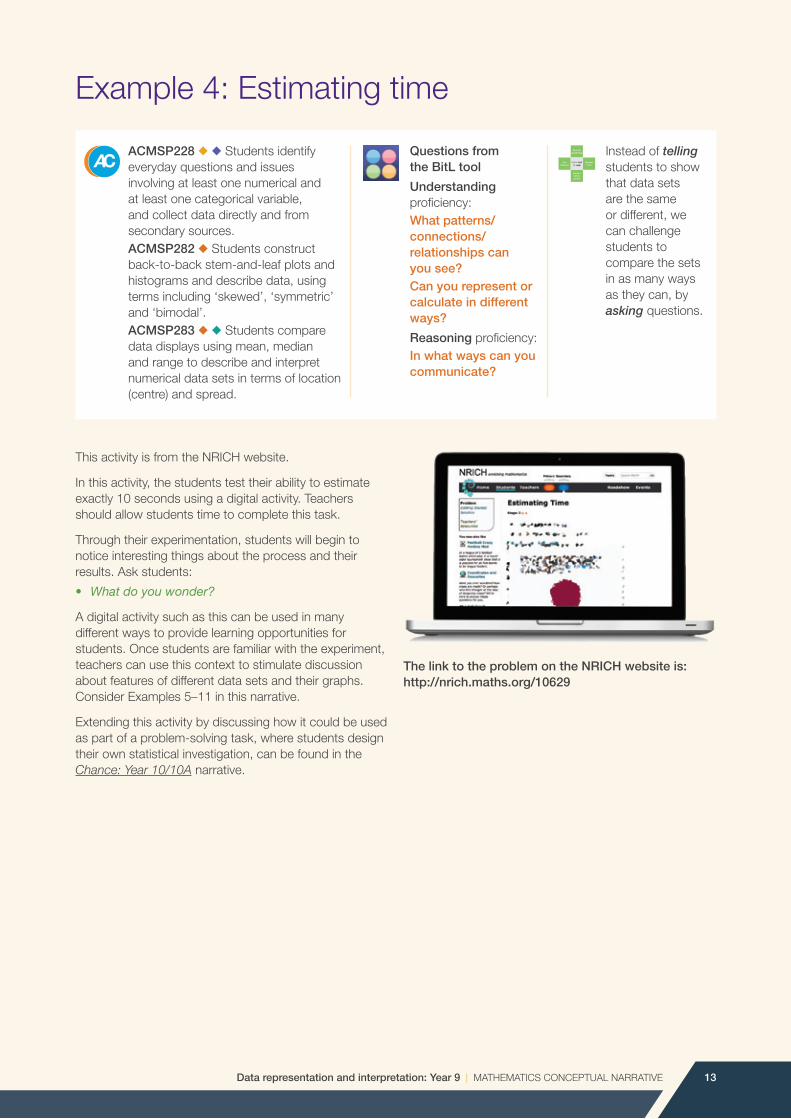
This activity is from the NRICH website.
In this activity, the students test their ability to estimate exactly 10 seconds using a digital activity. Teachers should allow students time to complete this task.
Through their experimentation, students will begin to notice interesting things about the process and their results. Ask students:
• Whatdoyouwonder?
A digital activity such as this can be used in many different ways to provide learning opportunities for students. Once students are familiar with the experiment, teachers can use this context to stimulate discussion about features of different data sets and their graphs. Consider Examples 5–11 in this narrative.
Extending this activity by discussing how it could be used as part of a problem-solving task, where students design their own statistical investigation, can be found in the Chance: Year 10/10A narrative.
The link to the problem on the NRICH website is: http://nrich.maths.org/10629
Data representation and interpretation: Year 9 | MATHEMATICS CONCEPTUAL NARRATIVE 13
Example 4: Estimating time
Data representation and interpretation: Year 9 | MATHEMATICS CONCEPTUAL NARRATIVE14
Example 5: Estimating time – How did this come about?
ACMSP228 ◆ ◆
Students identify everyday questions and issues involving at least one numerical and at least one categorical variable, and collect data directly and from secondary sources.
Questions from the BitL tool
Understanding proficiency: What patterns/connections/relationships can you see?Can you represent or calculate in different ways?Can you answer backwards questions?
Reasoning proficiency: In what ways can you communicate?
Instead of telling students to show that data sets are the same or different, we can challenge students to compare the sets in as many ways as they can, by asking questions.
Socratic questioning
Student voice
Explore before explain
Use dialogue
From tell to ask
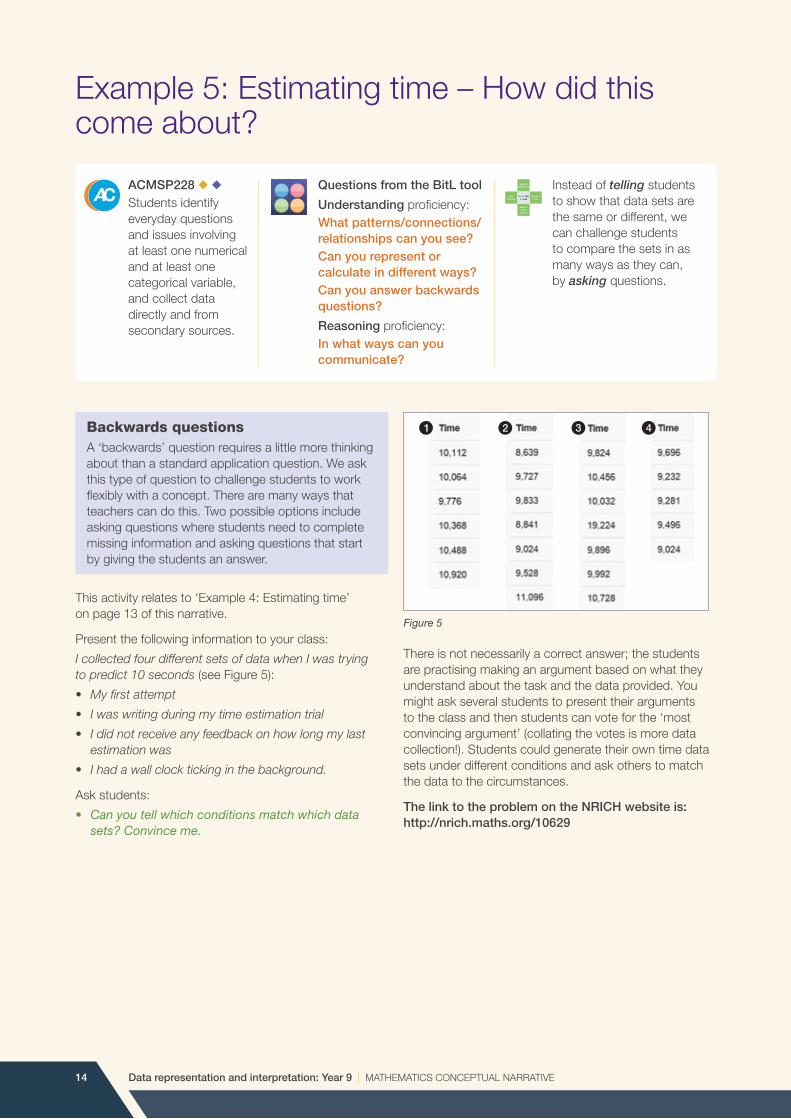
Backwards questionsA ‘backwards’ question requires a little more thinking about than a standard application question. We ask this type of question to challenge students to work flexibly with a concept. There are many ways that teachers can do this. Two possible options include asking questions where students need to complete missing information and asking questions that start by giving the students an answer.
This activity relates to ‘Example 4: Estimating time’ on page 13 of this narrative.
Present the following information to your class:
I collected four different sets of data when I was trying to predict 10 seconds (see Figure 5):
• Myfirstattempt
• Iwaswritingduringmytimeestimationtrial
• Ididnotreceiveanyfeedbackonhowlongmylastestimation was
• Ihadawallclocktickinginthebackground.
Ask students:
• Canyoutellwhichconditionsmatchwhichdata sets?Convinceme.
There is not necessarily a correct answer; the students are practising making an argument based on what they understand about the task and the data provided. You might ask several students to present their arguments to the class and then students can vote for the ‘most convincing argument’ (collating the votes is more data collection!). Students could generate their own time data sets under different conditions and ask others to match the data to the circumstances.
The link to the problem on the NRICH website is: http://nrich.maths.org/10629
Figure 5
ACMSP228 ◆ ◆ Students identify everyday questions and issues involving at least one numerical and at least one categorical variable, and collect data directly and from secondary sources. ACMSP282 ◆ Students construct back-to-back stem-and-leaf plots and histograms and describe data, using terms including ‘skewed’, ‘symmetric’ and ‘bimodal’.
Questions from the BitL tool
Understanding proficiency: What patterns/connections/relationships can you see?Can you represent or calculate in different ways?
Reasoning proficiency: In what ways can you communicate?
Instead of telling students to show that data sets are the same or different, we can challenge students to compare the sets in as many ways as they can, by asking questions.
Socratic questioning
Student voice
Explore before explain
Use dialogue
From tell to ask
Example 6: Estimating time – representing time estimation data
Data representation and interpretation: Year 9 | MATHEMATICS CONCEPTUAL NARRATIVE 15
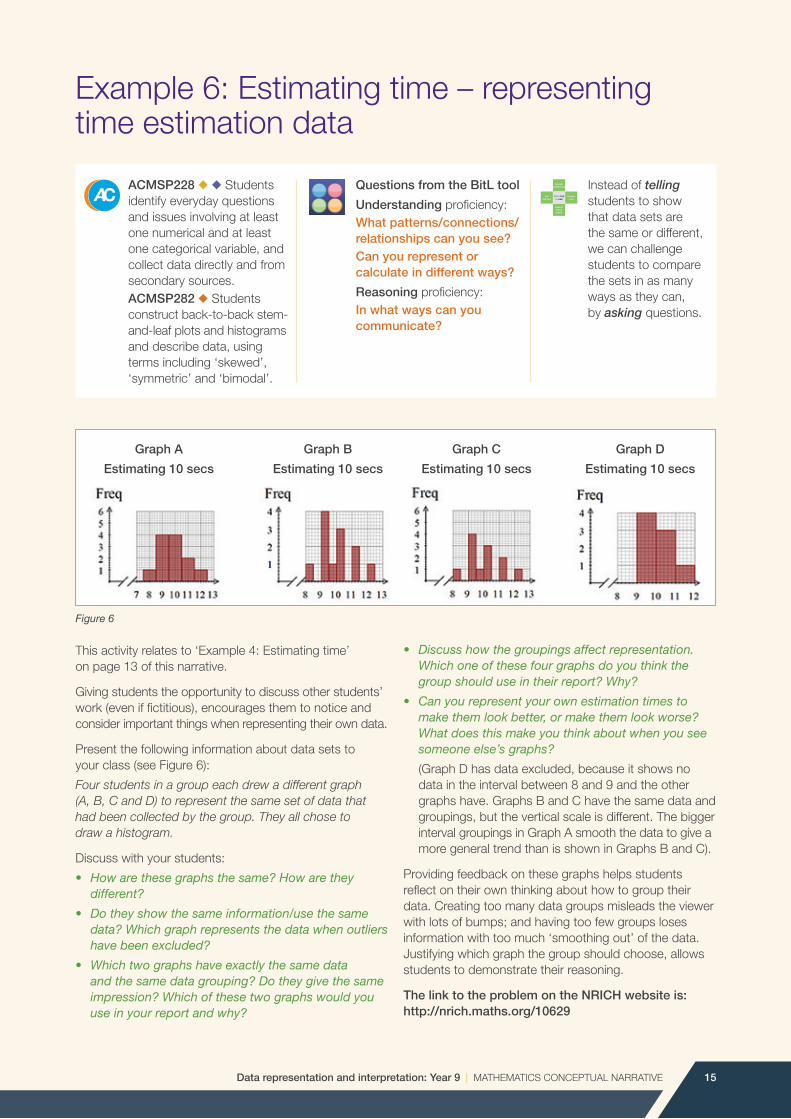
This activity relates to ‘Example 4: Estimating time’ on page 13 of this narrative.
Giving students the opportunity to discuss other students’ work (even if fictitious), encourages them to notice and consider important things when representing their own data.
Present the following information about data sets to your class (see Figure 6):
Four students in a group each drew a different graph (A, B, C and D) to represent the same set of data that hadbeencollectedbythegroup.Theyallchoseto drawahistogram.
Discuss with your students:
• Howarethesegraphsthesame?Howarethey different?
• Dotheyshowthesameinformation/usethesame data? Which graph represents the data when outliers have been excluded?
• Whichtwographshaveexactlythesamedata andthesamedatagrouping?Dotheygivethesame impression? Which of these two graphs would you use in your report and why?
• Discusshowthegroupingsaffectrepresentation. Which one of these four graphs do you think the group should use in their report? Why?
• Canyourepresentyourownestimationtimesto make them look better, or make them look worse? What does this make you think about when you see someone else’s graphs?
(Graph D has data excluded, because it shows no data in the interval between 8 and 9 and the other graphs have. Graphs B and C have the same data and groupings, but the vertical scale is different. The bigger interval groupings in Graph A smooth the data to give a more general trend than is shown in Graphs B and C).
Providing feedback on these graphs helps students reflect on their own thinking about how to group their data. Creating too many data groups misleads the viewer with lots of bumps; and having too few groups loses information with too much ‘smoothing out’ of the data. Justifying which graph the group should choose, allows students to demonstrate their reasoning.
The link to the problem on the NRICH website is: http://nrich.maths.org/10629
Figure 6
Data representation and interpretation: Year 9 | MATHEMATICS CONCEPTUAL NARRATIVE16
ACMSP282 ◆ Students construct back-to-back stem-and-leaf plots and histograms and describe data, using terms including ‘skewed’, ‘symmetric’ and ‘bimodal’.
ACMSP283 ◆ ◆ Students compare data displays using mean, median and range to describe and interpret numerical data sets in terms of location (centre) and spread.
Questions from the BitL tool
Understanding proficiency: What patterns/connections/relationships can you see?Can you represent or calculate in different ways?
Reasoning proficiency: In what ways can you communicate?
Instead of telling students to show that data sets are the same or different, we can challenge students to compare the sets in as many ways as they can, by asking questions.
Socratic questioning
Student voice
Explore before explain
Use dialogue
From tell to ask
Example 7: Estimating time – How do we rate against …?
This activity relates to ‘Example 4: Estimating time’ on page 13 of this narrative.
Students will be naturally interested in comparing their results with others, but how do we determine who has the better results? An important point to note when analysing this data, is that although a person has an average, or mean estimate of 10 seconds, this does not indicate a perfect ability to estimate time. Ask students the following:
• Whatcanyoudeduceifapersonhasanaverage estimation of 10 seconds?
Very little in fact. Ask the students to create two different sets of data, both with a mean of 10, but one which suggests ‘good’ and the other ‘poor’ estimation skills.
By constructing back-to-back stem-and-leaf plots, students can compare their performances with peers.
In this task students may deduce that:
• skeweddatawouldindicatethatthepersonalwaysover (or under) estimates the time interval
• asmallerrangeindicatesamoreconsistentability to predict
• asmallrangecentredaround9(oraround11)forexample, indicates the person is precise/consistent, but not accurate
• asmallrange,symmetricalabout10maybethe best indicator of ability.
Another way to provide students with the opportunity to compare and analyse data purposefully, is to compare data for an ‘outsider’. For example: the teacher, the best estimator from another class, the school’s elite sportsperson, or a local celebrity. Students can demonstrate their reasoning by providing an argument for one performance being better than the other.
To make the comparison more challenging, you may choose to provide groups with different graphical representations of the ‘outsider’s’ performance, but not the original data. This requires students to work backwards and so think more deeply about what graphs tell us. Groups may need to share the information they get from their graphs, fostering student discussion and collaboration:
• Howarethegraphsthesame/different?Canamean, ormedian,befound/estimatedfromagraph?Are they ever the same value? Which one is the best indicator of an ability to predict time? (The mean and median can be the same for symmetrical data.)
• Canyoudeterminethemean/medianscoreand rangefromthestem-and-leafplot?Ahistogram? Aboxplot?
• Isthereonebestwaytorepresentthisdata? (This is continuous data, accurate to the nearest millisecond. One advantage of a stem-and-leaf plot is that the raw data is not lost in the representation, unless the values are rounded to reduce groupings. It is best represented by an ordered stem-and-leaf plot, where the raw data can still be read from the graph. The median can be read off the graph by counting to the middle score. Estimates of the mean and median can be made from a histogram using frequencies and the midpoint of the grouped data.)
The link to the problem on the NRICH website is: http://nrich.maths.org/10629

ACMSP282 ◆ Students construct back-to-back stem-and-leaf plots and histograms and describe data, using terms including ‘skewed’, ‘symmetric’ and ‘bimodal’.
ACMSP283 ◆ ◆ Students compare data displays using mean, median and range to describe and interpret numerical data sets in terms of location (centre) and spread.
Questions from the BitL tool
Understanding proficiency: What patterns/connections/relationships can you see?Can you represent or calculate in different ways?
Reasoning proficiency: In what ways can you communicate?
Instead of telling students to show that data sets are the same or different, we can challenge students to compare the sets in as many ways as they can, by asking questions.
Socratic questioning
Student voice
Explore before explain
Use dialogue
From tell to ask
Data representation and interpretation: Year 9 | MATHEMATICS CONCEPTUAL NARRATIVE 17
Example 8: Estimating time – using data in different ways
This activity relates to ‘Example 4: Estimating time’ on page 13 of this narrative.
Instead of using the raw data from their estimated times, students might consider the difference between their estimate and 10 seconds as their statistical variable. Ask students:
• Wouldtheresultsbethesameifyourecordedhow far the estimate was off 10 seconds, instead of using the actual prediction as the data? (Compare this representation to the previous ones.)
• Whatisthesame?Whatisdifferent?(If they do consider above and below 10 seconds as positive and negative values respectively, they have a measure that links conceptually with how skewed the data is. A positive total indicates the subject overestimates and a negative total, underestimates.)
Students might also consider the difference between their estimate and 10 seconds as an absolute value, that is: as a quantity, but not whether it is above (positive) or below (negative). This approach measures the spread of the data and so a smaller value should be an indicator of higher ability to predict time. This has conceptual links with Standard Deviation, which they will encounter in Year 10.
Students gain a better understanding of the ‘how’ and ‘why’ of summarising data when they work flexibly with information they have collected. It will also make them more aware of the decisions that are made in the media, or in advertising, when using data to persuade or influence us.
As teachers, we can provide students with the opportunity to demonstrate their reasoning skills when we ask them to compare the different measures they generated from the data and what can be inferred from them. Students can often reason more fluently, when they are describing decisions they made with the data they collected, to answer questions they themselves posed.
The link to the problem on the NRICH website is: http://nrich.maths.org/10629
Data representation and interpretation: Year 9 | MATHEMATICS CONCEPTUAL NARRATIVE18
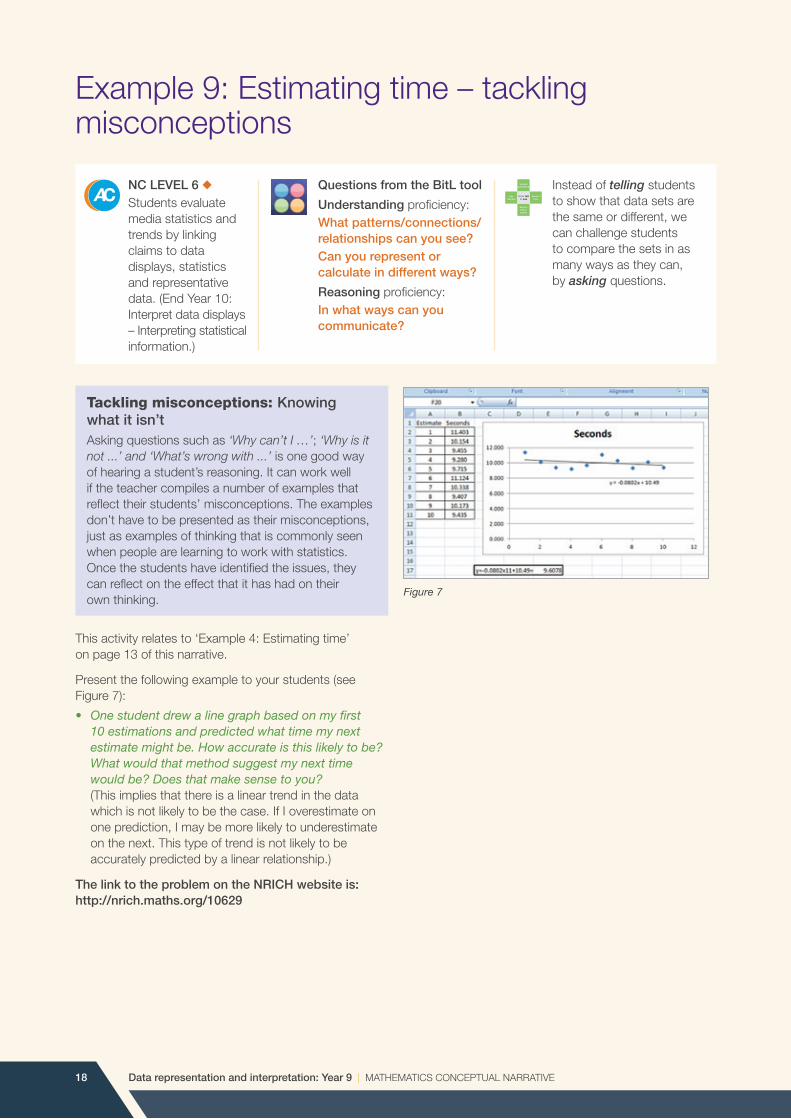
Tackling misconceptions: Knowing what it isn’tAsking questions such as ‘Why can’t I …’; ‘Why is it not...’and‘What’swrongwith...’ is one good way of hearing a student’s reasoning. It can work well if the teacher compiles a number of examples that reflect their students’ misconceptions. The examples don’t have to be presented as their misconceptions, just as examples of thinking that is commonly seen when people are learning to work with statistics. Once the students have identified the issues, they can reflect on the effect that it has had on their own thinking.
This activity relates to ‘Example 4: Estimating time’ on page 13 of this narrative.
Present the following example to your students (see Figure 7):
• Onestudentdrewalinegraphbasedonmyfirst 10 estimations and predicted what time my next estimatemightbe.Howaccurateisthislikelytobe? What would that method suggest my next time wouldbe?Doesthatmakesensetoyou? (This implies that there is a linear trend in the data which is not likely to be the case. If I overestimate on one prediction, I may be more likely to underestimate on the next. This type of trend is not likely to be accurately predicted by a linear relationship.)
The link to the problem on the NRICH website is: http://nrich.maths.org/10629
Example 9: Estimating time – tackling misconceptions
NC LEVEL 6 ◆Students evaluate media statistics and trends by linking claims to data displays, statistics and representative data. (End Year 10: Interpret data displays – Interpreting statistical information.)
Questions from the BitL tool
Understanding proficiency: What patterns/connections/relationships can you see?Can you represent or calculate in different ways?
Reasoning proficiency: In what ways can you communicate?
Instead of telling students to show that data sets are the same or different, we can challenge students to compare the sets in as many ways as they can, by asking questions.
Socratic questioning
Student voice
Explore before explain
Use dialogue
From tell to ask
Figure 7
Data representation and interpretation: Year 9 | MATHEMATICS CONCEPTUAL NARRATIVE 19
ACMSP282 ◆ Students construct back-to-back stem-and-leaf plots and histograms and describe data, using terms including ‘skewed’, ‘symmetric’ and ‘bimodal’.
ACMSP283 ◆ ◆ Students compare data displays using mean, median and range to describe and interpret numerical data sets in terms of location (centre) and spread.
Questions from the BitL tool
Understanding proficiency: What patterns/connections/relationships can you see?Can you represent or calculate in different ways?
Reasoning proficiency: In what ways can you communicate?
Instead of telling students to show that data sets are the same or different, we can challenge students to compare the sets in as many ways as they can, by asking questions.
Socratic questioning
Student voice
Explore before explain
Use dialogue
From tell to ask
Example 10: Estimating time – drawing inferences from data
This activity relates to ‘Example 4: Estimating time’ on page 13 of this narrative.
Teachers can construct situations where the focus is about making inferences, based on the data or graphs that are provided.
The Estimating time activity can be changed to a questioning activity, so the students can ask questions of the person who has made an inference from their data.
These types of questions may present a problem-solving challenge to many students, so they may take quite some time to process the information. The students can be organised into groups and have the next piece of information released when they have completed their thinking for each section:
• Iftherangeofthedatais...whatcanyouinfer?
• IfItellyouthatthemeanis…whatcanyouinfer?
• Lookatthegraph.Whatcanyouinferfromthe symmetry?
These types of questions allow the students to notice that their ideas can change, as new information is discovered, or revealed.
Students should be encouraged to question the source of the data and the validity of the representation. Through doing this, the teacher is modelling how to be a critical consumer of statistics.
Consider the data provided to the class by the ‘outsider’ (refer to ‘Example 7: Estimating time – How do we rate against …?’). What questions do your students want to ask?
• Werethereanydistractionswhenitwascollected? Howmuchpracticedidtheyhave?Wereanyoutliers discarded?
The link to the problem on the NRICH website is: http://nrich.maths.org/10629
Data representation and interpretation: Year 9 | MATHEMATICS CONCEPTUAL NARRATIVE20
ACMSP282 ◆ Students construct back-to-back stem-and-leaf plots and histograms and describe data, using terms including ‘skewed’, ‘symmetric’ and ‘bimodal’.
ACMSP283 ◆ ◆ Students compare data displays using mean, median and range to describe and interpret numerical data sets in terms of location (centre) and spread.
Questions from the BitL tool
Understanding proficiency: What patterns/connections/relationships can you see?Can you represent or calculate in different ways?
Reasoning proficiency: In what ways can you communicate?In what ways can your thinking be generalised? What can you infer?
Instead of telling students to show that data sets are the same or different, we can challenge students to compare the sets in as many ways as they can, by asking questions.
Socratic questioning
Student voice
Explore before explain
Use dialogue
From tell to ask
Example 11: Estimating time – encourage students to generalise
This activity relates to ‘Example 4: Estimating time’ on page 13 of this narrative.
Teachers must encourage students to consider how the results they observed and the inferences they have made, may, or may not, be applicable in general. In statistics, it is often not valid to generalise your findings. Statisticians will only generalise findings as applying to a wider population, if their sample is fair and representative, and sufficiently large for that population. Even in that situation, they will make a statement about the level of confidence they have in their inferences.
Present the following to your students:
• StudentAwasthebestatestimating10seconds. Would they be the best at estimating 10 minutes or5seconds?Howcouldwecheckthis?
• Wouldtheresultsbethesameforyoungchildren? Adults?Agedpeople?Whomighttheresultsbe thesamefor?Howcouldwecheck?
The link to the problem on the NRICH website is: http://nrich.maths.org/10629

Data representation and interpretation: Year 9 | MATHEMATICS CONCEPTUAL NARRATIVE 21
Proficiency: Problem-solvingProficiency emphasis and what questions to ask to activate it in your students (Examples 12–14)
Problems are described in the AC: Mathematics as ‘meaningful’ or ‘unfamiliar’. Students of all abilities and ages should be provided with experiences of both meaningful and unfamiliar problems.
Meaningful problemsMeaningful problems are set in a context that a student can project themselves into. It may be that the mathematics and strategy being applied is familiar to the student or the problem relates to their own life experience. Connecting with a context does not mean that the students have to see it as ‘fun’ nor does it have to relate to an immediately practical situation from daily life.
Students can connect with a problem through provocations such as the use of manipulatives (either physical or digital) or through a dramatisation (eg, a story, interesting background information, a video clip). The intention is to give students the opportunity to work as a mathematician would work, in a context that they can access at their current stage of development.
Unfamiliar problemsFundamentally there are two groups of unfamiliar problems:
• Problemsforwhichthestudentswouldnotbeabletosay that they had done a similar example previously, they would therefore need to create an approach (develop a strategy).
• Problemsinwhichthestudentsdevelopanewpieceof knowledge. They begin the problem by applying the knowledge/skills that they have and they complete the problem having recombined that knowledge to form a new piece of understanding.
Growth mindset: Learning that not knowing is the beginning of a learning opportunityUnfamiliar problems tend to provoke a response of, ‘I don’t know’, or ‘I’m not sure’. Students respond differently to this feeling; some shut down, others begin to ask, ‘But how could I work that out?’
In developing powerful learners we are aiming for all of our students to learn that ‘not knowing’ is the beginning of a learning opportunity and that the first move that they need to make on the journey to finding out more is to ask, ‘What could I do to work this out?’
Engaging in problem-solving supports the move from tell to askInstead of telling students:
•theproblemtosolve
•theinformationthey’llneed
•thestepstheyshouldtake.
We can ask students to identify:
•theproblemtosolve
•theinformationthey’llneed
•apossibleprocesstouse.
Data representation and interpretation: Year 9 | MATHEMATICS CONCEPTUAL NARRATIVE22
Proficiency: Problem-solving examples
Example 12: The best paper plane everStudents identify everyday questions and issues involving at least one numerical and at least one categorical variable. Students construct back-to-back stem-and-leaf plots and histograms and describe data, using terms including ‘skewed’, ‘symmetric’ and ‘bimodal’. Students compare data displays using mean, median and range to describe and interpret numerical data sets in terms of location (centre) and spread.
ACMSP228 ◆ ◆
ACMSP282 ◆
ACMSP283 ◆ ◆
Example 13: Reaction timeStudents identify everyday questions and issues involving at least one numerical and at least one categorical variable. Students construct back-to-back stem-and-leaf plots and histograms and describe data, using terms including ‘skewed’, ‘symmetric’ and ‘bimodal’. Students compare data displays using mean, median and range to describe and interpret numerical data sets in terms of location (centre) and spread.
ACMSP228 ◆ ◆
ACMSP282 ◆
ACMSP283 ◆ ◆
Example 14: Right on target – What is the best strategy?Students identify everyday questions and issues involving at least one numerical and at least one categorical variable. Students construct back-to-back stem-and-leaf plots and histograms and describe data, using terms including ‘skewed’, ‘symmetric’ and ‘bimodal’. Students compare data displays using mean, median and range to describe and interpret numerical data sets in terms of location (centre) and spread.
ACMSP228 ◆ ◆
ACMSP282 ◆
ACMSP283 ◆ ◆
Example 12: The best paper plane ever
Data representation and interpretation: Year 9 | MATHEMATICS CONCEPTUAL NARRATIVE 23
In this activity, the students must determine the design, materials and throwing technique for the ‘best paper plane ever’. This may require a trial and some research from the class to determine which prototypes will be used in the investigation. Students will want to use their own design if they have one, but it is valuable to have all groups test a common design so that the class shares, compares and compiles information for discussion. Groups may investigate different variables. If there is another class(es) conducting the same investigation, it may be appropriate to have a Flight Test to determine the ultimate paper plane.
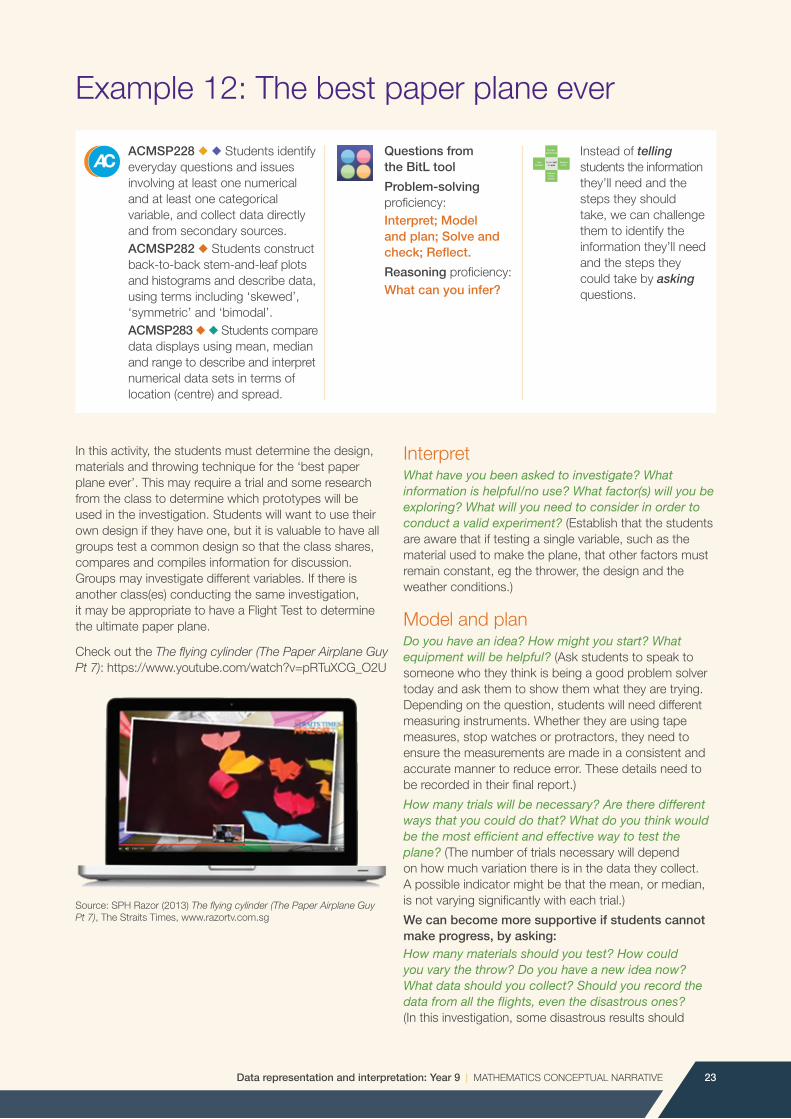
Check out the The flying cylinder (The Paper Airplane Guy Pt 7): https://www.youtube.com/watch?v=pRTuXCG_O2U
Source: SPH Razor (2013) The flying cylinder (The Paper Airplane Guy Pt 7), The Straits Times, www.razortv.com.sg
InterpretWhat have you been asked to investigate? What informationishelpful/nouse?Whatfactor(s)willyoubeexploring? What will you need to consider in order to conduct a valid experiment? (Establish that the students are aware that if testing a single variable, such as the material used to make the plane, that other factors must remain constant, eg the thrower, the design and the weather conditions.)
Model and planDoyouhaveanidea?Howmightyoustart?Whatequipment will be helpful? (Ask students to speak to someone who they think is being a good problem solver today and ask them to show them what they are trying. Depending on the question, students will need different measuring instruments. Whether they are using tape measures, stop watches or protractors, they need to ensure the measurements are made in a consistent and accurate manner to reduce error. These details need to be recorded in their final report.)
Howmanytrialswillbenecessary?Aretheredifferentways that you could do that? What do you think would bethemostefficientandeffectivewaytotesttheplane? (The number of trials necessary will depend on how much variation there is in the data they collect. A possible indicator might be that the mean, or median, is not varying significantly with each trial.)
We can become more supportive if students cannot make progress, by asking:Howmanymaterialsshouldyoutest?Howcouldyouvarythethrow?Doyouhaveanewideanow?What data should you collect? Should you record the data from all the flights, even the disastrous ones? (In this investigation, some disastrous results should
ACMSP228 ◆ ◆ Students identify everyday questions and issues involving at least one numerical and at least one categorical variable, and collect data directly and from secondary sources. ACMSP282 ◆ Students construct back-to-back stem-and-leaf plots and histograms and describe data, using terms including ‘skewed’, ‘symmetric’ and ‘bimodal’. ACMSP283 ◆ ◆ Students compare data displays using mean, median and range to describe and interpret numerical data sets in terms of location (centre) and spread.
Questions from the BitL tool
Problem-solving proficiency: Interpret; Model and plan; Solve and check; Reflect.
Reasoning proficiency: What can you infer?
Instead of telling students the information they’ll need and the steps they should take, we can challenge them to identify the information they’ll need and the steps they could take by asking questions.
Socratic questioning
Student voice
Explore before explain
Use dialogue
From tell to ask
Data representation and interpretation: Year 9 | MATHEMATICS CONCEPTUAL NARRATIVE24
be considered. If the plane performs inconsistently, it may not be competitive in the Flight Test and this is an important consideration. The disastrous result may be discarded if there is some justification such as thrower error or inconsistent weather.)
Solve and checkHowwillyousummarise,displayandanalysethedata?What do you think the most important feature of a good paper plane is? Is there another way that you could havesolvedthisproblem?Couldyoutesttheplanesina different way? (Besides distance, other factors such as flight time, consistency, or accuracy in direction might also be measures of a good plane.)
ReflectWhatwasyourmostefficientmethod?Didotherpeople solve this problem in a different way? Is there something that you would do differently next time? Was there another factor you think you should have tested? (In designing the ultimate plane, the class might combine findings of different investigations to choose the best design, the best material, etc. This assumes that the best material for one design will naturally be the best for all.)
Writing statistical reports While students are often keen to conduct the investigation, they are less likely to record the process in detail. Thus, as teachers we need to question students about their decisions as they make them, validate their good thinking and encourage them to record their reasoning at that time. Teach the features of the report explicitly. Provide students with work samples that model good report writing, prepare sections of the report as a class activity, and display or publish the completed reports to a wider audience.

Data representation and interpretation: Year 9 | MATHEMATICS CONCEPTUAL NARRATIVE 25
Example 13: Reaction time
ACMSP228 ◆ ◆ Students identify everyday questions and issues involving at least one numerical and at least one categorical variable, and collect data directly and from secondary sources. ACMSP282 ◆ Students construct back-to-back stem-and-leaf plots and histograms and describe data, using terms including ‘skewed’, ‘symmetric’ and ‘bimodal’. ACMSP283 ◆ ◆ Students compare data displays using mean, median and range to describe and interpret numerical data sets in terms of location (centre) and spread.
Questions from the BitL tool
Problem-solving proficiency: Interpret; Model and plan; Solve and check; Reflect.
Reasoning proficiency: What can you infer?
Instead of telling students the information they’ll need and the steps they should take, we can challenge them to identify the information they’ll need and the steps they could take by asking questions.
Socratic questioning
Student voice
Explore before explain
Use dialogue
From tell to ask
This activity is from the NRICH website.
Reaction time is the time taken to respond to a stimulus reaction timer. This digital activity allows you to test reaction times and experiment with different variations on the reaction timer: shape of symbol, distracters, penalties for early clicks, etc. This facility allows students to design their own questions and conduct different investigations, requiring them to make their own choices about recording, summarising and representing their data. With a common context for the investigations, students are more likely to be interested in what other groups have done and it provides an opportunity for the class to share, compare and compile information for discussion.
This site also explains ‘the ruler drop’, which is another widely used reaction timer technique. Conduct an investigation to determine how you could best test a person’s reaction time and the factors that affect it.
This provides the opportunity to compare and contrast results from the two tests using back-to-back graphs.
Student designed investigationsAfter conducting class investigations which model and support the purposeful use of statistics, investigations can become more open-ended. This allows students to pose their own question and design and conduct the investigation. For students that require more support it may require the teacher to suggest a more directed investigation. As teachers, we often suggest a focus to get students started but this is unlikely to engage an already unmotivated student. By questioning the students about their experiences with the reaction time testers, you may uncover a question based on their own observations, which is more likely to evoke curiosity.
The link to the problem on the NRICH website is: http://nrich.maths.org/6044
Data representation and interpretation: Year 9 | MATHEMATICS CONCEPTUAL NARRATIVE26
Example 14: Right on target – What is the best strategy?
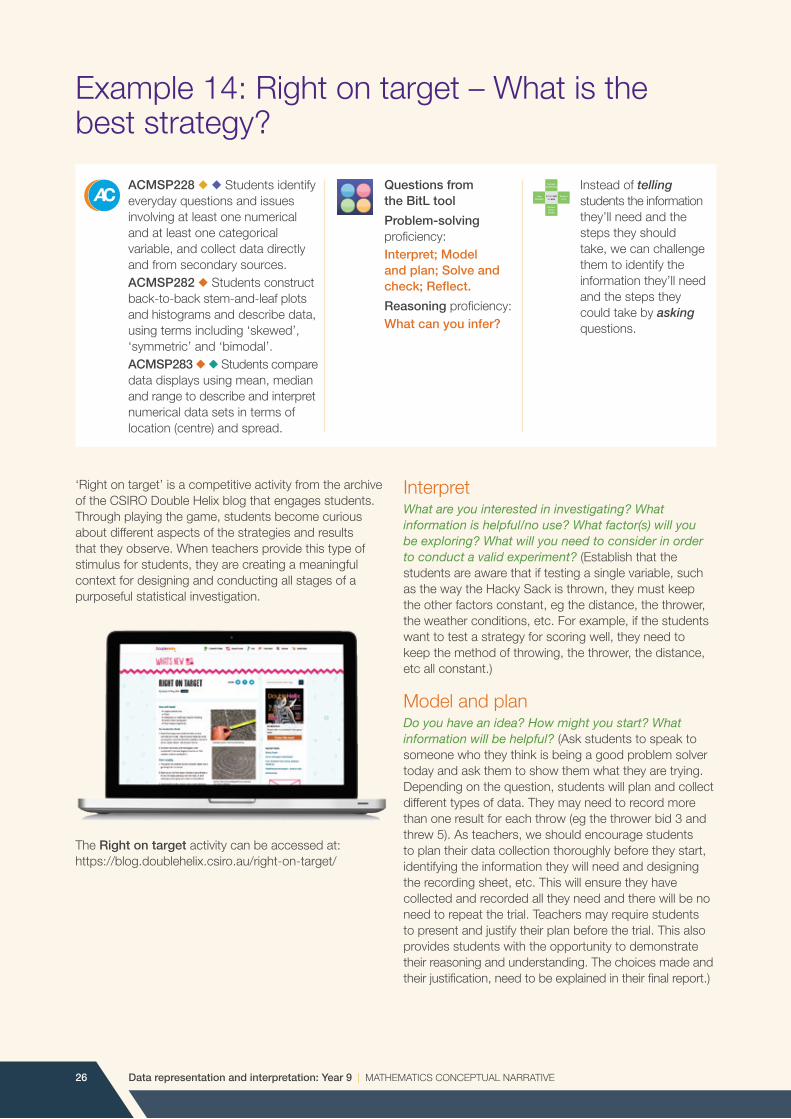
‘Right on target’ is a competitive activity from the archive of the CSIRO Double Helix blog that engages students. Through playing the game, students become curious about different aspects of the strategies and results that they observe. When teachers provide this type of stimulus for students, they are creating a meaningful context for designing and conducting all stages of a purposeful statistical investigation.
The Right on target activity can be accessed at: https://blog.doublehelix.csiro.au/right-on-target/
InterpretWhat are you interested in investigating? What informationishelpful/nouse?Whatfactor(s)willyoube exploring? What will you need to consider in order to conduct a valid experiment? (Establish that the students are aware that if testing a single variable, such as the way the Hacky Sack is thrown, they must keep the other factors constant, eg the distance, the thrower, the weather conditions, etc. For example, if the students want to test a strategy for scoring well, they need to keep the method of throwing, the thrower, the distance, etc all constant.)
Model and planDoyouhaveanidea?Howmightyoustart?Whatinformation will be helpful? (Ask students to speak to someone who they think is being a good problem solver today and ask them to show them what they are trying. Depending on the question, students will plan and collect different types of data. They may need to record more than one result for each throw (eg the thrower bid 3 and threw 5). As teachers, we should encourage students to plan their data collection thoroughly before they start, identifying the information they will need and designing the recording sheet, etc. This will ensure they have collected and recorded all they need and there will be no need to repeat the trial. Teachers may require students to present and justify their plan before the trial. This also provides students with the opportunity to demonstrate their reasoning and understanding. The choices made and their justification, need to be explained in their final report.)
ACMSP228 ◆ ◆ Students identify everyday questions and issues involving at least one numerical and at least one categorical variable, and collect data directly and from secondary sources. ACMSP282 ◆ Students construct back-to-back stem-and-leaf plots and histograms and describe data, using terms including ‘skewed’, ‘symmetric’ and ‘bimodal’. ACMSP283 ◆ ◆ Students compare data displays using mean, median and range to describe and interpret numerical data sets in terms of location (centre) and spread.
Questions from the BitL tool
Problem-solving proficiency: Interpret; Model and plan; Solve and check; Reflect.
Reasoning proficiency: What can you infer?
Instead of telling students the information they’ll need and the steps they should take, we can challenge them to identify the information they’ll need and the steps they could take by asking questions.
Socratic questioning
Student voice
Explore before explain
Use dialogue
From tell to ask
Data representation and interpretation: Year 9 | MATHEMATICS CONCEPTUAL NARRATIVE 27
Whatdoyouthinkwouldbemostefficientandeffectivewaytotestthestrategy?Howmanytrialswillbenecessary?Aretheredifferentwaysthatyoucoulddothat? (Students may investigate the area of the target zones when determining a strategy which links with understanding in measurement. The number of trials necessary will depend on how much variation there is in the data they collect.)
We can become more supportive if students cannot make progress, by asking:What strategy did you think worked best for you? What strategydefinitelydidnotwork?Doesthatsuggesta different approach? What data should you collect and how will that tell you whether your strategy is a good one? Should you record the data from all the throws, even the disastrous ones? (In this investigation, some disastrous results should be considered. If the strategy does not work on one occasion, it is important information about whether it will be a good one in the long run. The disastrous result may be discarded if there is some justification, such as thrower error or a disputed result.)
Solve and checkHowwillyousummarise,displayandanalysethedata?What do you think the most important feature of your strategy is? Is there another way that you could have solvedthisproblem?Couldyoutestyourstrategyina different way? (Students might like to consider the difference between the result they scored on the throw and the maximum possible score. A best possible result for this indicator would be zero.)
ReflectWhatwasyourmostefficientmethod?Didotherpeople solve this problem in a different way? Is there something that you would do differently next time? Was there another factor you think you should have tested? (In a type of backwards thinking, students might consider how they could change the rules of the game so that their strategy would be more effective. When teachers give groups the opportunity to investigate different questions relating to a shared experience, the students are usually very interested in what others have found. When feeding back their results, students can be encouraged to ask questions of the investigators in a respectful manner. This builds a community of learners and supports students in developing their reasoning skills.)
If possible, design an investigation that is relevant to something topical in the class, the school, the community, nationally or internationally. It may be waiting time in the canteen queue, the time spent on mobile phones or comparisons of phone plans, the Soccer World Cup, etc. (The CSIRO Double Helix Extra fortnightly email and Double Helix blog are good resources for this).
Data representation and interpretation: Year 9 | MATHEMATICS CONCEPTUAL NARRATIVE28
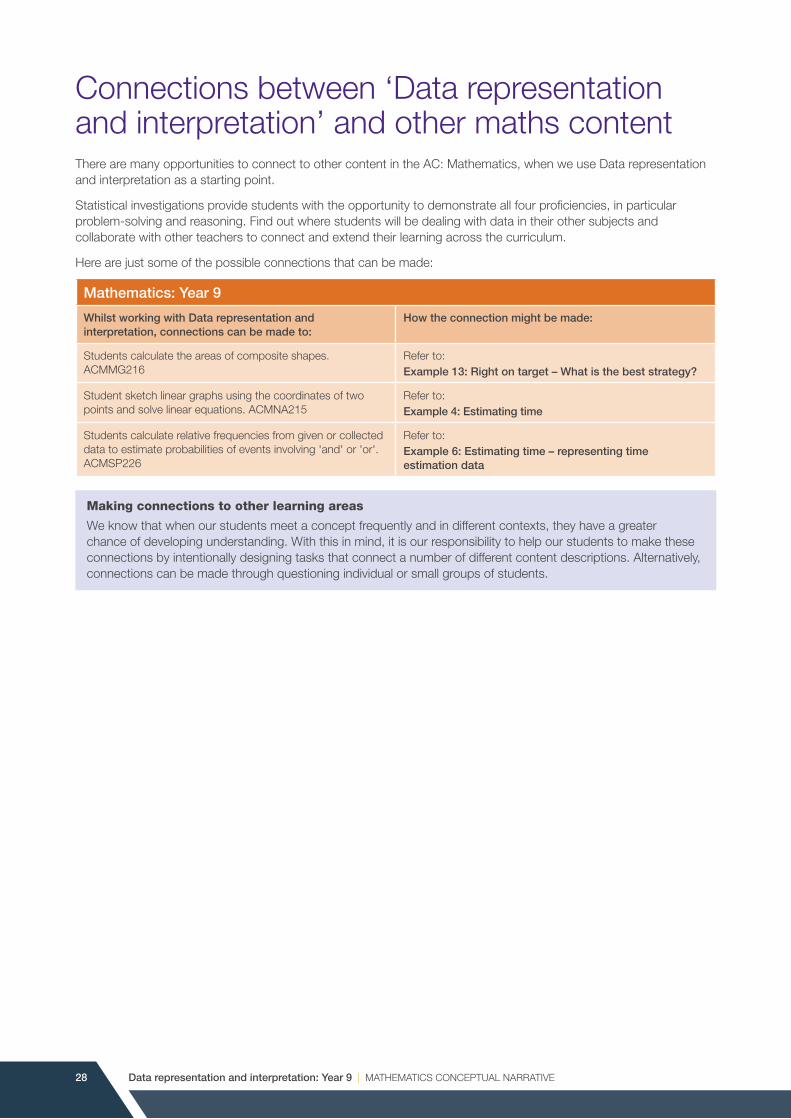
Connections between ‘Data representation and interpretation’ and other maths contentThere are many opportunities to connect to other content in the AC: Mathematics, when we use Data representation and interpretation as a starting point.
Statistical investigations provide students with the opportunity to demonstrate all four proficiencies, in particular problem-solving and reasoning. Find out where students will be dealing with data in their other subjects and collaborate with other teachers to connect and extend their learning across the curriculum.
Here are just some of the possible connections that can be made:
Mathematics: Year 9
Whilst working with Data representation and interpretation, connections can be made to:
How the connection might be made:
Students calculate the areas of composite shapes. ACMMG216
Refer to: Example 13: Right on target – What is the best strategy?
Student sketch linear graphs using the coordinates of two points and solve linear equations. ACMNA215
Refer to: Example 4: Estimating time
Students calculate relative frequencies from given or collected data to estimate probabilities of events involving 'and' or 'or'. ACMSP226
Refer to: Example 6: Estimating time – representing time estimation data
Making connections to other learning areas
We know that when our students meet a concept frequently and in different contexts, they have a greater chance of developing understanding. With this in mind, it is our responsibility to help our students to make these connections by intentionally designing tasks that connect a number of different content descriptions. Alternatively, connections can be made through questioning individual or small groups of students.
Data representation and interpretation: Year 9 | MATHEMATICS CONCEPTUAL NARRATIVE 29
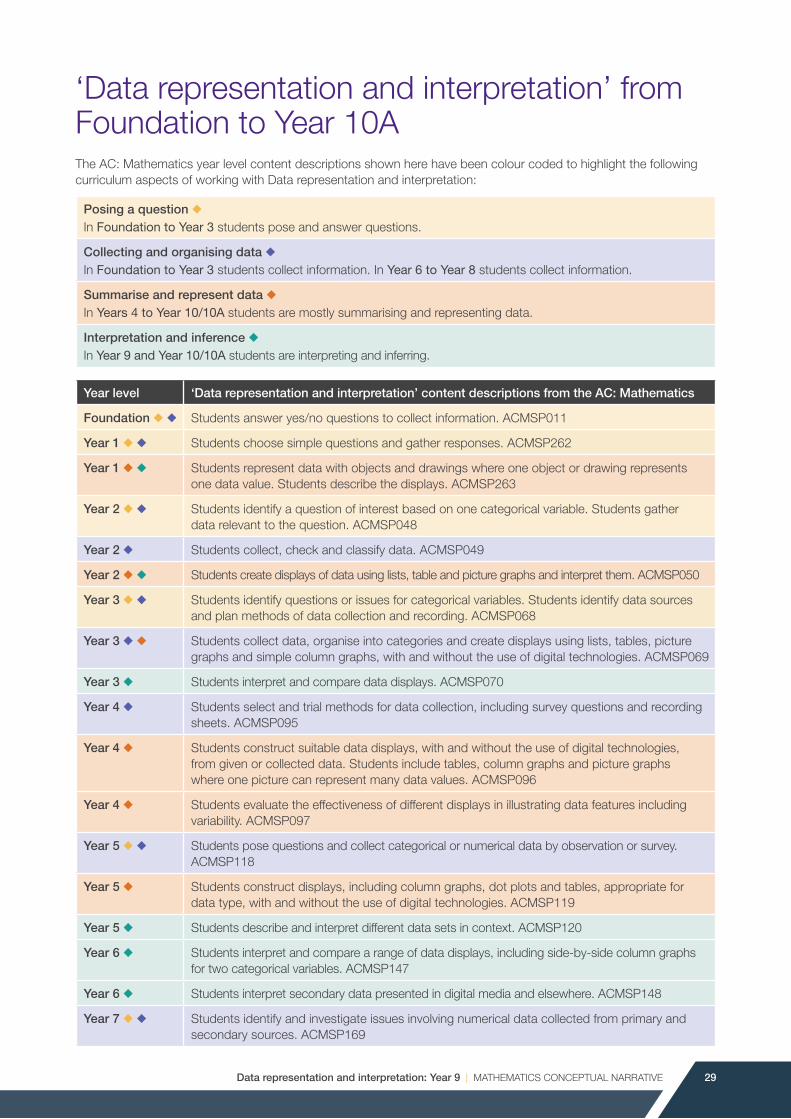
‘Data representation and interpretation’ from Foundation to Year 10AThe AC: Mathematics year level content descriptions shown here have been colour coded to highlight the following curriculum aspects of working with Data representation and interpretation:
Posing a question ◆In Foundation to Year 3 students pose and answer questions.
Collecting and organising data ◆In Foundation to Year 3 students collect information. In Year 6 to Year 8 students collect information.
Summarise and represent data ◆In Years 4 to Year 10/10A students are mostly summarising and representing data.
Interpretation and inference ◆In Year 9 and Year 10/10A students are interpreting and inferring.
Year level ‘Data representation and interpretation’ content descriptions from the AC: Mathematics
Foundation ◆ ◆ Students answer yes/no questions to collect information. ACMSP011
Year 1 ◆ ◆ Students choose simple questions and gather responses. ACMSP262
Year 1 ◆ ◆ Students represent data with objects and drawings where one object or drawing represents one data value. Students describe the displays. ACMSP263
Year 2 ◆ ◆ Students identify a question of interest based on one categorical variable. Students gather data relevant to the question. ACMSP048
Year 2 ◆ Students collect, check and classify data. ACMSP049
Year 2 ◆ ◆ Students create displays of data using lists, table and picture graphs and interpret them. ACMSP050
Year 3 ◆ ◆ Students identify questions or issues for categorical variables. Students identify data sources and plan methods of data collection and recording. ACMSP068
Year 3 ◆ ◆ Students collect data, organise into categories and create displays using lists, tables, picture graphs and simple column graphs, with and without the use of digital technologies. ACMSP069
Year 3 ◆ Students interpret and compare data displays. ACMSP070
Year 4 ◆ Students select and trial methods for data collection, including survey questions and recording sheets. ACMSP095
Year 4 ◆ Students construct suitable data displays, with and without the use of digital technologies, from given or collected data. Students include tables, column graphs and picture graphs where one picture can represent many data values. ACMSP096
Year 4 ◆ Students evaluate the effectiveness of different displays in illustrating data features including variability. ACMSP097
Year 5 ◆ ◆ Students pose questions and collect categorical or numerical data by observation or survey. ACMSP118
Year 5 ◆ Students construct displays, including column graphs, dot plots and tables, appropriate for data type, with and without the use of digital technologies. ACMSP119
Year 5 ◆ Students describe and interpret different data sets in context. ACMSP120
Year 6 ◆ Students interpret and compare a range of data displays, including side-by-side column graphs for two categorical variables. ACMSP147
Year 6 ◆ Students interpret secondary data presented in digital media and elsewhere. ACMSP148
Year 7 ◆ ◆ Students identify and investigate issues involving numerical data collected from primary and secondary sources. ACMSP169
Data representation and interpretation: Year 9 | MATHEMATICS CONCEPTUAL NARRATIVE30
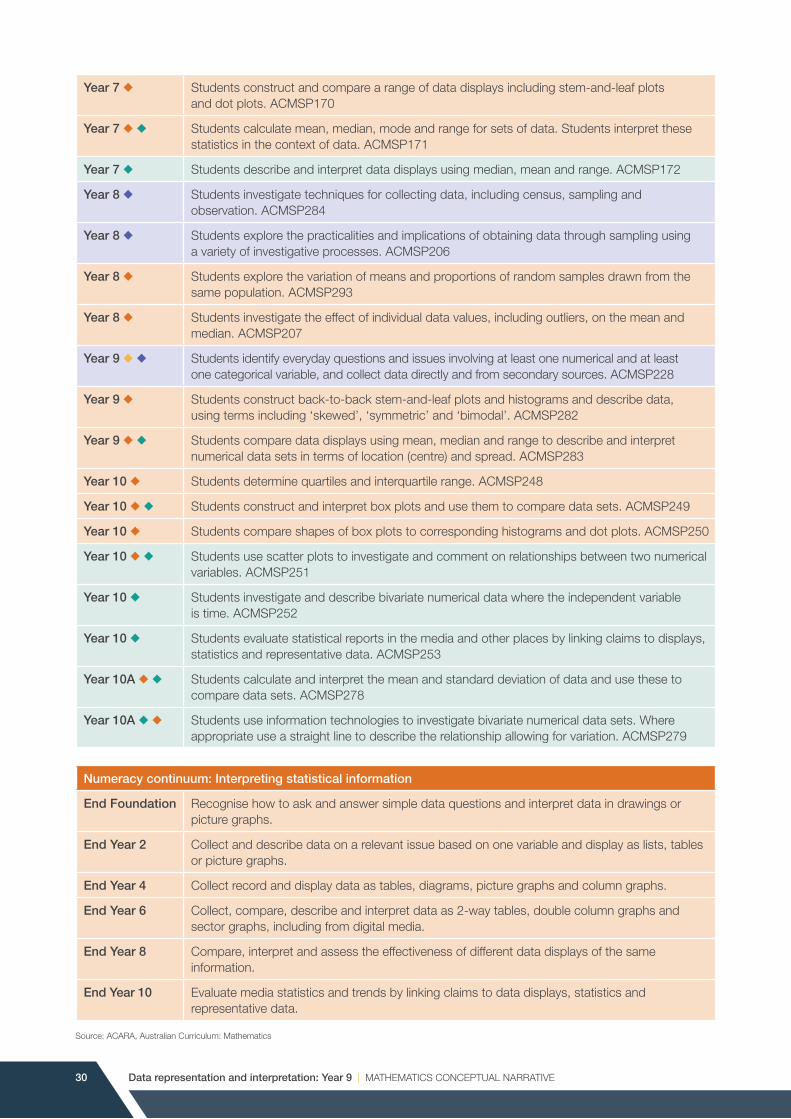
Year 7 ◆ Students construct and compare a range of data displays including stem-and-leaf plots and dot plots. ACMSP170
Year 7 ◆ ◆ Students calculate mean, median, mode and range for sets of data. Students interpret these statistics in the context of data. ACMSP171
Year 7 ◆ Students describe and interpret data displays using median, mean and range. ACMSP172
Year 8 ◆ Students investigate techniques for collecting data, including census, sampling and observation. ACMSP284
Year 8 ◆ Students explore the practicalities and implications of obtaining data through sampling using a variety of investigative processes. ACMSP206
Year 8 ◆ Students explore the variation of means and proportions of random samples drawn from the same population. ACMSP293
Year 8 ◆ Students investigate the effect of individual data values, including outliers, on the mean and median. ACMSP207
Year 9 ◆ ◆ Students identify everyday questions and issues involving at least one numerical and at least one categorical variable, and collect data directly and from secondary sources. ACMSP228
Year 9 ◆ Students construct back-to-back stem-and-leaf plots and histograms and describe data, using terms including ‘skewed’, ‘symmetric’ and ‘bimodal’. ACMSP282
Year 9 ◆ ◆ Students compare data displays using mean, median and range to describe and interpret numerical data sets in terms of location (centre) and spread. ACMSP283
Year 10 ◆ Students determine quartiles and interquartile range. ACMSP248
Year 10 ◆ ◆ Students construct and interpret box plots and use them to compare data sets. ACMSP249
Year 10 ◆ Students compare shapes of box plots to corresponding histograms and dot plots. ACMSP250
Year 10 ◆ ◆ Students use scatter plots to investigate and comment on relationships between two numerical variables. ACMSP251
Year 10 ◆ Students investigate and describe bivariate numerical data where the independent variable is time. ACMSP252
Year 10 ◆ Students evaluate statistical reports in the media and other places by linking claims to displays, statistics and representative data. ACMSP253
Year 10A ◆ ◆ Students calculate and interpret the mean and standard deviation of data and use these to compare data sets. ACMSP278
Year 10A ◆ ◆ Students use information technologies to investigate bivariate numerical data sets. Where appropriate use a straight line to describe the relationship allowing for variation. ACMSP279
Numeracy continuum: Interpreting statistical information
End Foundation Recognise how to ask and answer simple data questions and interpret data in drawings or picture graphs.
End Year 2 Collect and describe data on a relevant issue based on one variable and display as lists, tables or picture graphs.
End Year 4 Collect record and display data as tables, diagrams, picture graphs and column graphs.
End Year 6 Collect, compare, describe and interpret data as 2-way tables, double column graphs and sector graphs, including from digital media.
End Year 8 Compare, interpret and assess the effectiveness of different data displays of the same information.
End Year 10 Evaluate media statistics and trends by linking claims to data displays, statistics and representative data.
Source: ACARA, Australian Curriculum: Mathematics
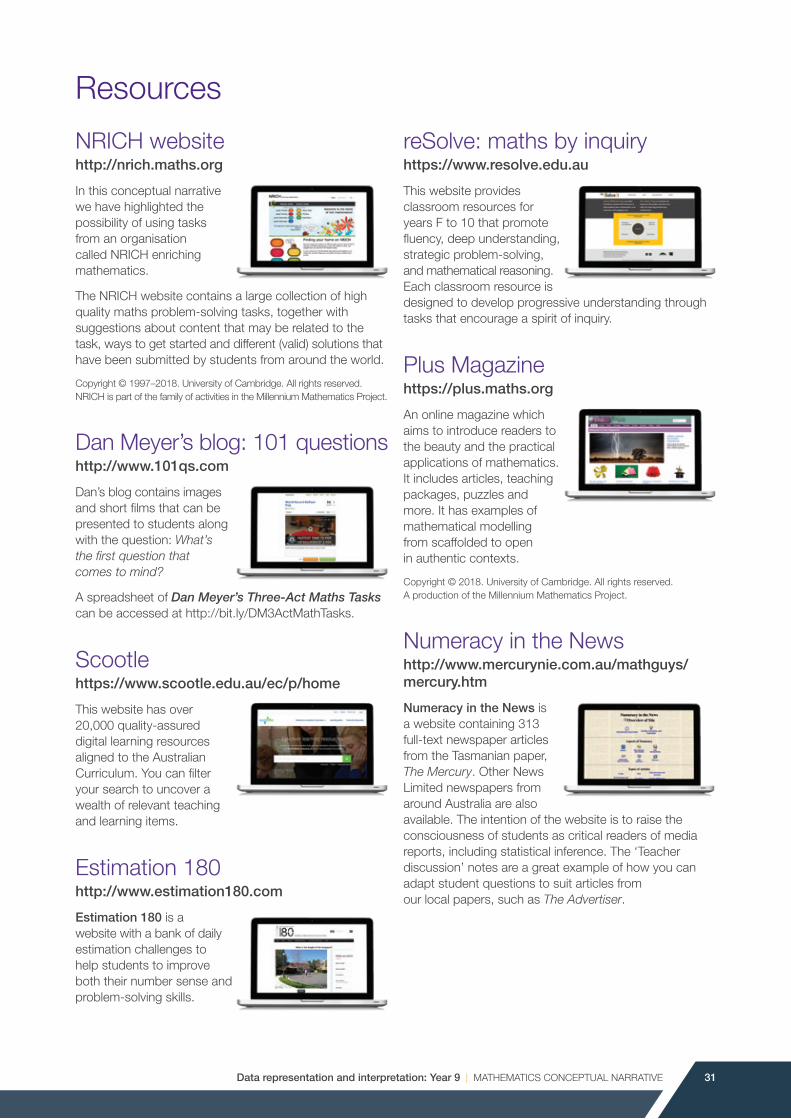
Data representation and interpretation: Year 9 | MATHEMATICS CONCEPTUAL NARRATIVE 31
Resources
NRICH websitehttp://nrich.maths.org
In this conceptual narrative we have highlighted the possibility of using tasks from an organisation called NRICH enriching mathematics.
The NRICH website contains a large collection of high quality maths problem-solving tasks, together with suggestions about content that may be related to the task, ways to get started and different (valid) solutions that have been submitted by students from around the world.
Copyright © 1997–2018. University of Cambridge. All rights reserved. NRICH is part of the family of activities in the Millennium Mathematics Project.
Dan Meyer’s blog: 101 questionshttp://www.101qs.com
Dan’s blog contains images and short films that can be presented to students along with the question: What’s thefirstquestionthat comes to mind?
A spreadsheet of Dan Meyer’s Three-Act Maths Tasks can be accessed at http://bit.ly/DM3ActMathTasks.
Scootlehttps://www.scootle.edu.au/ec/p/home
This website has over 20,000 quality-assured digital learning resources aligned to the Australian Curriculum. You can filter your search to uncover a wealth of relevant teaching and learning items.
Estimation 180http://www.estimation180.com
Estimation 180 is a website with a bank of daily estimation challenges to help students to improve both their number sense and problem-solving skills.
reSolve: maths by inquiryhttps://www.resolve.edu.au
This website provides classroom resources for years F to 10 that promote fluency, deep understanding, strategic problem-solving, and mathematical reasoning. Each classroom resource is designed to develop progressive understanding through tasks that encourage a spirit of inquiry.
Plus Magazine https://plus.maths.org
An online magazine which aims to introduce readers to the beauty and the practical applications of mathematics. It includes articles, teaching packages, puzzles and more. It has examples of mathematical modelling from scaffolded to open in authentic contexts.
Copyright © 2018. University of Cambridge. All rights reserved. A production of the Millennium Mathematics Project.
Numeracy in the Newshttp://www.mercurynie.com.au/mathguys/mercury.htm
Numeracy in the News is a website containing 313 full-text newspaper articles from the Tasmanian paper, The Mercury. Other News Limited newspapers from around Australia are also available. The intention of the website is to raise the consciousness of students as critical readers of media reports, including statistical inference. The ‘Teacher discussion’ notes are a great example of how you can adapt student questions to suit articles from our local papers, such as The Advertiser.
Data representation and interpretation: Year 9 | MATHEMATICS CONCEPTUAL NARRATIVE32
TIMES moduleshttp://schools.amsi.org.au/times-modules/
TIMES modules are prepared by the Australian Mathematical Sciences Institute (AMSI) as part of The Improving Mathematics Education in Schools (TIMES) Project. The ‘Data investigation and interpretation’ module has been developed for Foundation to Year 10, and is a great knowledge source for teachers, modelling good analysis and inference reports.
Top drawer teachers – resources for teachers of mathematics (statistics)http://topdrawer.aamt.edu.au/Statistics
This website by the Australian Association of Mathematics Teachers, provides expert mathematics advice, teaching suggestions and classroom activities. Each ‘drawer’ is divided into sections: Big ideas, Misunderstandings, Good teaching, Assessment, and Activities.
Double Helix Extrahttps://blog.doublehelix.csiro.au/
This CSIRO Double Helix Extra is a free fortnightly email newsletter featuring mathematics news and activities. It includes a quiz, brainteaser, news and a classic hands-on activity.
CensusAtSchool NZhttp://new.censusatschool.org.nz/tools/random-sampler/
CensusAtSchool NZ is part of a global project that provides a random sampler and additional resources for teaching statistics. It aims to:
• ‘foster a positive attitude to statistics through using data that is both relevant and real
• improveunderstandingofadatagatheringprocess, itspurposesandbenefitstosociety
• provideaccesstolargeandmeaningfulmultivariatedata sets
• encourageeffectiveITteachingandlearning
• enhancetheprocessofstatisticalenquiryacross thecurriculum.’

Data representation and interpretation: Year 9 | MATHEMATICS CONCEPTUAL NARRATIVE 33
Notes

Data representation and interpretation: Year 9 | MATHEMATICS CONCEPTUAL NARRATIVE34

Data representation and interpretation: Year 9 | MATHEMATICS CONCEPTUAL NARRATIVE 35
Do you want to feel more confident about the maths you are teaching?
Do you want activities that support you to embed the proficiencies?
Do you want your students thinking mathematically rather than just doing maths?
If you answered yes to any of these questions, then this resource is for you.
Packed full of examples, along with questions you can ask students as they engage in their learning, this resource supports you to develop confidence in teaching the Australian Curriculum: Mathematics.
© 2018 Government of South Australia, Department for Education Produced by the Learning Improvement division
Excluded from NEALS
Some photographs used throughout this publication are © Shutterstock submitters and are used under licence, no third party copying of these images is permitted.