data science and machine learning using python and scikit-learn
TRANSCRIPT
DATA SCIENCE AND MACHINELEARNING USING PYTHON AND
SCIKIT-LEARNASIM JALIS
GALVANIZE

INTRO

ASIM JALISGalvanize/Zipfian, DataEngineeringCloudera, Microso!,SalesforceMS in Computer Sciencefrom University ofVirginia
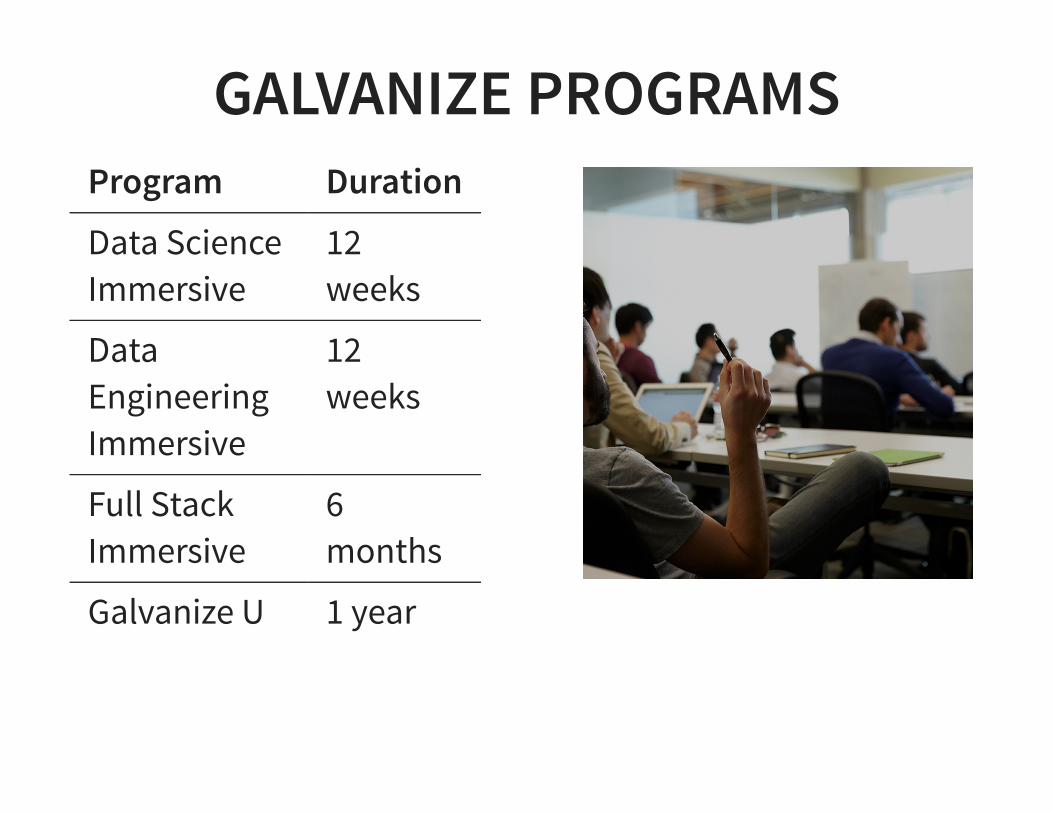
GALVANIZE PROGRAMSProgram Duration
Data ScienceImmersive
12weeks
DataEngineeringImmersive
12weeks
Full StackImmersive
6months
Galvanize U 1 year

YOU GET TO . . .Immersive GroupLearningMaster High-DemandSkills and TechnologiesIntense Focus on Hiringand OutcomesLevel UP your Career


WORKSHOP OVERVIEW
WHAT IS THIS WORKSHOPABOUT?
Using Data Science andMachine LearningBuilding ClassifiersUsing Python and scikit-LearnBy the end of theworkshop you will beable to build MachineLearning ClassificationSystems
HOW MANY PEOPLE HERE HAVEUSED MACHINE LEARNING
ALGORITHMS?

HOW MANY PEOPLE HERE HAVEUSED PYTHON?

HOW MANY PEOPLE HERE HAVEUSED IPYTHON?
HOW MANY PEOPLE HERE HAVEUSED SCIKIT-LEARN?
OUTLINEWhat is Data Science and Machine Learning?What is scikit-learn? Why its super helpful?What kinds of problems can we solve with this stuff?

DATA SCIENCE

WHY MACHINE LEARNINGEXCITING
Self-driving carsVoice recognitionAlphaGo
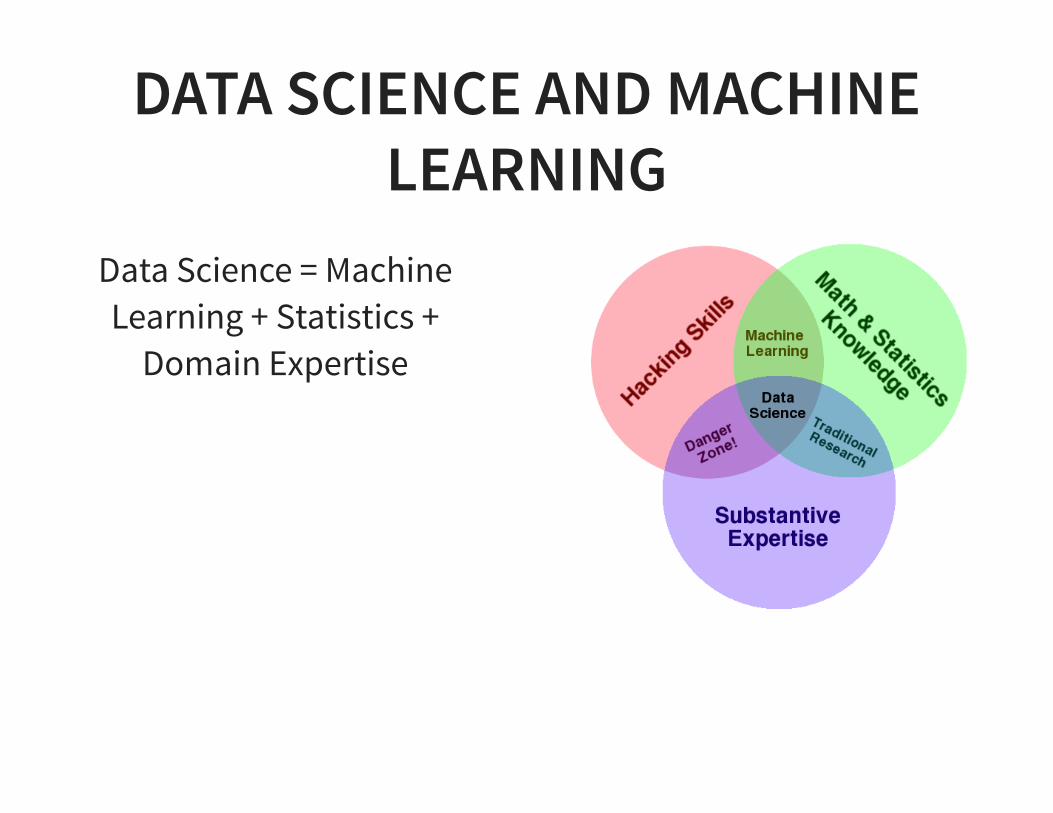
DATA SCIENCE AND MACHINELEARNING
Data Science = MachineLearning + Statistics +
Domain Expertise
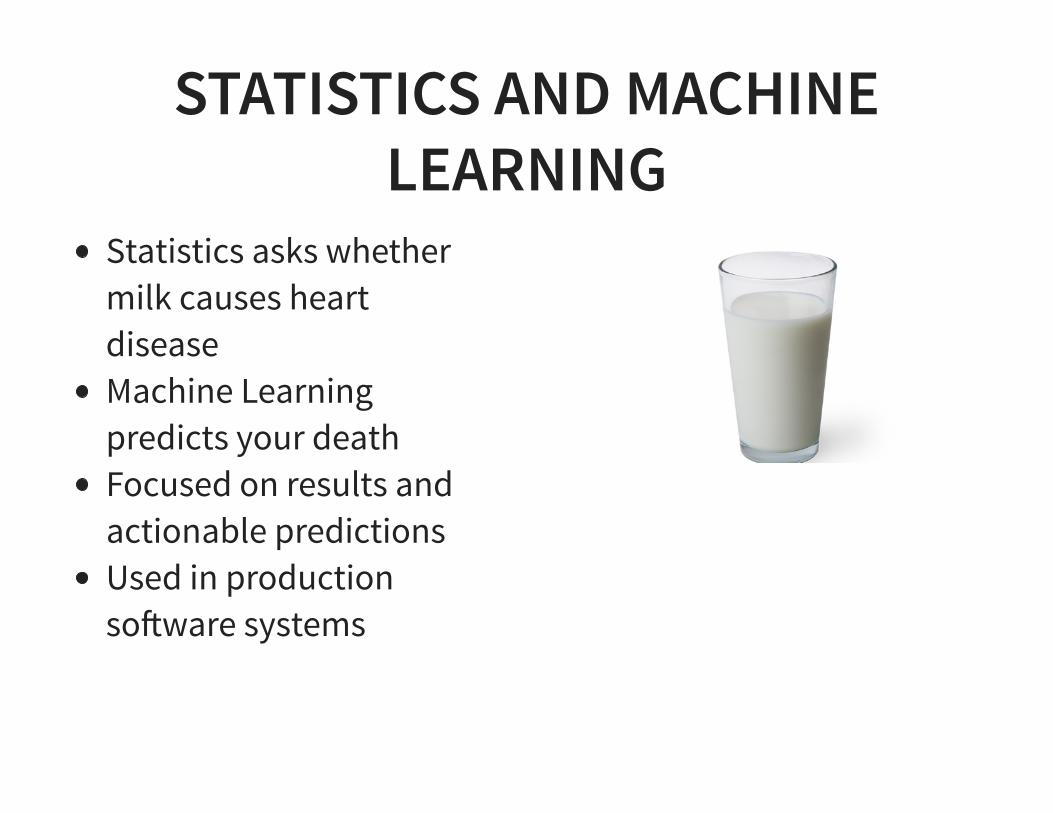
STATISTICS AND MACHINELEARNING
Statistics asks whethermilk causes heartdiseaseMachine Learningpredicts your deathFocused on results andactionable predictionsUsed in productionso!ware systems
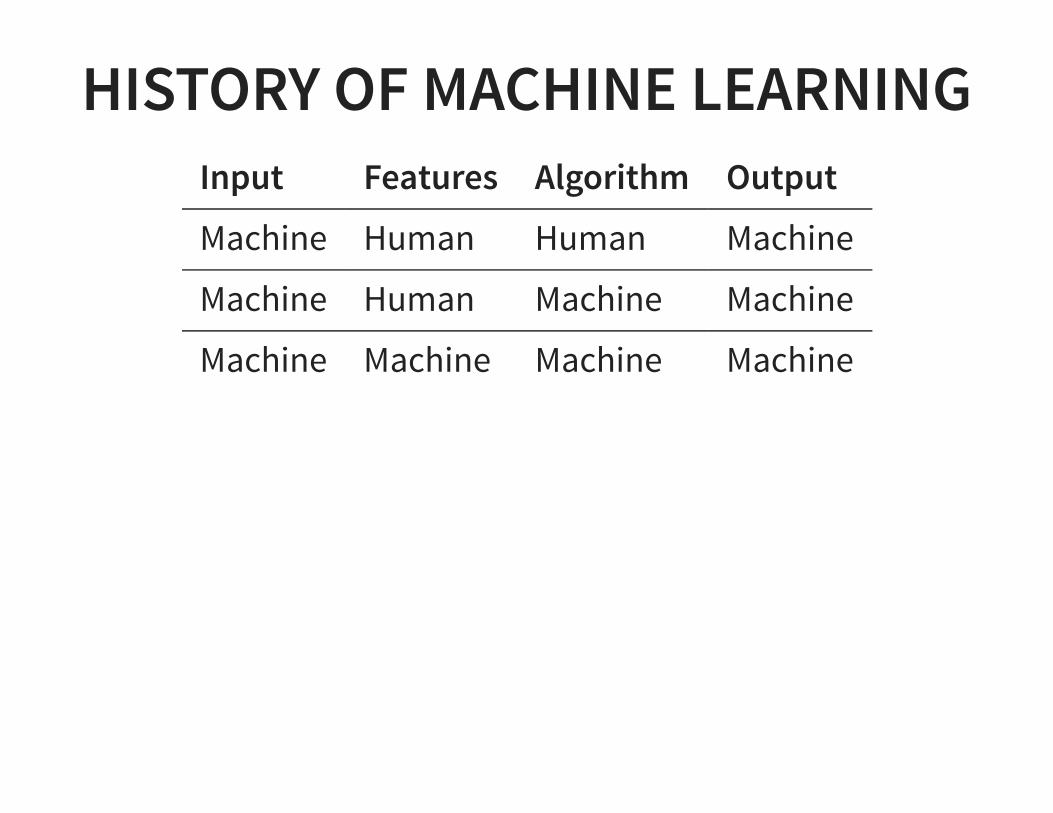
HISTORY OF MACHINE LEARNINGInput Features Algorithm Output
Machine Human Human Machine
Machine Human Machine Machine
Machine Machine Machine Machine
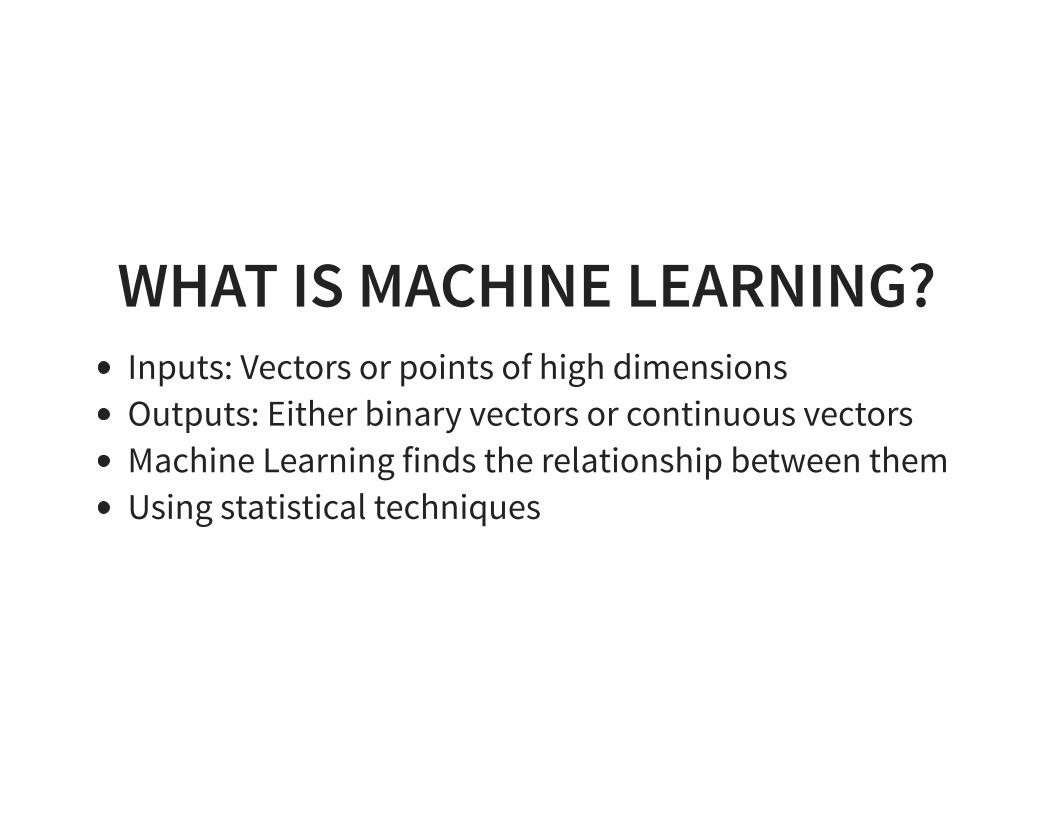
WHAT IS MACHINE LEARNING?Inputs: Vectors or points of high dimensionsOutputs: Either binary vectors or continuous vectorsMachine Learning finds the relationship between themUsing statistical techniques
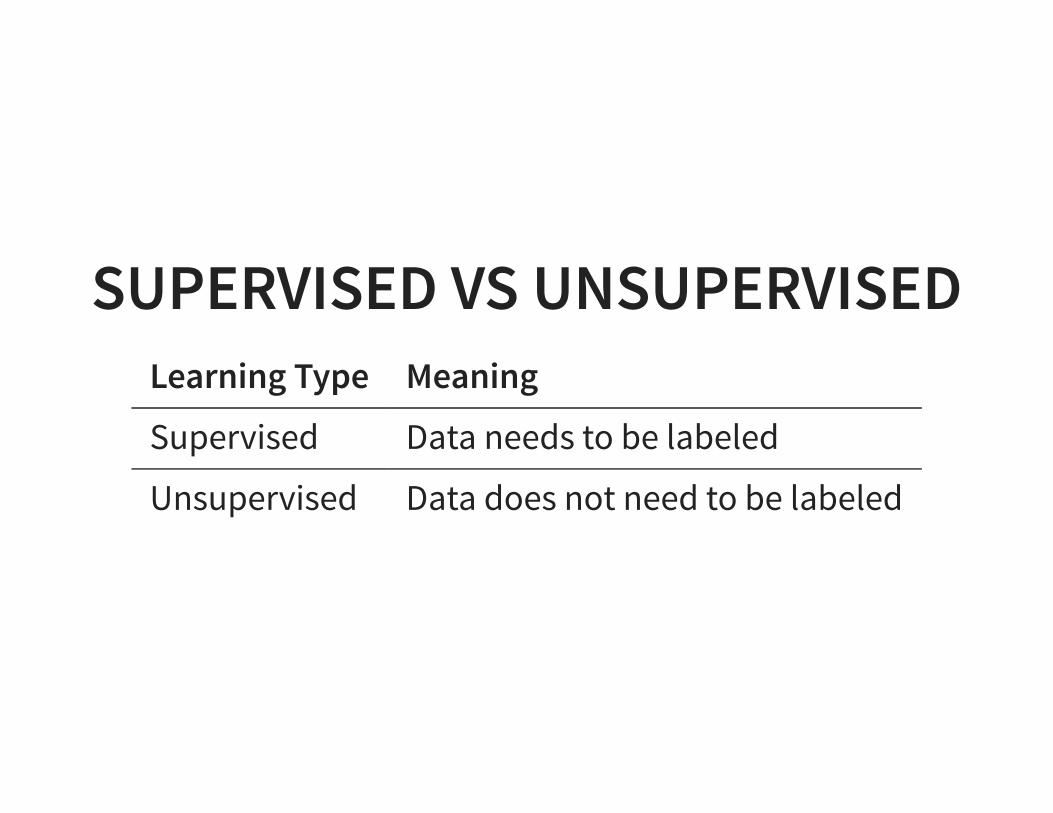
SUPERVISED VS UNSUPERVISEDLearning Type Meaning
Supervised Data needs to be labeled
Unsupervised Data does not need to be labeled
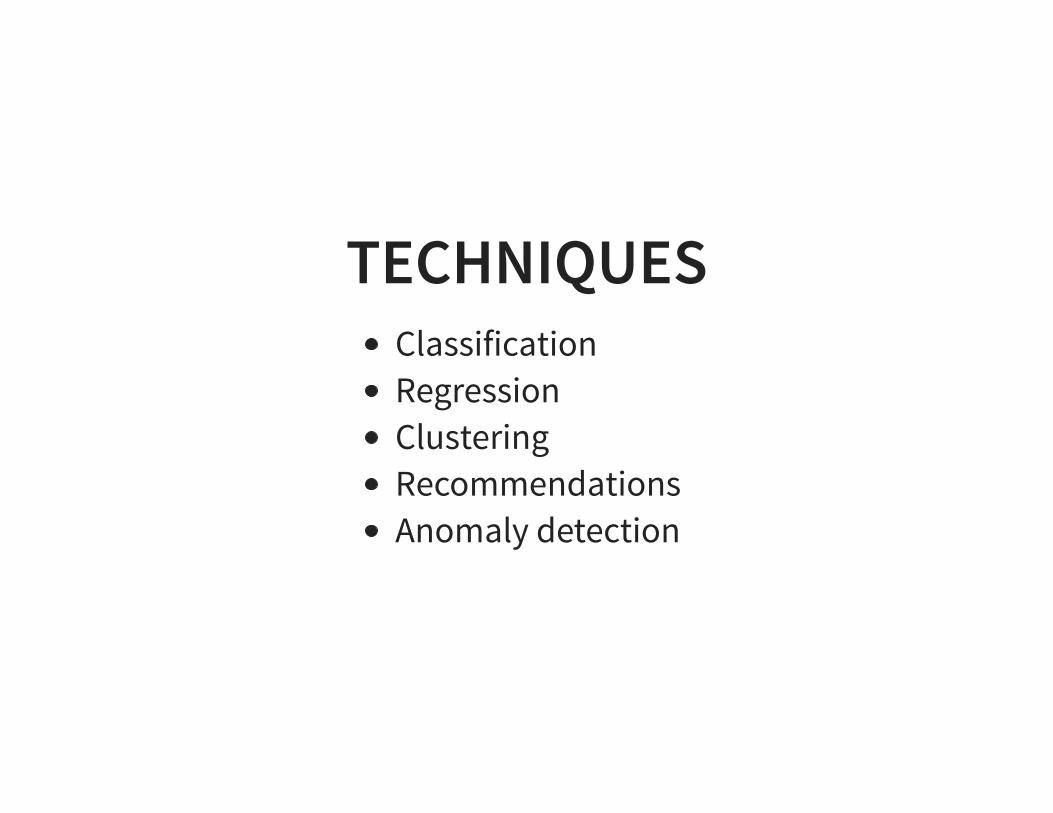
TECHNIQUESClassificationRegressionClusteringRecommendationsAnomaly detection

CLASSIFICATION EXAMPLE:EMAIL SPAM DETECTION
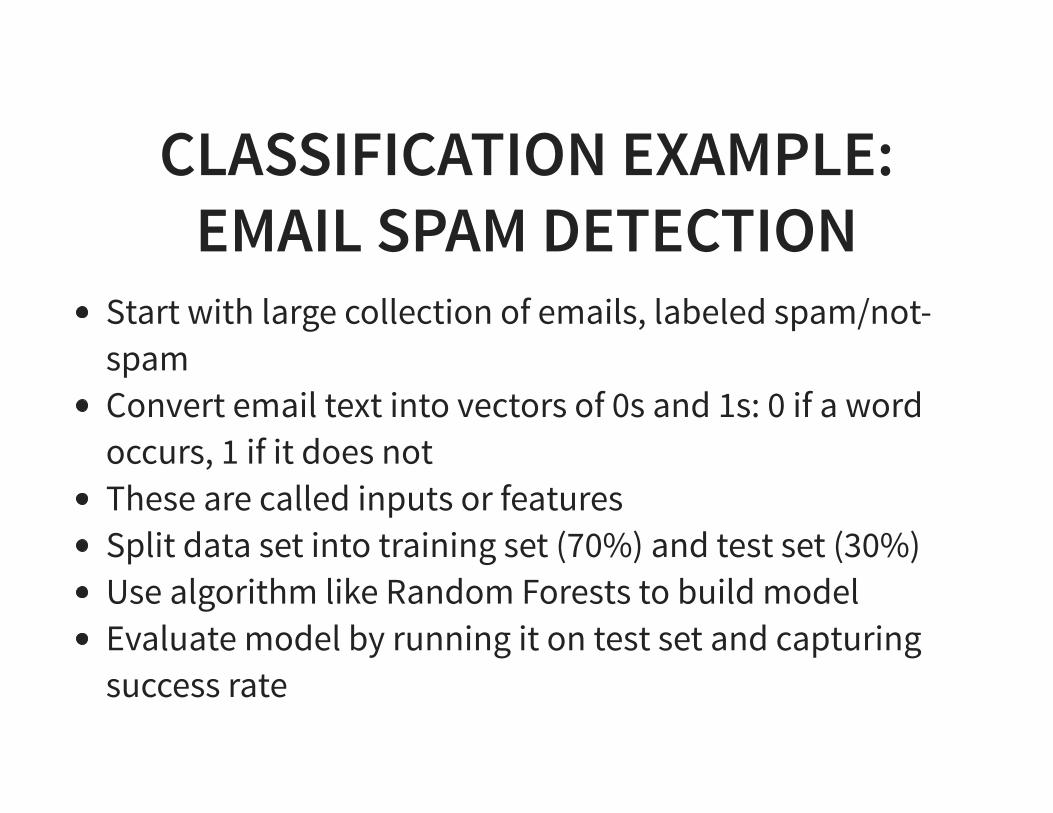
CLASSIFICATION EXAMPLE:EMAIL SPAM DETECTION
Start with large collection of emails, labeled spam/not-spamConvert email text into vectors of 0s and 1s: 0 if a wordoccurs, 1 if it does notThese are called inputs or featuresSplit data set into training set (70%) and test set (30%)Use algorithm like Random Forests to build modelEvaluate model by running it on test set and capturingsuccess rate
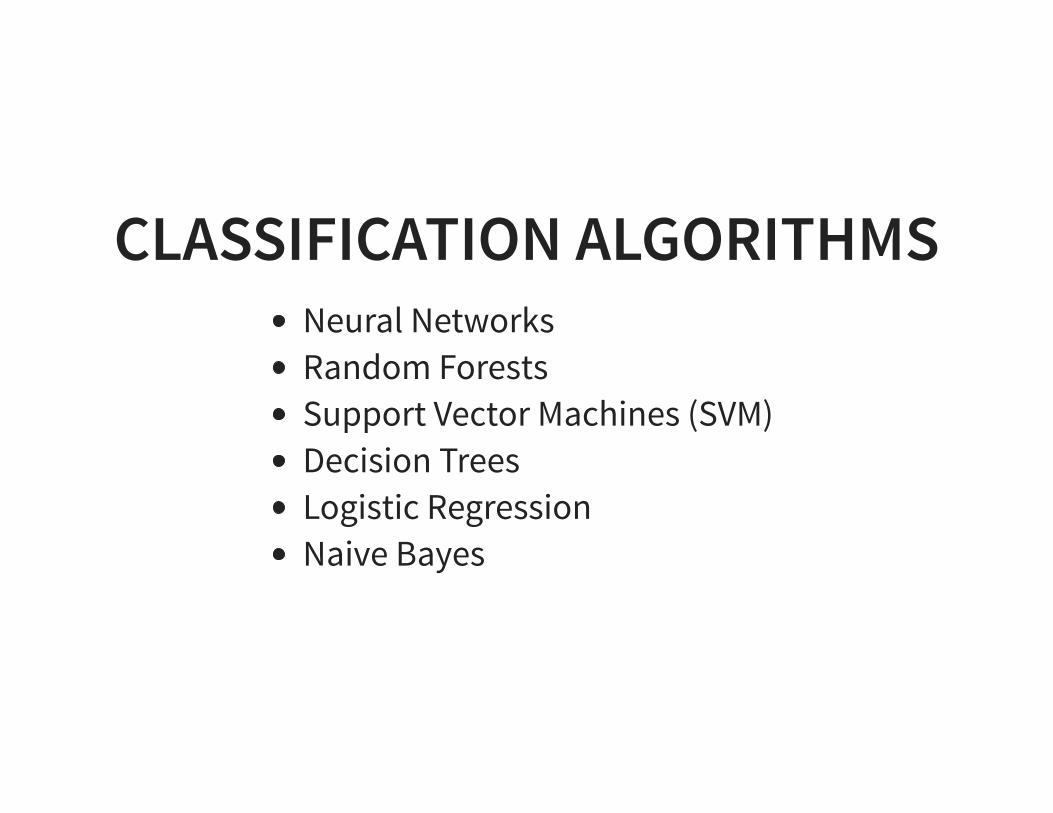
CLASSIFICATION ALGORITHMSNeural NetworksRandom ForestsSupport Vector Machines (SVM)Decision TreesLogistic RegressionNaive Bayes
CHOOSING ALGORITHMEvaluate different models on dataLook at the relative success ratesUse rules of thumb: some algorithms work better on somekinds of data
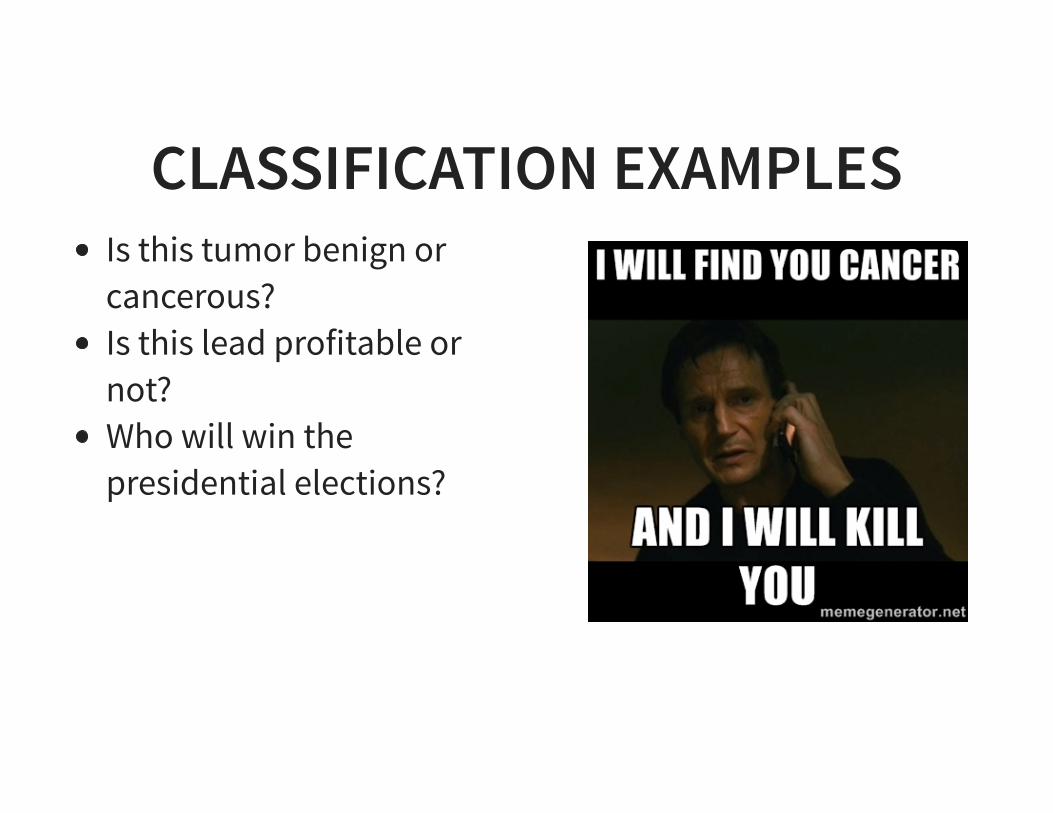
CLASSIFICATION EXAMPLESIs this tumor benign orcancerous?Is this lead profitable ornot?Who will win thepresidential elections?
CLASSIFICATION: POP QUIZIs classification supervised or unsupervised learning?
Supervised because you have to label the data.
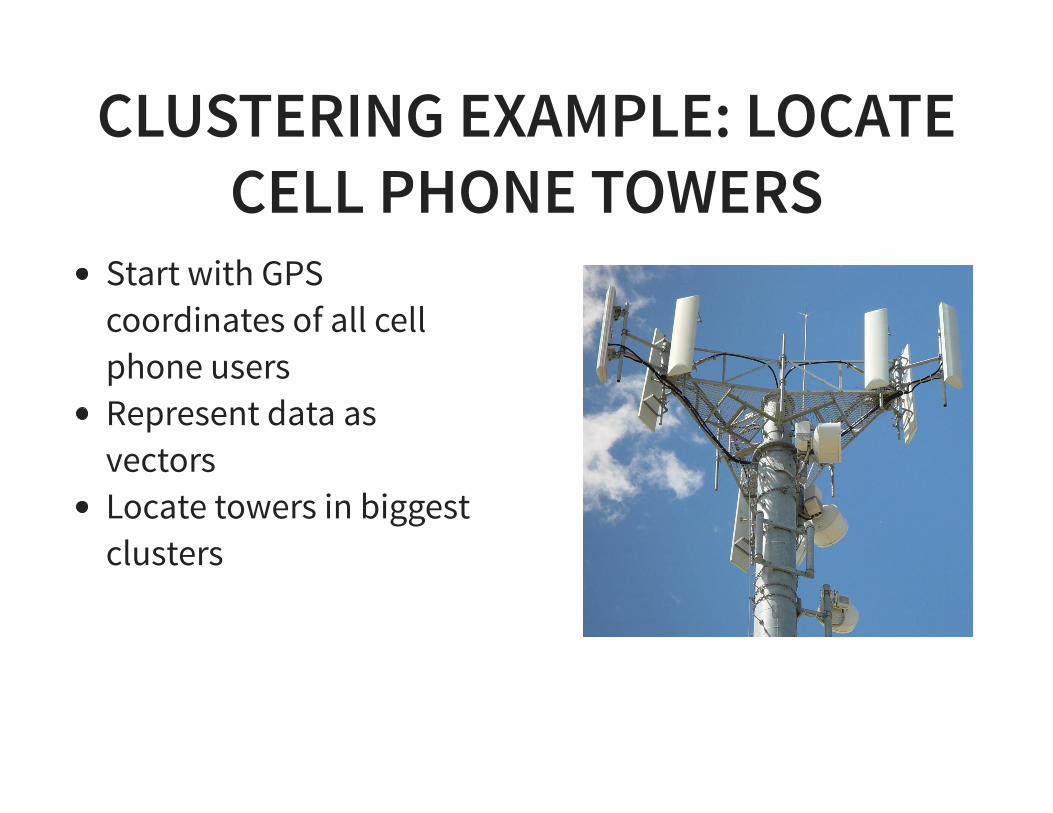
CLUSTERING EXAMPLE: LOCATECELL PHONE TOWERS
Start with GPScoordinates of all cellphone usersRepresent data asvectorsLocate towers in biggestclusters
CLUSTERING EXAMPLE: T-SHIRTSWhat size should a t-shirt be?Everyone’s real t-shirtsize is differentLay out all sizes andclusterTarget large clusterswith XS, S, M, L, XL
CLUSTERING: POP QUIZIs clustering supervised or unsupervised?
Unsupervised because no labeling is required
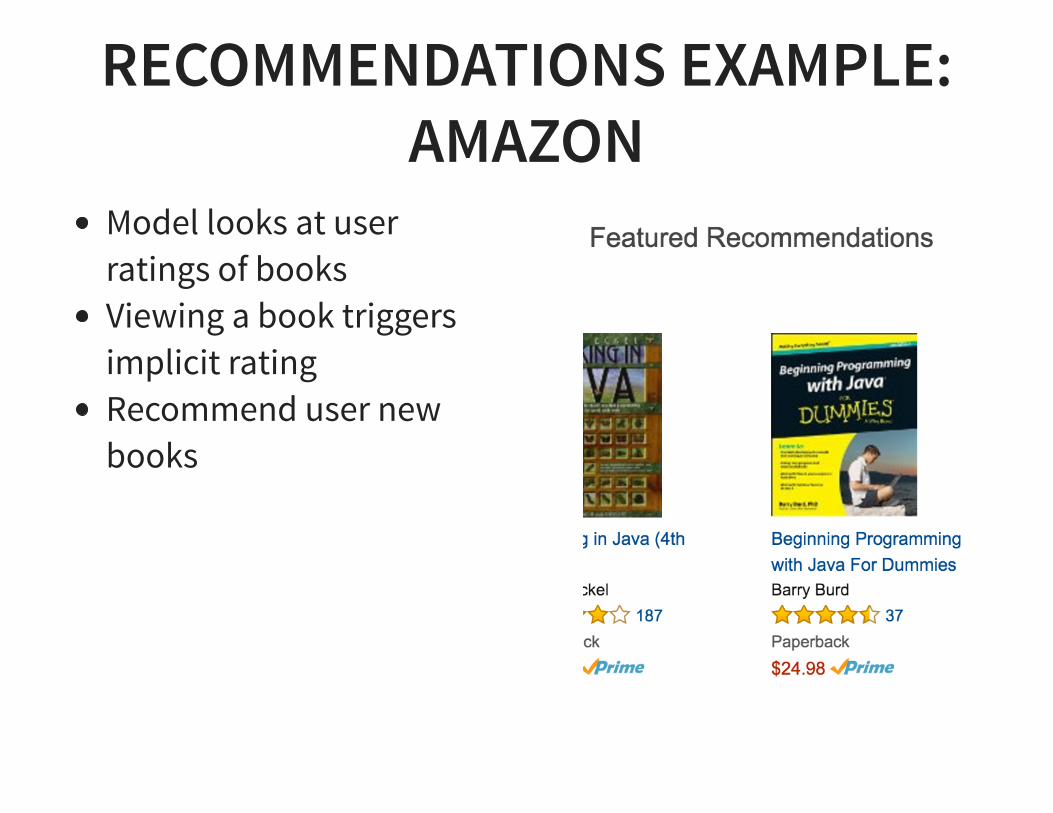
RECOMMENDATIONS EXAMPLE:AMAZON
Model looks at userratings of booksViewing a book triggersimplicit ratingRecommend user newbooks
RECOMMENDATION: POP QUIZAre recommendation systems supervised or unsupervised?
Unsupervised
REGRESSIONLike classificationOutput is continuous instead of one from k choices
REGRESSION EXAMPLESHow many units of product will sell next monthWhat will student score on SATWhat is the market price of this houseHow long before this engine needs repair
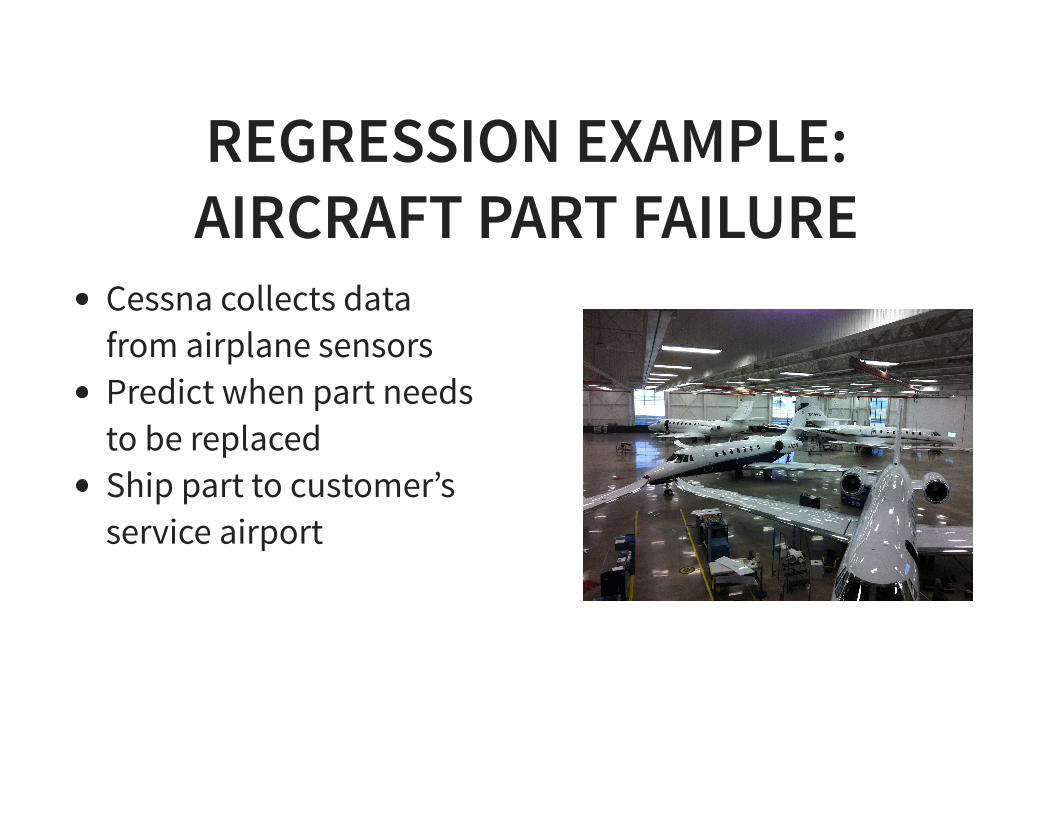
REGRESSION EXAMPLE:AIRCRAFT PART FAILURE
Cessna collects datafrom airplane sensorsPredict when part needsto be replacedShip part to customer’sservice airport
REGRESSION: POP QUIZIs regression supervised or unsupervised?
Supervised
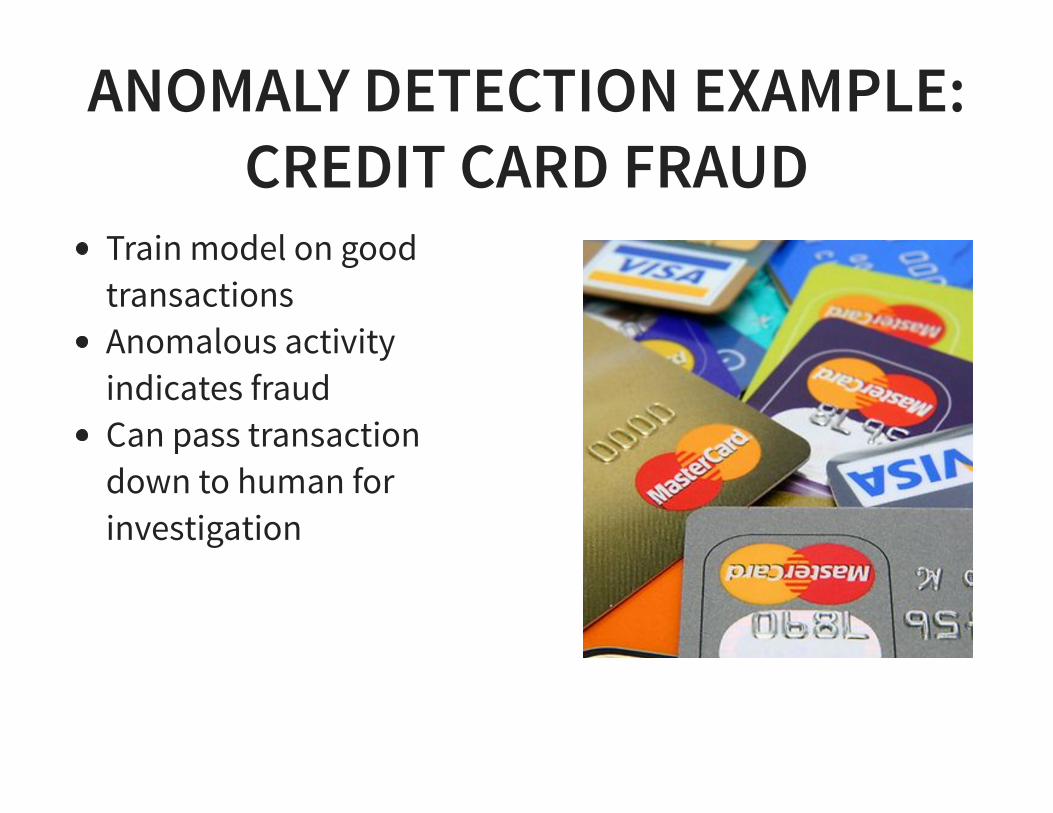
ANOMALY DETECTION EXAMPLE:CREDIT CARD FRAUD
Train model on goodtransactionsAnomalous activityindicates fraudCan pass transactiondown to human forinvestigation
ANOMALY DETECTION EXAMPLE:NETWORK INTRUSION
Train model on networklogin activityAnomalous activityindicates threatCan initiate alerts andlockdown procedures
ANOMALY DETECTION: POP QUIZIs anomaly detection supervised or unsupervised?
Unsupervised because we only train on normal data
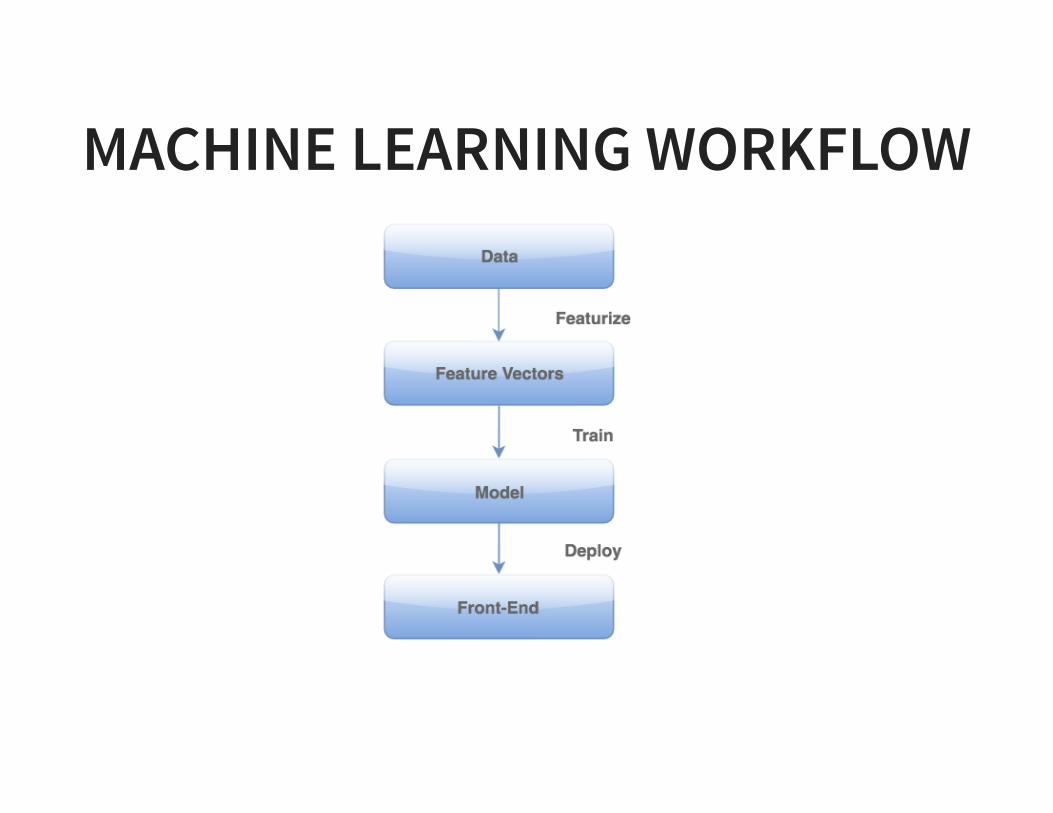
MACHINE LEARNING WORKFLOW

IPYTHON
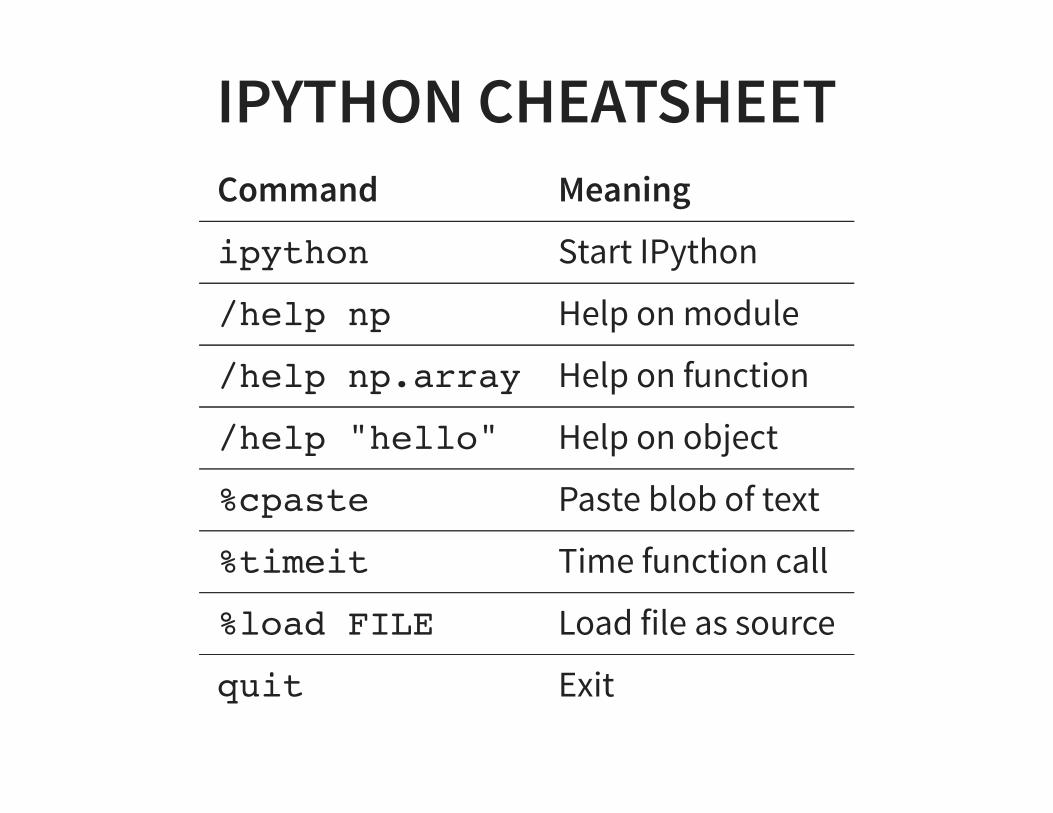
IPYTHON CHEATSHEETCommand Meaning
ipython Start IPython
/help np Help on module
/help np.array Help on function
/help "hello" Help on object
%cpaste Paste blob of text
%timeit Time function call
%load FILE Load file as source
quit Exit

WORKFLOW
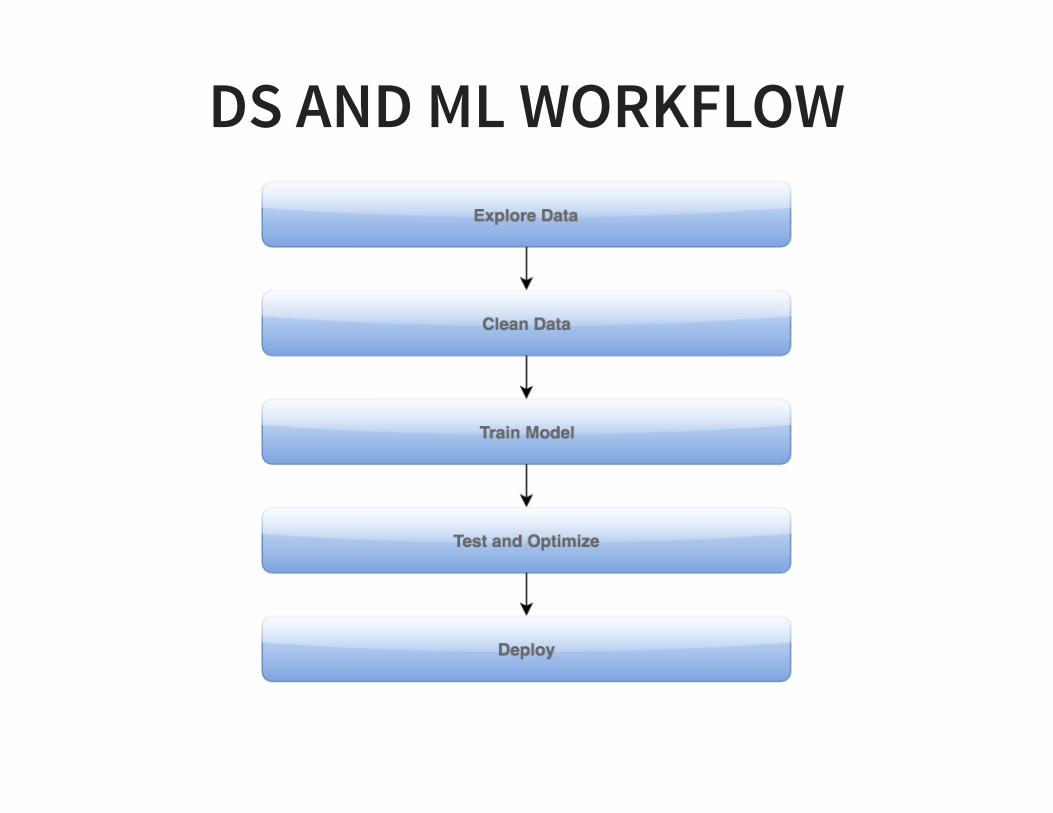
DS AND ML WORKFLOW

PANDAS SCIKIT-LEARN NUMPY
SCIKIT-LEARNDavid CournapeauIn 2007Google Summer of Codeproject
PANDASWes McKinneyIn 2008At AQR CapitalManagement
WHY PANDAS“I’m a data janitor.” —Josh WillsBig part of data scienceis data cleaningPandas is a power toolfor data cleaning
PANDAS AND NUMPYPandas and NumPy both hold dataPandas has column names as wellMakes it easier to manipulate data
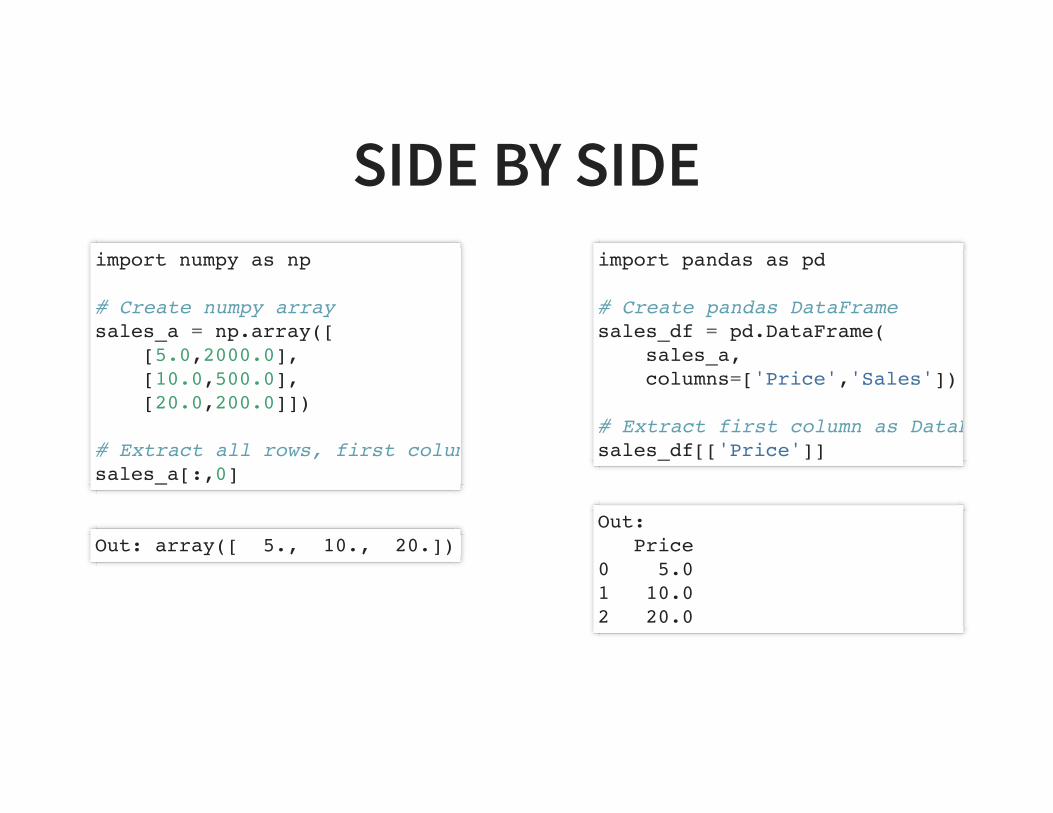
SIDE BY SIDEimport numpy as np
# Create numpy arraysales_a = np.array([ [5.0,2000.0], [10.0,500.0], [20.0,200.0]])
# Extract all rows, first columnsales_a[:,0]
Out: array([ 5., 10., 20.])
import pandas as pd
# Create pandas DataFramesales_df = pd.DataFrame( sales_a, columns=['Price','Sales'])
# Extract first column as DataFramesales_df[['Price']]
Out: Price0 5.01 10.02 20.0
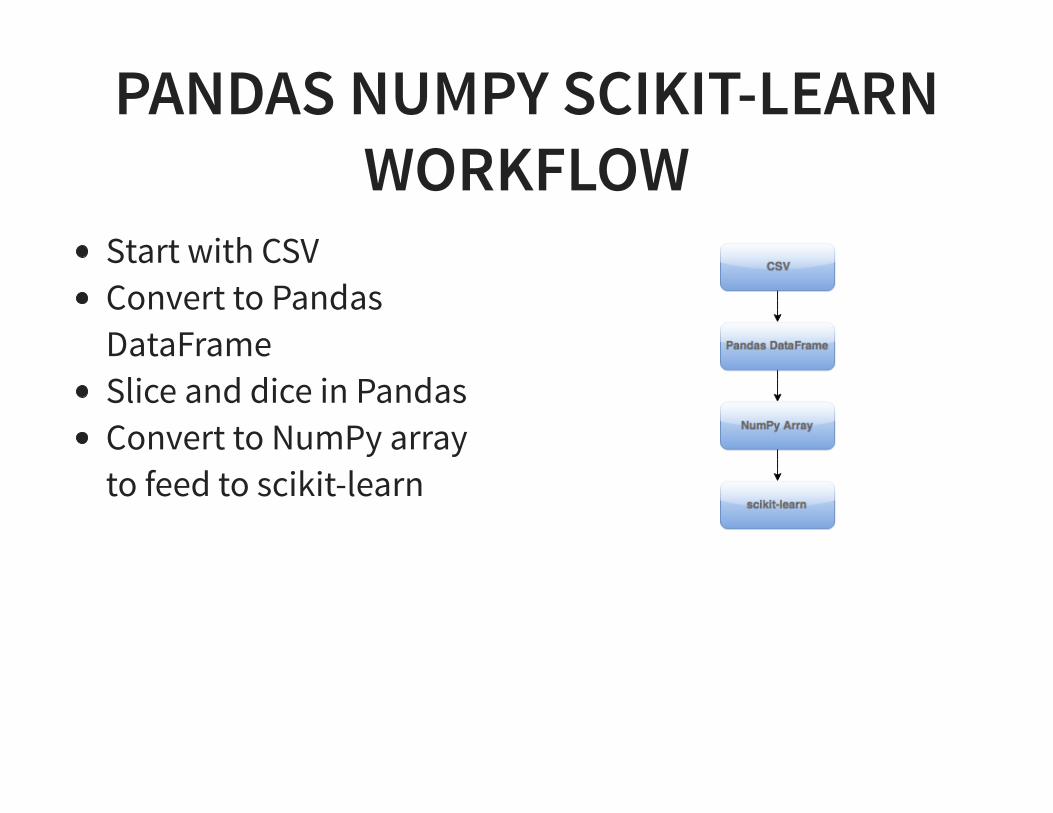
PANDAS NUMPY SCIKIT-LEARNWORKFLOW
Start with CSVConvert to PandasDataFrameSlice and dice in PandasConvert to NumPy arrayto feed to scikit-learn
ARRAYS VS PANDAS VS NUMPYNumPy is faster than PandasBoth are faster than normal Python arrays

PYTHON ARRAY SLICES
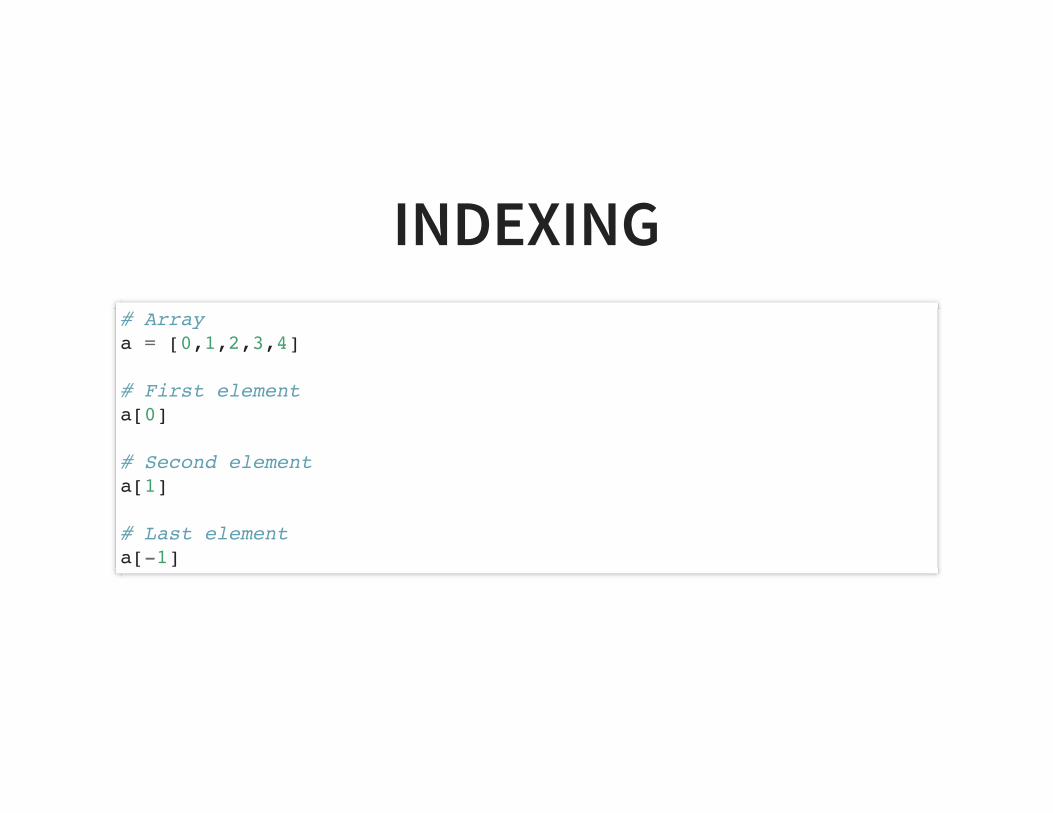
INDEXING# Arraya = [0,1,2,3,4]
# First elementa[0]
# Second elementa[1]
# Last elementa[-1]
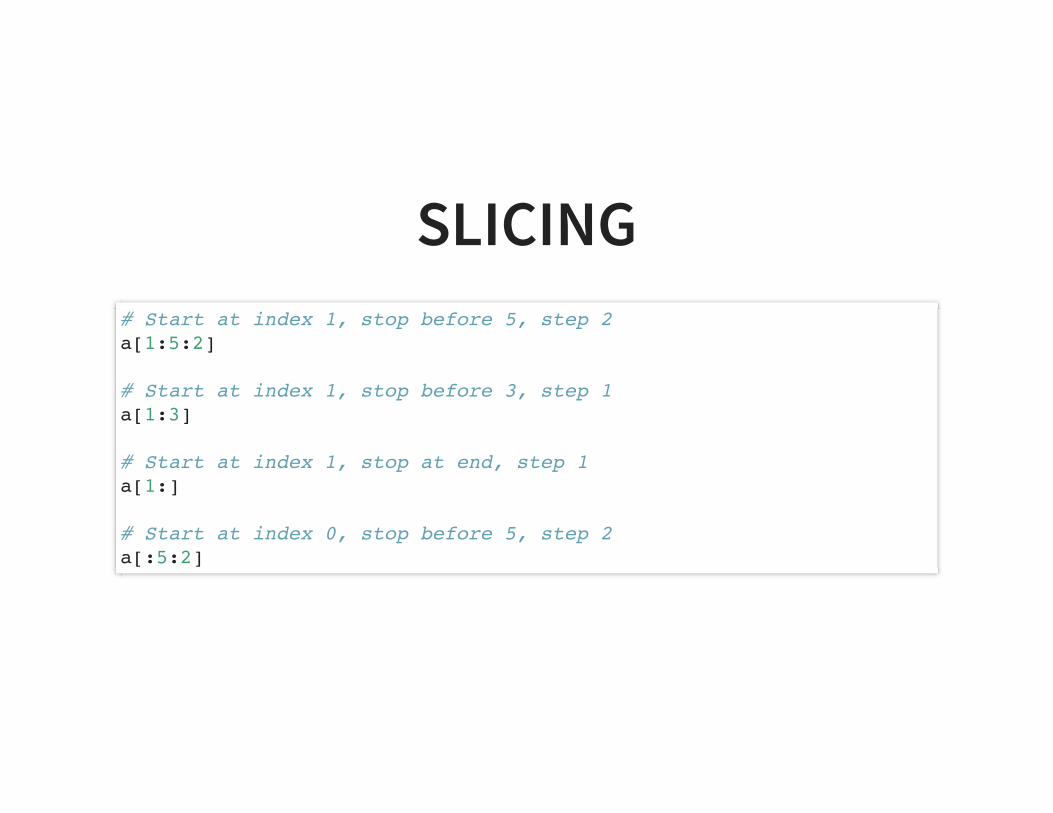
SLICING# Start at index 1, stop before 5, step 2a[1:5:2]
# Start at index 1, stop before 3, step 1a[1:3]
# Start at index 1, stop at end, step 1a[1:]
# Start at index 0, stop before 5, step 2a[:5:2]
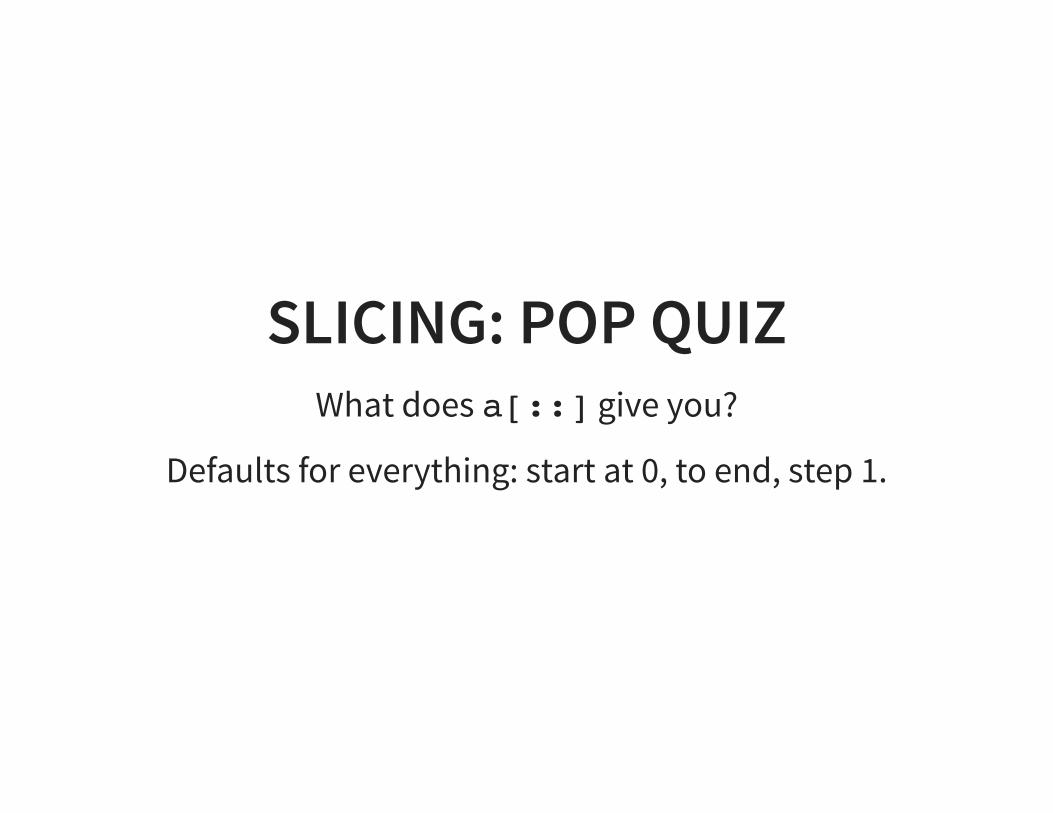
SLICING: POP QUIZWhat does a[::] give you?
Defaults for everything: start at 0, to end, step 1.

PANDAS
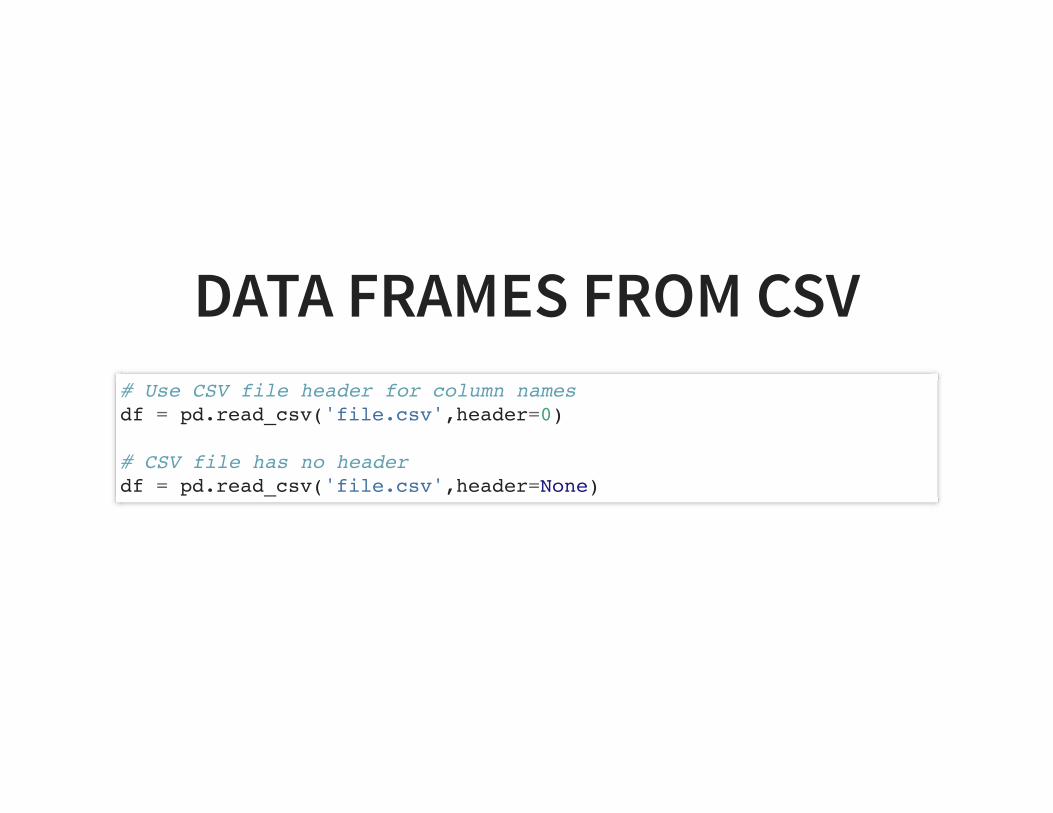
DATA FRAMES FROM CSV# Use CSV file header for column namesdf = pd.read_csv('file.csv',header=0)
# CSV file has no headerdf = pd.read_csv('file.csv',header=None)
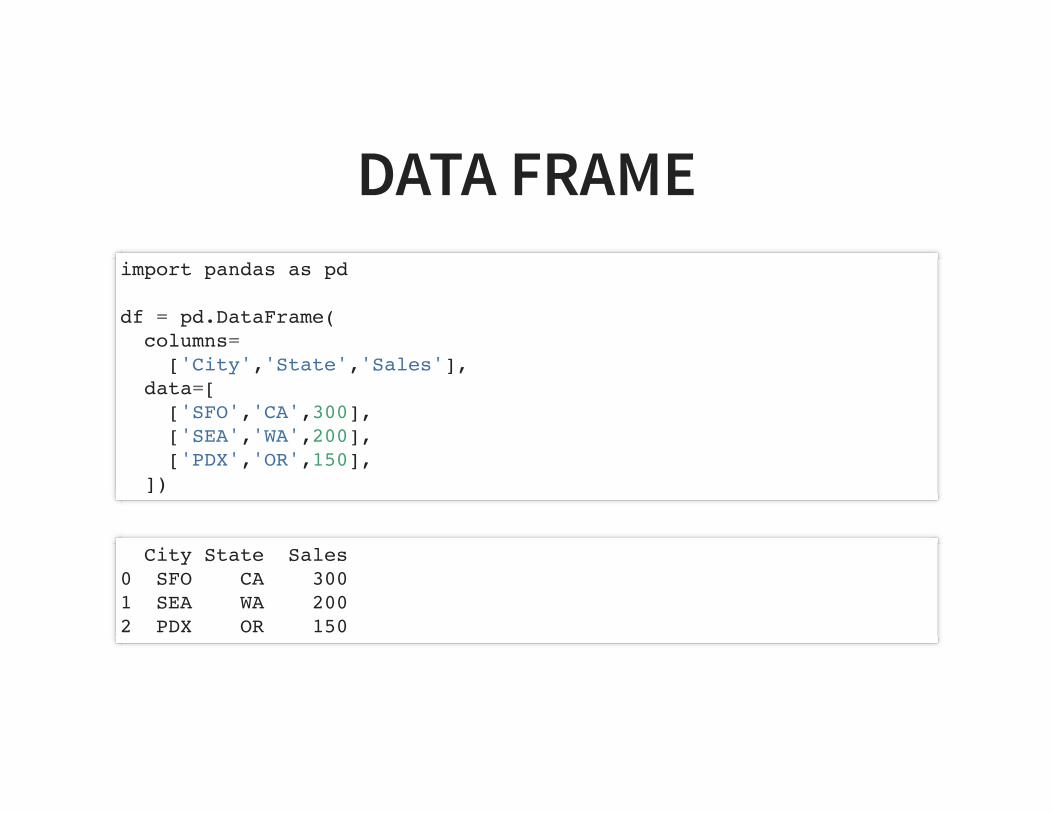
DATA FRAMEimport pandas as pd
df = pd.DataFrame( columns= ['City','State','Sales'], data=[ ['SFO','CA',300], ['SEA','WA',200], ['PDX','OR',150], ])
City State Sales0 SFO CA 3001 SEA WA 2002 PDX OR 150
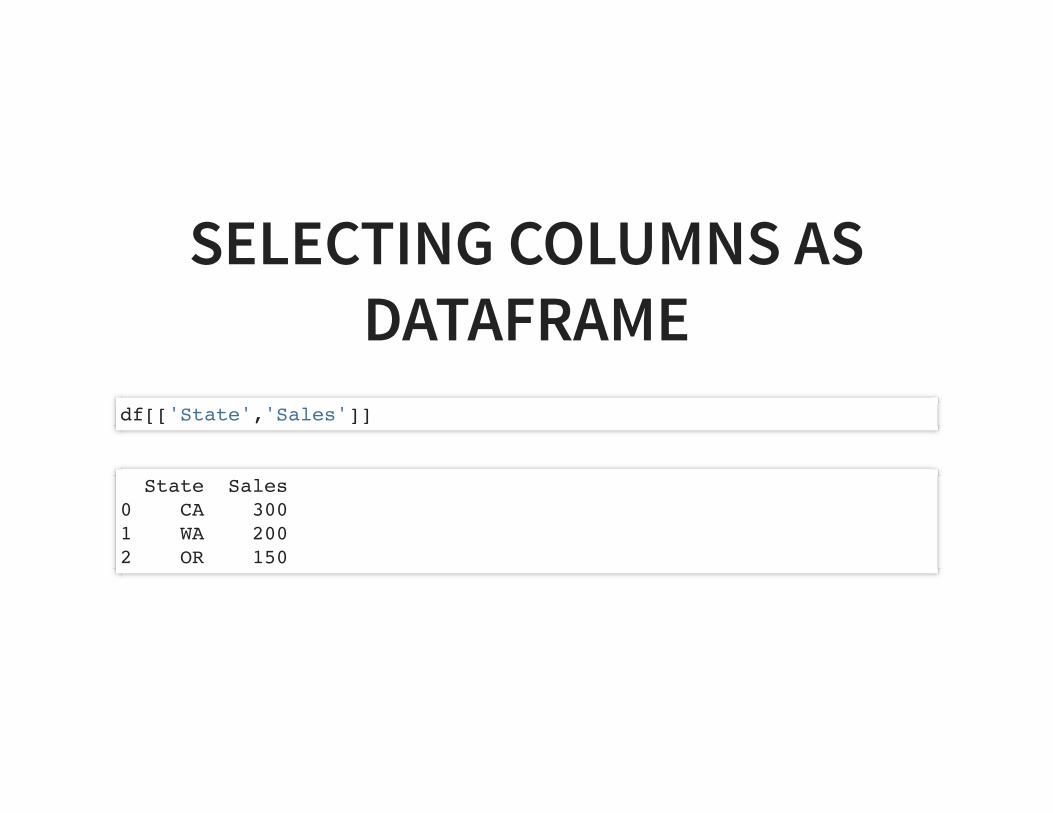
SELECTING COLUMNS ASDATAFRAME
df[['State','Sales']]
State Sales0 CA 3001 WA 2002 OR 150
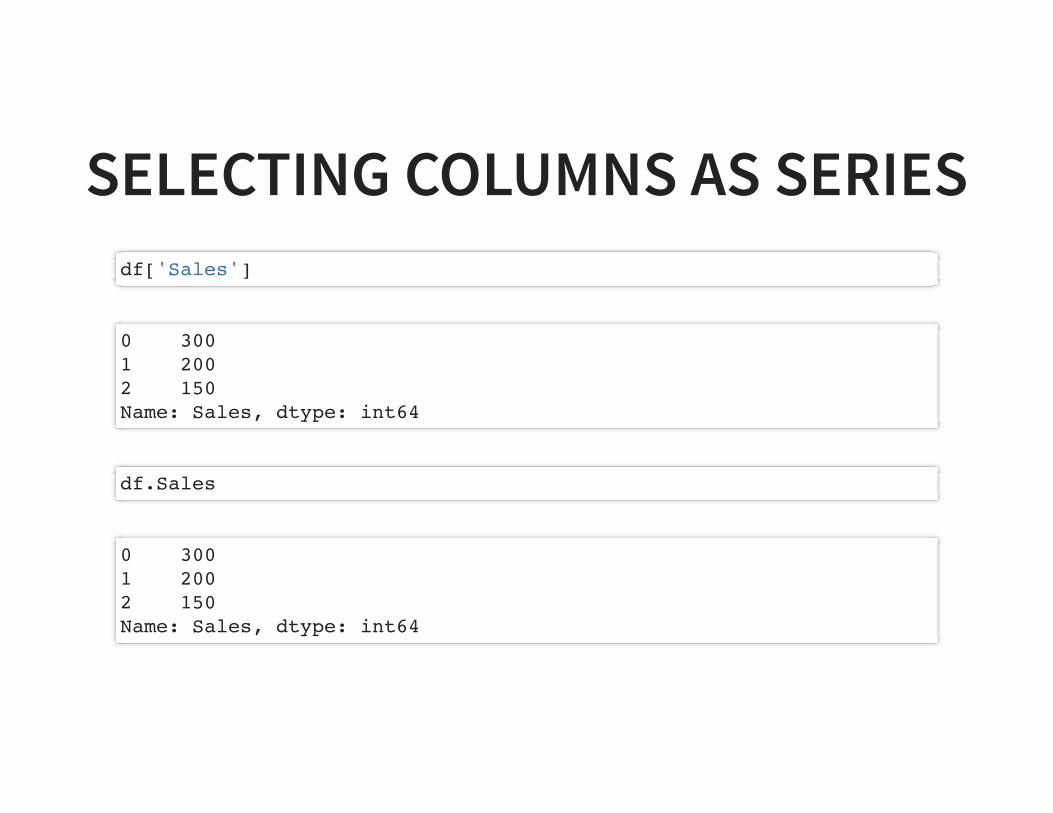
SELECTING COLUMNS AS SERIESdf['Sales']
0 3001 2002 150Name: Sales, dtype: int64
df.Sales
0 3001 2002 150Name: Sales, dtype: int64
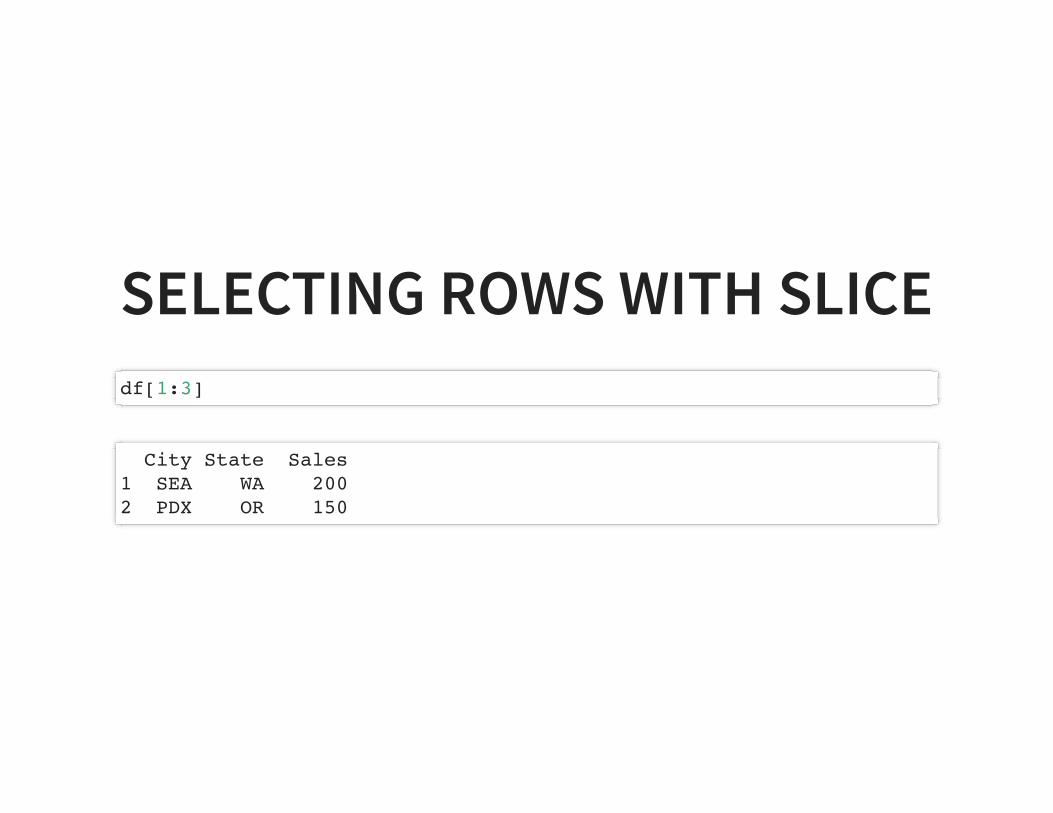
SELECTING ROWS WITH SLICEdf[1:3]
City State Sales1 SEA WA 2002 PDX OR 150
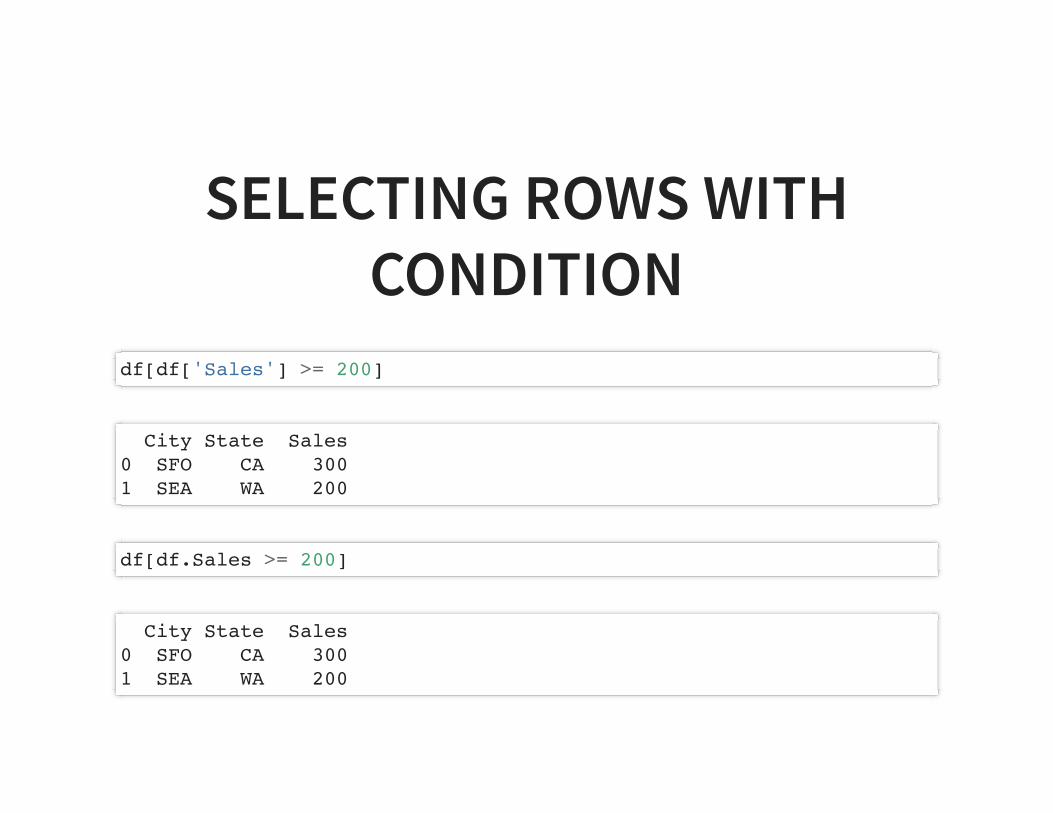
SELECTING ROWS WITHCONDITION
df[df['Sales'] >= 200]
City State Sales0 SFO CA 3001 SEA WA 200
df[df.Sales >= 200]
City State Sales0 SFO CA 3001 SEA WA 200
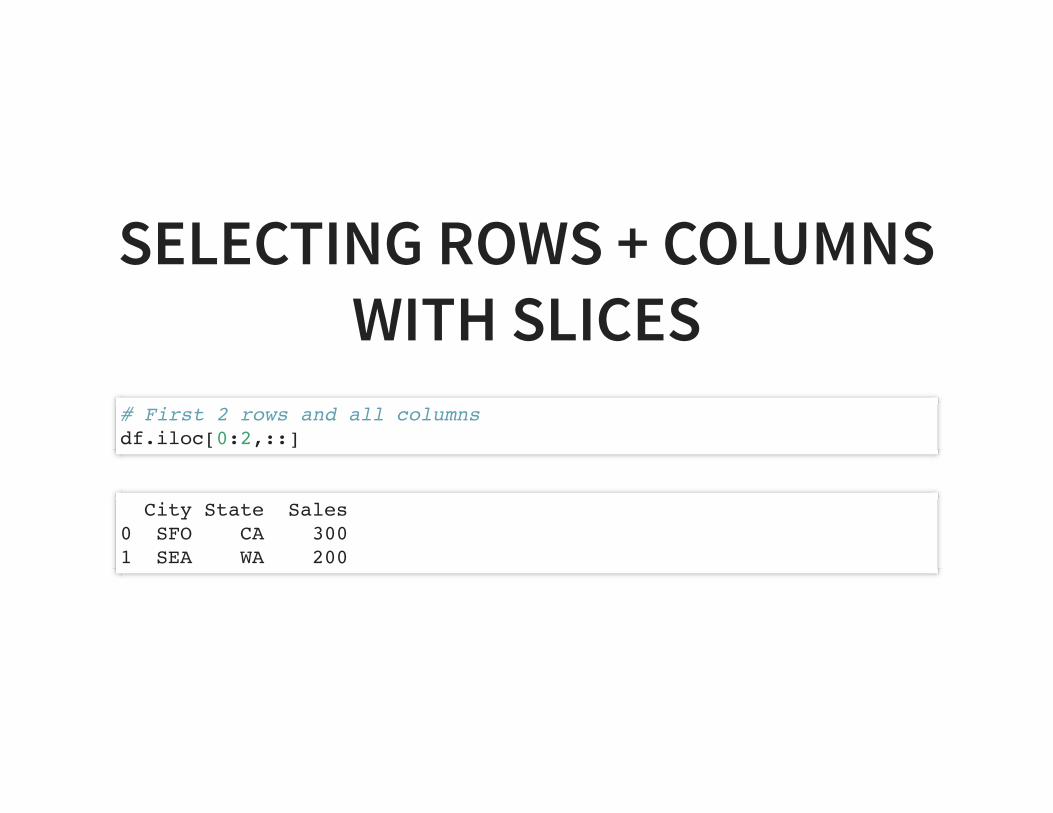
SELECTING ROWS + COLUMNSWITH SLICES
# First 2 rows and all columnsdf.iloc[0:2,::]
City State Sales0 SFO CA 3001 SEA WA 200
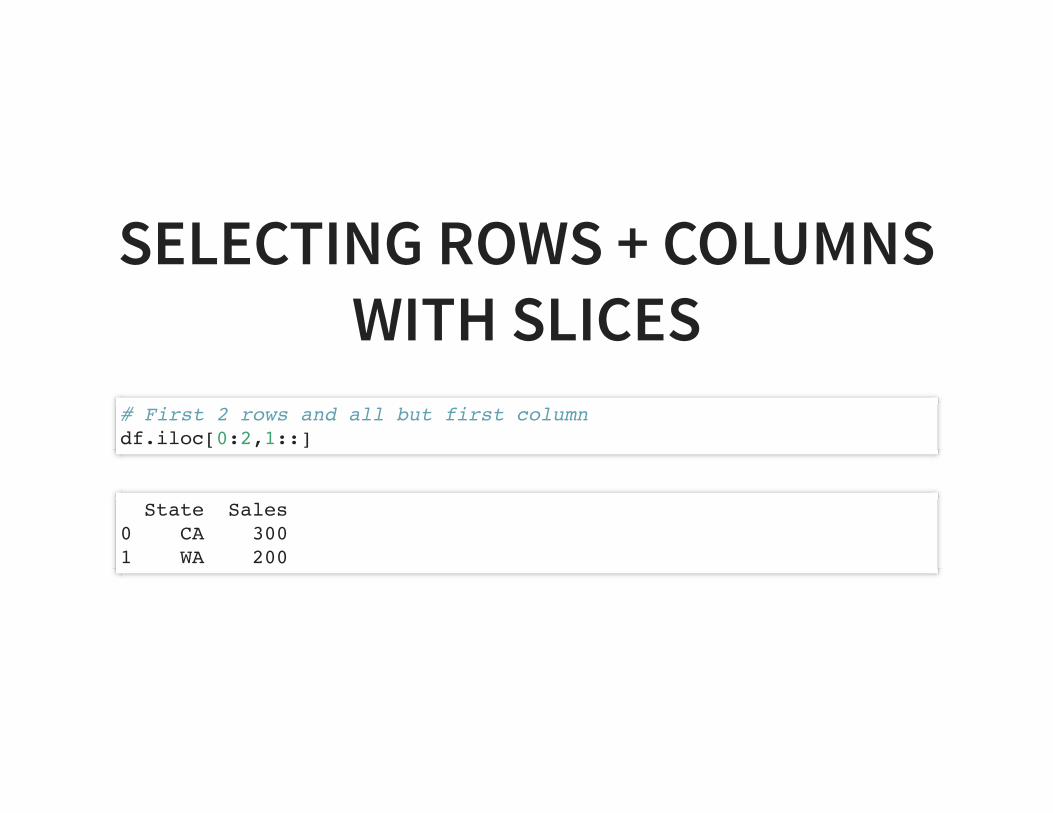
SELECTING ROWS + COLUMNSWITH SLICES
# First 2 rows and all but first columndf.iloc[0:2,1::]
State Sales0 CA 3001 WA 200
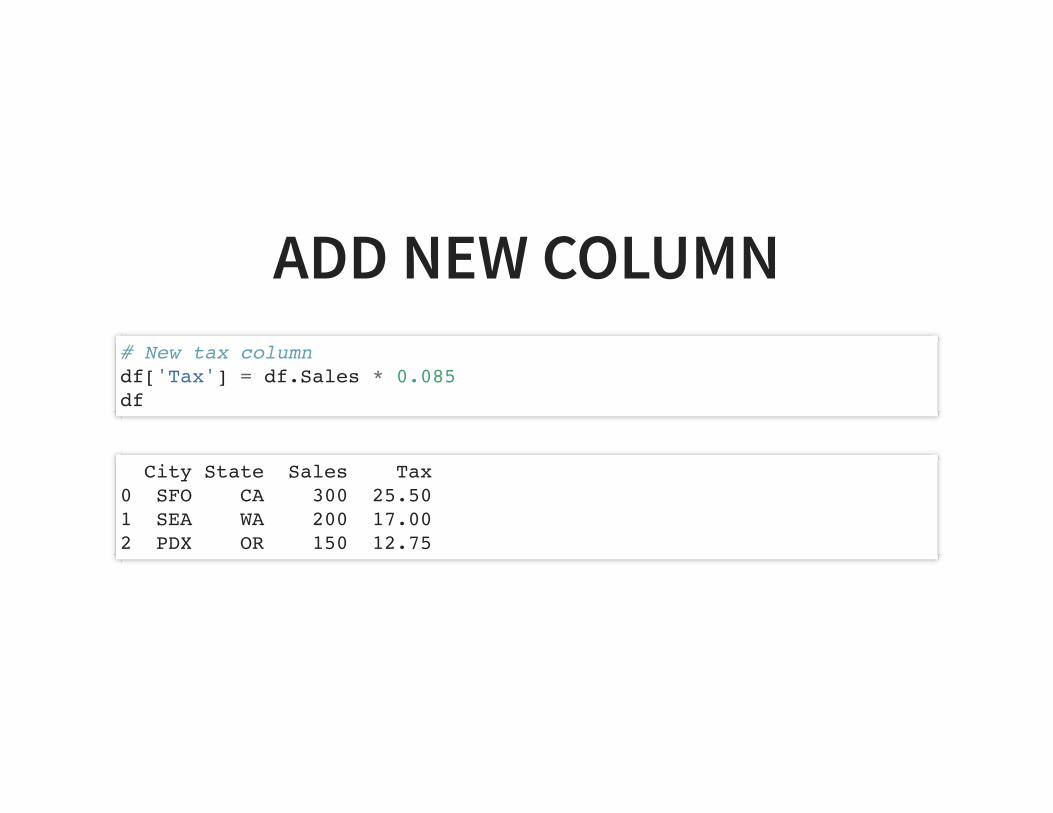
ADD NEW COLUMN# New tax columndf['Tax'] = df.Sales * 0.085df
City State Sales Tax0 SFO CA 300 25.501 SEA WA 200 17.002 PDX OR 150 12.75

ADD NEW BOOLEAN COLUMN# New boolean columndf['HighSales'] = (df.Sales >= 200)df
City State Sales Tax HighSales0 SFO CA 300 25.50 True1 SEA WA 200 17.00 True2 PDX OR 150 12.75 False
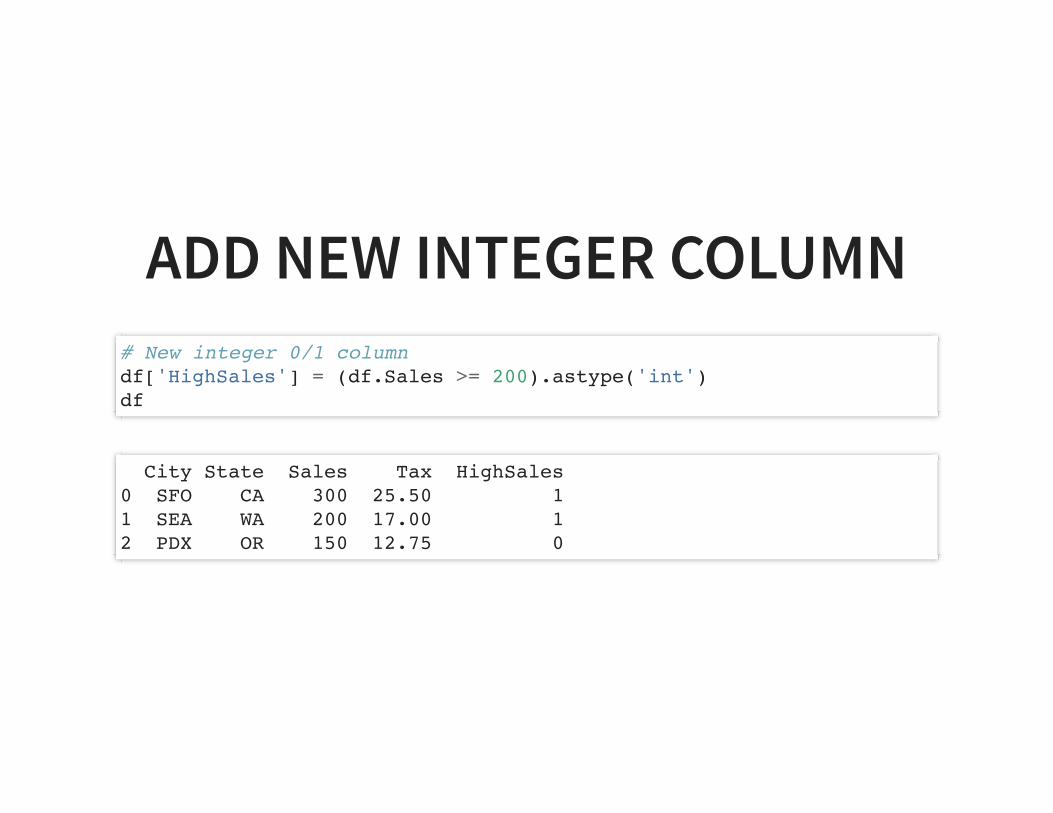
ADD NEW INTEGER COLUMN# New integer 0/1 columndf['HighSales'] = (df.Sales >= 200).astype('int')df
City State Sales Tax HighSales0 SFO CA 300 25.50 11 SEA WA 200 17.00 12 PDX OR 150 12.75 0
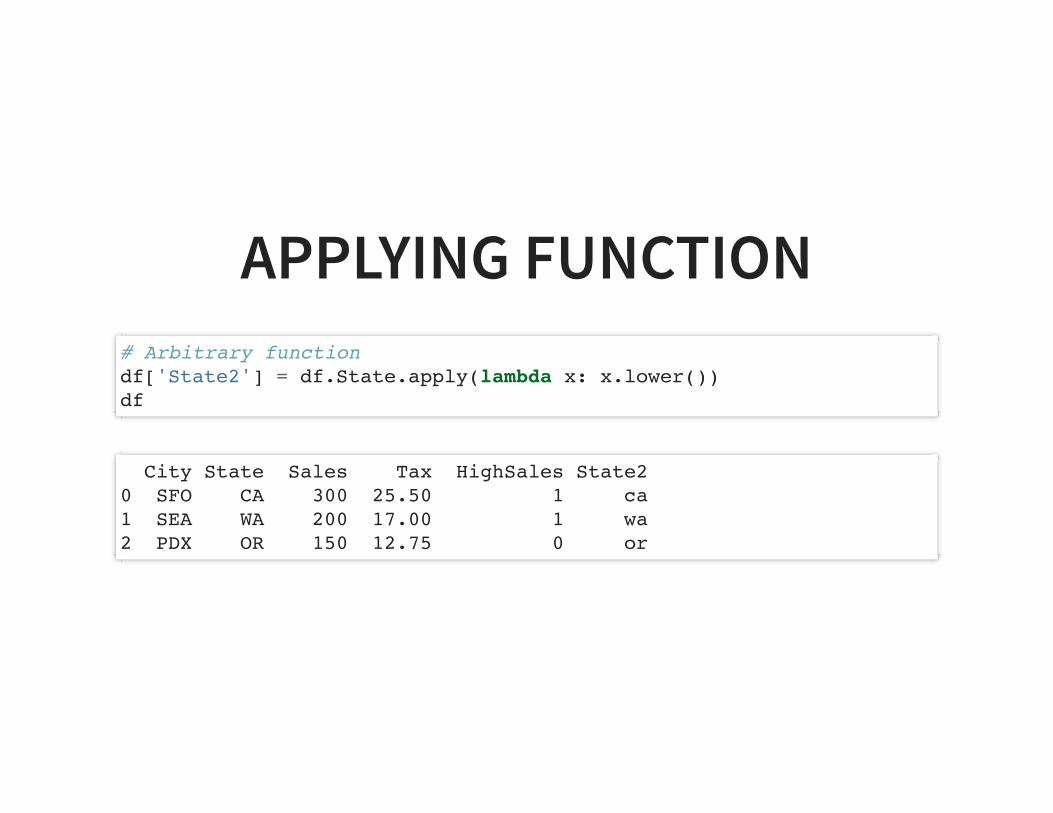
APPLYING FUNCTION# Arbitrary functiondf['State2'] = df.State.apply(lambda x: x.lower())df
City State Sales Tax HighSales State20 SFO CA 300 25.50 1 ca1 SEA WA 200 17.00 1 wa2 PDX OR 150 12.75 0 or
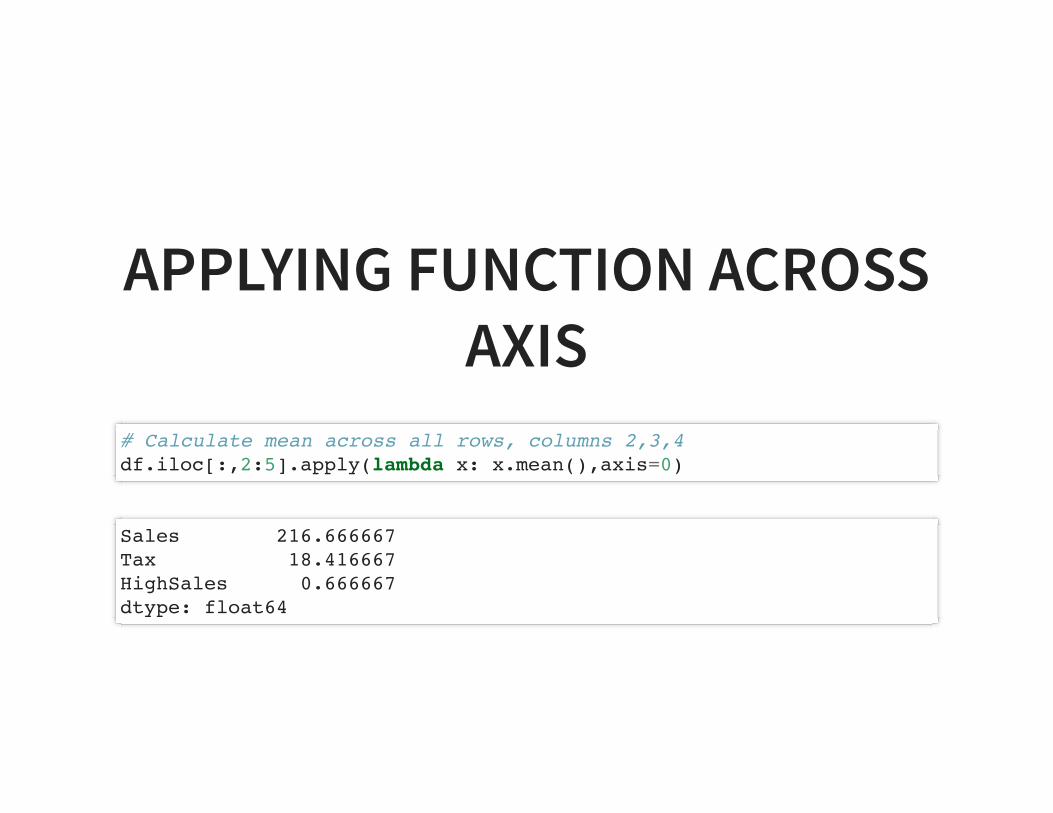
APPLYING FUNCTION ACROSSAXIS
# Calculate mean across all rows, columns 2,3,4df.iloc[:,2:5].apply(lambda x: x.mean(),axis=0)
Sales 216.666667Tax 18.416667HighSales 0.666667dtype: float64
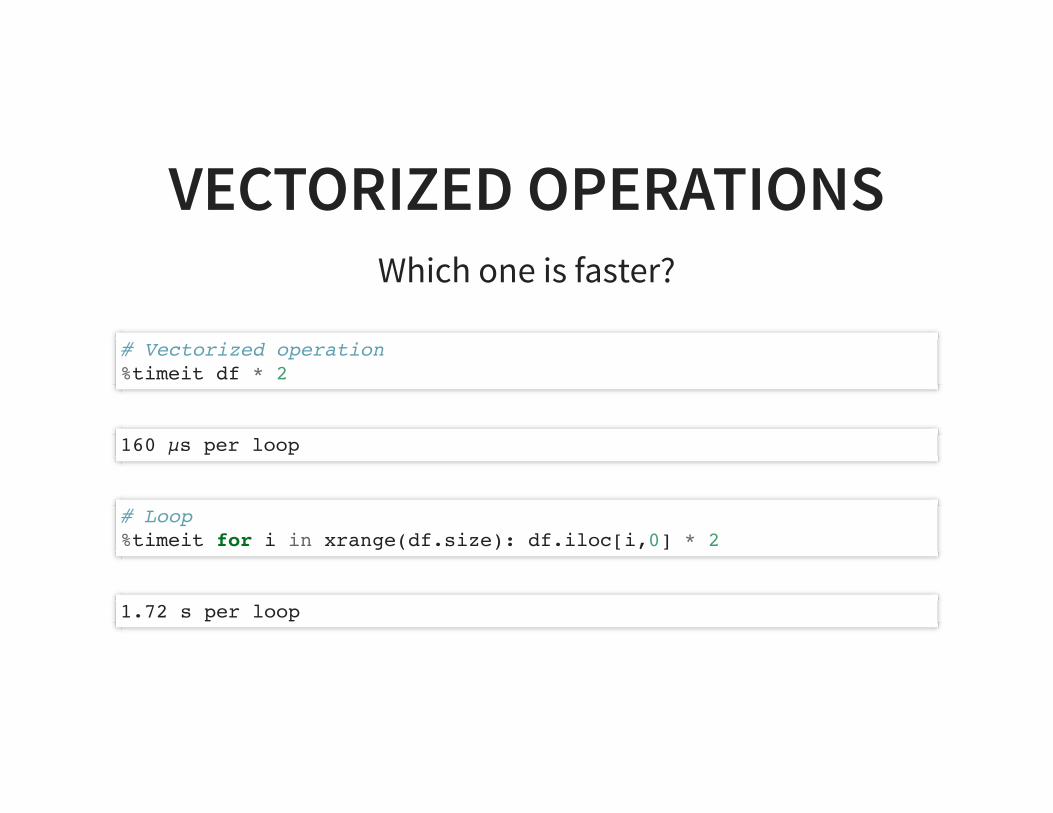
VECTORIZED OPERATIONSWhich one is faster?
# Vectorized operation%timeit df * 2
160 µs per loop
# Loop %timeit for i in xrange(df.size): df.iloc[i,0] * 2
1.72 s per loop
VECTORIZED OPERATIONSAlways use vectorized operationsAvoid Python loops

VISUALIZATION
WHY VISUALIZEWhy do we want to plot and visualize data?
Develop intuition about dataRelationships and correlations might stand out
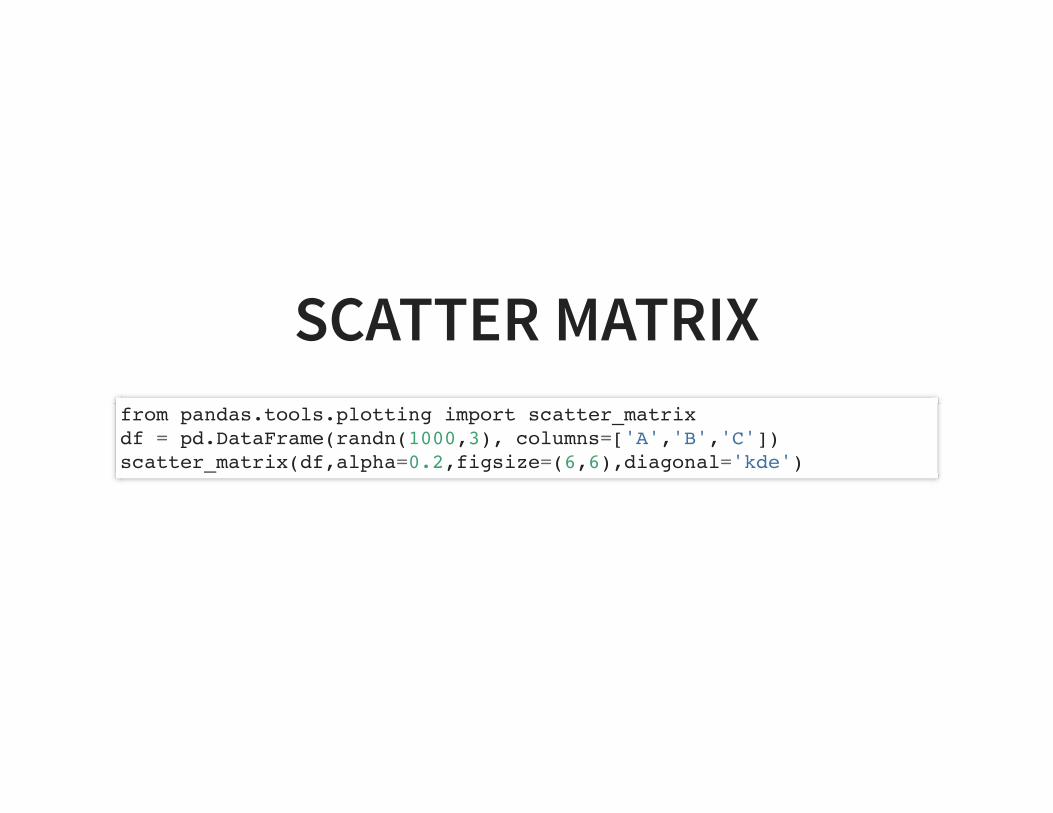
SCATTER MATRIXfrom pandas.tools.plotting import scatter_matrixdf = pd.DataFrame(randn(1000,3), columns=['A','B','C'])scatter_matrix(df,alpha=0.2,figsize=(6,6),diagonal='kde')
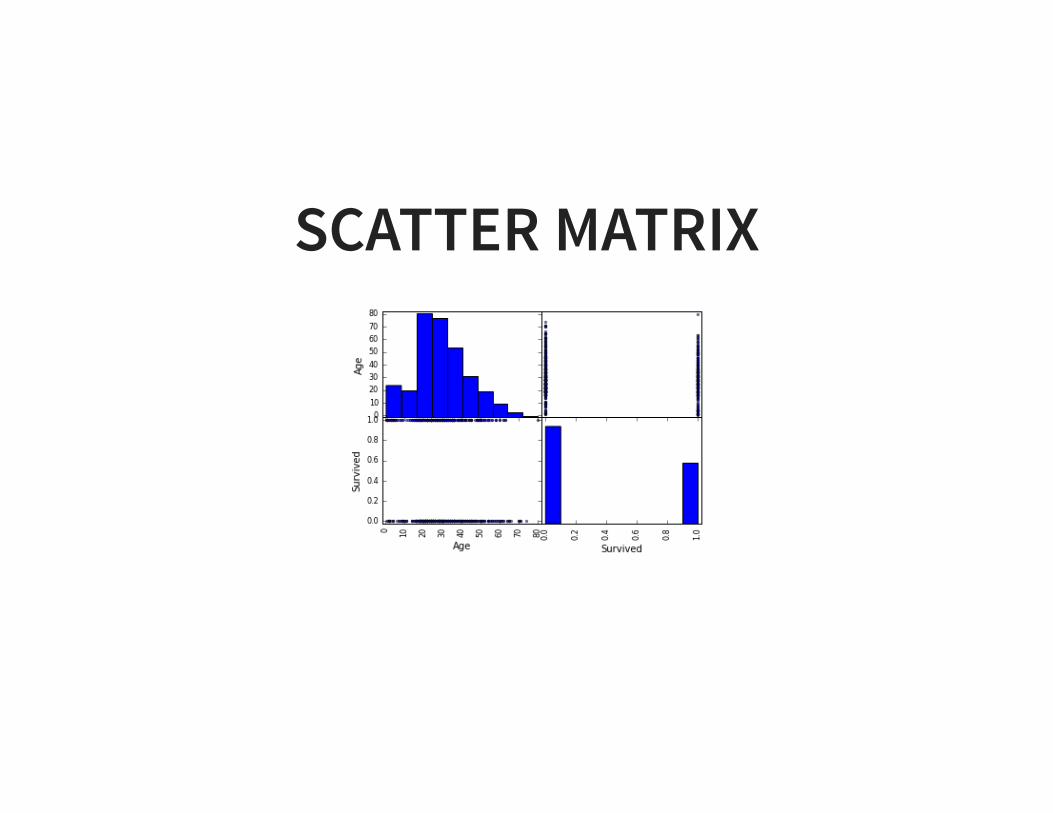
SCATTER MATRIX
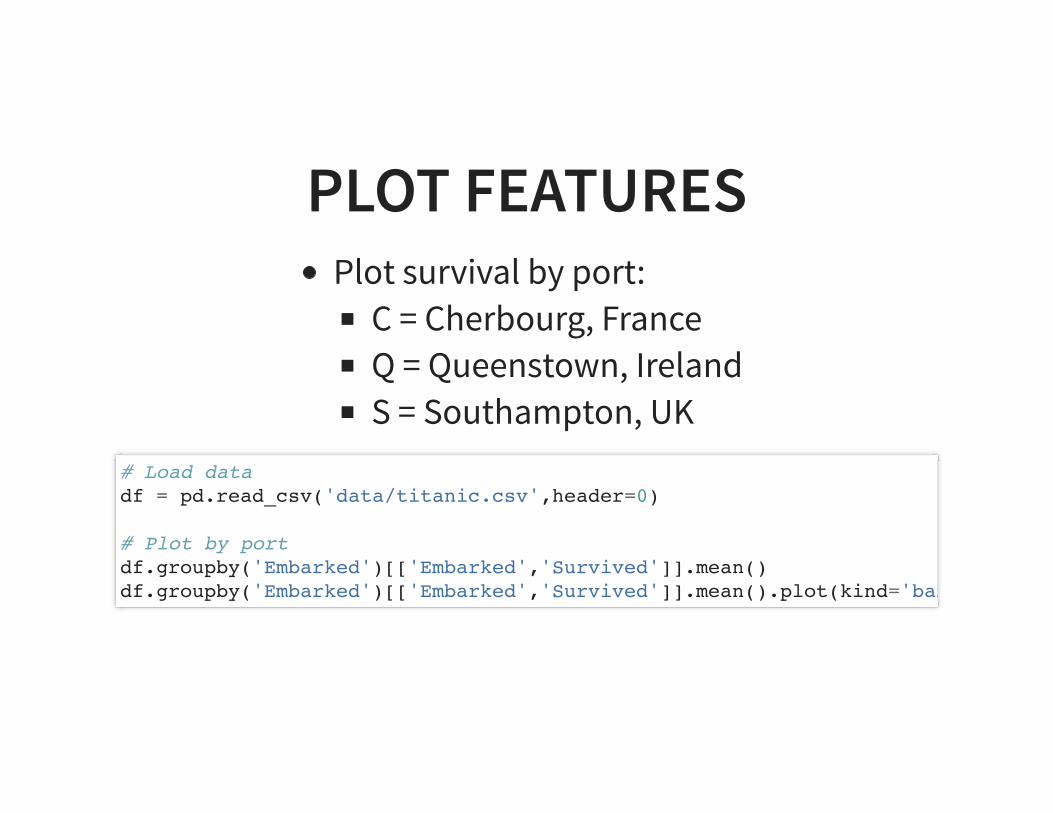
PLOT FEATURESPlot survival by port:
C = Cherbourg, FranceQ = Queenstown, IrelandS = Southampton, UK
# Load datadf = pd.read_csv('data/titanic.csv',header=0)
# Plot by portdf.groupby('Embarked')[['Embarked','Survived']].mean()df.groupby('Embarked')[['Embarked','Survived']].mean().plot(kind='bar')
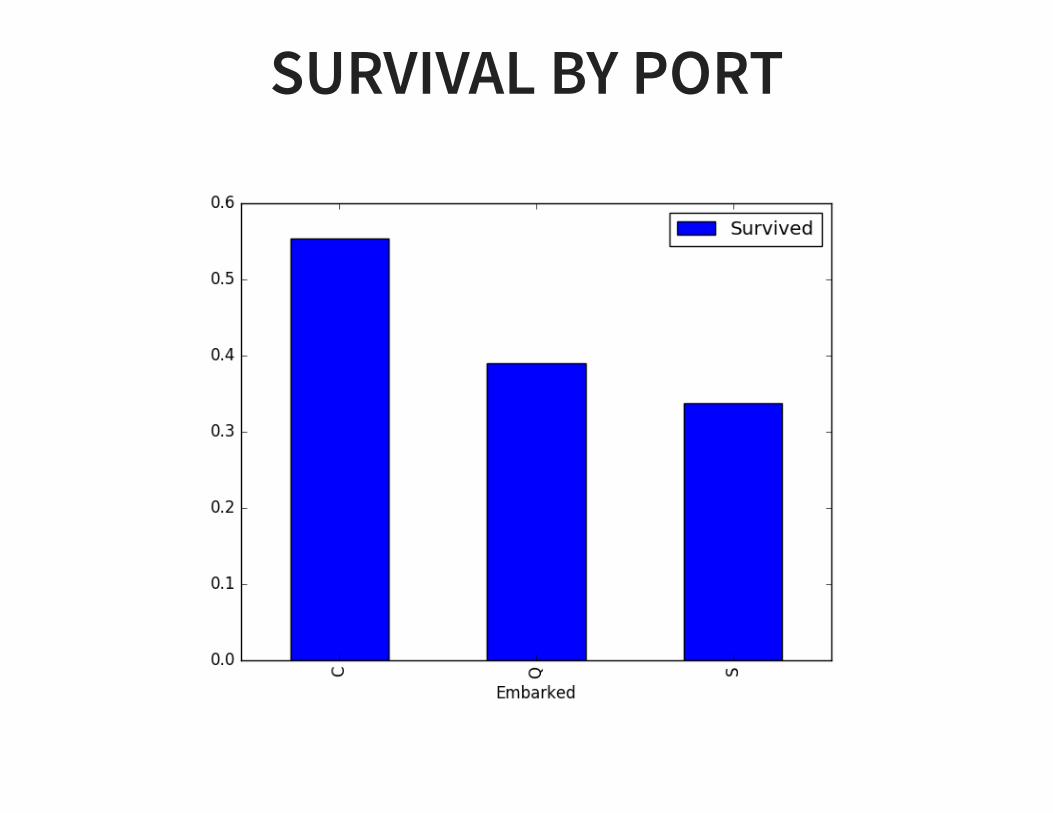
SURVIVAL BY PORT

PREPROCESSING
PREPROCESSINGHandling Missing ValuesEncoding Categories with Dummy VariablesCentering and Scaling
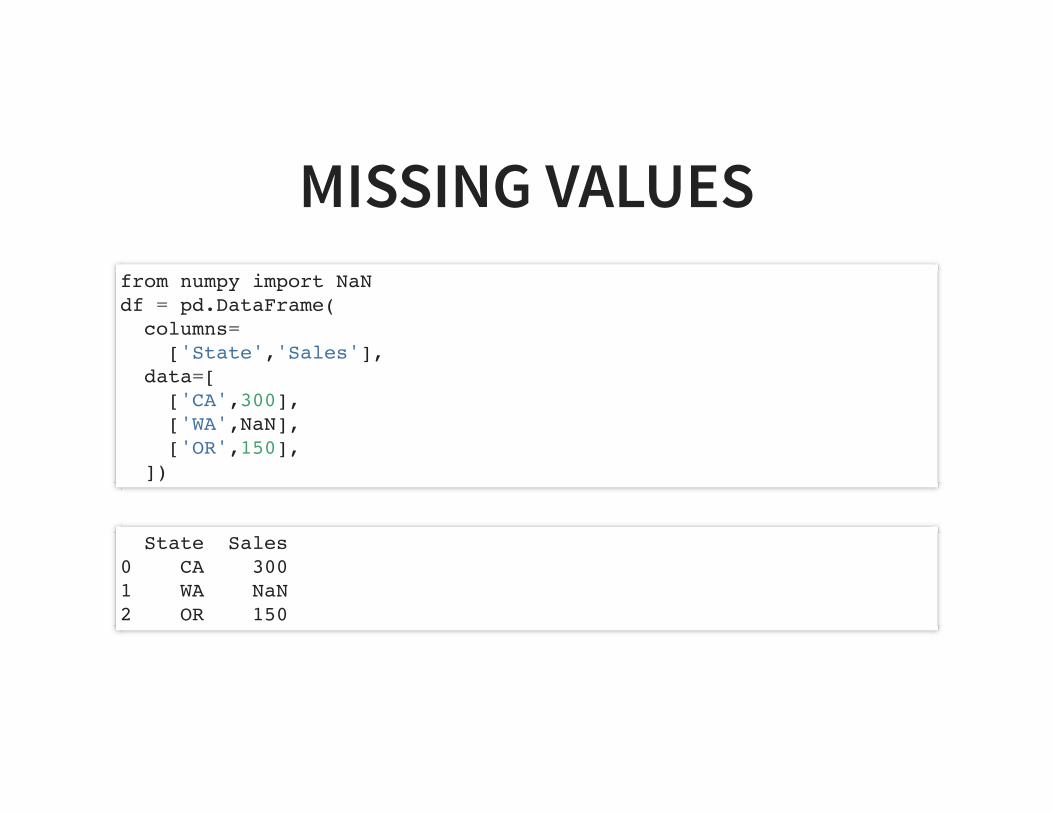
MISSING VALUESfrom numpy import NaNdf = pd.DataFrame( columns= ['State','Sales'], data=[ ['CA',300], ['WA',NaN], ['OR',150], ])
State Sales0 CA 3001 WA NaN2 OR 150
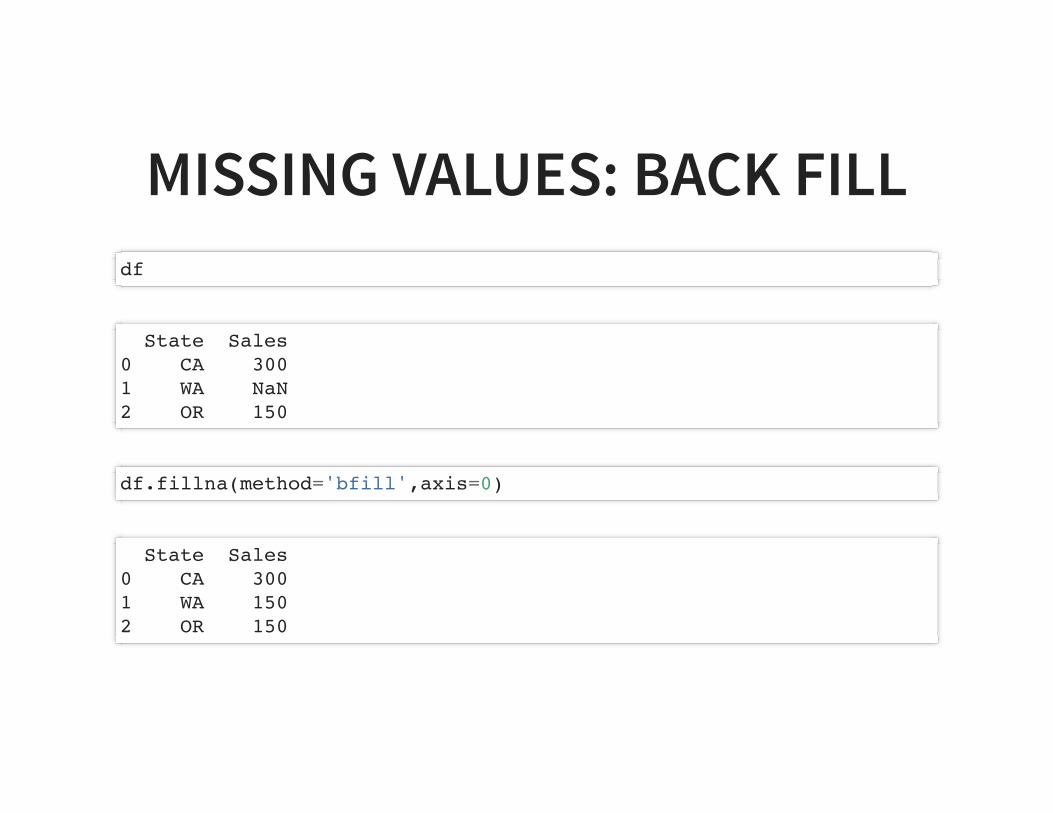
MISSING VALUES: BACK FILLdf
State Sales0 CA 3001 WA NaN2 OR 150
df.fillna(method='bfill',axis=0)
State Sales0 CA 3001 WA 1502 OR 150
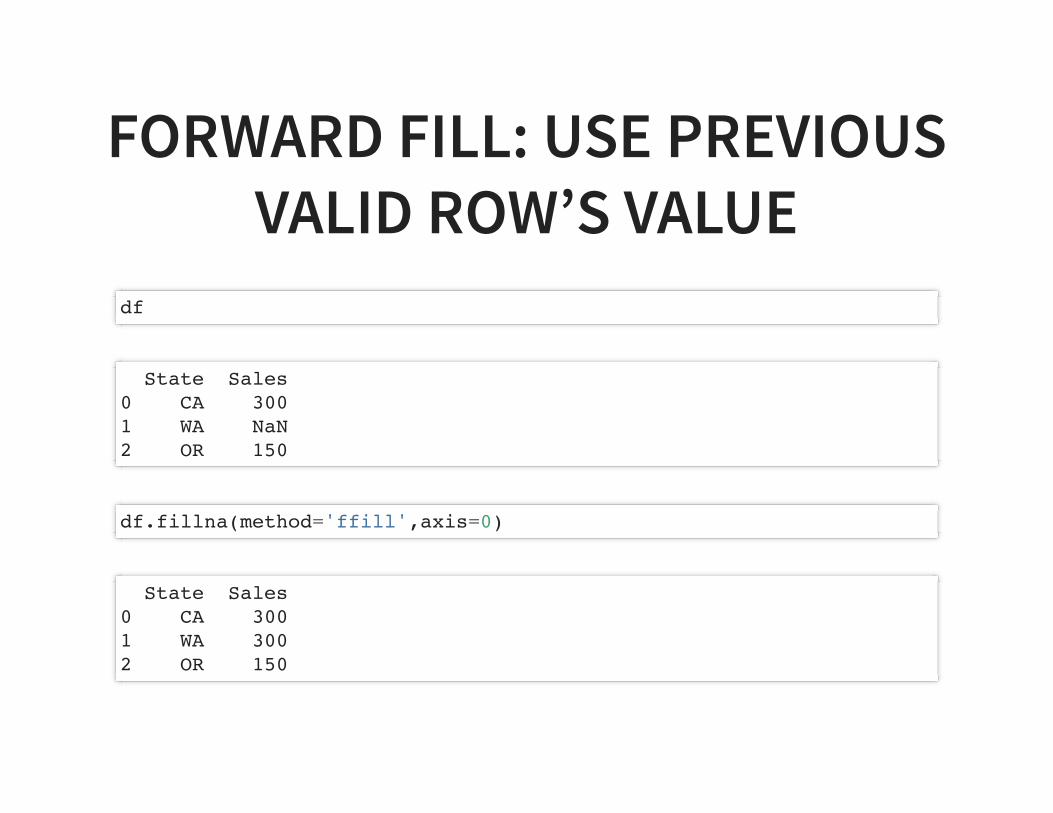
FORWARD FILL: USE PREVIOUSVALID ROW’S VALUE
df
State Sales0 CA 3001 WA NaN2 OR 150
df.fillna(method='ffill',axis=0)
State Sales0 CA 3001 WA 3002 OR 150
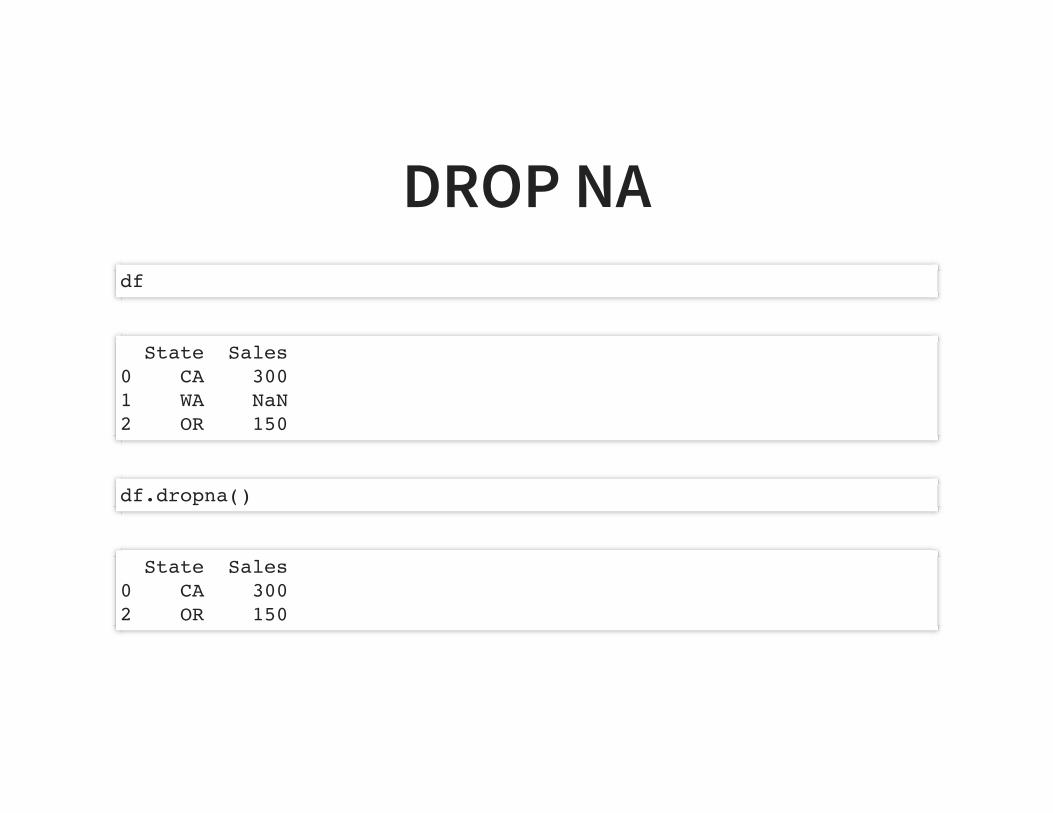
DROP NAdf
State Sales0 CA 3001 WA NaN2 OR 150
df.dropna()
State Sales0 CA 3002 OR 150
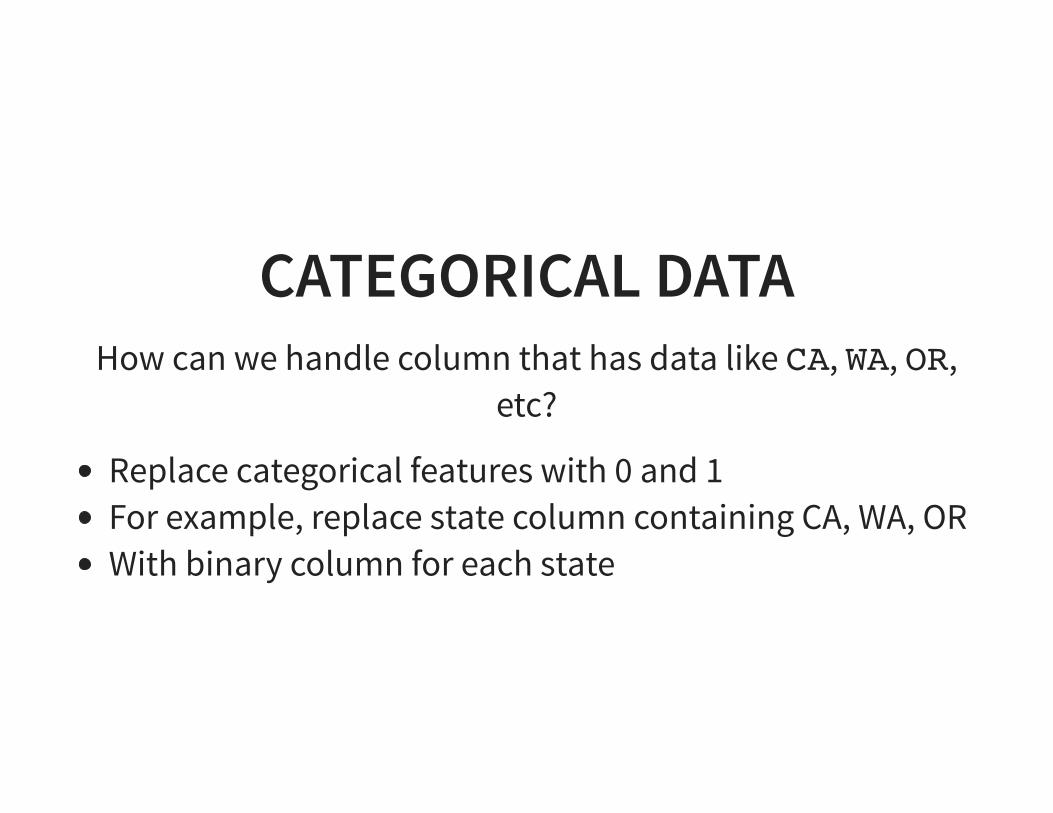
CATEGORICAL DATAHow can we handle column that has data like CA, WA, OR,
etc?
Replace categorical features with 0 and 1For example, replace state column containing CA, WA, ORWith binary column for each state
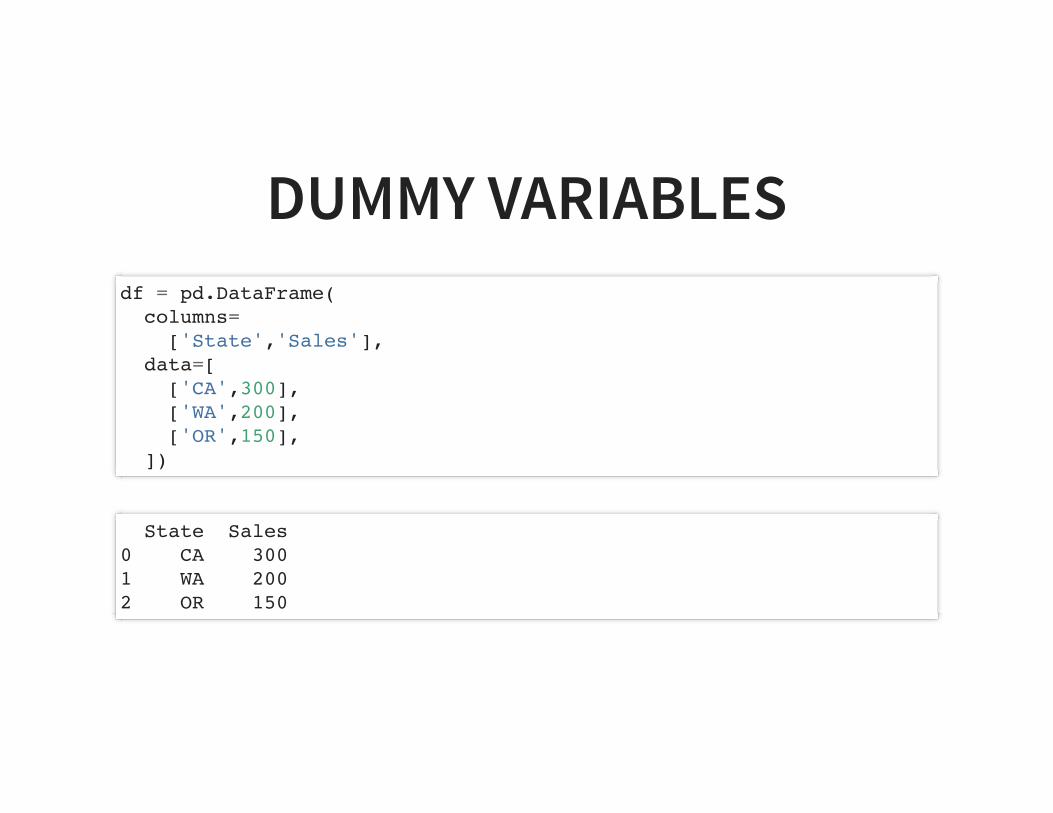
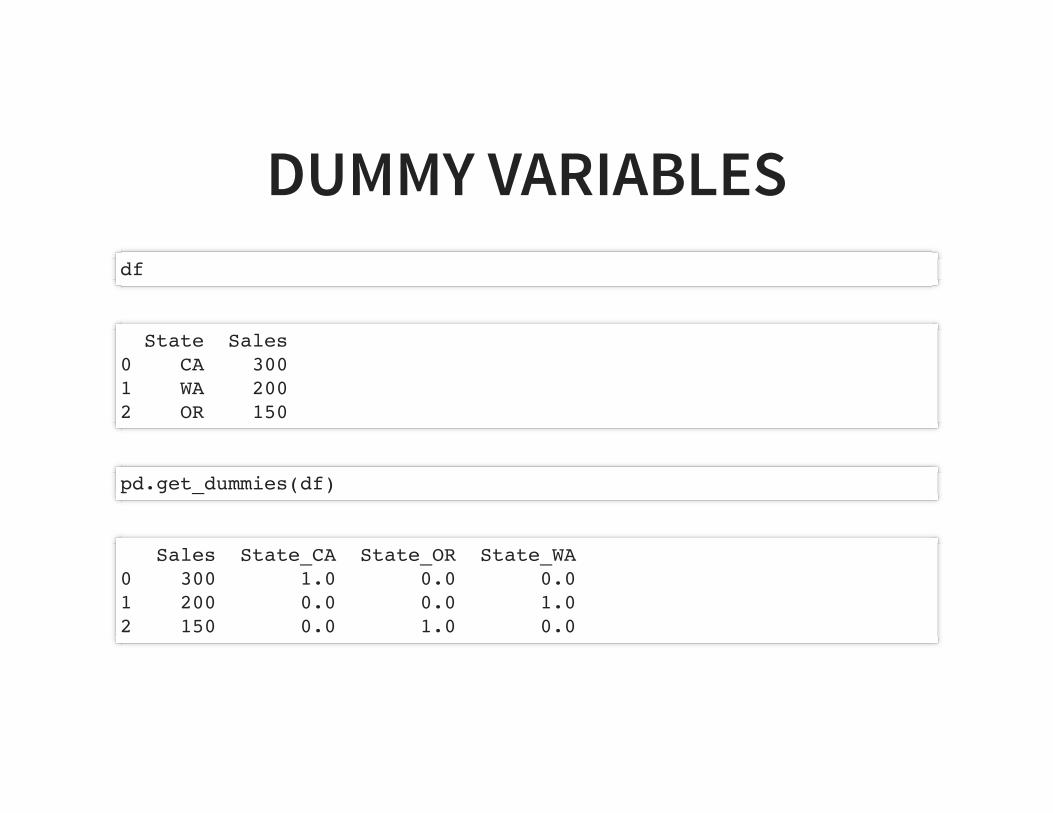
DUMMY VARIABLESdf = pd.DataFrame( columns= ['State','Sales'], data=[ ['CA',300], ['WA',200], ['OR',150], ])
State Sales0 CA 3001 WA 2002 OR 150
DUMMY VARIABLESdf
State Sales0 CA 3001 WA 2002 OR 150
pd.get_dummies(df)
Sales State_CA State_OR State_WA0 300 1.0 0.0 0.01 200 0.0 0.0 1.02 150 0.0 1.0 0.0
CENTERING AND SCALING DATAWhy center and scale data?
Features with large values can dominateCentering centers it at zeroScaling divides by standard deviation
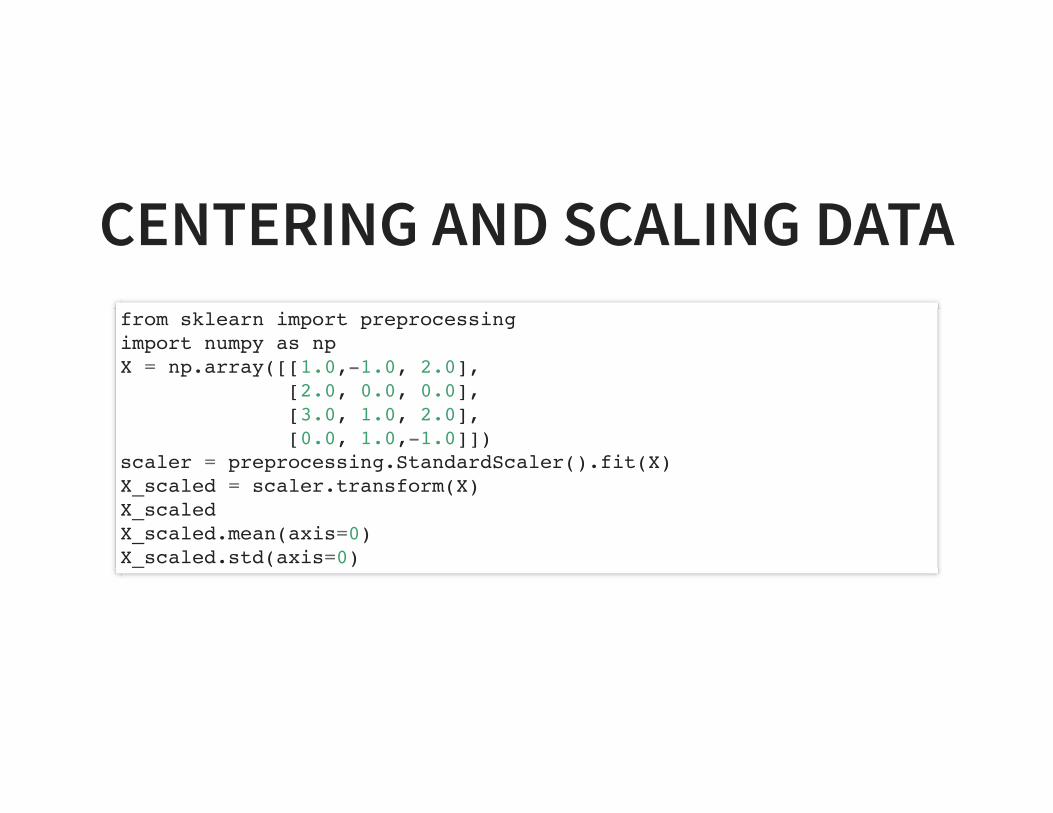
CENTERING AND SCALING DATAfrom sklearn import preprocessingimport numpy as npX = np.array([[1.0,-1.0, 2.0], [2.0, 0.0, 0.0], [3.0, 1.0, 2.0], [0.0, 1.0,-1.0]])scaler = preprocessing.StandardScaler().fit(X)X_scaled = scaler.transform(X)X_scaled X_scaled.mean(axis=0)X_scaled.std(axis=0)

INVERSE SCALINGscaler.inverse_transform(X_scaled)
SCALING: POP QUIZWhy is inverse scaling useful?
Use it to unscale the predictionsBack to the units from the problem domain

RANDOM FORESTS
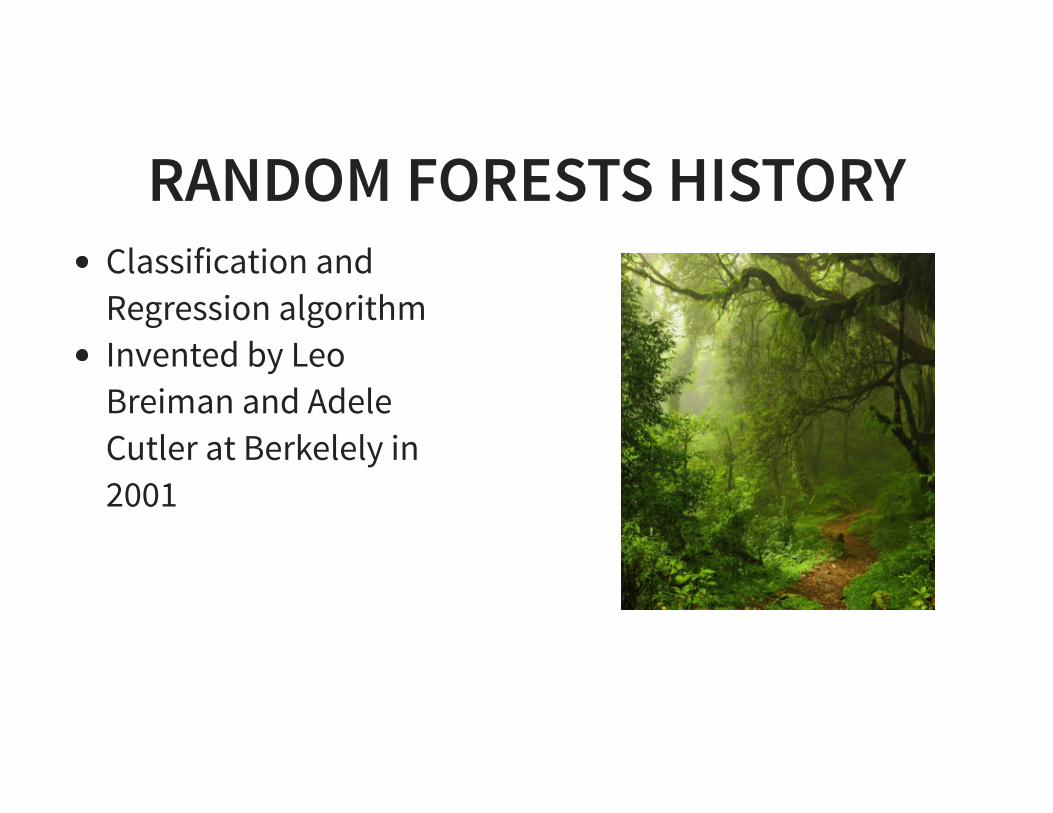
RANDOM FORESTS HISTORYClassification andRegression algorithmInvented by LeoBreiman and AdeleCutler at Berkelely in2001
LEO BREIMAN

ADELE CUTLER
BASIC IDEACollection of decisiontreesEach decision tree looksonly at some featuresFor final decision thetrees voteExample of ensemblemethod
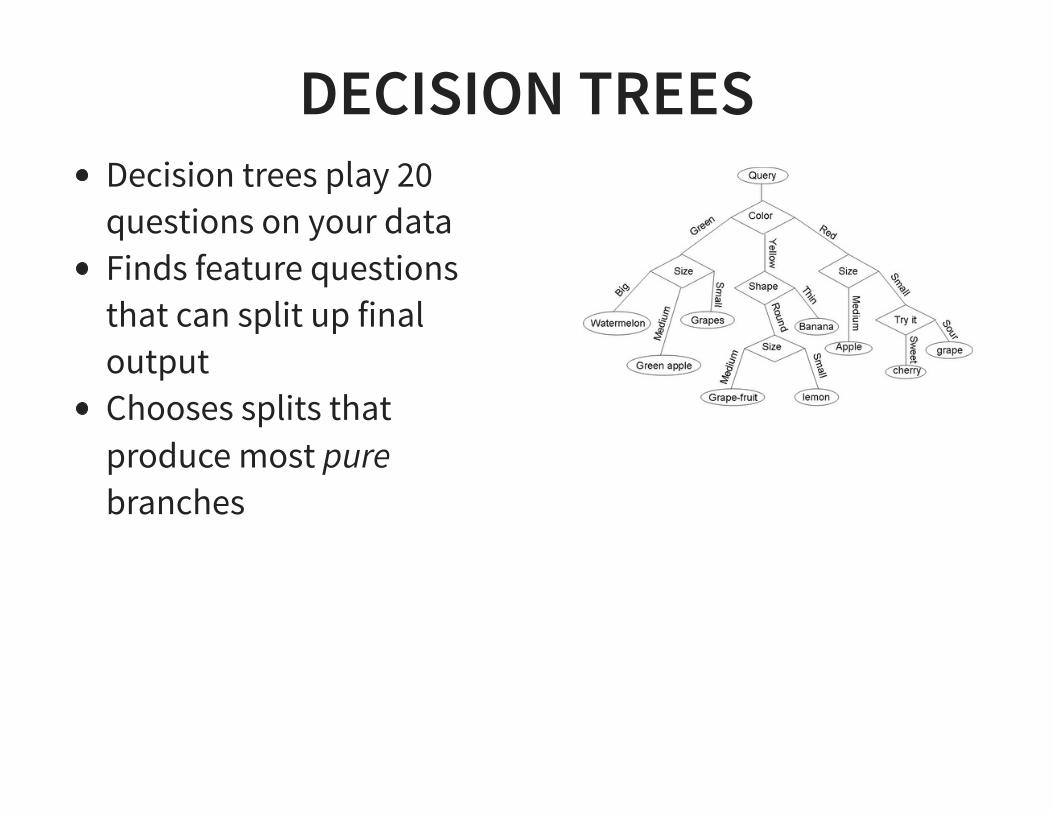
DECISION TREESDecision trees play 20questions on your dataFinds feature questionsthat can split up finaloutputChooses splits thatproduce most purebranches
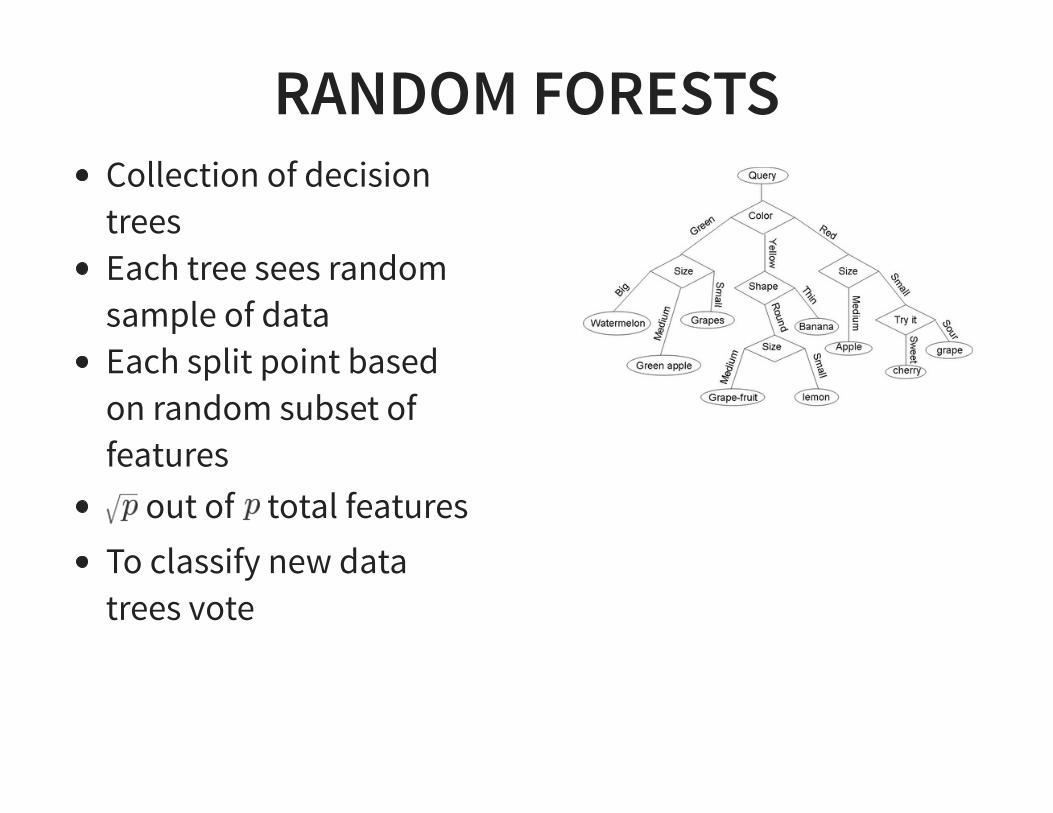
RANDOM FORESTSCollection of decisiontreesEach tree sees randomsample of dataEach split point basedon random subset offeatures
out of total featuresTo classify new datatrees vote
RANDOM FORESTS: POP QUIZWhich one takes more time: training random forests orclassifying new data point on trained random forests?
Training takes more timeThis is when tree is constructedRunning/evaluation is fastYou just walk down the tree
MODEL ACCURACY
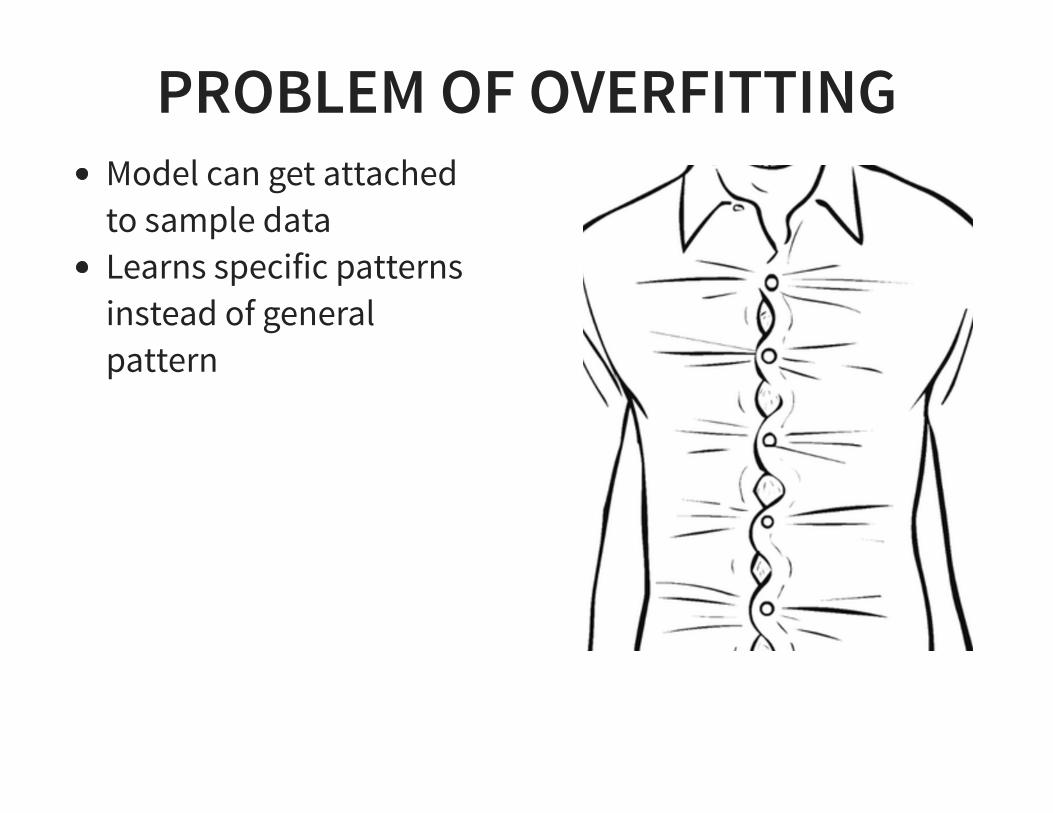
PROBLEM OF OVERFITTINGModel can get attachedto sample dataLearns specific patternsinstead of generalpattern
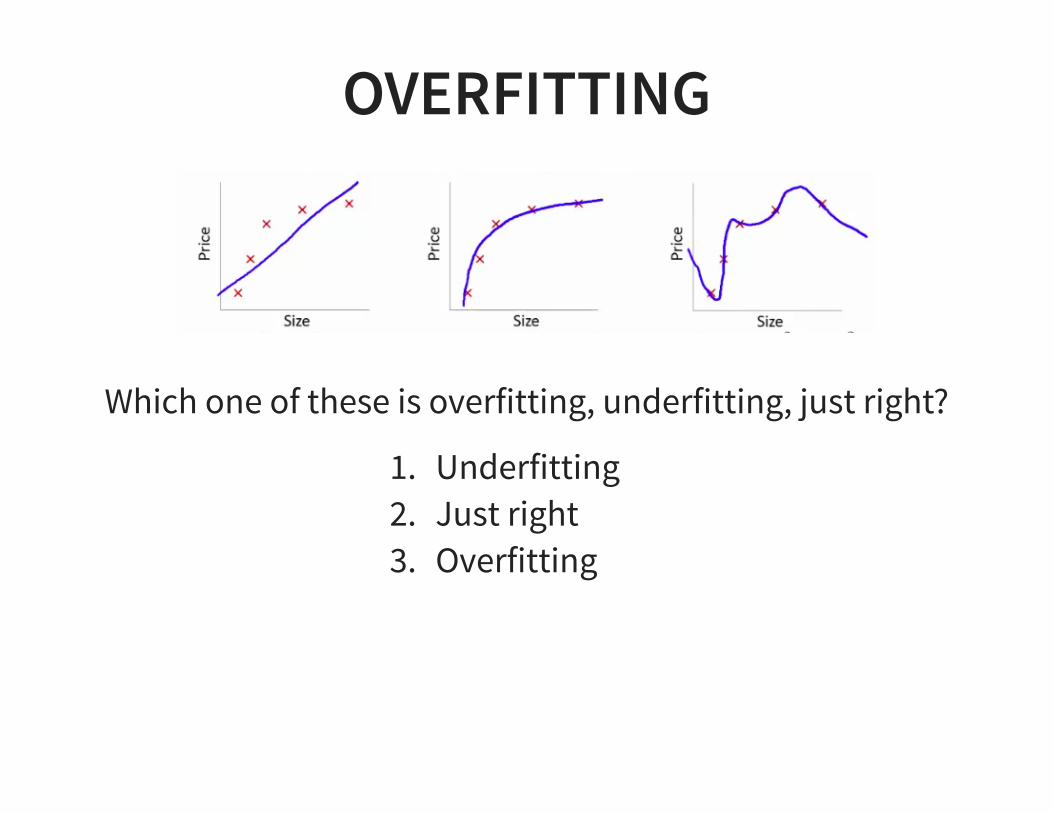
OVERFITTING
Which one of these is overfitting, underfitting, just right?
1. Underfitting2. Just right3. Overfitting
DETECTING OVERFITTINGHow do you know you are overfitting?
Model does great on training set and terrible on test set
RANDOM FORESTS ANDOVERFITTING
Random Forests are not prone to overfitting. Why?
Random Forests are an ensemble methodEach tree only sees and captures part of the dataTends to pick up general rather than specific patterns

CROSS VALIDATION
PROBLEMHow can we find outhow good our modelsare?Is it enough for modelsto do well on trainingset?How can we know howthe model will do onnew unseen data?
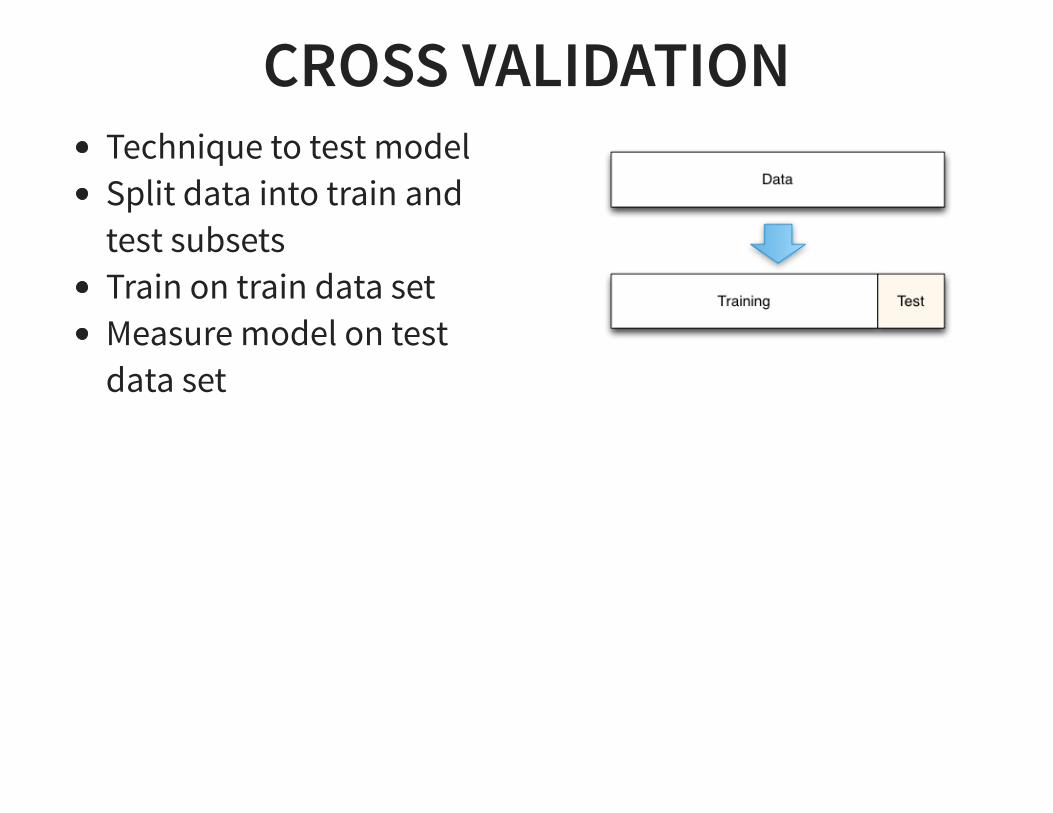
CROSS VALIDATIONTechnique to test modelSplit data into train andtest subsetsTrain on train data setMeasure model on testdata set
CROSS VALIDATION: POP QUIZWhy can’t we test our models on the training set?
The model already knows the training setIt will have an unfair advantageIt has to be tested on data it has not seen before
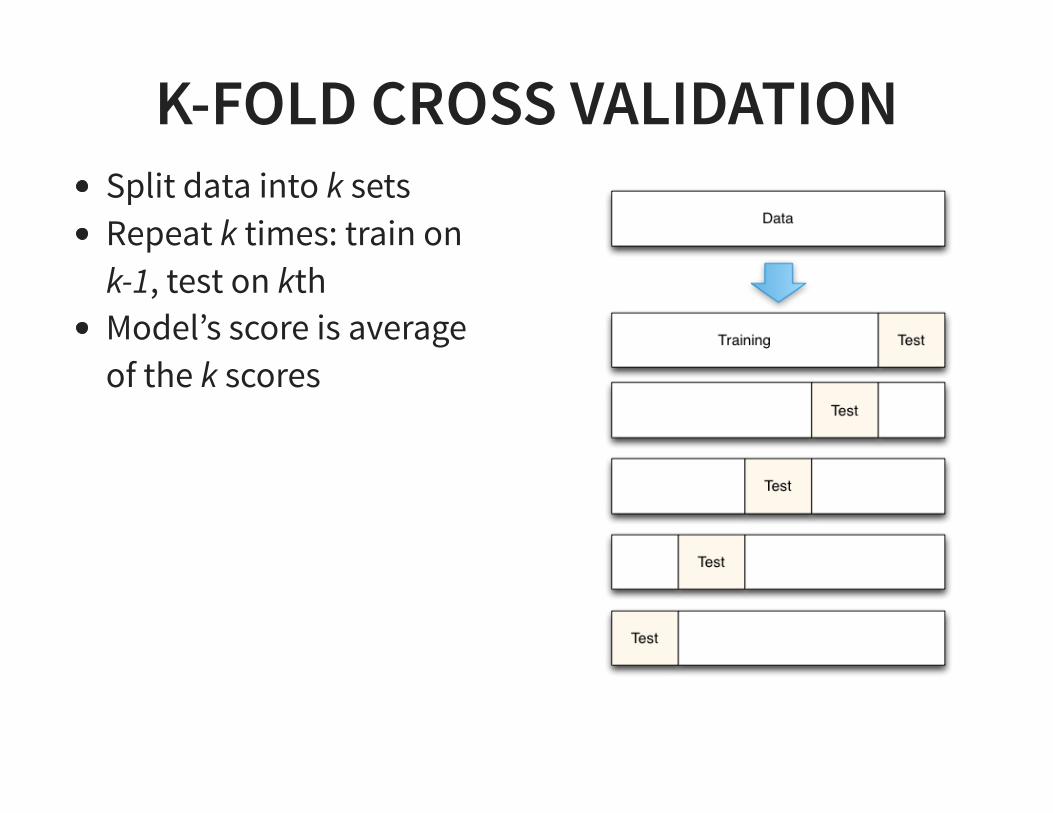
K-FOLD CROSS VALIDATIONSplit data into k setsRepeat k times: train onk-1, test on kthModel’s score is averageof the k scores
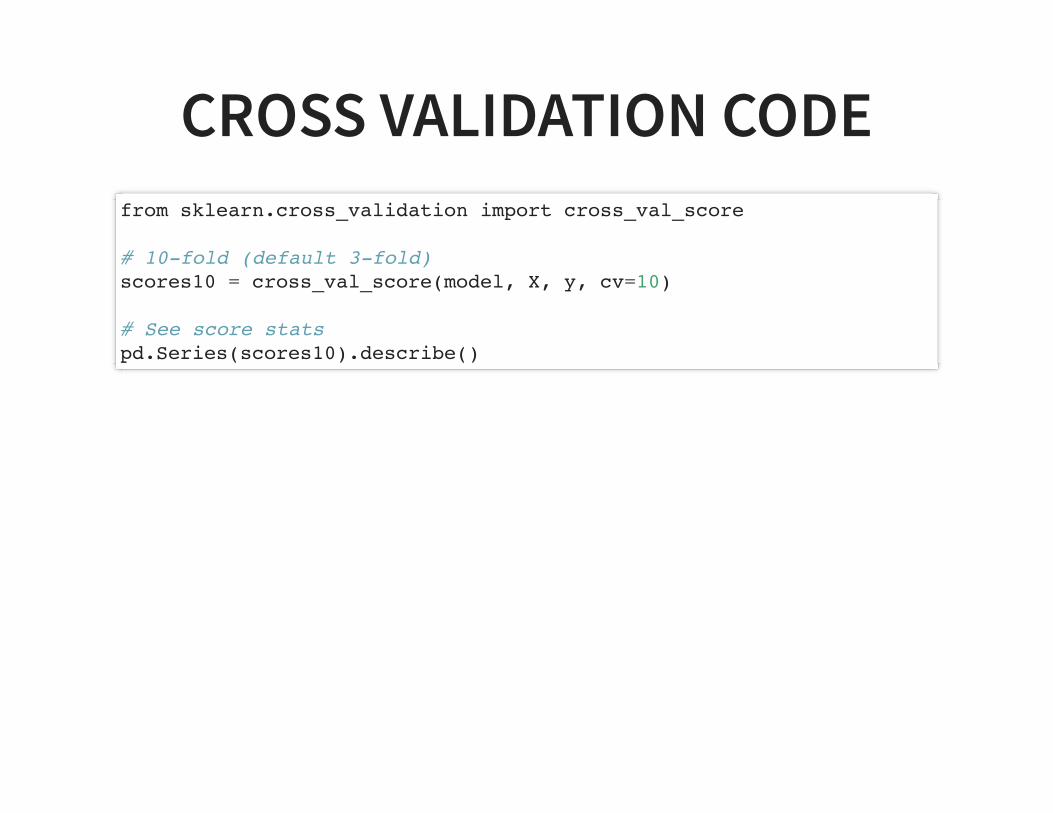
CROSS VALIDATION CODEfrom sklearn.cross_validation import cross_val_score
# 10-fold (default 3-fold)scores10 = cross_val_score(model, X, y, cv=10)
# See score statspd.Series(scores10).describe()
HYPERPARAMETER TUNING

PROBLEM: OIL EXPLORATIONDrilling holes isexpensiveWe want to find thebiggest oilfield withoutwasting money on dudsWhere should we plantour next oilfield derrick?
PROBLEM: MACHINE LEARNINGTesting hyperparameters is expensiveWe have an N-dimensional grid of parametersHow can we quickly zero in on the best combination ofhyperparameters?
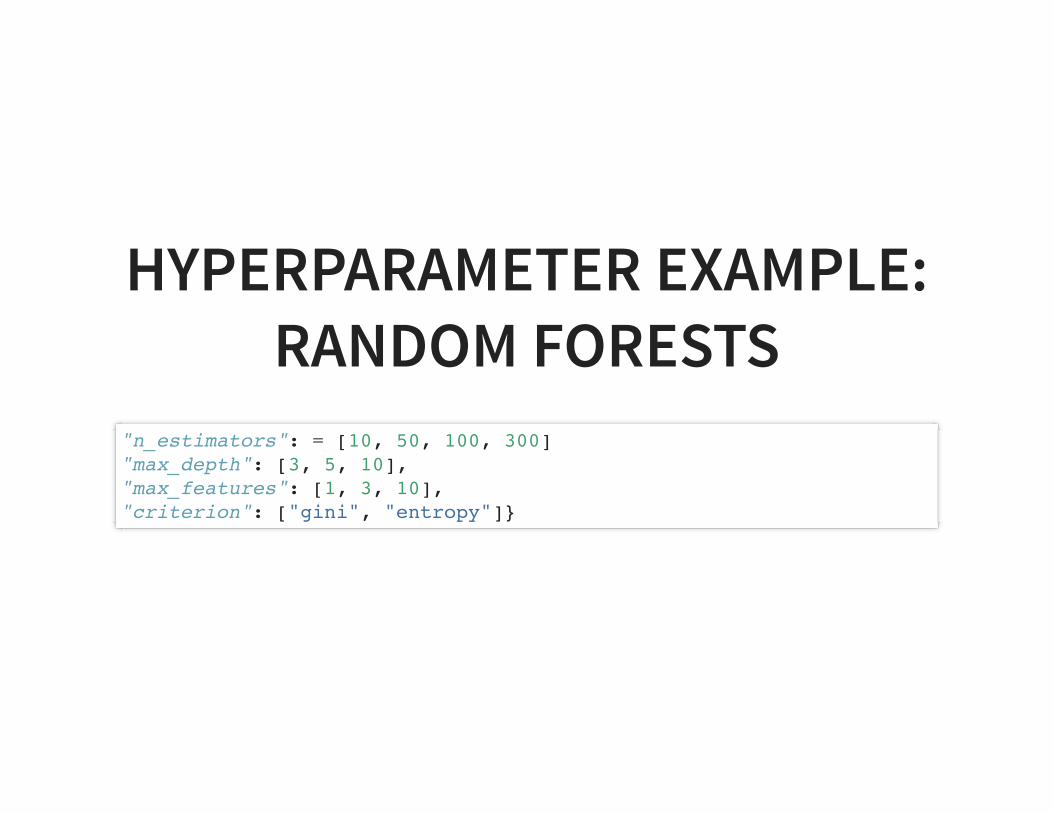
HYPERPARAMETER EXAMPLE:RANDOM FORESTS
"n_estimators": = [10, 50, 100, 300]"max_depth": [3, 5, 10],"max_features": [1, 3, 10],"criterion": ["gini", "entropy"]}
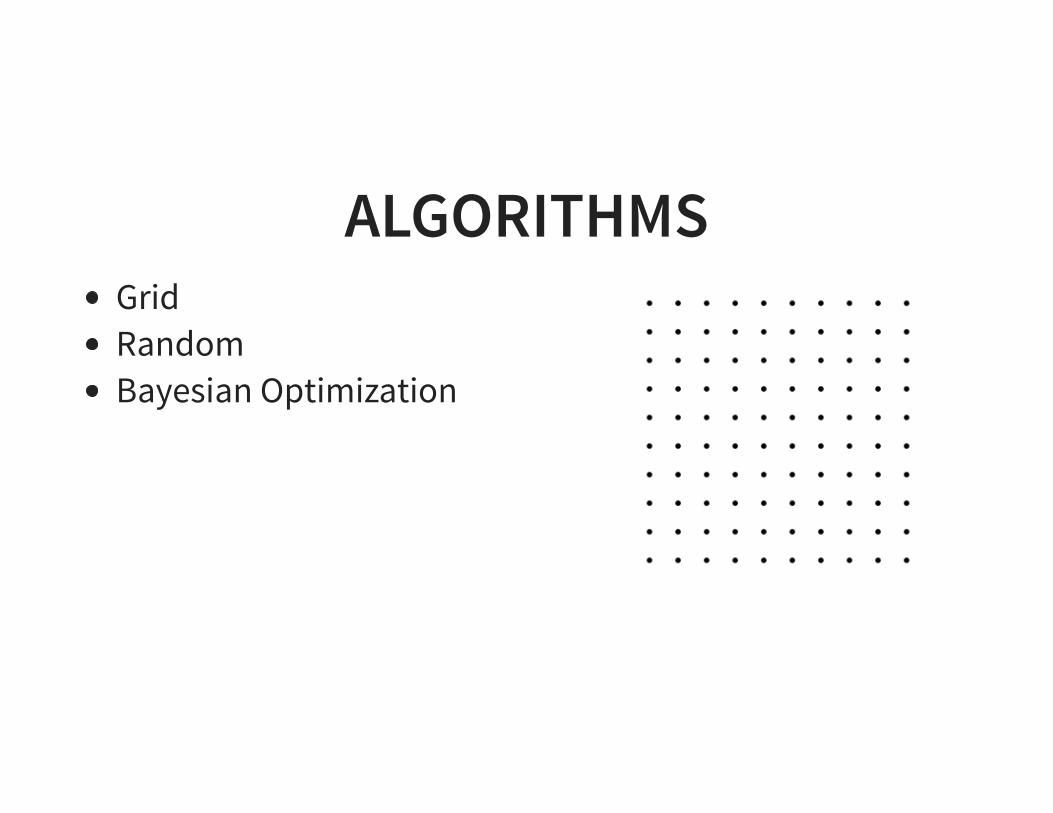
ALGORITHMSGridRandomBayesian Optimization
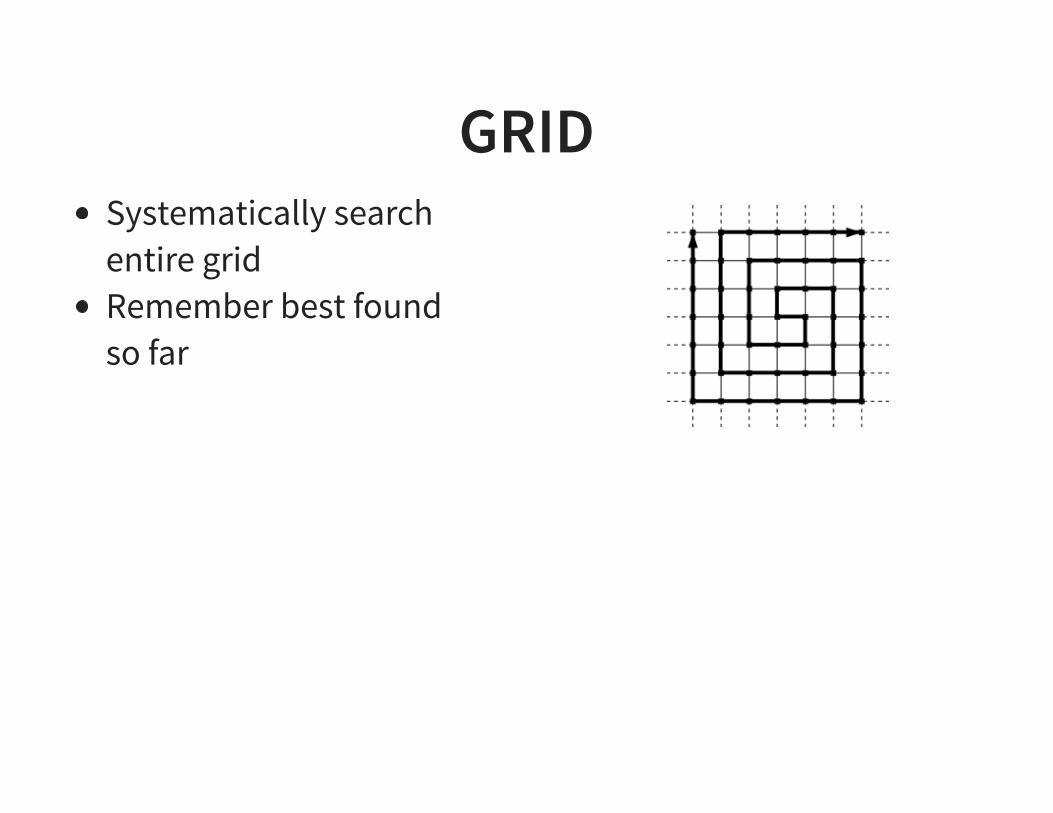
GRIDSystematically searchentire gridRemember best foundso far
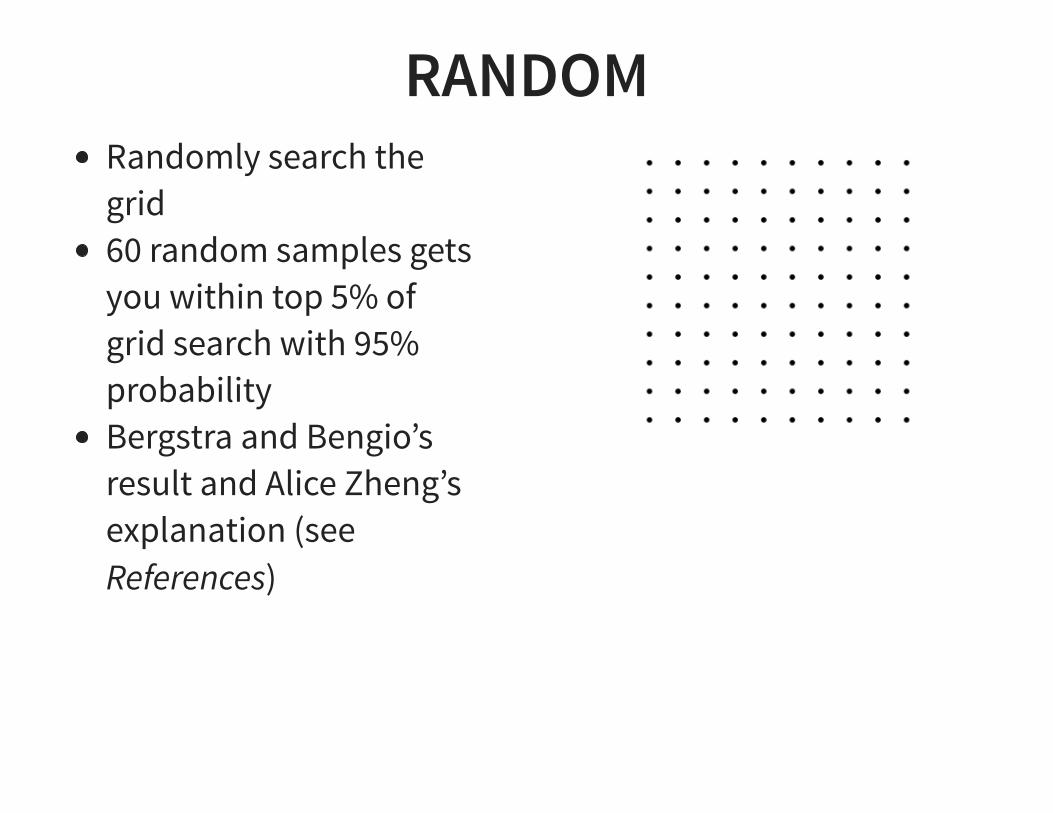
RANDOMRandomly search thegrid60 random samples getsyou within top 5% ofgrid search with 95%probabilityBergstra and Bengio’sresult and Alice Zheng’sexplanation (seeReferences)
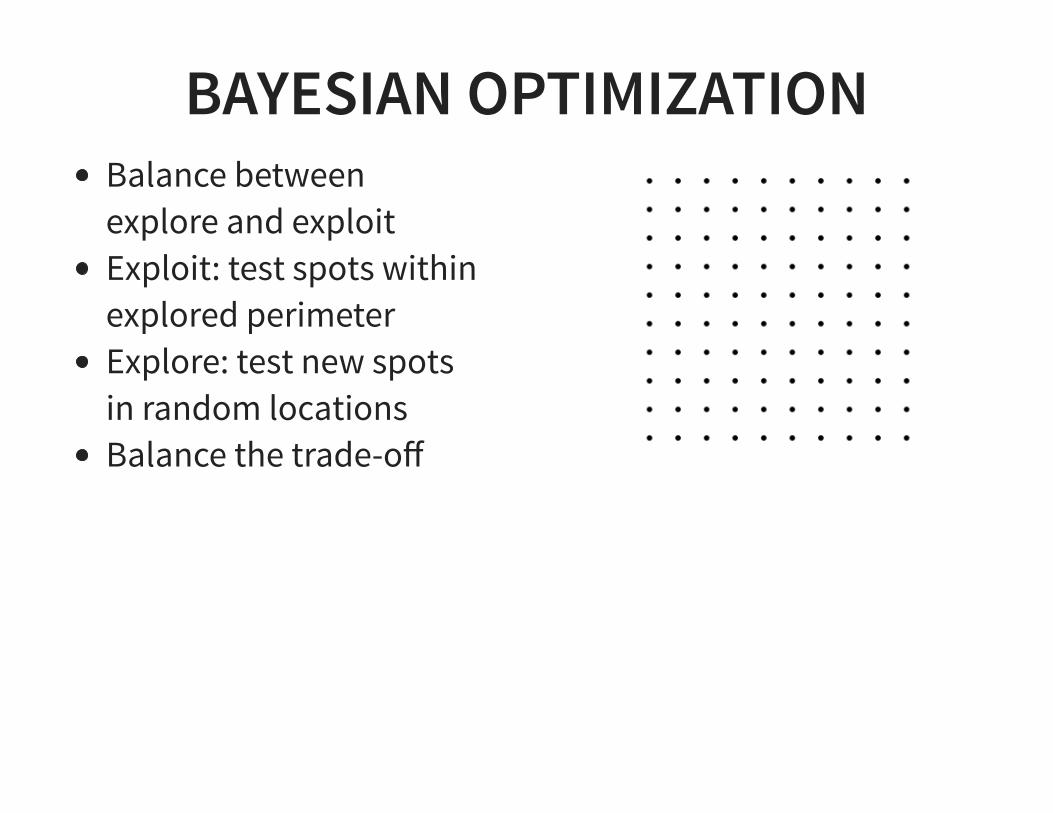
BAYESIAN OPTIMIZATIONBalance betweenexplore and exploitExploit: test spots withinexplored perimeterExplore: test new spotsin random locationsBalance the trade-off
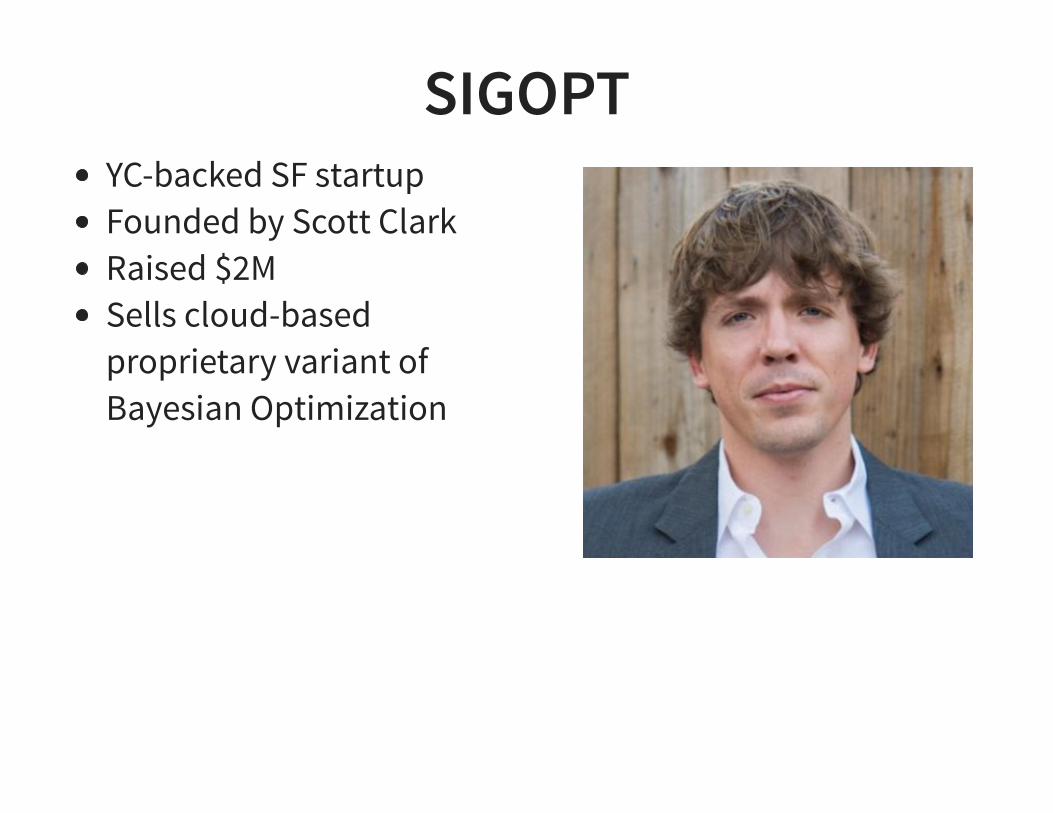
SIGOPTYC-backed SF startupFounded by Scott ClarkRaised $2MSells cloud-basedproprietary variant ofBayesian Optimization
BAYESIAN OPTIMIZATION PRIMERBayesian Optimization Primer by Ian Dewancker, MichaelMcCourt, Scott ClarkSee References
OPEN SOURCE VARIANTSOpen source alternatives:
SpearmintHyperoptSMACMOE
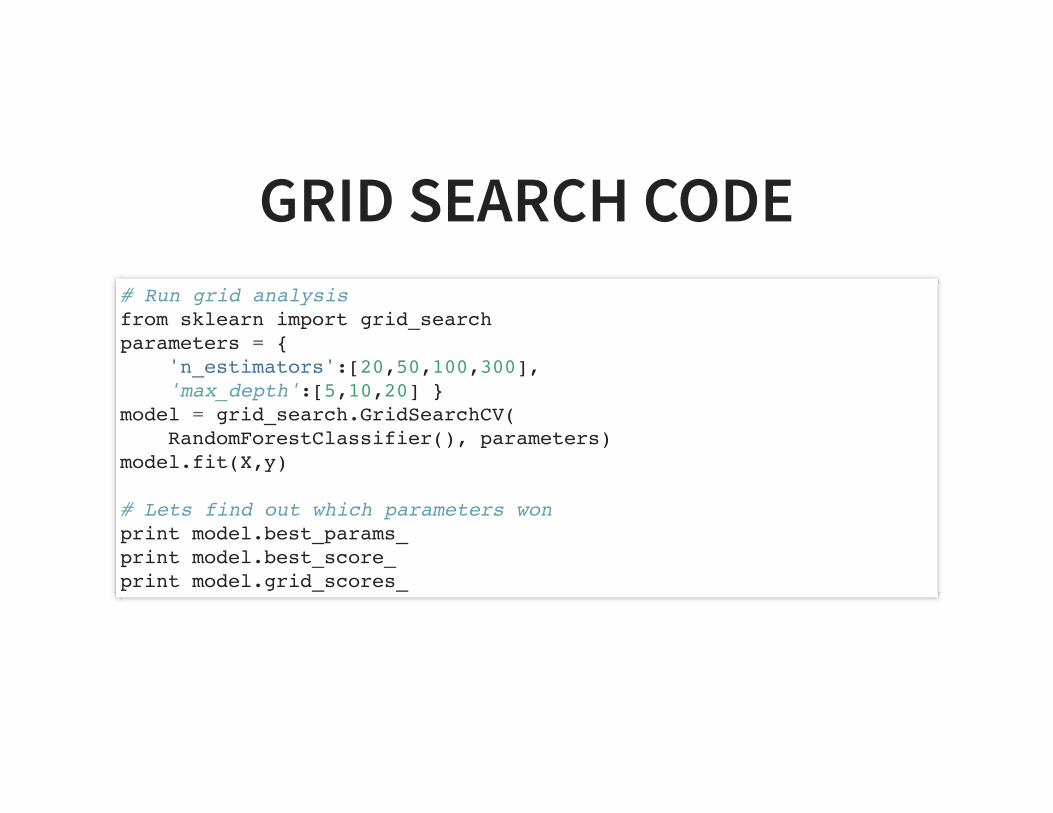
GRID SEARCH CODE# Run grid analysisfrom sklearn import grid_searchparameters = { 'n_estimators':[20,50,100,300], 'max_depth':[5,10,20] }model = grid_search.GridSearchCV( RandomForestClassifier(), parameters)model.fit(X,y)
# Lets find out which parameters wonprint model.best_params_print model.best_score_print model.grid_scores_

CONCLUSION
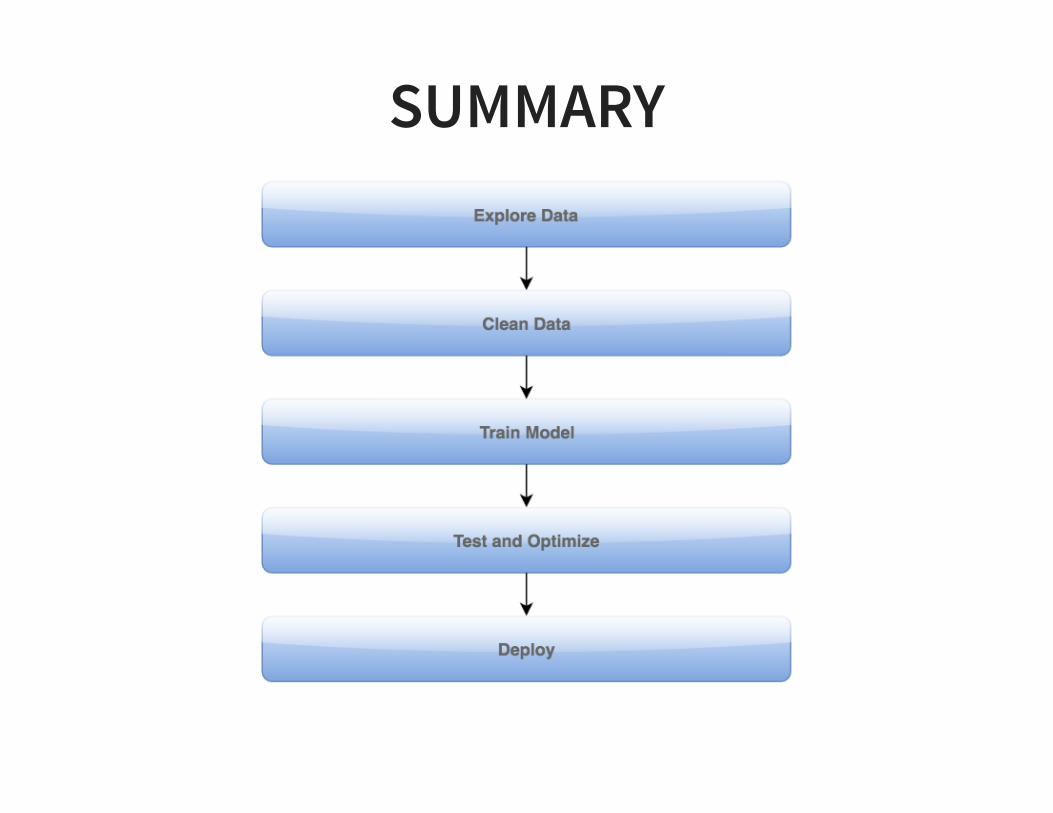
SUMMARY
REFERENCESPython Reference
scikit-learn Reference
http://python.org
http://scikit-learn.org
REFERENCESBayesian Optimization by Dewancker et al
Random Search by Bengio et al
Evaluating machine learning modelsAlice Zheng
http://sigopt.com
http://jmlr.org
http://www.oreilly.com
COURSESMachine Learning by Andrew Ng
(Online Course)
Intro to Statistical Learning by Hastie et al (PDF)
(Video) (Online Course)
https://www.coursera.org
http://usc.eduhttp://www.dataschool.iohttps://stanford.edu

WORKSHOP DEMO AND LABTitanic Demo and Congress Lab for this workshophttps://github.com/asimjalis/data-science-workshop

QUESTIONS