data science-based sizing approach for renewable energy
TRANSCRIPT
HAL Id: hal-03105070https://hal.archives-ouvertes.fr/hal-03105070
Submitted on 10 Jan 2021
HAL is a multi-disciplinary open accessarchive for the deposit and dissemination of sci-entific research documents, whether they are pub-lished or not. The documents may come fromteaching and research institutions in France orabroad, or from public or private research centers.
L’archive ouverte pluridisciplinaire HAL, estdestinée au dépôt et à la diffusion de documentsscientifiques de niveau recherche, publiés ou non,émanant des établissements d’enseignement et derecherche français ou étrangers, des laboratoirespublics ou privés.
Data Science-based Sizing Approach for RenewableEnergy Systems
Caceres Camilo, Joao Rosario, Mora Jefry, Didier Dumur
To cite this version:Caceres Camilo, Joao Rosario, Mora Jefry, Didier Dumur. Data Science-based Sizing Ap-proach for Renewable Energy Systems. 2020 IX International Congress of Mechatronics Engineer-ing and Automation (CIIMA), Nov 2020, Cartagena de Indias, Colombia. pp.1-6, �10.1109/CI-IMA50553.2020.9290303�. �hal-03105070�
Data Science-based Sizing Approach for Renewable
Energy Systems
Camilo Cáceres F.
School of Mechanical
Engineering
University of Campinas
Campinas (SP), Brazil
orcid.org/0000-0003-4540-6584
João M. Rosário
School of Mechanical
Engineering
University of Campinas
Campinas (SP), Brazil
orcid.org/0000-0002-5347-4029
Jefry Mora M.
School of Mechanical
Engineering
University of Campinas
Campinas (SP), Brazil
orcid.org/0000-0001-8725-1643
Didier Dumur
Département Automatique
Centrale Supélec
Gif-sur-Yvette, France
orcid.org/0000-0002-0474-5080
Abstract—One of the global trends in the energy sector is the
inclusion of renewable sources in the grid. This need allows the
reduction of greenhouse gases produced by the energetic industry,
particularly with the use of fossil fuels and their effects on global
warming. Therefore, these implementations need to cover the
minimum requirements as balanced energy price, power demand,
and a higher ROI, among others, to be reliable and compete with
traditional sources. This paper presents a novel approach for
sizing a hybrid renewable energy system, using data-driven
decisions to meet the demand of a population in Barranquilla city.
This method reduces oversizing by optimizing the number of
components and increases the whole architecture's energy
efficiency by managing the excess or the lack of energy through
storage and backup systems.
Keywords— Data Science, Data Analytics, Levelized Cost of
Energy, PV-Wind based hybrid system (PWHS), Hybrid Renewable
Energy System (HRES), Microgrid.
I. INTRODUCTION
Nowadays, electricity is a commodity that society became dependant on, almost all activities need it, computers, transport, and illumination are just some examples of this fact. Additionally, the U.S. Energy Information Administration (EIA) projects a 48% increase in world energy consumption by 2040 [1] while fossil fuels are the primary energy source, are becoming scarce. Consequently, it is necessary to include more renewable and eco-friendly sources in the world energy grid, like solar, wind, tidal, or geothermal energies. Taking into account the world energy consumption in 2018, measured in 161.248 PWh, is technically feasible to obtain 3078 times that quantity using the full potential of renewable sources, where solar covers 2850 times, wind 200 times, biomass 20 times, geothermal five times, tidal two times and hydroelectric one time [2].
One of the main issues of renewable energies is their random nature, which causes a variable generation curve and the need for a backup system that can be an additional source or a storage system. This drawback makes their implementation harder due to the need for a power management component to secure the whole system's correct operation. Hence, to reduce fossil fuel dependency, several experts recommend integrating these renewable sources into the local grid for a bulk generation or through decentralized systems for customer level [3]–[6], taking advantage of their generation potential, their ease of installation, and operation processes.
Once there are two or more energy sources, it becomes mandatory to perform an on-site study to identify the selected sources' behavior and other studies to help in the sizing process. However, the correct design of hybrid architectures is complicated due to the Multiple-Criteria Decision-Making (MCDM) scenario. There are many approaches to provide the "optimal design" criteria, as technical, economic, environmental, and social parameters [7], [8]. Additionally, it is necessary to work with the non-linear characteristic response in the system's components, design constraints, energy management techniques, system topology, among other characteristics [9].
On the other hand, it is essential to use intuitive methods to obtain the first approach to calculating the initial capital investment [10]. Consequently, it is possible to find three different techniques to make a more realistic approach, which works as the correct design basis. The first one is "the annual monthly average," which consists of obtaining the yearly average monthly values of the essential parameters such as radiation, wind speed, or energy demand. The second one is "the most unfavorable month," which consists of obtaining the same values but under the month with the worst behavior like low radiation or high energy demand [11]. The third one is called "Loss of power supply probability (LPSP)," it consists of obtaining the quantity of the components under the reliability of the system, which includes the cost and the probability of loss of energy [12].
Looking for optimal sizing is necessary to consider the characteristics of the problem due to existing many methodologies, which can be categorized into two main groups, classical techniques where are grouped all methods that use a mathematical approach to the optimal solution [13]. This group includes the graphic construction method, which is the oldest and uses the average data of radiation and energy demand, leading to over or under-sizing in some cases [14]. The second one is the probabilistic methods, which are considered the simplest ones; their results may not be the optimal option because it cannot represent the system's dynamic performance but always deliver a secure option [15]. The analytical methods allow the simulation of the resulting configurations' performance in software and obtain the best configuration. Still, they present an obstacle to estimating the position-related equation's coefficient, crucial in these approaches [16].
Implementing hybrid architectures allow an optimal sizing of each renewable energy system, including the storage, due to the number of parameters and topologies that can be tested
compared with a single source. Nevertheless, none of the current approaches deliver the optimal sizing for all involved parameters; this result will be linked to the optimization criteria [17]. On the other hand, data science is widely used together with big data in smart grids to improve customer service [18], decision-making, reliability, as well as correcting both grid sizing and distribution [19], [20].
Consequently, a different approach combining some sizing methods and employing data-driven techniques can deliver a new sizing methodology. Hence, this paper introduces a data-driven approach to size a PWHS. This proposed methodology is exemplified by Barranquilla's case study and tries to provide energy for a residential zone. The proposed energy harvesting zone corresponds to the city’s outskirts of the city (10.9750º, -74.8715º).
II. PROPOSED DATA-DRIVEN PROCESS
This work proposes applying the data science life cycle to
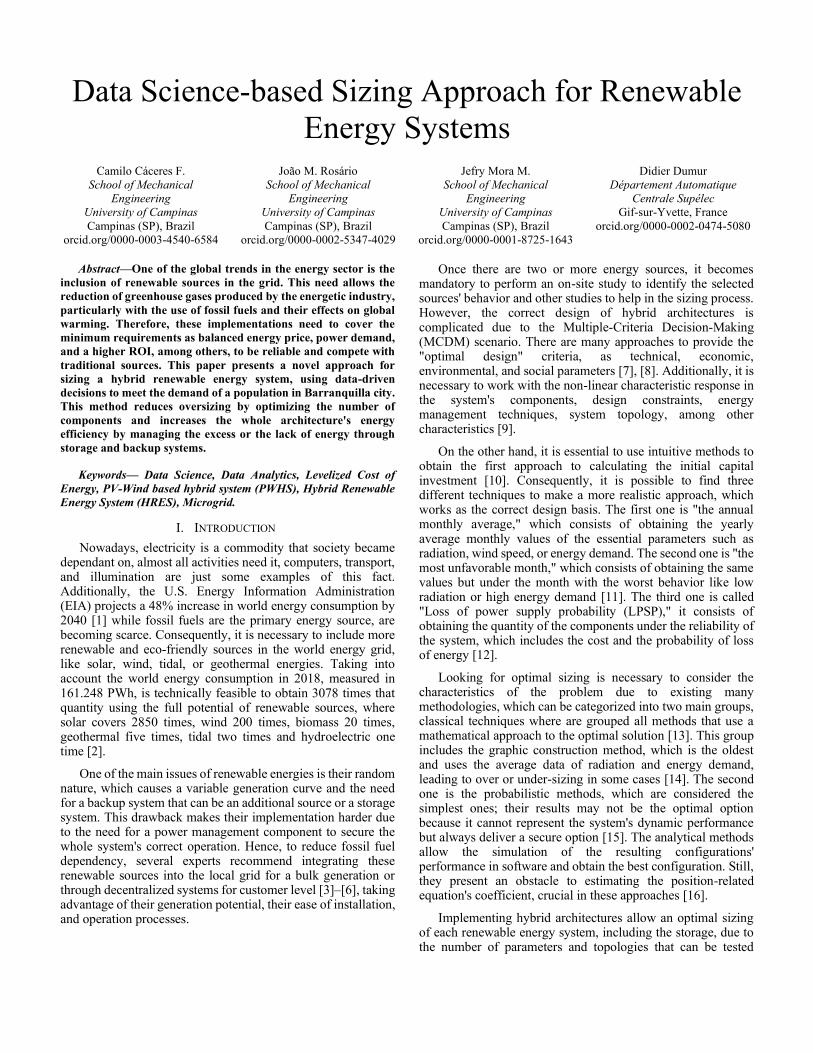
the design of a renewable energy system sizing. This work's
renewable energy system is based on photovoltaic (PV) cells,
wind turbines, and a storage system, as Fig 1 shows.
Fig. 1. Selected architecture, based on [21]
The development of the current work is founded on
identifying the Data Science life cycle; it can be divided into
eight steps according to [22], as Fig 2 shows. These eight steps
can be summarized according to Fig 2 by overlapping the main
four phases of the Data Analytics project proposed by [23].
The four phases of the Data Analytics project shown in Fig.
2 correspond to this work's methodological stages. Therefore,
each of them will be defined and involved in sizing the chosen
renewable energy system, as presented in the following sections.
A. Preparation
Following the ideas of [22], [23], the preparation phase leads to the problem understanding. It can be achieved through the definition of the challenge and the required data to solve it.
Therefore, it is possible to define a plan based on a hypothesis, identifying data sources, data acquisition, and selection.
Fig. 2. The Data Science life cycle proposed by [22] overlapped with the
Data Analytics phases proposed by [23]
In the context of this study, the preparation phase starts with understanding the required data for size the required amount of PV panels, wind turbines, and batteries. Hence, a deeper understanding of each system's mathematical models follows the models presented by [21]. It is possible to identify the related variables with this project. The global horizontal irradiance (GHI) and the wind speed are the climatic variables associated with the PV cells and the wind turbines. To size the system correctly, it is required to know the population's electric demand.
First, it is required to find a climatic database that includes the GHI and the wind speed to identify the chosen location's wind and photovoltaic potential. Databases like the Photovoltaic Geographical Information System (PGIS), NASA Surface Meteorology and Solar Energy Database, National Solar Radiation Data Base (NSRDB), IDEAM Atlas, Global Solar Atlas, Global Wind Atlas, and RETScreen were explored. Table I presents a summary of the data.
TABLE I. DATABASE COMPARISON
Database Period
(Years)
Sampling
Frequency
Mean
daily GHI
(W/m2)
Mean Wind
Speed - 10 m
(m/s)
NSRDB 1998-2017 30 min 5748 4.11
NASA 1981-2019 Day 5340 3.07
Atlas IDEAM
2009-2014 Month 6080 3.40
PGIS 2005-2015 Hour 5810 3.10
Global
Solar Atlas 1999-2015 Annual 5610 -
Global Wind Atlas
2001-2010 Annual - 4.07
RETScreen 2001-2010 Annual 5268 4.03
Following the results of Table I, and taking as a priority a higher sampling frequency and the period of the data collection, the database that fits the requirements is the NSRD database. Also, this database shows good data quality on its inspection.
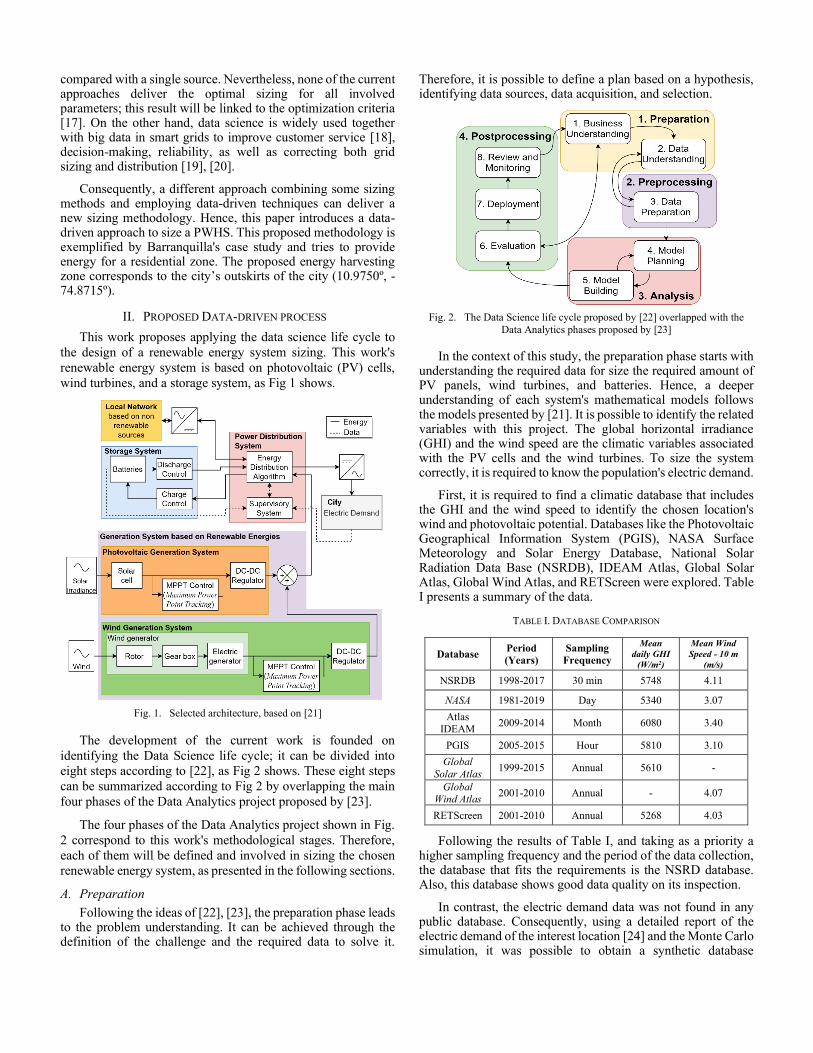
In contrast, the electric demand data was not found in any public database. Consequently, using a detailed report of the electric demand of the interest location [24] and the Monte Carlo simulation, it was possible to obtain a synthetic database
simulating the electrical demand. This database considers a residential load of around 4000 homes, following the statistical assumptions made by [24]. A representation of the obtained Monte Carlo simulation data is presented in Fig 3.
Fig. 3. Hourly Electric Demand obtained by Monte Carlo Simulation
B. Preprocessing
According to [22], [23], the preprocessing phase is characterized by activities that improve the collected raw data with tasks like data cleaning, filtering, correction, standardization, and transformation.
The preprocessing stage for the selected study begins with data gathering. Later, it was needed to merge the yearly datasets (20 years in total) sampled every 30 minutes provided by the NSRDB dataset. This merged dataset showed redundant information; as a result, the data were downsampled. The resampled dataset has an hourly sampling frequency; it reduced the dataset's size from 350400 to 175200. The obtained dataset showed a data quality, apparently without outliers or invalid data.
C. Analysis
According to [22], [23], the Analysis phase is characterized by the exploratory analysis of the gathered data. If it is required the creation of a model, that should be evaluated according to relevant parameters. The Analysis phase applied in the context of this study will allow the data understanding. Consequently, it will lead us to the size of the renewable energy system.
First, it is possible to summarize the collected databases statistically, allowing the observation and identification of each dataset's main features presented in Table II.
TABLE II. DATA SUMMARY
Description GHI
(W/m2)
Wind Speed –
10 m (m/s)
Electric Demand
(kWh)
Mean 239.52 4.11 6150.67
Standard deviation 321.43 1.55 1807.52
Minimum 0.00 0.00 2712.10
25th percentile 0.00 3.00 4459.42
50th percentile 0.00 4.20 5386.96
75th percentile 492.00 5.30 7760.66
Maximum 1061.00 8.80 9174.62
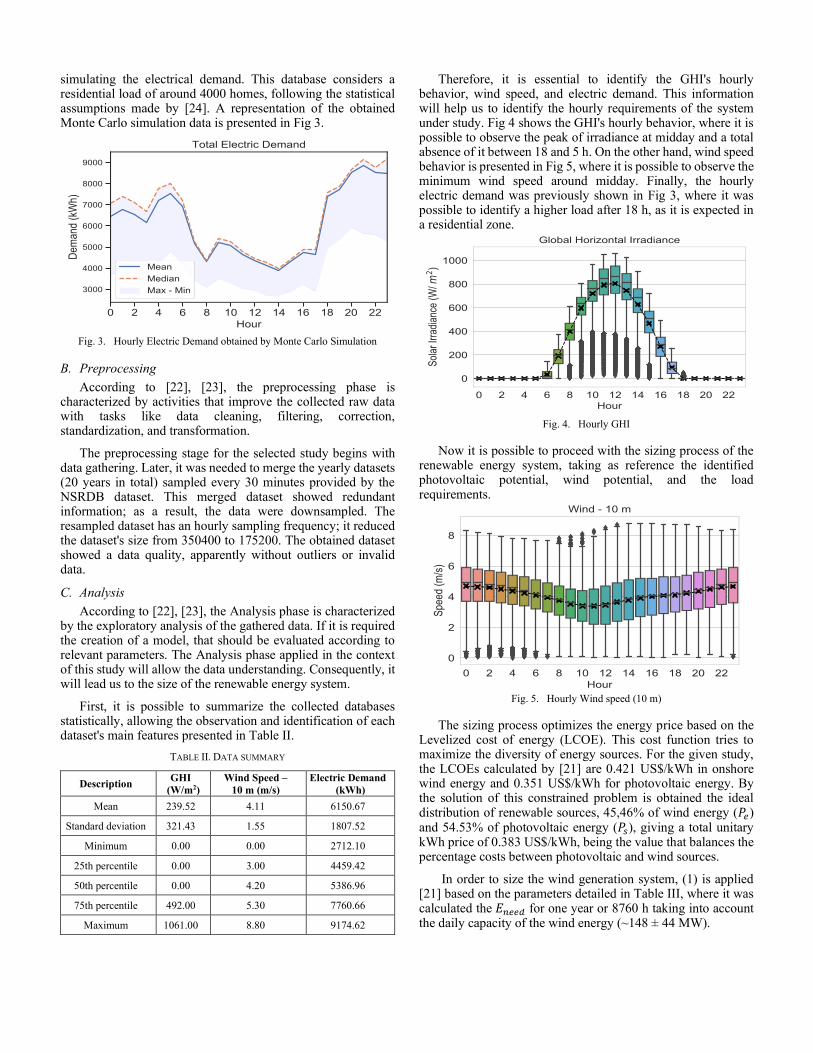
Therefore, it is essential to identify the GHI's hourly behavior, wind speed, and electric demand. This information will help us to identify the hourly requirements of the system under study. Fig 4 shows the GHI's hourly behavior, where it is possible to observe the peak of irradiance at midday and a total absence of it between 18 and 5 h. On the other hand, wind speed behavior is presented in Fig 5, where it is possible to observe the minimum wind speed around midday. Finally, the hourly electric demand was previously shown in Fig 3, where it was possible to identify a higher load after 18 h, as it is expected in a residential zone.
Fig. 4. Hourly GHI
Now it is possible to proceed with the sizing process of the renewable energy system, taking as reference the identified photovoltaic potential, wind potential, and the load requirements.
Fig. 5. Hourly Wind speed (10 m)
The sizing process optimizes the energy price based on the Levelized cost of energy (LCOE). This cost function tries to maximize the diversity of energy sources. For the given study, the LCOEs calculated by [21] are 0.421 US$/kWh in onshore wind energy and 0.351 US$/kWh for photovoltaic energy. By the solution of this constrained problem is obtained the ideal distribution of renewable sources, 45,46% of wind energy (𝑃𝑒) and 54.53% of photovoltaic energy (𝑃𝑠), giving a total unitary kWh price of 0.383 US$/kWh, being the value that balances the percentage costs between photovoltaic and wind sources.
In order to size the wind generation system, (1) is applied [21] based on the parameters detailed in Table III, where it was calculated the 𝐸𝑛𝑒𝑒𝑑 for one year or 8760 h taking into account the daily capacity of the wind energy (~148 ± 44 MW).

𝑃𝑇 =𝐸𝑛𝑒𝑒𝑑
𝐶𝑝 ∗ 𝜂𝑖𝑛𝑣 ∗ 8760ℎ∗ 𝑃𝑒 = 6.92 𝑀𝑊
(1)
TABLE III. CONSTANT VALUES OF WIND POWER SYSTEM
Symbol Value Meaning
𝑃𝑒 45,46% Required wind energy percentage based on total daily demand
𝐸𝑛𝑒𝑒𝑑 53.874 kW Mean daily required energy (Table II)
𝐶𝑝 0,45 Performance coefficient of the system
𝜂𝑖𝑛𝑣 0,9 Inverter Efficiency
The result of (1) shows that the wind generator needs to fulfill a requirement of 6.92 MW. Then, in the wind generator selection was possible to find the AGW 110 / 2.1 (tower 110 m high and capable of generating 2.1 MW of energy), made by WEG [25]. With this wind generator, it is possible to identify a need of 3.29 generators, which can be approximated to 3, under-sizing the system.
The photovoltaic system's sizing process is similar, but using (2)[21] and the data from Table IV. 𝐸75% is used as a data-driven safety factor to guarantee the projected amount of energy.
𝐸𝑛𝑒𝑒𝑑𝑝𝑣 =𝐸75%
𝜂𝑏𝑎𝑡𝑡 ∗ 𝜂𝑖𝑛𝑣∗ 𝑃𝑠 = 126.78 𝑀𝑊ℎ (2)
TABLE IV. CONSTANT VALUES OF SOLAR POWER SYSTEM
Symbol Value Meaning
𝐸75% 186.240 kW Daily energy consumption of the 75th
percentile (Table II)
𝜂𝑏𝑎𝑡𝑡 0,89 Battery Cell Efficiency
𝜂𝑖𝑛𝑣 0,9 Inverter Efficiency
𝑃𝑠 54.53% Percentage of required photovoltaic energy
𝑃𝑀𝑃𝑃 510 Watts Cell peak power per cell
𝐻𝑃𝑆𝑐𝑟𝑖𝑡 6,5 h Peak times of the solar irradiance (Fig. 4)
𝑃𝑅 0,9 Overall performance factor
𝑉𝑙𝑖𝑛𝑒 11200 V Line voltage defined for the system
𝑉𝑂𝐶 66,31 V Open-circuit voltage
The photovoltaic cells chosen are the TSH-S510 monocrystalline cells with 510 Watt-peak, according to [26]. With the necessary power for the photovoltaic panel, it is possible to identify the number of photovoltaic panels. Hence, (3), (4), and (5) are applied.
𝑁𝑇𝑜𝑡𝑎𝑙 =𝐸𝑛𝑒𝑒𝑑𝑝𝑣
𝑃𝑀𝑃𝑃 ∗ 𝐻𝑃𝑆𝑐𝑟𝑖𝑡 ∗ 𝑃𝑅= 42493 𝐶𝑒𝑙𝑙𝑠 (3)
𝑁𝑠𝑒𝑟𝑖𝑒𝑠 =𝑉𝑙𝑖𝑛𝑒𝑉𝑂𝐶
≅ 169 𝑐𝑒𝑙𝑙𝑠 (4)
𝑁𝑝𝑎𝑟𝑎𝑙𝑙𝑒𝑙 =𝑁𝑇𝑜𝑡𝑎𝑙𝑁𝑠𝑒𝑟𝑖𝑒
≅ 251 𝑐𝑒𝑙𝑙𝑠 (5)
A set of 169 cells in series and 251 in parallel were obtained through this procedure, totaling 42419 PV cells.
Finally, the storage system is calculated under an unfavorable condition of high demand and low generation, implying an oversizing of the storage system, guarantying its performance under normal circumstances. The chosen adverse electric generation condition corresponds to a low energy generation, represented by the 25th percentile of the hourly wind speed (Fig 5) and GHI (Fig 4). On the other hand, the high
demand condition corresponds to the electric demand's hourly 75th percentile (Fig 3).
Hence, it is required to verify the chosen photovoltaic cells' performance and wind generators to identify the lack of power the storage system needs to cover in the design with the given design scenario. For this purpose, it is mandatory to simulate the behavior of those systems under the given conditions.
The simulation process starts with adapting the climatic data of input to the project requirements. The GHI can be used as it is, but the gathered wind speed needs a modification. The wind speed data was collected on 10 m high, and according to the specifications of the chosen wind generators, the required wind speed corresponds to 110 m high. In the same direction, according to the NSRDB dataset, the gathered data corresponds to an approximation of the nearest meteorological station, in this case, the Ernesto Cortissoz Airport. Therefore, the wind speed values should be adjusted according to the terrain rugosity. The wind speed data is updated to the new requirements using the online rugosity conversion tool based on [27], [28], part of the parameters described in Table V, and the equation of height variation provided by [27], shown in (6).
𝑣2 = 𝑣1 ∗ln (
ℎ2𝑧0)
ln (ℎ1𝑧0) (6)
TABLE V. GENERAL VARIABLES OF THE WHOLE ARCHITECTURE
Symbol Meaning
𝑣1 Wind speed at the current height
𝑣2 Wind speed at the desired height
ℎ1 Reference height
ℎ2 Desired height
𝑧0 Location roughness length
𝑃𝑤 Power obtained in kW
𝑉110 Wind speed on 110 m
𝑃𝑓 Photovoltaic system generated power
With the adjusted wind speed, it is possible to verify the wind generator and photovoltaic performances under the given conditions. The wind generator output power can be obtained from its datasheet [25], and it can approximate in (7) [21] with a Pearson correlation coefficient R2 of 0.992.
𝑃𝑤(𝑉110)
=
{
0, 𝑉110 ≤ 2
−0.0024 𝑉1106 − 0.0353 𝑉110
5 + 1.2973 𝑉1104 − 8.1474 𝑉110
3
+35.637 𝑉1102 − 46.142 𝑉110 + 3.881
, 2 < 𝑉110 < 12
2100, 𝑉110 ≥ 12
(7)
In contrast, obtain the power generated by the photovoltaic cells can be more complicated. Still, it is possible to use the simulator developed by [21], under the given conditions, its behavior was approximated to (8), with a Pearson correlation coefficient R2 of 1.
𝑃𝑓(𝐺𝐻𝐼) = {0, 𝐺𝐻𝐼 ≤ 0
0,0772 𝐺𝐻𝐼2 + 20247 𝐺𝐻𝐼 + 28194, 𝐺𝐻𝐼 > 0 (8)
With the number of the photovoltaic cells and wind generators, its simulation models are given by (7) and (8), and the dataset that fulfills our needs is possible to identify the lack of power for the given study case and calculate the number of batteries required for this case study. Fig 6 shows the hourly
difference between the input and output power under the given conditions; the negative values are the lack of energy and the positive, the surplus power.
Adding up the lack of energy in the proposed system, according to Fig 6, it is possible to identify a daily lack of power of 59.021 MW (𝐸𝑙𝑎𝑐𝑘), what is what our storage system should supply. On the other hand, the surplus power corresponds to 60.051 MW, which will charge the storage system or can be used in the local grid for different purposes.
Fig. 6. The power difference between generated energy and demand
The storage system is calculated based on 𝐸𝑙𝑎𝑐𝑘 value, using the criteria presented by [21], and the data from Table VI, lead-acid batteries technology is used, following (9).
𝐶𝑛𝑒 =
𝐸𝑙𝑎𝑐𝑘 ∗ 𝐹𝑠𝑒𝑐𝑃𝐷𝑒𝑒𝑝𝑀𝑎𝑥𝑉𝐵𝑎𝑡𝑡𝐿
≅ 14930 𝐴ℎ (9)
TABLE VI. CONSTANT VALUES OF BATTERY POWER SYSTEM
Symbol Value Meaning
𝐸𝑙𝑎𝑐𝑘 59,021 MWh Identified lack of power
𝐶𝑛𝑒 - Battery nominal capacity
𝑃𝐷𝑒𝑒𝑝𝑀𝑎𝑥 0,6 Maximum discharge depth
𝑉𝐵𝑎𝑡𝑡𝐿 11200 V Line voltage of the storage system
𝐹𝑠𝑒𝑐 1,7 Arbitrary safety factor
𝑃𝑛 3000 Ah Hourly supplied Current
𝑉𝑏𝑎𝑡𝑡 2 V Battery voltage
∆𝑇𝐵 - Difference between ambient and
current battery temperatures
𝑆𝑂𝐶 - Battery state of charge
𝐼𝐵 - Battery current
Consequently, it is possible to identify the number of batteries following (10) and (11).
𝐵𝑃𝑎𝑟𝑎𝑙𝑙𝑒𝑙 =𝐶𝑛𝑒𝑃𝑛
≅ 5 𝐵𝑎𝑡𝑡𝑒𝑟𝑖𝑒𝑠 (10)
𝐵𝑆𝑒𝑟𝑖𝑒𝑠 =𝑉𝐵𝑎𝑡𝑡𝐿𝑉𝑏𝑎𝑡𝑡
= 5600 𝐵𝑎𝑡𝑡𝑒𝑟𝑖𝑒𝑠 (11)
Where 𝑃𝑛 and 𝑉𝑏𝑎𝑡𝑡 are inner constants of the selected batteries and were taken from [21]. From (10) and (11), it is possible to conclude that the needed storage system requires 28000 lead-acid batteries with 2 V and 3000 Ah, distributed as shown above.
Summarizing, the designed system has 3 wind generators with a capacity of 2.1 MW and 110 m high, 42419 monocrystalline photovoltaic cells with 510 Watts-peak, and 28000 lead-acid batteries with 2 V and 3000 Ah.
D. Postprocessing
The postprocessing stage requires the evaluation of the developed models according to the chosen metrics. It is a
documentation and communication phase, where the system's performance is monitored carefully [22], [23].
In this case study, the system's evaluation is done with simulation, including the models (7), (8), a battery charge/ discharge model, and a power distribution system, following Fig 1. The model of the hourly battery charge is presented in (12), and the discharge in (13); both models were obtained from [21].
𝑉𝐵 = [2 − 0.16 𝑆𝑂𝐶] +𝐼
𝐶10(
6
1 + 𝐼𝐵0,86 +
0.48
(1 − 𝑆𝑂𝐶)1,2+ 0.036) ∗ (1 − 0.025∆𝑇𝐵) (12)
𝑉𝐵 = [2.085 − 0.12(1 − 𝑆𝑂𝐶)] −𝐼
𝐶10(
4
1 + 𝐼𝐵1,3 +
0.27
𝑆𝑂𝐶1,5+ 0.02)
∗ (1 − 0.007∆𝑇𝐵) (13)
On the other hand, the power distribution system used in this stage corresponds to a simple flowchart that distributes the energy according to the storage system state of charge (SOC); the details of this flowchart are shown by [21].
Once the sizing of PWHS is obtained, the next step is to implement the whole architecture in a simulation platform, which in this case, is performed under the python environment. The system was tested under several conditions of our dataset, and it was possible to observe the system handles the demand sufficiently as expected. The behavior of the system during two random days is shown.
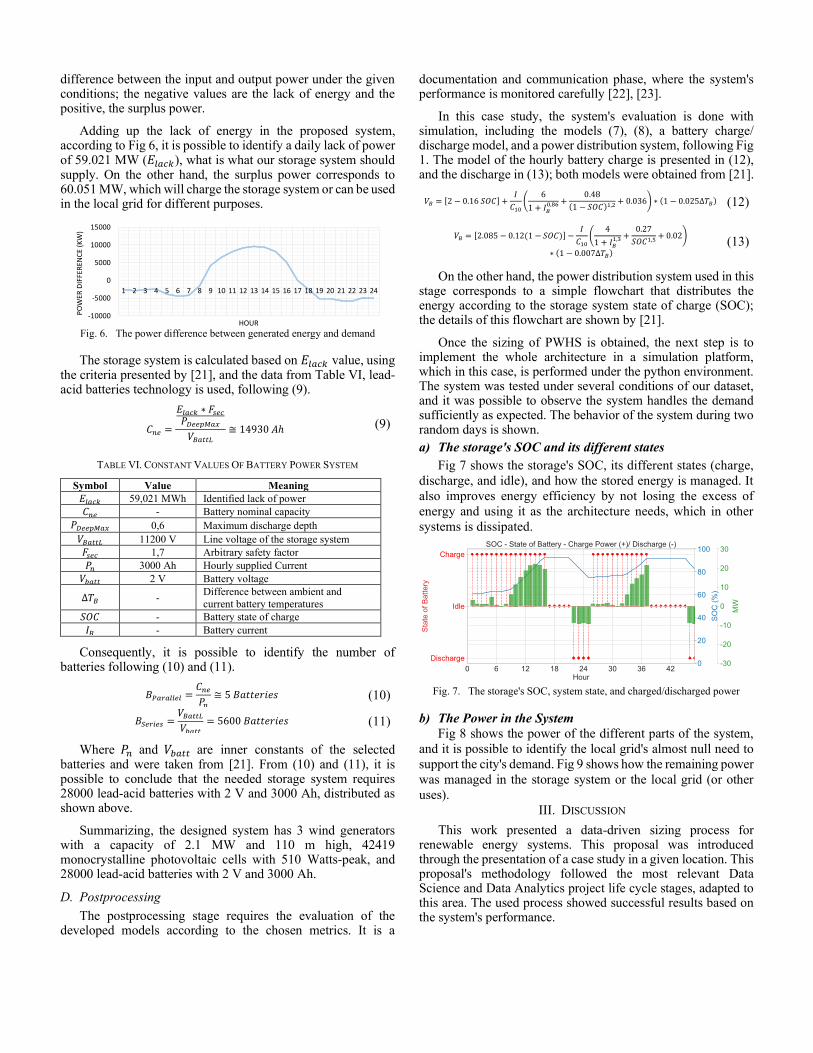
a) The storage's SOC and its different states
Fig 7 shows the storage's SOC, its different states (charge,
discharge, and idle), and how the stored energy is managed. It
also improves energy efficiency by not losing the excess of
energy and using it as the architecture needs, which in other
systems is dissipated.
Fig. 7. The storage's SOC, system state, and charged/discharged power
b) The Power in the System
Fig 8 shows the power of the different parts of the system,
and it is possible to identify the local grid's almost null need to
support the city's demand. Fig 9 shows how the remaining power
was managed in the storage system or the local grid (or other
uses).
III. DISCUSSION
This work presented a data-driven sizing process for renewable energy systems. This proposal was introduced through the presentation of a case study in a given location. This proposal's methodology followed the most relevant Data Science and Data Analytics project life cycle stages, adapted to this area. The used process showed successful results based on the system's performance.
-10000
-5000
0
5000
10000
15000
1 2 3 4 5 6 7 8 9 10 11 12 13 14 15 16 17 18 19 20 21 22 23 24
PO
WER
DIF
FER
ENC
E (K
W)
HOUR
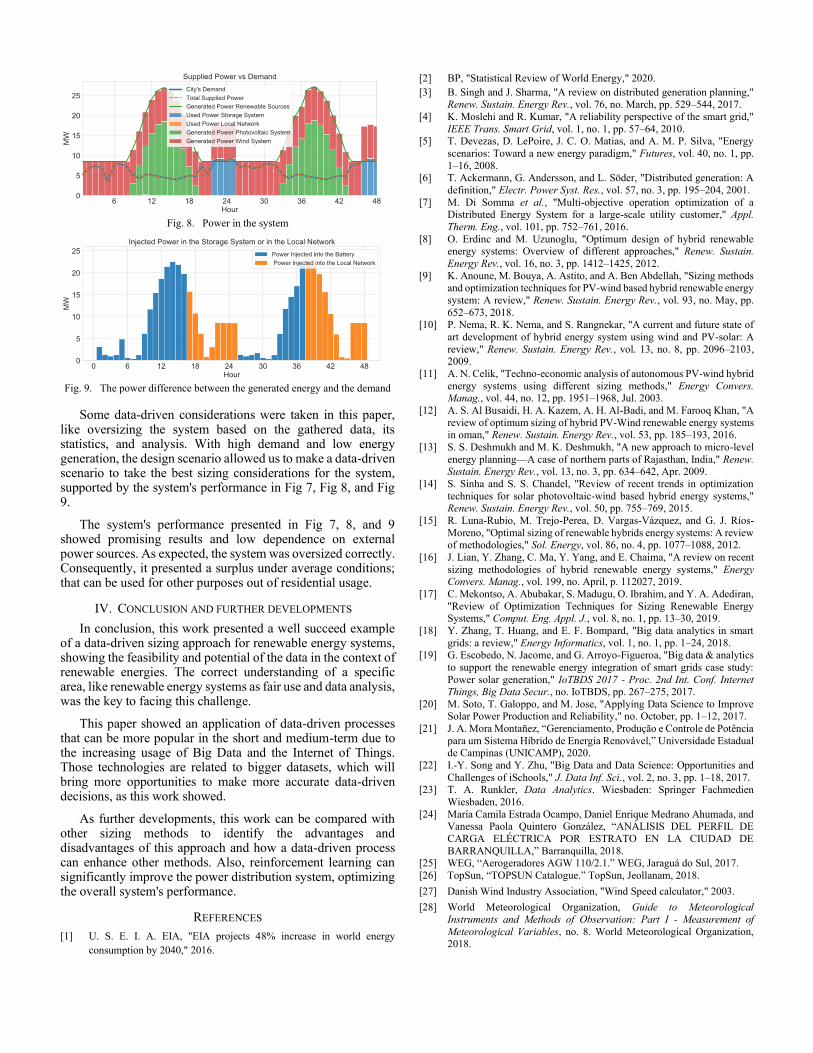
Fig. 8. Power in the system
Fig. 9. The power difference between the generated energy and the demand
Some data-driven considerations were taken in this paper, like oversizing the system based on the gathered data, its statistics, and analysis. With high demand and low energy generation, the design scenario allowed us to make a data-driven scenario to take the best sizing considerations for the system, supported by the system's performance in Fig 7, Fig 8, and Fig 9.
The system's performance presented in Fig 7, 8, and 9 showed promising results and low dependence on external power sources. As expected, the system was oversized correctly. Consequently, it presented a surplus under average conditions; that can be used for other purposes out of residential usage.
IV. CONCLUSION AND FURTHER DEVELOPMENTS
In conclusion, this work presented a well succeed example of a data-driven sizing approach for renewable energy systems, showing the feasibility and potential of the data in the context of renewable energies. The correct understanding of a specific area, like renewable energy systems as fair use and data analysis, was the key to facing this challenge.
This paper showed an application of data-driven processes that can be more popular in the short and medium-term due to the increasing usage of Big Data and the Internet of Things. Those technologies are related to bigger datasets, which will bring more opportunities to make more accurate data-driven decisions, as this work showed.
As further developments, this work can be compared with other sizing methods to identify the advantages and disadvantages of this approach and how a data-driven process can enhance other methods. Also, reinforcement learning can significantly improve the power distribution system, optimizing the overall system's performance.
REFERENCES
[1] U. S. E. I. A. EIA, "EIA projects 48% increase in world energy
consumption by 2040," 2016.
[2] BP, "Statistical Review of World Energy," 2020.
[3] B. Singh and J. Sharma, "A review on distributed generation planning,"
Renew. Sustain. Energy Rev., vol. 76, no. March, pp. 529–544, 2017.
[4] K. Moslehi and R. Kumar, "A reliability perspective of the smart grid,"
IEEE Trans. Smart Grid, vol. 1, no. 1, pp. 57–64, 2010. [5] T. Devezas, D. LePoire, J. C. O. Matias, and A. M. P. Silva, "Energy
scenarios: Toward a new energy paradigm," Futures, vol. 40, no. 1, pp.
1–16, 2008. [6] T. Ackermann, G. Andersson, and L. Söder, "Distributed generation: A
definition," Electr. Power Syst. Res., vol. 57, no. 3, pp. 195–204, 2001.
[7] M. Di Somma et al., "Multi-objective operation optimization of a Distributed Energy System for a large-scale utility customer," Appl.
Therm. Eng., vol. 101, pp. 752–761, 2016.
[8] O. Erdinc and M. Uzunoglu, "Optimum design of hybrid renewable energy systems: Overview of different approaches," Renew. Sustain.
Energy Rev., vol. 16, no. 3, pp. 1412–1425, 2012.
[9] K. Anoune, M. Bouya, A. Astito, and A. Ben Abdellah, "Sizing methods and optimization techniques for PV-wind based hybrid renewable energy
system: A review," Renew. Sustain. Energy Rev., vol. 93, no. May, pp.
652–673, 2018.
[10] P. Nema, R. K. Nema, and S. Rangnekar, "A current and future state of
art development of hybrid energy system using wind and PV-solar: A
review," Renew. Sustain. Energy Rev., vol. 13, no. 8, pp. 2096–2103, 2009.
[11] A. N. Celik, "Techno-economic analysis of autonomous PV-wind hybrid
energy systems using different sizing methods," Energy Convers. Manag., vol. 44, no. 12, pp. 1951–1968, Jul. 2003.
[12] A. S. Al Busaidi, H. A. Kazem, A. H. Al-Badi, and M. Farooq Khan, "A
review of optimum sizing of hybrid PV-Wind renewable energy systems in oman," Renew. Sustain. Energy Rev., vol. 53, pp. 185–193, 2016.
[13] S. S. Deshmukh and M. K. Deshmukh, "A new approach to micro-level
energy planning—A case of northern parts of Rajasthan, India," Renew. Sustain. Energy Rev., vol. 13, no. 3, pp. 634–642, Apr. 2009.
[14] S. Sinha and S. S. Chandel, "Review of recent trends in optimization
techniques for solar photovoltaic-wind based hybrid energy systems," Renew. Sustain. Energy Rev., vol. 50, pp. 755–769, 2015.
[15] R. Luna-Rubio, M. Trejo-Perea, D. Vargas-Vázquez, and G. J. Ríos-
Moreno, "Optimal sizing of renewable hybrids energy systems: A review of methodologies," Sol. Energy, vol. 86, no. 4, pp. 1077–1088, 2012.
[16] J. Lian, Y. Zhang, C. Ma, Y. Yang, and E. Chaima, "A review on recent
sizing methodologies of hybrid renewable energy systems," Energy Convers. Manag., vol. 199, no. April, p. 112027, 2019.
[17] C. Mekontso, A. Abubakar, S. Madugu, O. Ibrahim, and Y. A. Adediran,
"Review of Optimization Techniques for Sizing Renewable Energy Systems," Comput. Eng. Appl. J., vol. 8, no. 1, pp. 13–30, 2019.
[18] Y. Zhang, T. Huang, and E. F. Bompard, "Big data analytics in smart
grids: a review," Energy Informatics, vol. 1, no. 1, pp. 1–24, 2018. [19] G. Escobedo, N. Jacome, and G. Arroyo-Figueroa, "Big data & analytics
to support the renewable energy integration of smart grids case study:
Power solar generation," IoTBDS 2017 - Proc. 2nd Int. Conf. Internet Things, Big Data Secur., no. IoTBDS, pp. 267–275, 2017.
[20] M. Soto, T. Galoppo, and M. Jose, "Applying Data Science to Improve Solar Power Production and Reliability," no. October, pp. 1–12, 2017.
[21] J. A. Mora Montañez, “Gerenciamento, Produção e Controle de Potência
para um Sistema Híbrido de Energia Renovável,” Universidade Estadual de Campinas (UNICAMP), 2020.
[22] I.-Y. Song and Y. Zhu, "Big Data and Data Science: Opportunities and
Challenges of iSchools," J. Data Inf. Sci., vol. 2, no. 3, pp. 1–18, 2017. [23] T. A. Runkler, Data Analytics. Wiesbaden: Springer Fachmedien
Wiesbaden, 2016.
[24] María Camila Estrada Ocampo, Daniel Enrique Medrano Ahumada, and Vanessa Paola Quintero González, “ANÁLISIS DEL PERFIL DE
CARGA ELÉCTRICA POR ESTRATO EN LA CIUDAD DE
BARRANQUILLA,” Barranquilla, 2018. [25] WEG, “Aerogeradores AGW 110/2.1.” WEG, Jaraguá do Sul, 2017.
[26] TopSun, “TOPSUN Catalogue.” TopSun, Jeollanam, 2018.
[27] Danish Wind Industry Association, "Wind Speed calculator," 2003.
[28] World Meteorological Organization, Guide to Meteorological
Instruments and Methods of Observation: Part I - Measurement of
Meteorological Variables, no. 8. World Meteorological Organization, 2018.