data usability summary report analysis of various …
TRANSCRIPT

DATA USABILITY SUMMARY REPORT
ANALYSIS OF VARIOUS ANALYTES
IN AQUEOUS SAMPLES
1030 WATER STREET, VILLAGE OF NORTH BENNINGTON,
BENNINGTON COUNTY, VERMONT, VTDEC SMS SITE # 20164630
SAMPLE DELIVERY GROUPS: SNB06 AND SNB15
November 22, 2017
Prepared for:
C.T. MALE ASSOCIATES 50 Century Hill Drive Latham, NY 12110
Prepared by:
ENVIRONMENTAL STANDARDS, INC. 1140 Valley Forge Road
P.O. Box 810 Valley Forge, PA 19482-0810
© 2017 Environmental Standards, Inc. - All Rights Reserved

TABLE OF CONTENTS Introduction Section 1 Quality Assurance Review
A. Organic Data Review B. Inorganic and Wet Chemistry Data Review C. Conclusions
Section 2 Validated Data Summary Tables
A. SDG SNB06
B. SDG SNB15
Section 3 Laboratory Calibration and Quality Control Acceptance Criteria Section 4 Environmental Standards, Inc., Standard Operating Procedure Section 5 Data Support Documentation
A. SDG SNB06
B. SDG SNB15 Section 6 Project Correspondence

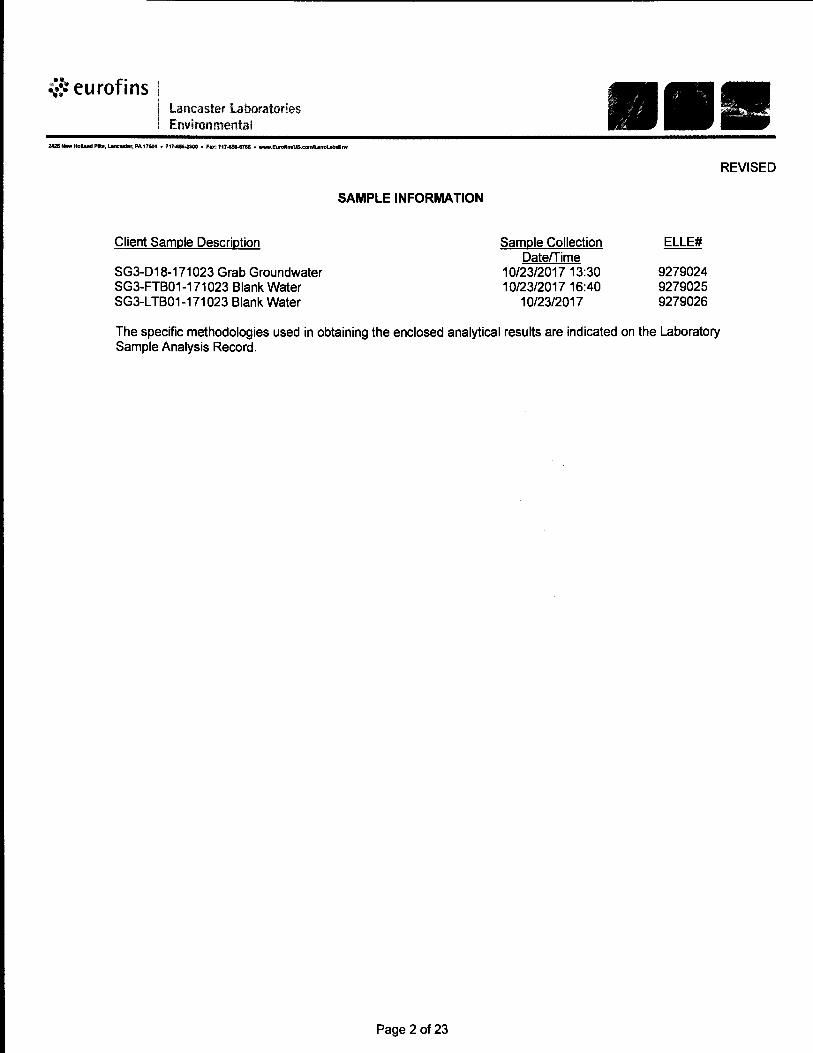
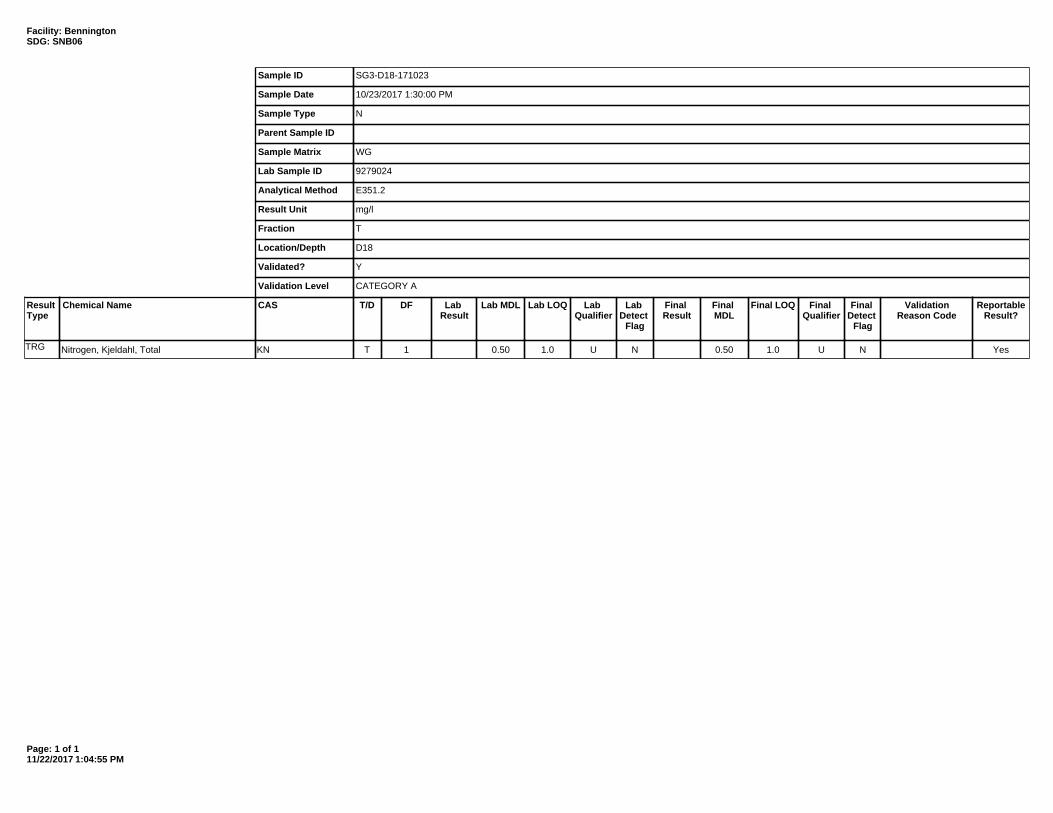
Introduction This Data Usability Summary Report (DUSR) was based upon a rigorous examination of the data generated from samples that were collected on October 23 and 25, 2017, as part of the 1030 Water Street, Village of North Bennington, Vermont project based on the “Initial Site Characterization Investigation Work Plan Saint-Gobain Performance Plastics Site 1030 Water Street, Village of North Bennington, Bennington County, Vermont” (Work Plan, April 2016). The analyses of the samples (and associated quality control [QC] samples) listed on the table below were performed by Eurofins Lancaster Laboratories Environmental (ELLE) of Lancaster, Pennsylvania. Aqueous samples were analyzed for perfluorinated and polyfluorinated alkyl substances (PFASs) according to ELLE’s internal standard operating procedure (SOP) “Polyfluorinated Alkyl Substances (PFASs) in Aqueous Samples by Method 537 Revision 1.1 Using LC/MS/MS” (Eurofins document reference T-PFAS-WI14355, Version 3). All other analyses were performed in accordance with US EPA, Standard Method (SM), or SW-846 methods. The Analytical Services Protocol (ASP) Category A data deliverables were prepared by the laboratory and were reviewed by Environmental Standards, Inc. (Environmental Standards). In addition, additional data deliverables from the ASP Category B data package prepared by the laboratory were reviewed for analyses that underwent a Full quality assurance (QA) review. The samples that have undergone a Full or Limited QA review are listed on Table 1. Table 1 also presents the laboratory sample number, laboratory Sample Delivery Group (SDG), matrix, collection date, review type, and parameters analyzed and reviewed for the samples. The reported analytical results are presented on the validated data summary tables included in Section 2. These validated data summary tables were generated from electronic data deliverables (EDDs) provided by the laboratory and have been edited by the data reviewer to include all final data validation qualifiers and results. The “Lab Result,” “Lab MDL” (i.e., the method detection limit [MDL]), “Lab LOQ” (i.e., the limit of quantitation [LOQ]), “Lab Qualifier,” and “Lab Detect Flag” fields presented on the validated data summary tables were derived directly from the laboratory-provided EDD. Errors in the “Lab Result,” “Lab MDL,” “Lab LOQ,” and “Lab Detect Flag” fields noted during validation have been corrected, and the corrections are reflected in the “Final Result,” “Final MDL,” “Final LOQ,” and “Final Detect Flag” fields, respectively, on the validated data summary tables. Validation qualifier codes have been placed in the “Validation Qualifier” fields on the data tables to enable the data user to quickly assess the qualitative and/or quantitative reliability of a result based on the criteria evaluated during this QA review. Finally, the “Validation Reason Code” field has been populated with codes that indicate the reason for the validation qualifiers. Definitions of the validation qualifier and reason codes are presented with the validated data summary tables. This QA review has been performed with guidance from the “National Functional Guidelines for Organic Superfund Data Review” (US EPA, September 2016), the “National Functional Guidelines for High Resolution Superfund Methods Data Review” (US EPA, April 2016), and the “National Functional Guidelines for Inorganic Superfund Data Review” (US EPA, September 2016); however, these validation guidance documents specifically address analyses performed in accordance with the Contract Laboratory Program (CLP) analytical methods and

are not completely applicable to the type of analyses and analytical protocol performed by the laboratory for these samples. Environmental Standards used professional judgment to determine the usability of the analytical results and compliance relative to the requirements specified in the Work Plan, ELLE’s internal SOP for PFAS analysis, US EPA methods, SW-846 methods, and SM analyses. US EPA Method 537 is written strictly for drinking water samples, and no approved US EPA method currently exists for other sample matrices. Although ELLE’s internal SOP references US EPA Method 537 for PFAS analysis, the procedures are really “in-house” procedures that are also considered “Confidential Information”; therefore, a summary of the Calibration and QC Requirements used by ELLE for PFAS analysis has been included in Section 3. In addition, the SOP used by Environmental Standards to validate data generated under the ELLE PFAS SOP is provided in Section 4. Details of this QA review are presented in Section 1 of this DUSR. This critical DUSR identifies data quality issues for specific samples and specific evaluation criteria. The data qualifications allow the data end-user to best understand the usability of the analysis results. Data not qualified in this report should be considered valid based on the QC criteria that have been reviewed. Section 5 of the report presents the Data Support Documentation for this DUSR. Project Correspondence is presented in Section 6.
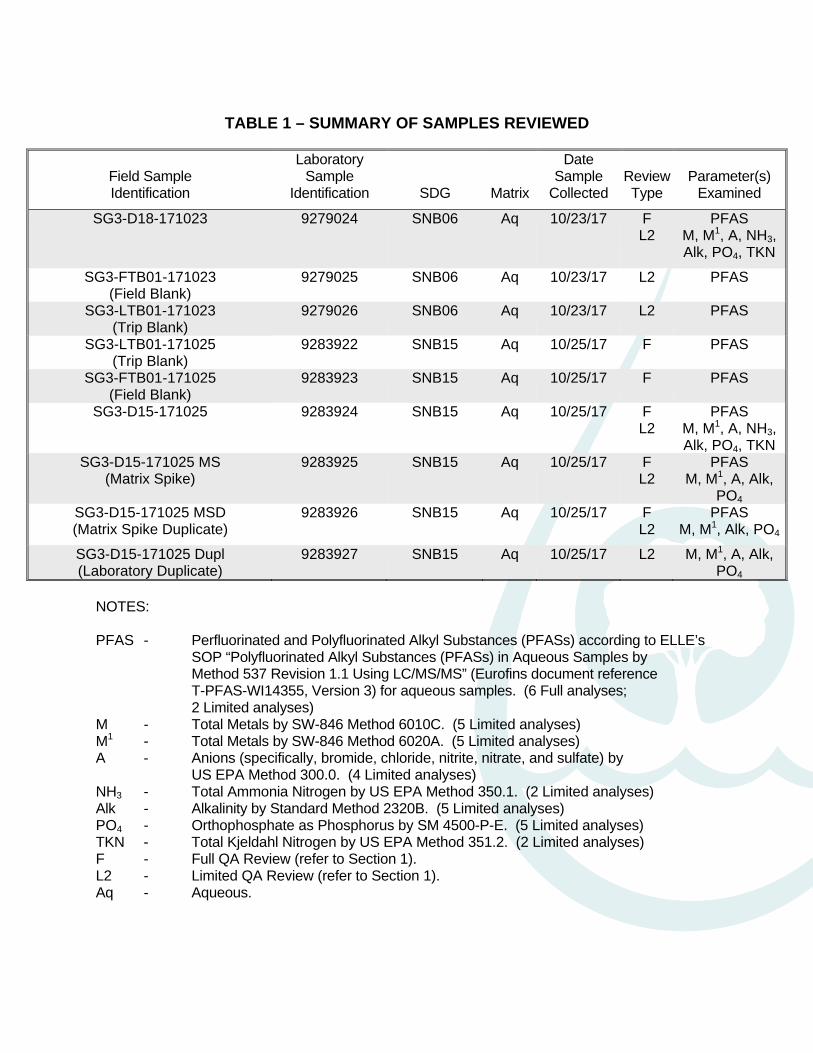
TABLE 1 – SUMMARY OF SAMPLES REVIEWED
Field Sample Identification
Laboratory Sample
Identification
SDG
Matrix
Date Sample
Collected ReviewType
Parameter(s)
Examined
SG3-D18-171023 9279024 SNB06 Aq 10/23/17 F L2
PFAS M, M1, A, NH3, Alk, PO4, TKN
SG3-FTB01-171023 (Field Blank)
9279025 SNB06 Aq 10/23/17 L2 PFAS
SG3-LTB01-171023 (Trip Blank)
9279026 SNB06 Aq 10/23/17 L2 PFAS
SG3-LTB01-171025 (Trip Blank)
9283922 SNB15 Aq 10/25/17 F PFAS
SG3-FTB01-171025 (Field Blank)
9283923 SNB15 Aq 10/25/17 F PFAS
SG3-D15-171025 9283924 SNB15 Aq 10/25/17 F L2
PFAS M, M1, A, NH3, Alk, PO4, TKN
SG3-D15-171025 MS (Matrix Spike)
9283925 SNB15 Aq 10/25/17 F L2
PFAS M, M1, A, Alk,
PO4 SG3-D15-171025 MSD (Matrix Spike Duplicate)
9283926 SNB15 Aq 10/25/17 F L2
PFAS M, M1, Alk, PO4
SG3-D15-171025 Dupl (Laboratory Duplicate)
9283927 SNB15 Aq 10/25/17 L2 M, M1, A, Alk, PO4
NOTES: PFAS - Perfluorinated and Polyfluorinated Alkyl Substances (PFASs) according to ELLE’s
SOP “Polyfluorinated Alkyl Substances (PFASs) in Aqueous Samples by Method 537 Revision 1.1 Using LC/MS/MS” (Eurofins document reference T-PFAS-WI14355, Version 3) for aqueous samples. (6 Full analyses; 2 Limited analyses)
M - Total Metals by SW-846 Method 6010C. (5 Limited analyses) M1 - Total Metals by SW-846 Method 6020A. (5 Limited analyses) A - Anions (specifically, bromide, chloride, nitrite, nitrate, and sulfate) by
US EPA Method 300.0. (4 Limited analyses) NH3 - Total Ammonia Nitrogen by US EPA Method 350.1. (2 Limited analyses) Alk - Alkalinity by Standard Method 2320B. (5 Limited analyses) PO4 - Orthophosphate as Phosphorus by SM 4500-P-E. (5 Limited analyses) TKN - Total Kjeldahl Nitrogen by US EPA Method 351.2. (2 Limited analyses) F - Full QA Review (refer to Section 1). L2 - Limited QA Review (refer to Section 1). Aq - Aqueous.

Section 1 Quality Assurance Review A. Organic Data Review The organic analyses of eight aqueous samples (including QC samples) collected as part of the 1030 Water Street, Village of North Bennington, Vermont project on and October 23 and 25, 2017, were performed by ELLE. Aqueous samples were analyzed for PFASs according to ELLE’s internal SOP “Polyfluorinated Alkyl Substances (PFASs) in Aqueous Samples by Method 537 Revision 1.1 Using LC/MS/MS” (Eurofins document reference T-PFAS-WI14355, Version 3). Specific analyses reviewed for all samples are identified on Table 1. The data were presented in Category A and B data deliverables. The findings offered in this report for analyses that underwent a Limited QA review are based upon a review of tabulated QC summary forms, including the following QC measures:
Sample and extract holding times Sample condition upon laboratory receipt
Blank analysis results Matrix spike/matrix spike duplicate (MS/MSD) results
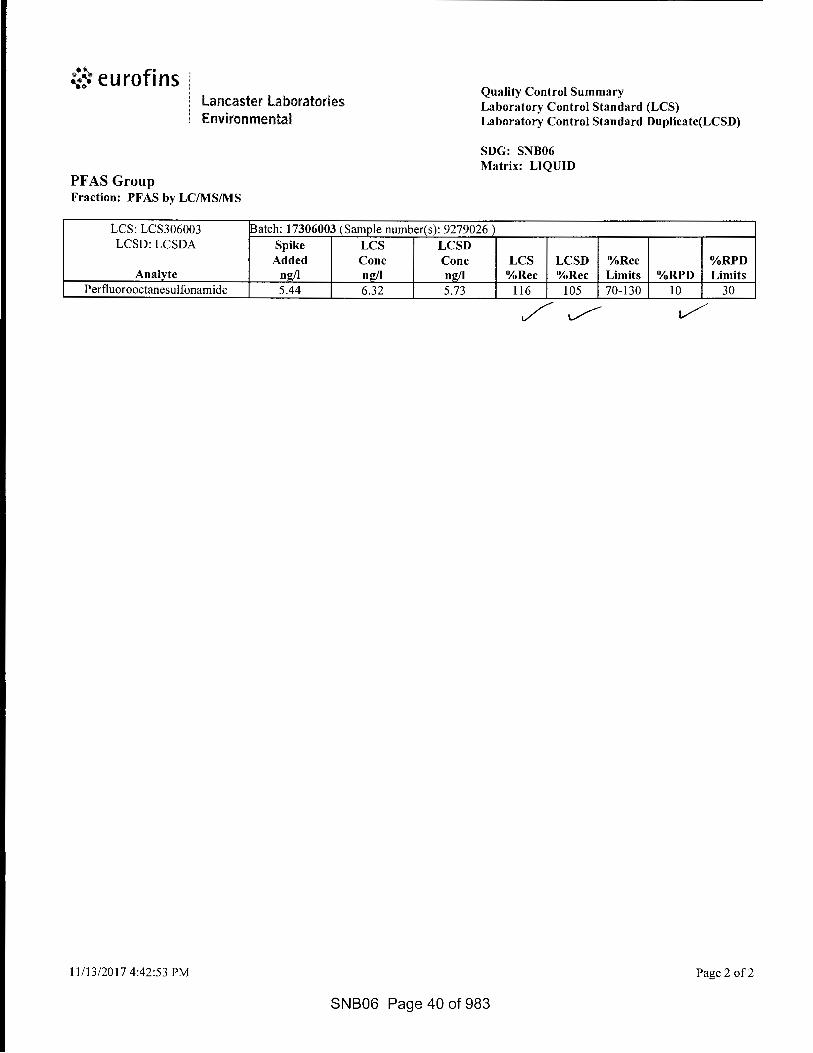
Laboratory control sample/laboratory control sample duplicate (LCS/LCSD) results
Labeled pre-extraction internal standard recoveries
The findings offered in this report for analyses that underwent a Full QA review are based upon a rigorous review of all tabulated QC summary forms and all raw data, including the following QC measures:
Sample and extract holding times Sample condition upon laboratory receipt
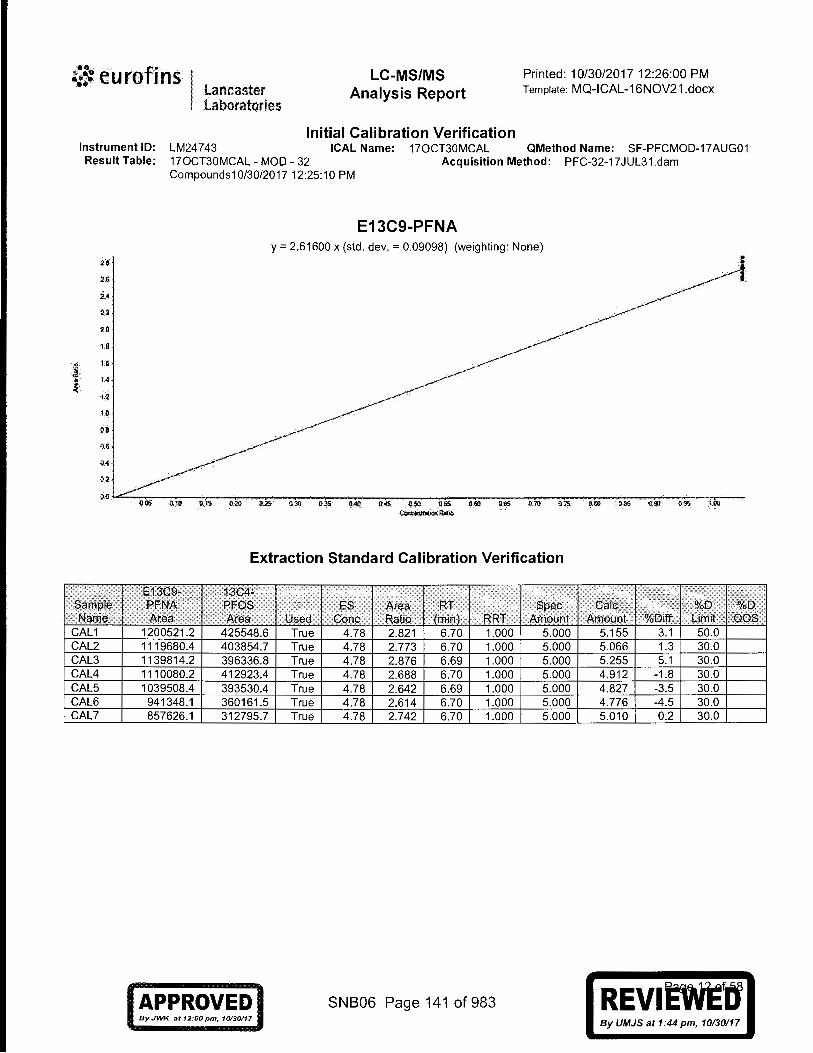
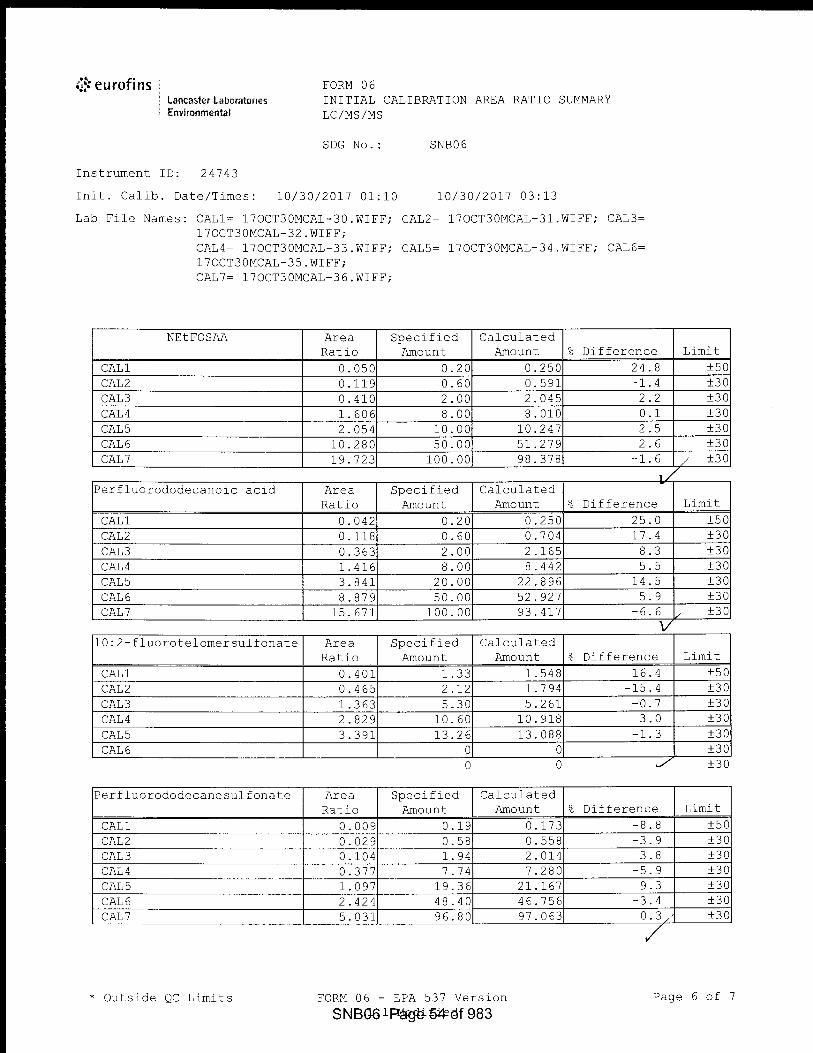
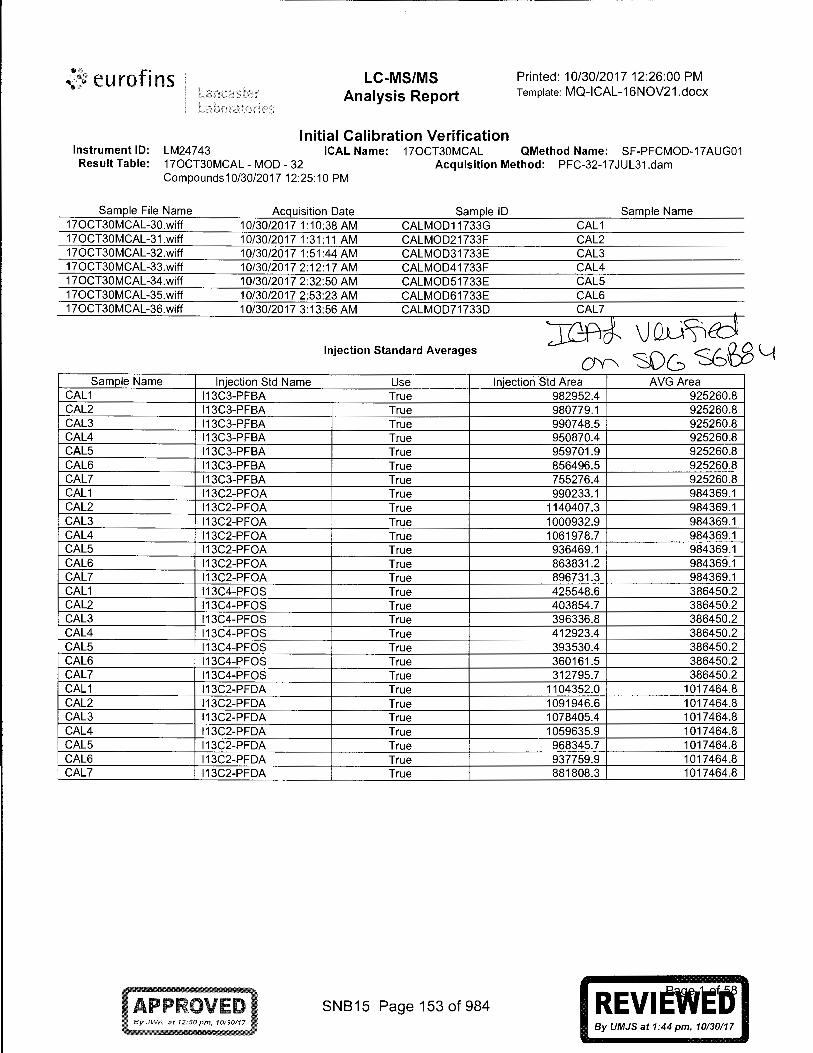
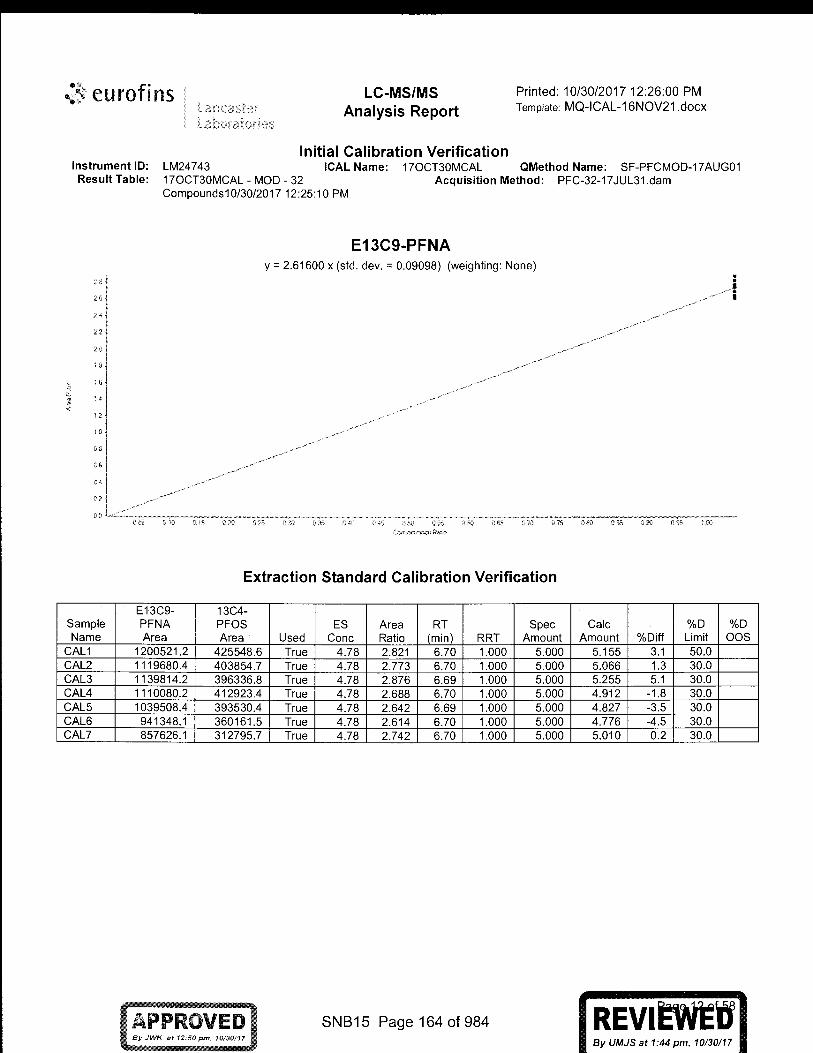
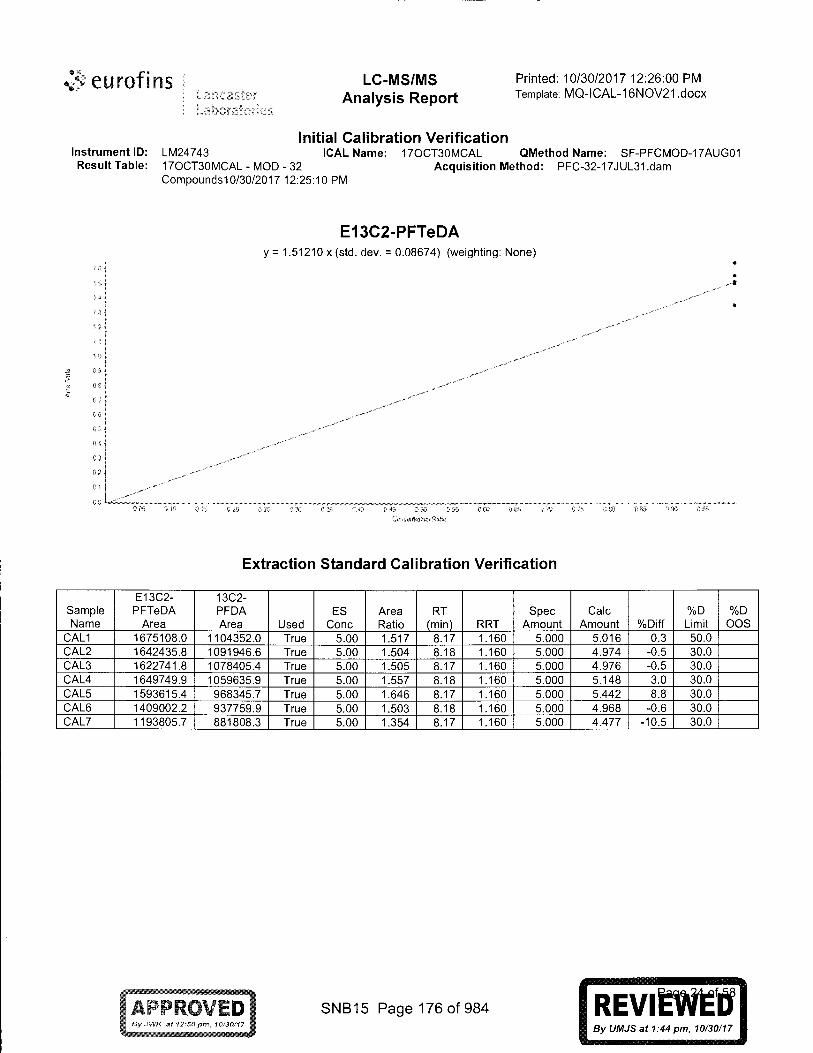
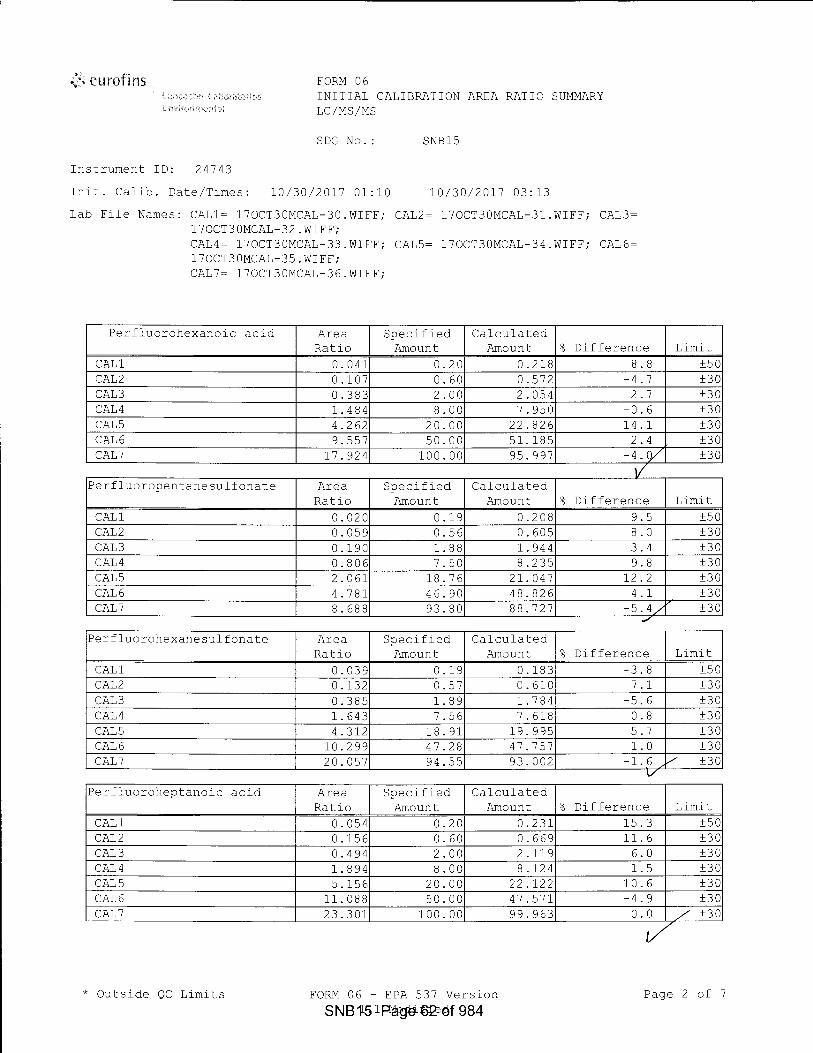
Blank analysis results Initial calibrations
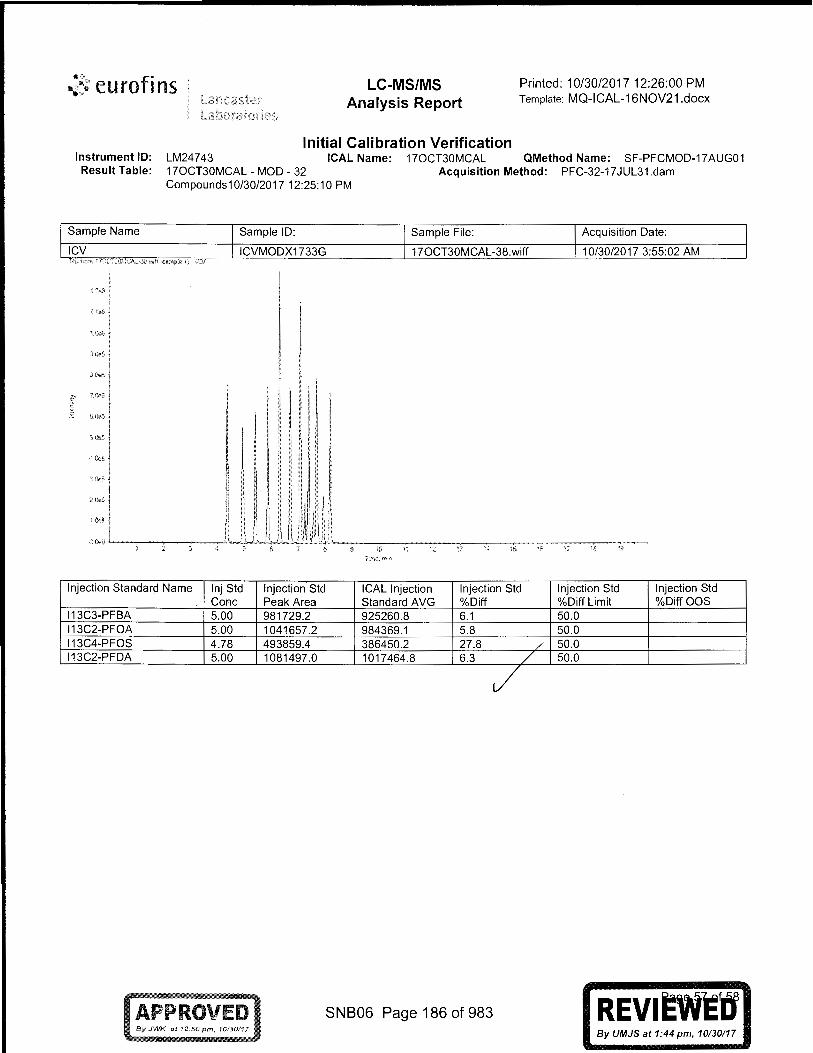
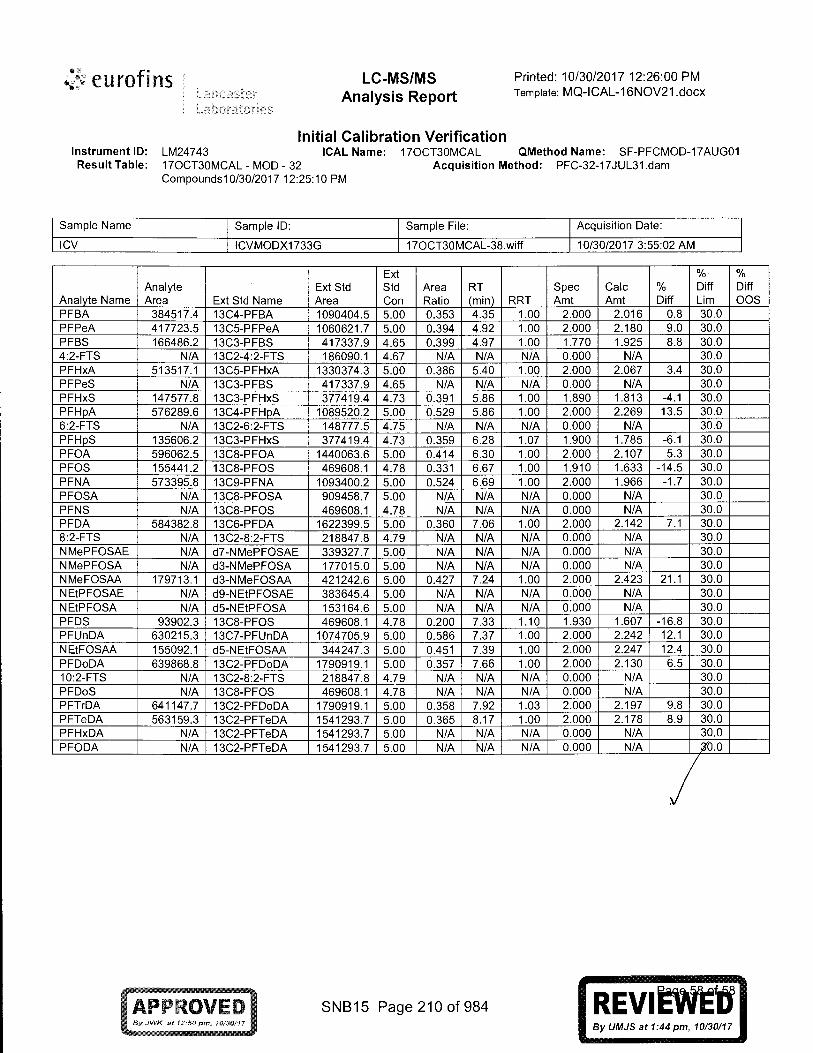
Second-source initial calibration verification (ICV) recoveries
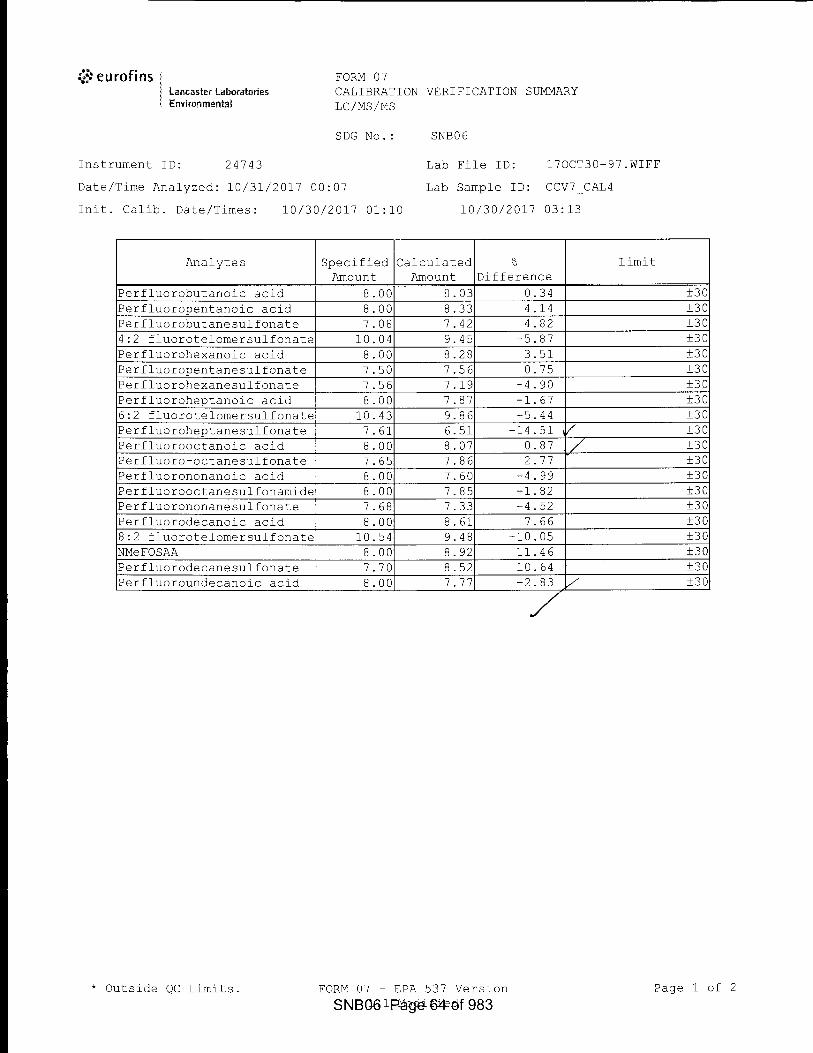
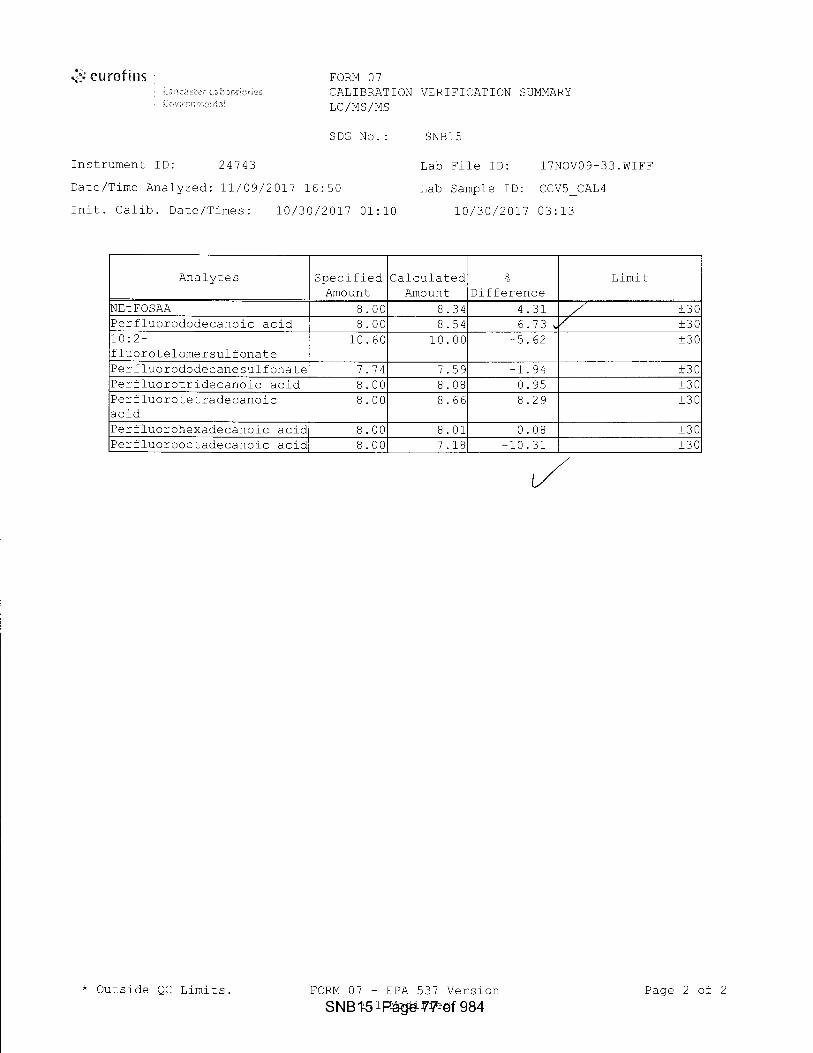
Continuing calibration verification (CCV) recoveries
LCS/LCSD results MS/MSD results
Labeled pre-extraction internal standard recoveries
Pre-injection internal standard responses
Qualitative identification Quantitation of results
Analytical sequence
The analytical results for the organic target compounds are presented on the validated data summary tables in Section 2 of this report. The validated data summary tables include the full names of the target analytes along with their associated acronyms, which are used throughout the text of this DUSR. A summary of ELLE’s Calibration and QC Requirements has been included in Section 3. The SOP used by Environmental Standards to validate data generated under the ELLE SOP is provided in Section 4. Additional discussion of any requirements that

Page 2
w:\saint gobain\20167391\vermont\final\report snb06_snb15_final.docx
were not met is provided below. The data reviewer has included copies of validation forms, QC summary forms, relevant raw data, and other documentation needed to support the findings in this DUSR in the Data Support Documentation (Section 5). The data reviewer has also manually edited the laboratory-reported data and QC summary forms included in these sections based on findings cited in this DUSR. The following issues were identified during the data validation process and may or may not affect data usability. Usability issues are addressed in the subsequent Organic Data Qualifiers section. Reporting issues regard the completeness and accuracy of the laboratory data deliverables provided. Procedural issues regard the evaluation of compliance with the analytical methods performed and the ELLE internal SOP. Reporting Issue - Reporting issues were not identified during this QA review. Procedural Issues 1. US EPA Method 537 is listed as the reference method in the title of the ELLE SOP;
however, US EPA Method 537 is written specifically for the analysis of drinking water samples. As a result, the laboratory has made modifications to the procedure including, but not limited to, the following:
For aqueous samples, Sep-Pak C18 solid-phase extraction cartridges were used
instead of polystyrenedivinylbenzene. The laboratory utilized additional labeled analogs of the target PFASs, where
available for use, as pre-extraction internal standards (all target PFASs except PFTriA), which generally should normalize any extraction inefficiency and provide greater accuracy in quantitation. For dilution analyses, the pre-extraction internal standards were refortified after extraction and prior to dilution. In addition, the laboratory spiked the extracts with yet additional labeled analogs of the target PFASs post extraction and used these labeled analogs as the internal standards for the pre-extraction internal standards.
As the labeled internal standards were added prior to extractions, additional labeled surrogate compounds were not used.
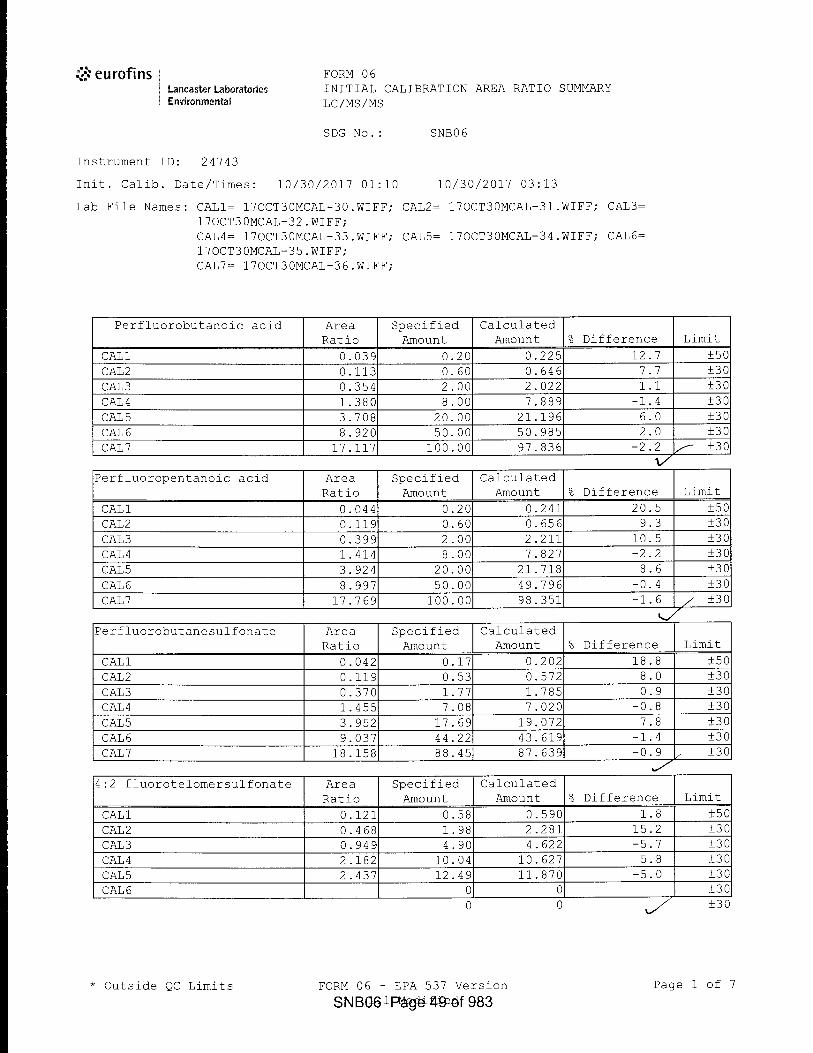
The laboratory did not control the relative percent difference (RPD) between the high and low areas for each internal standard in the initial calibration (must be < 20% by US EPA Method 537, Version 1.1).
The laboratory did not calculate the peak asymmetry factor. The laboratory did not rotate the concentration used for the LCS. The calibration standards only included the linear PFAS isomers; however, available
branched/linear standards were analyzed for qualitative purposes. Alternate ion transitions were used for PFBS and 13C8-PFOS (29999 instead of
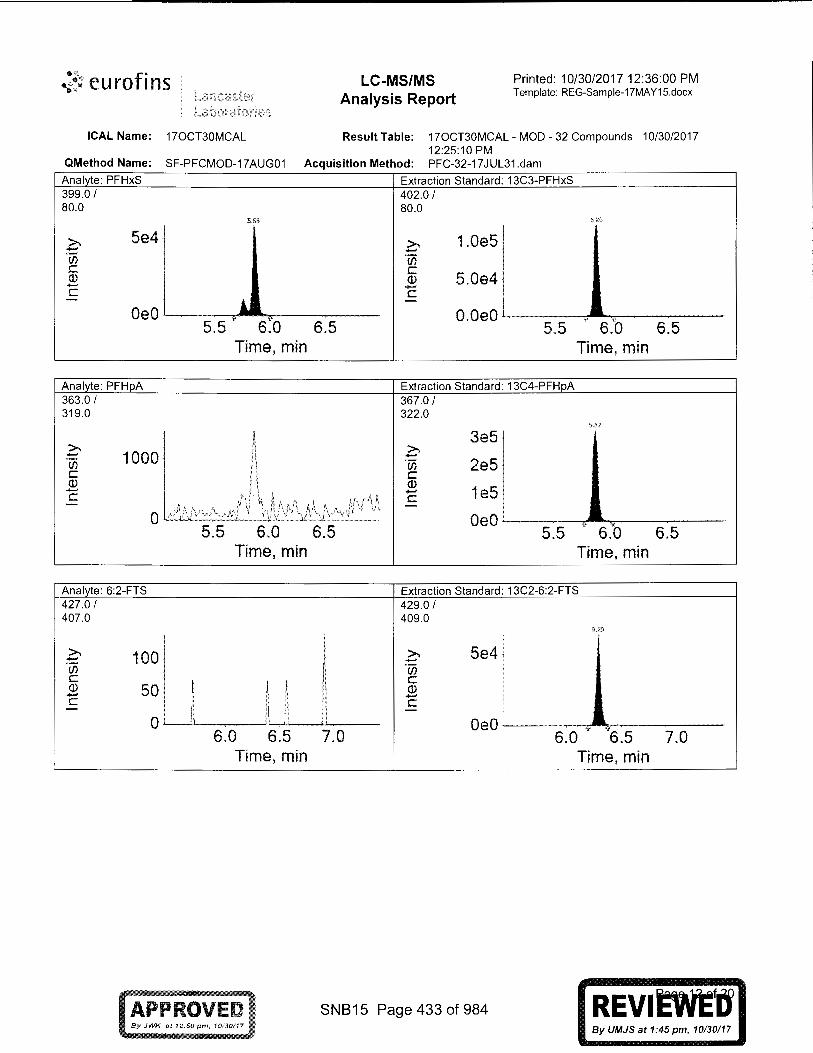
29980 for PFBS and 50399 instead of 50380 for 13C8-PFOS) - the fragment represented by m/z 80 is the sulfonate group; whereas, the fragment represented by m/z 99 is the fluorinated sulfonate group.

Page 3
w:\saint gobain\20167391\vermont\final\report snb06_snb15_final.docx
2. The laboratory analyzed a qualitative standard that included both branched and linear isomers for PFHxS, PFOA, and PFOS. Where transition ion peaks were observed and deemed by laboratory personnel to represent branched isomers in samples based on the analysis of this standard, the responses for such peaks were included in the response for the analyte and used to quantitate the results for PFHxS, PFOA, and PFOS in samples relative to the linear isomer calibration standards. The laboratory did not integrate peaks other than the peak representative of the linear isomer (based on calibration standards) for target analytes other than PFHxS, PFOA, and PFOS in samples.
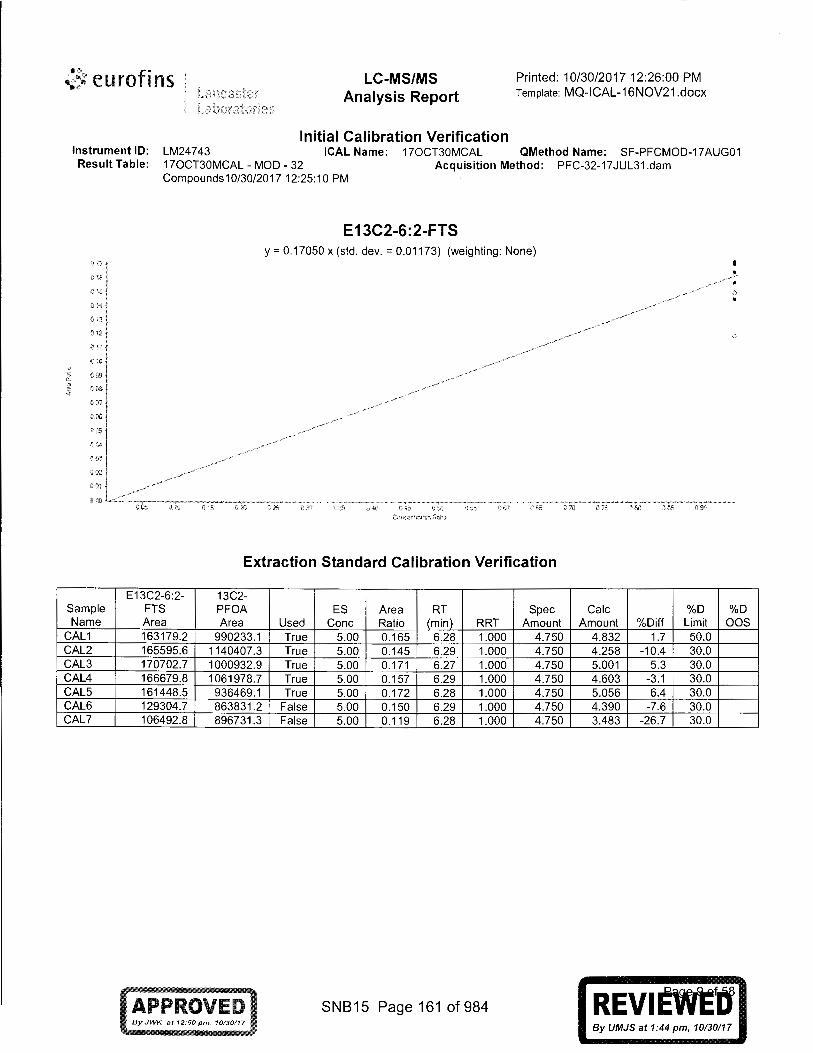
3. The ICV check standards were not spiked with the target analytes
6:2 fluorotelomer sulfonate (6:2-FTS), 8:2 fluorotelomer sulfonate (8:2-FTS), and perfluorooctanesulfonamide (PFOSA) as required (refer to the summary of the Calibration and QC Requirements in Section 3). Upon inquiry, the laboratory indicated that it did not have access to a second source for these analytes. The data reviewer could not evaluate the accuracy of the calibration standards based on a second source due to this issue.
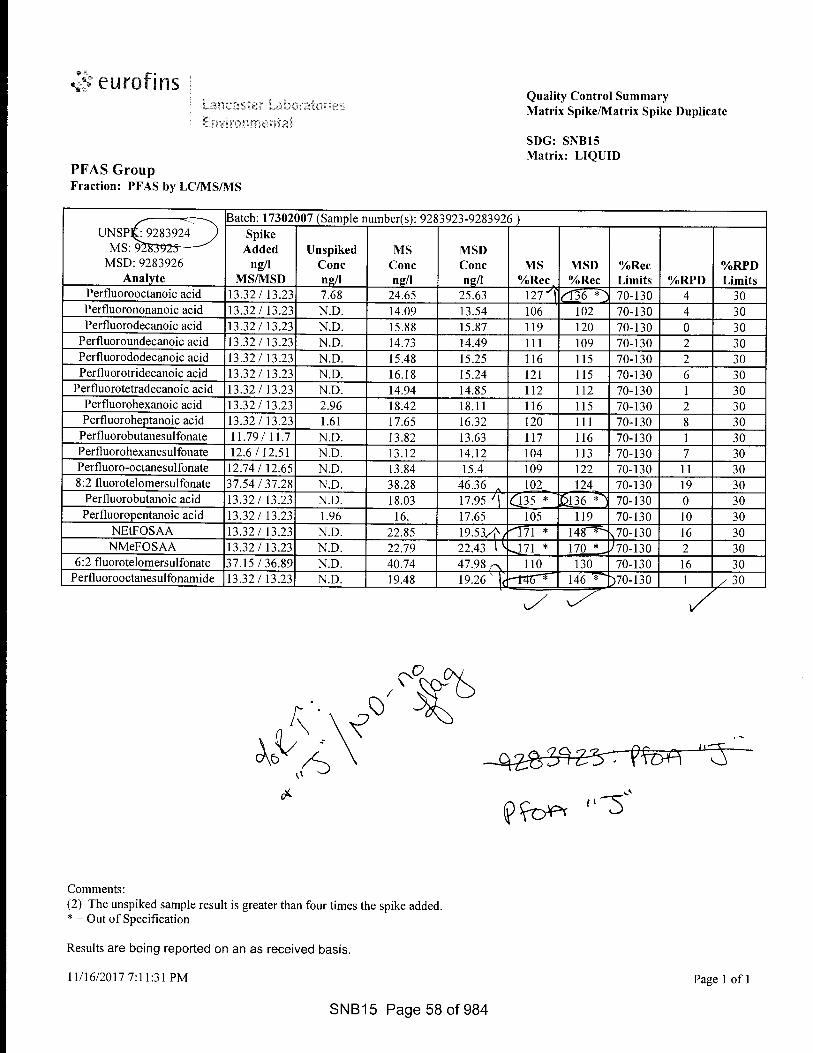
Data Evaluation With respect to data usability, the principal areas of concern are low pre-extraction labeled internal standard recoveries, high MS/MSD recoveries, and reported positive results between the MDLs and LOQs. Based on a rigorous review of the data provided, the following data qualifiers are offered. The following data usability issues represent an interpretation of the QC results obtained for the project samples. Quite often, data qualifications address issues relating to sample matrix problems. Similarly, areas of the data that were identified for qualification may not require corrective action according to the analytical SOP used for analysis. Accordingly, the following data usability issues should not be construed as an indication of laboratory performance. Organic Data Qualifiers - The MDLs and LOQs for PFOSA in all SDG SNB06 and SNB15 samples and PFTA in
SDG SGB15 sample SG3-LTB01-171025 may be higher than reported, and the “not-detected” results have been flagged “UJ” on the data tables. Low recoveries (%R < lower advisory limit of 70% or lower laboratory acceptance limit when available) were observed for the pre-extraction internal standards used to quantitate these compounds in these samples. (Validation Reason Code: IS)
- The reported positive result for PFOA in SDG SNB15 sample SG3-D15-171025 should be
considered estimated and has been flagged “J” on the data tables. High recoveries (> the upper laboratory acceptance limit) were observed for PFOA in the associated MS/MSD analyses. (Validation Reason Code: MAH)
- All positive results reported with concentrations between the laboratory’s reported MDLs
and LOQs were flagged “J” by the laboratory. Environmental Standards concurs that these positive results should be considered quantitative estimates. (Validation Reason Code: RL)

Page 4
w:\saint gobain\20167391\vermont\final\report snb06_snb15_final.docx
B. Inorganic and Wet Chemistry Data Review The inorganic and wet chemistry analyses of five aqueous samples (including QC samples) collected as part of the 1030 Water Street, Village of North Bennington, Vermont project on October 23 and 25, 2017, were performed by ELLE. The samples were collectively analyzed for total metals by SW-846 Methods 6010C and 6020A, anions (chloride, bromide, nitrate, nitrite, and/or sulfate) by US EPA 300.0, total ammonia nitrogen by US EPA Method 350.1, alkalinity by SM 2320B, orthophosphate as phosphorus by SM 4500-P-E, and total Kjeldahl nitrogen by US EPA Method 351.2. Specific analyses reviewed and QA review type for all samples are identified on Table 1. The data reviewed were presented in ASP Category A data deliverables. The findings offered in this report for analyses that underwent a Limited QA review are based upon a review of tabulated QC summary forms including the following QC measures:
Sample holding times Sample condition upon laboratory receipt
Blank analysis results LCS results
MS/MSD results
The analytical results for the target compounds are presented on the data tables in Section 2 of this DUSR. Additional discussion of any requirements that were not met is provided below. The data reviewer has included copies of validation forms, QC summary forms, and other documentation needed to support the findings in this DUSR in the Data Support Documentation (Section 5) and Project Correspondence in Section 6. The data reviewer has also manually edited the laboratory-reported data and QC summary forms included in these sections based on findings cited in this DUSR. The following issues were identified during the data validation process and may or may not affect data usability. Reporting issues regard the completeness and accuracy of the laboratory data deliverables provided. Procedural issues regard the evaluation of compliance with the analytical methods performed. Reporting Issues 1. The Case Narrative for SDG SNB06 was missing the US EPA 350.1, US EPA 351.2,
SM 2320B, and SM 4500-P sections, and the Case Narrative for SDG SNB15 was missing the US EPA 351.2 and SM 4500-P-E sections. The data reviewer did not observe any issues in the review and the QC passed criteria for these analyses.
2. Upon client request, boron was added to the list of analytes reported for
sample SG3-D18-171023 in SDG SNB06, and the laboratory provided revised deliverables (see Section 6).

Page 5
w:\saint gobain\20167391\vermont\final\report snb06_snb15_final.docx
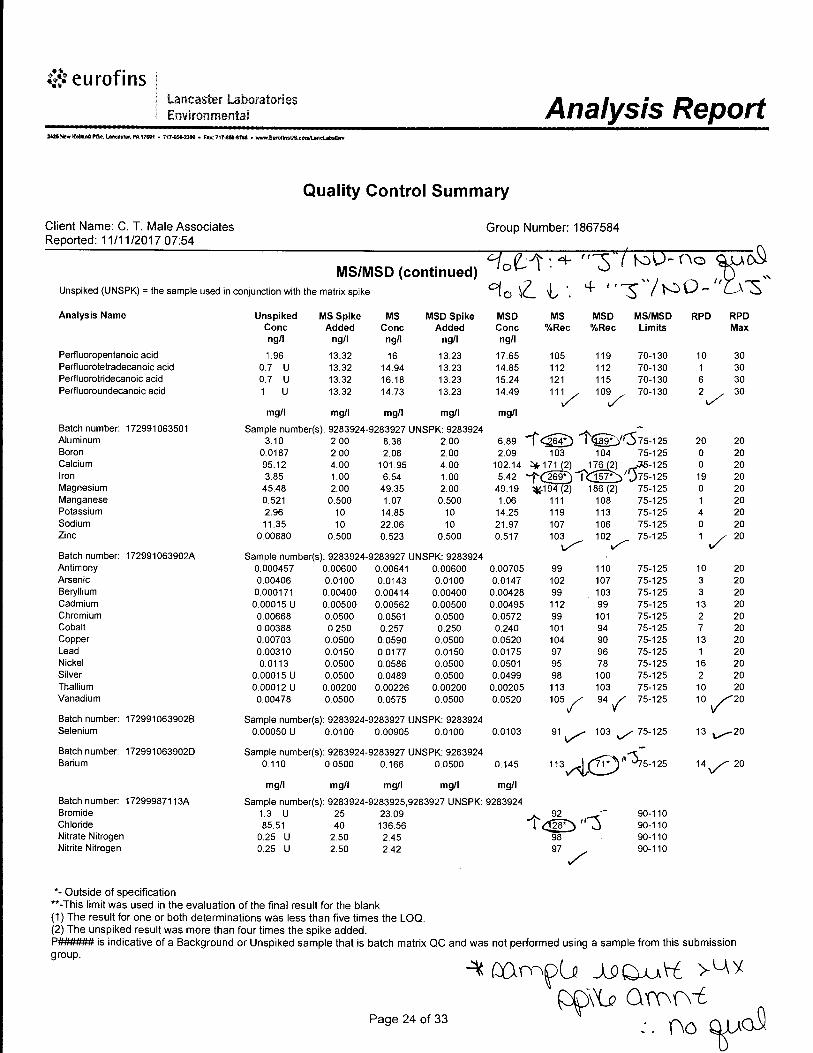
Procedural Issue - Procedural issues were not identified during this QA review. Data Evaluation With respect to data usability, the principal areas of concern are out-of-criteria MS/MSD recoveries, laboratory duplicate imprecision, and reported positive results between the LOQs and MDLs. Based on a review of the data provided, the following data qualifiers are offered. The following data usability issues represent an interpretation of the QC results obtained for the project samples. Quite often, data qualifications address issues relating to sample matrix problems. Similarly, areas of the data that were identified for qualification may not require corrective action according to the analytical method used for analysis. Accordingly, the following data usability issues should not be construed as an indication of laboratory performance. Inorganic and Wet Chemistry Data Qualifiers - The analysis for carbonate alkalinity in SDG SNB15 sample SG3-D15-171025 should be
considered unusable, and the “not-detected” result has been flagged “R” on the data tables. Additionally, the reported positive results for bicarbonate alkalinity and total alkalinity in the above sample should be considered estimated and have been flagged “J” on the data tables. Very low recoveries (< 30%) were observed for total alkalinity in the MS/MSD analyses. (Validation Reason Code: MAL).
- The reported positive results for aluminum, iron, and chloride in SDG SNB15 sample
SG3-D15-171025 should be considered estimated and have been flagged “J” on the data tables. High recoveries (> the upper laboratory acceptance limit) were observed for these analytes in the associated MS/MSD analyses. (Validation Reason Code: MAH)
- The reported positive results for barium and ammonia nitrogen in SDG SNB15 sample
SG3-D15-171025 should be considered estimated, and have been flagged “J” on the data tables. Low recoveries (< the lower laboratory acceptance limit) were observed for these analytes in the associated MS/MSD analyses. (Validation Reason Code: MAL)
- The reported positive results for aluminum and iron in SDG SNB15 sample
SG3-D15-171025 should be considered estimated and have been flagged “J” on the data tables. Large discrepancies (RPD > laboratory acceptance limit when both results were > 5× the LOQ, or the difference between the results was > 2× the LOQ when at least one result was < 5× the LOQ) were observed for these analytes in the associated laboratory duplicate analyses. (Validation Reason Code: LD)
- All positive results reported with concentrations between the laboratory’s reported MDLs
and LOQs were flagged “J” by the laboratory. Environmental Standards concurs that these positive results should be considered quantitative estimates. (Validation Reason Code: RL)
Page 6
w:\saint gobain\20167391\vermont\final\report snb06_snb15_final.docx
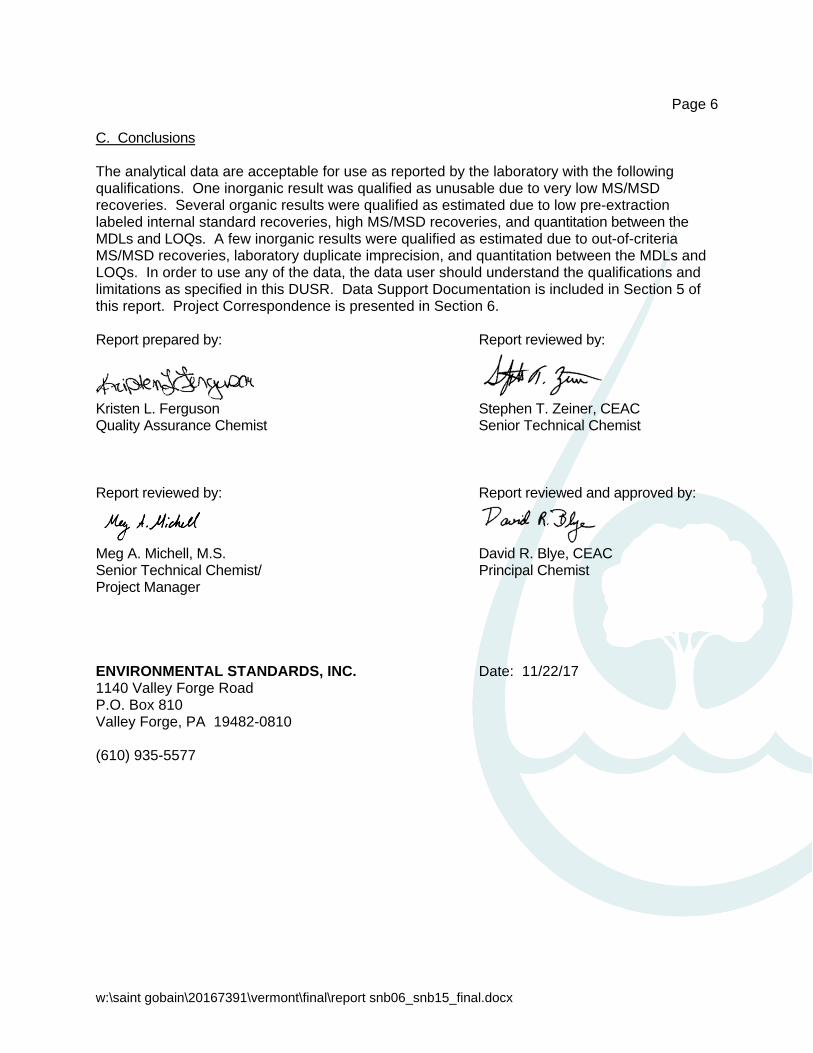
C. Conclusions The analytical data are acceptable for use as reported by the laboratory with the following qualifications. One inorganic result was qualified as unusable due to very low MS/MSD recoveries. Several organic results were qualified as estimated due to low pre-extraction labeled internal standard recoveries, high MS/MSD recoveries, and quantitation between the MDLs and LOQs. A few inorganic results were qualified as estimated due to out-of-criteria MS/MSD recoveries, laboratory duplicate imprecision, and quantitation between the MDLs and LOQs. In order to use any of the data, the data user should understand the qualifications and limitations as specified in this DUSR. Data Support Documentation is included in Section 5 of this report. Project Correspondence is presented in Section 6. Report prepared by: Report reviewed by:
Kristen L. Ferguson Stephen T. Zeiner, CEAC Quality Assurance Chemist Senior Technical Chemist Report reviewed by: Report reviewed and approved by:
Meg A. Michell, M.S. David R. Blye, CEAC Senior Technical Chemist/ Principal Chemist Project Manager ENVIRONMENTAL STANDARDS, INC. Date: 11/22/17 1140 Valley Forge Road P.O. Box 810 Valley Forge, PA 19482-0810 (610) 935-5577


Validation Qualifier and Reason Code Definitions
Page 1 of 4 validation reason codes_rev20170428.docx
Table 1. Validation Qualifiers and Definitions Validation Qualifier Definition
U The analyte was analyzed for, but was not detected above the level of the reported sample method detection limit (MDL).
J The result is an estimated quantity. The associated numerical value is the approximate concentration of the analyte in the sample.
N The analyte has been “tentatively identified” or considered “presumptively” present.
UJ The analyte was analyzed for, but was not detected. The reported MDL and limit of quantitation (LOQ) are approximate and may be inaccurate or imprecise.
R The data are unusable. The sample results are rejected due to serious deficiencies in meeting QC criteria. The analyte may or may not be present in the sample.
UB The Analyte was not detected substantially above the level reported in the associated laboratory, equipment, field, or trip blank.
Table 2. Validation Reason Codes and Descriptions
Validation Reason
Code Description CI Chromatographic interference CR Calculated result in which one or more of the components has been qualified,
potential bias indeterminate CRH Calculated result in which one or more of the components has been qualified,
potential high bias CRL Calculated result in which one or more of the components has been qualified
potential low bias
CV Continuing calibration verification evaluation criteria not met, potential bias indeterminate
CVH Continuing calibration verification evaluation criteria not met, potential high bias CVL Continuing calibration verification evaluation criteria not met, potential low bias DC Reporting limit exceeds decision criteria (for non-detects) DL The analysis meets all qualitative identification criteria, but the measured
concentration is less than the detection limit. DT Dissolved metals concentration exceeded total metals concentration in the
sample above the acceptance criteria DV Missing Deliverables EB Equipment blank contamination EC Result exceeds the calibration range, potential bias indeterminate ECH Result exceeds the calibration range, potential high bias ECL Result exceeds the calibration range, potential low bias

Validation Qualifier and Reason Code Definitions
Page 2 of 4 validation reason codes_rev20170428.docx
Validation Reason
Code Description EP Estimated Maximum Possible Concentration (EMPC) FB Field blank contamination FD Field duplicate imprecision, potential bias indeterminate FP Potential false positives FR Field replicate imprecision, potential bias indeterminate HA Holding time - preparation to analysis, potential bias indeterminate HAH Holding time - preparation to analysis, potential high bias HAL Holding time - preparation to analysis, potential low bias HC Holding time - collection to analysis, potential bias indeterminate HCH Holding time - collection to analysis, potential high bias HCL Holding time - collection to analysis, potential low bias HP Holding time - collection to preparation, potential bias indeterminate HPH Holding time - collection to preparation, potential high bias HPL Holding time - collection to preparation, potential low bias HV Headspace present in volatile vials, potential bias indeterminate HVL Headspace present in volatile vials, potential low bias IB Instrument (including initial calibration or continuing calibration) blank
contamination IC Initial calibration evaluation criteria not met, potential bias indeterminate ICH Initial calibration evaluation criteria not met, potential high bias ICL Initial calibration evaluation criteria not met, potential low bias ID Target compound identification criteria not met IN Elevated detection limit due to interference (i.e., laboratory, chemical, and/or
matrix) IR Interference check standard recovery criteria not met, potential bias
indeterminate IRH Interference check standard recovery criteria not met, potential high bias IRL Interference check standard recovery criteria not met, potential low bias IS Internal standard evaluation criteria not met, potential bias indeterminate ISH Internal standard evaluation criteria not met, potential high bias ISL Internal standard evaluation criteria not met, potential low bias LA Laboratory control sample/laboratory control sample duplicate recovery criteria
not met, potential bias indeterminate
LAH Laboratory control sample/laboratory control sample duplicate recovery criteria not met, potential high bias
LAL Laboratory control sample/laboratory control sample duplicate recovery criteria not met, potential low bias

Validation Qualifier and Reason Code Definitions
Page 3 of 4 validation reason codes_rev20170428.docx
Validation Reason
Code Description LD Laboratory duplicate precision criteria not met, potential bias indeterminate LM The PFK lock mass SICPs indicate that ion suppression evident LP Laboratory control sample/laboratory control sample duplicate precision criteria
not met, potential bias indeterminate
LPH Laboratory control sample/laboratory control sample duplicate precision criteria not met, potential high bias
LPL Laboratory control sample/laboratory control sample duplicate precision criteria not met, potential low bias
LR Linear range exceeded, potential bias indeterminate MA Matrix spike (MS &/or MSD) recovery criteria not met, potential bias
indeterminate MAH Matrix spike (MS &/or MSD) recovery criteria not met, potential high bias MAL Matrix spike (MS &/or MSD) recovery criteria not met, potential low bias MB Method blank or preparation blank contamination MP Matrix spike (MS/MSD) or laboratory duplicate precision criteria not met,
potential bias indeterminate NB Elevated detection limit or estimated result due to instrument drift (i.e., negative
ICB or CCB result with an absolute value > 2× the MDL) PD Post-digestion spike recovery outside acceptance range, potential bias
indeterminate PDH Post-digestion spike recovery outside acceptance range, potential high bias
PDL Post-digestion spike recovery outside acceptance range, potential low bias PJ Professional judgment, potential bias indeterminate PJH Professional judgment, potential high bias PJL Professional judgment, potential low bias PM Performance evaluation mixture criteria not met, potential bias indeterminate PMH Performance evaluation mixture criteria not met, potential high bias
PML Performance evaluation mixture criteria not met, potential low bias PR Peak(s) not adequately resolved, potential bias indeterminate PRH Peak(s) not adequately resolved, potential high bias PRL Peak(s) not adequately resolved, potential low bias PS Low percent solids could affect accuracy, potential bias indeterminate PT Chromatographic pattern in sample does not match pattern of calibration
standard
RA Reference material recovery criteria not met, potential bias indeterminate

Validation Qualifier and Reason Code Definitions
Page 4 of 4 validation reason codes_rev20170428.docx
Validation Reason
Code Description RAH Reference material recovery criteria not met, potential high bias RAL Reference material recovery criteria not met, potential low bias RB Rinsate blank contamination RL The analysis meets all qualitative identification criteria, but the measured
concentration is less than the quantitation or reporting limit, potential bias indeterminate
SA Method of standard additions correction coefficient <0.995, potential bias indeterminate
SC RPD Between two columns exceeds criteria, potential bias indeterminate
SD Serial dilution results did not meet evaluation criteria, potential bias indeterminate
SDH Serial dilution results did not meet evaluation criteria, potential high bias SDL Serial dilution results did not meet evaluation criteria, potential low bias SP Sample Preservation / Cooler Temperature, potential bias indeterminate SPH Sample Preservation / Cooler Temperature, potential high bias SPL Sample Preservation / Cooler Temperature, potential low bias SR Surrogate recovery outside acceptance range, potential bias indeterminate SRH Surrogate recovery outside acceptance range, potential high bias SRL Surrogate recovery outside acceptance range, potential low bias SS Second source evaluation criteria not met, potential bias indeterminate SSH Second source evaluation criteria not met, potential high bias SSL Second source evaluation criteria not met, potential low bias ST Compound not quantitated against an authentic standard, potential bias
indeterminate
TB Trip blank contamination TD Result for dissolved constituent significantly exceeded result for total
constituent, potential bias indeterminate
TIC Tentative identification, quantified using an assumed calibration factor, potential bias indeterminate.
TIR Tentative identification and was observed in an associated laboratory, equipment, field, or trip blank.
TN Instrument performance (tuning) criteria not met YH Due to a high y-intercept in the calibration curve, the sample result quantitated
to a value greater than the MDL. Since the response ratio in the sample was less than the response ratio in the associated MDL standard, the reported result was changed to not-detected.


Sample ID SG3-D18-171023
Sample Date 10/23/2017 1:30:00 PM
Sample Type N
Parent Sample ID
Sample Matrix WG
Lab Sample ID 9279024
Analytical Method E300.0
Result Unit mg/l
Fraction T
Location/Depth D18
Validated? Y
Validation Level CATEGORY A
Result Type
Chemical Name CAS T/D DF Lab Result
Lab MDL Lab LOQ Lab Qualifier
Lab Detect
Flag
Final Result
Final MDL
Final LOQ Final Qualifier
Final Detect
Flag
ValidationReason Code
ReportableResult?
TRG Bromide 24959-67-9 T 5 1.3 2.5 U N 1.3 2.5 U N Yes
Chloride (As Cl) 16887-00-6 T 5 11.8 1.0 2.0 Y 11.8 1.0 2.0 Y Yes
Nitrogen, Nitrate (As N) 14797-55-8 T 5 0.25 0.50 U N 0.25 0.50 U N Yes
Nitrogen, Nitrite 14797-65-0 T 5 0.25 0.50 U N 0.25 0.50 U N Yes
Sulfate (As SO4) 14808-79-8 T 5 34.6 1.5 5.0 Y 34.6 1.5 5.0 Y Yes
Page: 1 of 111/22/2017 1:04:08 PM
Facility: BenningtonSDG: SNB06

Sample ID SG3-D18-171023
Sample Date 10/23/2017 1:30:00 PM
Sample Type N
Parent Sample ID
Sample Matrix WG
Lab Sample ID 9279024
Analytical Method E350.1
Result Unit mg/l
Fraction T
Location/Depth D18
Validated? Y
Validation Level CATEGORY A
Result Type
Chemical Name CAS T/D DF Lab Result
Lab MDL Lab LOQ Lab Qualifier
Lab Detect
Flag
Final Result
Final MDL
Final LOQ Final Qualifier
Final Detect
Flag
ValidationReason Code
ReportableResult?
TRG Nitrogen, Ammonia (As N) 7664-41-7 T 1 0.050 0.10 U N 0.050 0.10 U N Yes
Page: 1 of 111/22/2017 1:04:43 PM
Facility: BenningtonSDG: SNB06
Sample ID SG3-D18-171023
Sample Date 10/23/2017 1:30:00 PM
Sample Type N
Parent Sample ID
Sample Matrix WG
Lab Sample ID 9279024
Analytical Method E351.2
Result Unit mg/l
Fraction T
Location/Depth D18
Validated? Y
Validation Level CATEGORY A
Result Type
Chemical Name CAS T/D DF Lab Result
Lab MDL Lab LOQ Lab Qualifier
Lab Detect
Flag
Final Result
Final MDL
Final LOQ Final Qualifier
Final Detect
Flag
ValidationReason Code
ReportableResult?
TRG Nitrogen, Kjeldahl, Total KN T 1 0.50 1.0 U N 0.50 1.0 U N Yes
Page: 1 of 111/22/2017 1:04:55 PM
Facility: BenningtonSDG: SNB06

Sample ID SG3-D18-171023
Sample Date 10/23/2017 1:30:00 PM
Sample Type N
Parent Sample ID
Sample Matrix WG
Lab Sample ID 9279024
Analytical Method SM2320B
Result Unit mgcaco3/l
Fraction T
Location/Depth D18
Validated? Y
Validation Level CATEGORY A
Result Type
Chemical Name CAS T/D DF Lab Result
Lab MDL Lab LOQ Lab Qualifier
Lab Detect
Flag
Final Result
Final MDL
Final LOQ Final Qualifier
Final Detect
Flag
ValidationReason Code
ReportableResult?
TRG Alkalinity, Bicarbonate (As CaCO3) ALKB T 1 242 1.7 5.0 Y 242 1.7 5.0 Y Yes
Alkalinity, Carbonate (As CaCO3) ALKC T 1 1.7 5.0 U N 1.7 5.0 U N Yes
Alkalinity, Total (As CaCO3) ALK T 1 242 1.7 5.0 Y 242 1.7 5.0 Y Yes
Page: 1 of 111/22/2017 1:05:19 PM
Facility: BenningtonSDG: SNB06

Sample ID SG3-D18-171023
Sample Date 10/23/2017 1:30:00 PM
Sample Type N
Parent Sample ID
Sample Matrix WG
Lab Sample ID 9279024
Analytical Method SM4500-P-E
Result Unit mg/l
Fraction D
Location/Depth D18
Validated? Y
Validation Level CATEGORY A
Result Type
Chemical Name CAS T/D DF Lab Result
Lab MDL Lab LOQ Lab Qualifier
Lab Detect
Flag
Final Result
Final MDL
Final LOQ Final Qualifier
Final Detect
Flag
ValidationReason Code
ReportableResult?
TRG Phosphorus 7723-14-0 D 1 0.030 0.090 U N 0.030 0.090 U N Yes
Page: 1 of 111/22/2017 1:05:31 PM
Facility: BenningtonSDG: SNB06

Sample ID SG3-D18-171023
Sample Date 10/23/2017 1:30:00 PM
Sample Type N
Parent Sample ID
Sample Matrix WG
Lab Sample ID 9279024
Analytical Method SW6010C
Result Unit mg/l
Fraction T
Location/Depth D18
Validated? Y
Validation Level CATEGORY A
Result Type
Chemical Name CAS T/D DF Lab Result
Lab MDL Lab LOQ Lab Qualifier
Lab Detect
Flag
Final Result
Final MDL
Final LOQ Final Qualifier
Final Detect
Flag
ValidationReason Code
ReportableResult?
TRG Aluminum 7429-90-5 T 1 0.0894 0.400 U N 0.0894 0.400 U N Yes
Boron 7440-42-8 T 1 0.0101 0.100 U N 0.0101 0.100 U N Yes
Calcium 7440-70-2 T 1 70.5 0.0600 0.400 Y 70.5 0.0600 0.400 Y Yes
Iron 7439-89-6 T 1 0.0805 0.400 U N 0.0805 0.400 U N Yes
Magnesium 7439-95-4 T 1 25.3 0.0374 0.200 Y 25.3 0.0374 0.200 Y Yes
Manganese 7439-96-5 T 1 0.155 0.0016 0.0100 Y 0.155 0.0016 0.0100 Y Yes
Potassium 7440-09-7 T 1 0.902 0.179 1.00 J Y 0.902 0.179 1.00 J Y RL Yes
Sodium 7440-23-5 T 1 5.78 0.321 2.00 Y 5.78 0.321 2.00 Y Yes
Zinc 7440-66-6 T 1 0.0065 0.0400 U N 0.0065 0.0400 U N Yes
Page: 1 of 111/22/2017 1:05:43 PM
Facility: BenningtonSDG: SNB06

Sample ID SG3-D18-171023
Sample Date 10/23/2017 1:30:00 PM
Sample Type N
Parent Sample ID
Sample Matrix WG
Lab Sample ID 9279024
Analytical Method SW6020A
Result Unit mg/l
Fraction T
Location/Depth D18
Validated? Y
Validation Level CATEGORY A
Result Type
Chemical Name CAS T/D DF Lab Result
Lab MDL Lab LOQ Lab Qualifier
Lab Detect
Flag
Final Result
Final MDL
Final LOQ Final Qualifier
Final Detect
Flag
ValidationReason Code
ReportableResult?
TRG Antimony 7440-36-0 T 1 0.00045 0.0020 U N 0.00045 0.0020 U N Yes
Arsenic 7440-38-2 T 1 0.0020 0.00072 0.0040 J Y 0.0020 0.00072 0.0040 J Y RL Yes
Barium 7440-39-3 T 1 0.0480 0.00072 0.0040 Y 0.0480 0.00072 0.0040 Y Yes
Beryllium 7440-41-7 T 1 0.000071 0.0010 U N 0.000071 0.0010 U N Yes
Cadmium 7440-43-9 T 1 0.00015 0.0010 U N 0.00015 0.0010 U N Yes
Chromium, Total 7440-47-3 T 1 0.00087 0.0040 U N 0.00087 0.0040 U N Yes
Cobalt 7440-48-4 T 1 0.00023 0.00016 0.0010 J Y 0.00023 0.00016 0.0010 J Y RL Yes
Copper 7440-50-8 T 1 0.00054 0.0040 U N 0.00054 0.0040 U N Yes
Lead 7439-92-1 T 1 0.00011 0.0020 U N 0.00011 0.0020 U N Yes
Nickel 7440-02-0 T 1 0.0010 0.0040 U N 0.0010 0.0040 U N Yes
Selenium 7782-49-2 T 1 0.00050 0.0040 U N 0.00050 0.0040 U N Yes
Silver 7440-22-4 T 1 0.00015 0.0010 U N 0.00015 0.0010 U N Yes
Thallium 7440-28-0 T 1 0.00012 0.0010 U N 0.00012 0.0010 U N Yes
Vanadium 7440-62-2 T 1 0.00032 0.00021 0.0010 J Y 0.00032 0.00021 0.0010 J Y RL Yes
Page: 1 of 111/22/2017 1:05:52 PM
Facility: BenningtonSDG: SNB06

Sample ID SG3-D18-171023
Sample Date 10/23/2017 1:30:00 PM
Sample Type N
Parent Sample ID
Sample Matrix WG
Lab Sample ID 9279024
Analytical Method E537
Result Unit ng/l
Fraction T
Location/Depth D18
Validated? Y
Validation Level CATEGORY B
Result Type
Chemical Name CAS T/D DF Lab Result
Lab MDL Lab LOQ Lab Qualifier
Lab Detect
Flag
Final Result
Final MDL
Final LOQ Final Qualifier
Final Detect
Flag
ValidationReason Code
ReportableResult?
TRG 6:2 Fluorotelomer sulfonate 27619-97-2 T 1 3 6 U N 3 6 U N Yes
8:2 Fluorotelomer sulfonate 39108-34-4 T 1 2 6 U N 2 6 U N Yes
NEtFOSAA 2991-50-6 T 1 0.4 2 U N 0.4 2 U N Yes
NMeFOSAA 2355-31-9 T 1 0.4 2 U N 0.4 2 U N Yes
Perfluorobutanesulfonic acid (PFBS) 375-73-5 T 1 0.3 0.9 U N 0.3 0.9 U N Yes
Perfluorobutanoic Acid 375-22-4 T 1 3 2 5 J Y 3 2 5 J Y RL Yes
Perfluorodecanoic acid (PFDA) 335-76-2 T 1 0.4 2 U N 0.4 2 U N Yes
Perfluorododecanoic acid (PFDoA) 307-55-1 T 1 0.3 0.9 U N 0.3 0.9 U N Yes
Perfluoroheptanoic acid (PFHpA) 375-85-9 T 1 4 0.3 0.9 Y 4 0.3 0.9 Y Yes
Perfluorohexanesulfonic acid (PFHxS) 355-46-4 T 1 0.4 2 U N 0.4 2 U N Yes
Perfluorohexanoic acid (PFHxA) 307-24-4 T 1 5 0.3 0.9 Y 5 0.3 0.9 Y Yes
Perfluorononanoic acid (PFNA) 375-95-1 T 1 0.3 0.9 U N 0.3 0.9 U N Yes
Perfluorooctanesulfonic acid (PFOS) 1763-23-1 T 1 0.8 3 U N 0.8 3 U N Yes
Perfluorooctanoic acid (PFOA) 335-67-1 T 1 120 0.3 0.9 Y 120 0.3 0.9 Y Yes
Perfluoropentanoic Acid (PFPeA) 2706-90-3 T 1 3 0.3 0.9 Y 3 0.3 0.9 Y Yes
Perfluorotetradecanoic acid (PFTA) 376-06-7 T 1 0.3 0.9 U N 0.3 0.9 U N Yes
Perfluorotridecanoic Acid (PFTriA) 72629-94-8 T 1 0.3 0.9 U N 0.3 0.9 U N Yes
Perfluoroundecanoic Acid (PFUnA) 2058-94-8 T 1 0.4 2 U N 0.4 2 U N Yes
PFOSA 754-91-6 T 1 0.3 0.9 U N 0.3 0.9 UJ N IS Yes
Page: 1 of 311/22/2017 1:05:03 PM
Facility: BenningtonSDG: SNB06

Sample ID SG3-FTB01-171023
Sample Date 10/23/2017 4:40:00 PM
Sample Type FB
Parent Sample ID
Sample Matrix WQ
Lab Sample ID 9279025
Analytical Method E537
Result Unit ng/l
Fraction T
Location/Depth
Validated? Y
Validation Level CATEGORY A
Result Type
Chemical Name CAS T/D DF Lab Result
Lab MDL Lab LOQ Lab Qualifier
Lab Detect
Flag
Final Result
Final MDL
Final LOQ Final Qualifier
Final Detect
Flag
ValidationReason Code
ReportableResult?
TRG 6:2 Fluorotelomer sulfonate 27619-97-2 T 1 3 6 U N 3 6 U N Yes
8:2 Fluorotelomer sulfonate 39108-34-4 T 1 2 6 U N 2 6 U N Yes
NEtFOSAA 2991-50-6 T 1 0.4 2 U N 0.4 2 U N Yes
NMeFOSAA 2355-31-9 T 1 0.4 2 U N 0.4 2 U N Yes
Perfluorobutanesulfonic acid (PFBS) 375-73-5 T 1 0.3 0.9 U N 0.3 0.9 U N Yes
Perfluorobutanoic Acid 375-22-4 T 1 2 5 U N 2 5 U N Yes
Perfluorodecanoic acid (PFDA) 335-76-2 T 1 0.4 2 U N 0.4 2 U N Yes
Perfluorododecanoic acid (PFDoA) 307-55-1 T 1 0.3 0.9 U N 0.3 0.9 U N Yes
Perfluoroheptanoic acid (PFHpA) 375-85-9 T 1 0.3 0.9 U N 0.3 0.9 U N Yes
Perfluorohexanesulfonic acid (PFHxS) 355-46-4 T 1 0.4 2 U N 0.4 2 U N Yes
Perfluorohexanoic acid (PFHxA) 307-24-4 T 1 0.3 0.9 U N 0.3 0.9 U N Yes
Perfluorononanoic acid (PFNA) 375-95-1 T 1 0.3 0.9 U N 0.3 0.9 U N Yes
Perfluorooctanesulfonic acid (PFOS) 1763-23-1 T 1 0.8 3 U N 0.8 3 U N Yes
Perfluorooctanoic acid (PFOA) 335-67-1 T 1 0.3 0.9 U N 0.3 0.9 U N Yes
Perfluoropentanoic Acid (PFPeA) 2706-90-3 T 1 0.3 0.9 U N 0.3 0.9 U N Yes
Perfluorotetradecanoic acid (PFTA) 376-06-7 T 1 0.3 0.9 U N 0.3 0.9 U N Yes
Perfluorotridecanoic Acid (PFTriA) 72629-94-8 T 1 0.3 0.9 U N 0.3 0.9 U N Yes
Perfluoroundecanoic Acid (PFUnA) 2058-94-8 T 1 0.4 2 U N 0.4 2 U N Yes
PFOSA 754-91-6 T 1 0.3 0.9 U N 0.3 0.9 UJ N IS Yes
Page: 2 of 311/22/2017 1:05:03 PM
Facility: BenningtonSDG: SNB06

Sample ID SG3-LTB01-171023
Sample Date 10/23/2017 12:00:00 AM
Sample Type TB
Parent Sample ID
Sample Matrix WQ
Lab Sample ID 9279026
Analytical Method E537
Result Unit ng/l
Fraction T
Location/Depth
Validated? Y
Validation Level CATEGORY A
Result Type
Chemical Name CAS T/D DF Lab Result
Lab MDL Lab LOQ Lab Qualifier
Lab Detect
Flag
Final Result
Final MDL
Final LOQ Final Qualifier
Final Detect
Flag
ValidationReason Code
ReportableResult?
TRG 6:2 Fluorotelomer sulfonate 27619-97-2 T 1 3 6 U N 3 6 U N Yes
8:2 Fluorotelomer sulfonate 39108-34-4 T 1 2 6 U N 2 6 U N Yes
NEtFOSAA 2991-50-6 T 1 0.4 2 U N 0.4 2 U N Yes
NMeFOSAA 2355-31-9 T 1 0.4 2 U N 0.4 2 U N Yes
Perfluorobutanesulfonic acid (PFBS) 375-73-5 T 1 0.3 1 U N 0.3 1 U N Yes
Perfluorobutanoic Acid 375-22-4 T 1 2 5 U N 2 5 U N Yes
Perfluorodecanoic acid (PFDA) 335-76-2 T 1 0.4 2 U N 0.4 2 U N Yes
Perfluorododecanoic acid (PFDoA) 307-55-1 T 1 0.3 1 U N 0.3 1 U N Yes
Perfluoroheptanoic acid (PFHpA) 375-85-9 T 1 0.3 1 U N 0.3 1 U N Yes
Perfluorohexanesulfonic acid (PFHxS) 355-46-4 T 1 0.4 2 U N 0.4 2 U N Yes
Perfluorohexanoic acid (PFHxA) 307-24-4 T 1 0.3 1 U N 0.3 1 U N Yes
Perfluorononanoic acid (PFNA) 375-95-1 T 1 0.3 1 U N 0.3 1 U N Yes
Perfluorooctanesulfonic acid (PFOS) 1763-23-1 T 1 0.8 3 U N 0.8 3 U N Yes
Perfluorooctanoic acid (PFOA) 335-67-1 T 1 0.3 1 U N 0.3 1 U N Yes
Perfluoropentanoic Acid (PFPeA) 2706-90-3 T 1 0.3 1 U N 0.3 1 U N Yes
Perfluorotetradecanoic acid (PFTA) 376-06-7 T 1 0.3 1 U N 0.3 1 U N Yes
Perfluorotridecanoic Acid (PFTriA) 72629-94-8 T 1 0.3 1 UZ N 0.3 1 U N Yes
Perfluoroundecanoic Acid (PFUnA) 2058-94-8 T 1 0.4 2 U N 0.4 2 U N Yes
PFOSA 754-91-6 T 1 0.3 1 U N 0.3 1 UJ N IS Yes
Page: 3 of 311/22/2017 1:05:03 PM
Facility: BenningtonSDG: SNB06


Sample ID SG3-D15-171025
Sample Date 10/25/2017 1:50:00 PM
Sample Type N
Parent Sample ID
Sample Matrix WG
Lab Sample ID 9283924
Analytical Method E300.0
Result Unit mg/l
Fraction T
Location/Depth D15
Validated? Y
Validation Level CATEGORY A
Result Type
Chemical Name CAS T/D DF Lab Result
Lab MDL Lab LOQ Lab Qualifier
Lab Detect
Flag
Final Result
Final MDL
Final LOQ Final Qualifier
Final Detect
Flag
ValidationReason Code
ReportableResult?
TRG Bromide 24959-67-9 T 5 1.3 2.5 U N 1.3 2.5 U N Yes
Chloride (As Cl) 16887-00-6 T 20 85.5 4.0 8.0 Y 85.5 4.0 8.0 J Y MAH Yes
Nitrogen, Nitrate (As N) 14797-55-8 T 5 0.25 0.50 U N 0.25 0.50 U N Yes
Nitrogen, Nitrite 14797-65-0 T 5 0.25 0.50 U N 0.25 0.50 U N Yes
Sulfate (As SO4) 14808-79-8 T 5 21.1 1.5 5.0 Y 21.1 1.5 5.0 Y Yes
Page: 1 of 111/22/2017 1:06:08 PM
Facility: BenningtonSDG: SNB15

Sample ID SG3-D15-171025
Sample Date 10/25/2017 1:50:00 PM
Sample Type N
Parent Sample ID
Sample Matrix WG
Lab Sample ID 9283924
Analytical Method E350.1
Result Unit mg/l
Fraction T
Location/Depth D15
Validated? Y
Validation Level CATEGORY A
Result Type
Chemical Name CAS T/D DF Lab Result
Lab MDL Lab LOQ Lab Qualifier
Lab Detect
Flag
Final Result
Final MDL
Final LOQ Final Qualifier
Final Detect
Flag
ValidationReason Code
ReportableResult?
TRG Nitrogen, Ammonia (As N) 7664-41-7 T 1 0.079 0.050 0.10 J Y 0.079 0.050 0.10 J Y RL,MAL Yes
Page: 1 of 111/22/2017 1:06:29 PM
Facility: BenningtonSDG: SNB15

Sample ID SG3-D15-171025
Sample Date 10/25/2017 1:50:00 PM
Sample Type N
Parent Sample ID
Sample Matrix WG
Lab Sample ID 9283924
Analytical Method E351.2
Result Unit mg/l
Fraction T
Location/Depth D15
Validated? Y
Validation Level CATEGORY A
Result Type
Chemical Name CAS T/D DF Lab Result
Lab MDL Lab LOQ Lab Qualifier
Lab Detect
Flag
Final Result
Final MDL
Final LOQ Final Qualifier
Final Detect
Flag
ValidationReason Code
ReportableResult?
TRG Nitrogen, Kjeldahl, Total KN T 1 0.50 1.0 U N 0.50 1.0 U N Yes
Page: 1 of 111/22/2017 1:08:05 PM
Facility: BenningtonSDG: SNB15

Sample ID SG3-D15-171025
Sample Date 10/25/2017 1:50:00 PM
Sample Type N
Parent Sample ID
Sample Matrix WG
Lab Sample ID 9283924
Analytical Method SM2320B
Result Unit mgcaco3/l
Fraction T
Location/Depth D15
Validated? Y
Validation Level CATEGORY A
Result Type
Chemical Name CAS T/D DF Lab Result
Lab MDL Lab LOQ Lab Qualifier
Lab Detect
Flag
Final Result
Final MDL
Final LOQ Final Qualifier
Final Detect
Flag
ValidationReason Code
ReportableResult?
TRG Alkalinity, Bicarbonate (As CaCO3) ALKB T 1 273 1.7 5.0 Y 273 1.7 5.0 J Y MAL Yes
Alkalinity, Carbonate (As CaCO3) ALKC T 1 1.7 5.0 U N 1.7 5.0 R N MAL Yes
Alkalinity, Total (As CaCO3) ALK T 1 273 1.7 5.0 Y 273 1.7 5.0 J Y MAL Yes
Page: 1 of 111/22/2017 1:08:36 PM
Facility: BenningtonSDG: SNB15

Sample ID SG3-LTB01-171025
Sample Date 10/25/2017 12:00:00 AM
Sample Type TB
Parent Sample ID
Sample Matrix WQ
Lab Sample ID 9283922
Analytical Method E537
Result Unit ng/l
Fraction T
Location/Depth
Validated? Y
Validation Level CATEGORY B
Result Type
Chemical Name CAS T/D DF Lab Result
Lab MDL Lab LOQ Lab Qualifier
Lab Detect
Flag
Final Result
Final MDL
Final LOQ Final Qualifier
Final Detect
Flag
ValidationReason Code
ReportableResult?
TRG 6:2 Fluorotelomer sulfonate 27619-97-2 T 1 3 6 U N 3 6 U N Yes
8:2 Fluorotelomer sulfonate 39108-34-4 T 1 2 6 U N 2 6 U N Yes
NEtFOSAA 2991-50-6 T 1 0.4 2 U N 0.4 2 U N Yes
NMeFOSAA 2355-31-9 T 1 0.4 2 U N 0.4 2 U N Yes
Perfluorobutanesulfonic acid (PFBS) 375-73-5 T 1 0.3 0.9 U N 0.3 0.9 U N Yes
Perfluorobutanoic Acid 375-22-4 T 1 2 5 U N 2 5 U N Yes
Perfluorodecanoic acid (PFDA) 335-76-2 T 1 0.4 2 U N 0.4 2 U N Yes
Perfluorododecanoic acid (PFDoA) 307-55-1 T 1 0.3 0.9 U N 0.3 0.9 U N Yes
Perfluoroheptanoic acid (PFHpA) 375-85-9 T 1 0.3 0.9 U N 0.3 0.9 U N Yes
Perfluorohexanesulfonic acid (PFHxS) 355-46-4 T 1 0.4 2 U N 0.4 2 U N Yes
Perfluorohexanoic acid (PFHxA) 307-24-4 T 1 0.3 0.9 U N 0.3 0.9 U N Yes
Perfluorononanoic acid (PFNA) 375-95-1 T 1 0.3 0.9 U N 0.3 0.9 U N Yes
Perfluorooctanesulfonic acid (PFOS) 1763-23-1 T 1 0.7 3 U N 0.7 3 U N Yes
Perfluorooctanoic acid (PFOA) 335-67-1 T 1 0.3 0.9 U N 0.3 0.9 U N Yes
Perfluoropentanoic Acid (PFPeA) 2706-90-3 T 1 0.3 0.9 U N 0.3 0.9 U N Yes
Perfluorotetradecanoic acid (PFTA) 376-06-7 T 1 0.3 0.9 U N 0.3 0.9 UJ N IS Yes
Perfluorotridecanoic Acid (PFTriA) 72629-94-8 T 1 0.3 0.9 U N 0.3 0.9 U N Yes
Perfluoroundecanoic Acid (PFUnA) 2058-94-8 T 1 0.4 2 U N 0.4 2 U N Yes
PFOSA 754-91-6 T 1 0.3 0.9 U N 0.3 0.9 UJ N IS Yes
Page: 1 of 311/22/2017 1:08:18 PM
Facility: BenningtonSDG: SNB15

Sample ID SG3-FTB01-171025
Sample Date 10/25/2017 9:20:00 AM
Sample Type FB
Parent Sample ID
Sample Matrix WQ
Lab Sample ID 9283923
Analytical Method E537
Result Unit ng/l
Fraction T
Location/Depth
Validated? Y
Validation Level CATEGORY B
Result Type
Chemical Name CAS T/D DF Lab Result
Lab MDL Lab LOQ Lab Qualifier
Lab Detect
Flag
Final Result
Final MDL
Final LOQ Final Qualifier
Final Detect
Flag
ValidationReason Code
ReportableResult?
TRG 6:2 Fluorotelomer sulfonate 27619-97-2 T 1 3 6 U N 3 6 U N Yes
8:2 Fluorotelomer sulfonate 39108-34-4 T 1 2 6 U N 2 6 U N Yes
NEtFOSAA 2991-50-6 T 1 0.4 2 U N 0.4 2 U N Yes
NMeFOSAA 2355-31-9 T 1 0.4 2 U N 0.4 2 U N Yes
Perfluorobutanesulfonic acid (PFBS) 375-73-5 T 1 0.3 1 U N 0.3 1 U N Yes
Perfluorobutanoic Acid 375-22-4 T 1 2 5 U N 2 5 U N Yes
Perfluorodecanoic acid (PFDA) 335-76-2 T 1 0.4 2 U N 0.4 2 U N Yes
Perfluorododecanoic acid (PFDoA) 307-55-1 T 1 0.3 1 U N 0.3 1 U N Yes
Perfluoroheptanoic acid (PFHpA) 375-85-9 T 1 0.3 1 U N 0.3 1 U N Yes
Perfluorohexanesulfonic acid (PFHxS) 355-46-4 T 1 0.4 2 U N 0.4 2 U N Yes
Perfluorohexanoic acid (PFHxA) 307-24-4 T 1 0.3 1 U N 0.3 1 U N Yes
Perfluorononanoic acid (PFNA) 375-95-1 T 1 0.3 1 U N 0.3 1 U N Yes
Perfluorooctanesulfonic acid (PFOS) 1763-23-1 T 1 0.8 3 U N 0.8 3 U N Yes
Perfluorooctanoic acid (PFOA) 335-67-1 T 1 1 0.3 1 Y 1 0.3 1 Y Yes
Perfluoropentanoic Acid (PFPeA) 2706-90-3 T 1 0.3 1 U N 0.3 1 U N Yes
Perfluorotetradecanoic acid (PFTA) 376-06-7 T 1 0.3 1 U N 0.3 1 U N Yes
Perfluorotridecanoic Acid (PFTriA) 72629-94-8 T 1 0.3 1 U N 0.3 1 U N Yes
Perfluoroundecanoic Acid (PFUnA) 2058-94-8 T 1 0.4 2 U N 0.4 2 U N Yes
PFOSA 754-91-6 T 1 0.3 1 U N 0.3 1 UJ N IS Yes
Page: 2 of 311/22/2017 1:08:18 PM
Facility: BenningtonSDG: SNB15

Sample ID SG3-D15-171025
Sample Date 10/25/2017 1:50:00 PM
Sample Type N
Parent Sample ID
Sample Matrix WG
Lab Sample ID 9283924
Analytical Method E537
Result Unit ng/l
Fraction T
Location/Depth D15
Validated? Y
Validation Level CATEGORY B
Result Type
Chemical Name CAS T/D DF Lab Result
Lab MDL Lab LOQ Lab Qualifier
Lab Detect
Flag
Final Result
Final MDL
Final LOQ Final Qualifier
Final Detect
Flag
ValidationReason Code
ReportableResult?
TRG 6:2 Fluorotelomer sulfonate 27619-97-2 T 1 7 10 U N 7 10 U N Yes
8:2 Fluorotelomer sulfonate 39108-34-4 T 1 5 10 U N 5 10 U N Yes
NEtFOSAA 2991-50-6 T 1 1 5 U N 1 5 U N Yes
NMeFOSAA 2355-31-9 T 1 1 5 U N 1 5 U N Yes
Perfluorobutanesulfonic acid (PFBS) 375-73-5 T 1 0.7 2 U N 0.7 2 U N Yes
Perfluorobutanoic Acid 375-22-4 T 1 5 10 U N 5 10 U N Yes
Perfluorodecanoic acid (PFDA) 335-76-2 T 1 1 5 U N 1 5 U N Yes
Perfluorododecanoic acid (PFDoA) 307-55-1 T 1 0.7 2 U N 0.7 2 U N Yes
Perfluoroheptanoic acid (PFHpA) 375-85-9 T 1 2 0.7 2 J Y 2 0.7 2 J Y Yes
Perfluorohexanesulfonic acid (PFHxS) 355-46-4 T 1 1 5 U N 1 5 U N Yes
Perfluorohexanoic acid (PFHxA) 307-24-4 T 1 3 0.7 2 Y 3 0.7 2 Y Yes
Perfluorononanoic acid (PFNA) 375-95-1 T 1 0.7 2 U N 0.7 2 U N Yes
Perfluorooctanesulfonic acid (PFOS) 1763-23-1 T 1 2 7 U N 2 7 U N Yes
Perfluorooctanoic acid (PFOA) 335-67-1 T 1 8 0.7 2 Y 8 0.7 2 J Y MAH Yes
Perfluoropentanoic Acid (PFPeA) 2706-90-3 T 1 2 0.7 2 J Y 2 0.7 2 J Y RL Yes
Perfluorotetradecanoic acid (PFTA) 376-06-7 T 1 0.7 2 U N 0.7 2 U N Yes
Perfluorotridecanoic Acid (PFTriA) 72629-94-8 T 1 0.7 2 U N 0.7 2 U N Yes
Perfluoroundecanoic Acid (PFUnA) 2058-94-8 T 1 1 5 U N 1 5 U N Yes
PFOSA 754-91-6 T 1 0.7 2 U N 0.7 2 UJ N IS Yes
Page: 3 of 311/22/2017 1:08:18 PM
Facility: BenningtonSDG: SNB15


Initial Calibration Criteria
Calibration Procedure
Frequency of Calibration Acceptance Criteria Corrective Action (CA)
1. Initial Calibration: Minimum of five calibration standards. 2. Analyze MDL standard to ensure all compounds detected at MDL level 3. Analyze a technical grade branched/linear chained standard for PFOA/PFOS/PFHxS.
1. Initially and the after continuing calibration fails. 2. Analyzed with each initial calibration. 3. Run with each initial calibration.
1. Back calculated concentration of each calibration point should be within ±30% (or 70‐130%) of true. The level 1 calibration standard back calculated concentrations should be ±50% (or 50‐150%) of true value. R2 ≥ 0.99 for each analyte. 2. All compounds detected. 3. Qualitative use only to assist chemists in the integration of these compounds.
1. If criteria are not met, the source of the problem should be determined, corrected and the system recalibrated. Situations may exist where the initial calibration can be used. In those cases, the data will be reported with a qualifying comment. 2. If compound not detected in MDL standard, the source of the problem should be determined and the system recalibrated.
Continuing Calibration Criteria
Calibration Procedure
Frequency of Calibration Acceptance Criteria Corrective Action (CA)
Analyze every 10 samples and at the end of the analysis sequence. Concentrations alternate between low, mid, and high levels of the calibration curve. The CCV ran after ICAL must be at CAL3 level. Opening CCV for sequence should be at CAL1 level and must be within 50‐150%.
Occurs every 10 samples and at the end of the analysis sequence.
Calculated amount for the native analytes should be within ±30% of the true value. The absolute areas of the isotopically labeled internal standards should be within ±50% (or 50‐150%) of the average areas measured during the initial calibration. The calculated amount for the isotopically labeled extraction standards should be within the advisory window of 70‐130%
If criteria are not met, the source of the problem should be determined, corrected and the system recalibrated. Situations may exist where the continuing calibration can be used. In those cases, the data will be reported with a qualifying comment.

Initial Calibration Verification
Calibration Procedure
Frequency of Calibration Acceptance Criteria Corrective Action (CA)
Second source standard analyzed at the end of each initial calibration.
Analyzed with each initial calibration
1. Calculated amount for each native analytes should be within 70‐130% of the true value. 2. The absolute areas of the isotopically labeled internal standards should be within ±50% (or 50‐150%) of the average areas measured during the initial calibration.
1. If criteria are not met, the source of the problem should be determined and corrected. Situations may exist where the initial calibration verification can be used. In those cases, the data will be reported with a qualifying comment.
QC Acceptance Criteria
QC Sample Frequency/Number QC Acceptance Limits Corrective Action

QC Sample Frequency/Number QC Acceptance Limits Corrective Action
Method Blanks
1 per 20 field samples
1. No positive detections above the MDL. 2. The absolute areas of the isotopically labeled internal standards should be within ±50% (or 50‐150%) of the average areas measured during the initial calibration.3. The % differences for the isotopically labeled extraction standards should be within the advisory QC window of 70‐130%
1. Report if the analyte present in the method blank is not detected in the sample or the analyte detected in the sample at greater than 10x’s the amount in the method blank. If analyte detected in blank and sample at approximately the sample concentration sample will be RX’d. 2. Blank will be reinjected. Blank data may be qualified and reported. 3. If extraction standards are outside the advisory window and there are positive detections in the blank, the blank may be reinjected. If after reinjection, extraction standards are still out data may be reported and qualified due to the advisory nature of the windows.
LCS 1 per 20 field samples
1. Advisory QC limits of 70‐130%, RPD<30% 2. The absolute areas of the isotopically labeled internal standards should be within ±50% (or 50‐150%) of the average areas measured during the initial calibration. 3. The % differences for the isotopically labeled extraction standards should be within the advisory QC window of 70‐130%
1. Reextract LCS and associated samples. Analytes that fail high and are ND in the samples can be reported. Due to the advisory nature of the acceptance limits, situations may exist where LCS can be used. In those cases, the data will be reported with a qualifying comment. 2. If all native recoveries are within QC limits, data can be reported. 3. If all native recoveries are within QC limits, data can be reported.

QC Sample Frequency/Number QC Acceptance Limits Corrective Action
MS/MSD MS is routinely prepared with each extraction batch. If limited sample volume exists, an LCS/LCSD will be prepared.
1. Advisory QC limits of 70‐130%, RPD<30%. 2. The absolute areas of the isotopically labeled internal standards should be within ±50% (or 50‐150%) of the average areas measured during the initial calibration. 3. The % differences for the isotopically labeled extraction standards should be within the advisory QC window of 70‐130%
Evaluate in conjunction with LCS.
Isotopically labeled internal standards
Per sample (including MS/MSD, LCS, and Blanks)
The absolute areas of the isotopically labeled internal standards should be within ±50% (or 50‐150%) of the average areas measured during the initial calibration.
Reinject samples as necessary. Report data with qualifying comment.
Isotopically labeled extraction standards
Per sample (including MS/MSD, LCS, and Blanks)
The percent difference for the isotopically labeled extraction standards should be within the advisory QC window of 70‐130% or laboratory‐generated control limits, if available.
Reinject samples as necessary. Report data with qualifying comment.

Data Validation Standard Operating Procedure SOP: DV-PFAS- ELLE
Date: September 19, 2017 Revision No.: 4
Page: 1 of 14
PROPRIETARY
Environmental Standards, Inc. w:\saint gobain\20167391\final\dv pfas elle rev4.doc
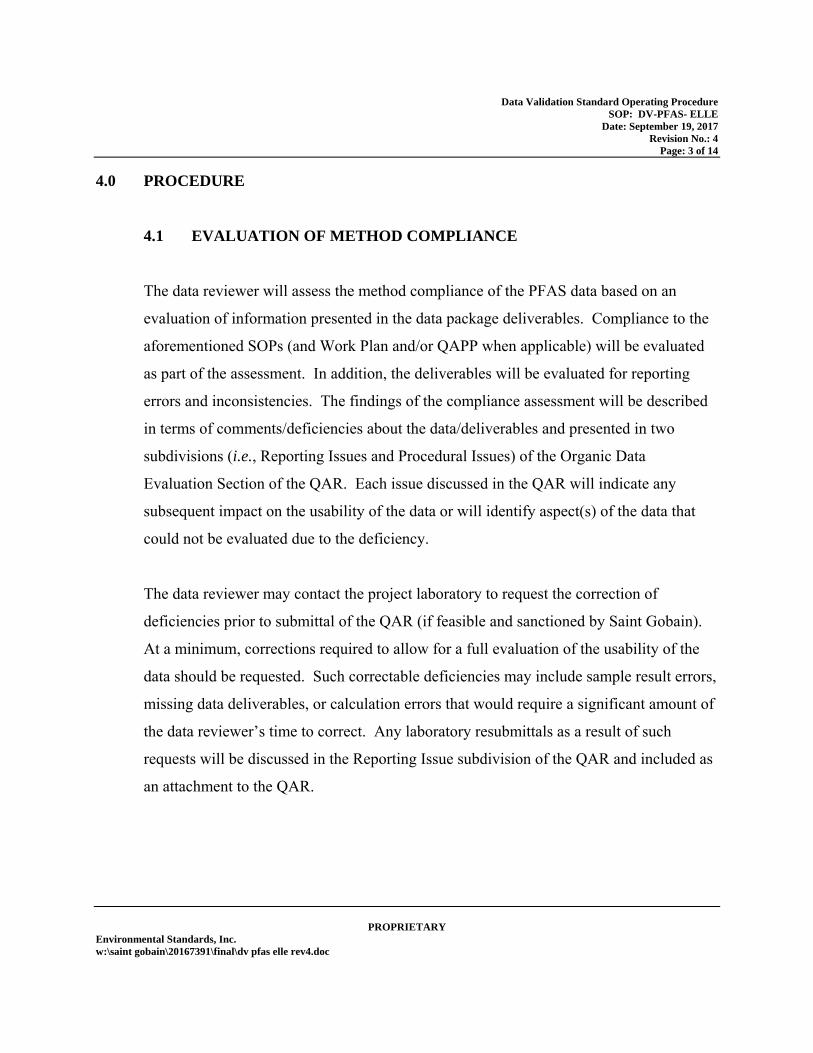
1.0 OBJECTIVES This standard operating procedure (SOP) describes procedures that the Environmental Standards
data reviewers will use to validate Perfluorinated and Polyfluorinated Alkyl Substance (PFAS)
data for solid samples generated by Eurofins SOP “Polyfluorinated Alkyl Substances (PFASs) in
Solids by Method 537 Version 1.1 Modified Using LC/MS/MS” (Eurofins Document Reference
T-PFAS-WI12031, Version 2) and aqueous samples generated by Eurofins SOP “Polyfluorinated
Alkyl Substances (PFASs) in Aqueous Samples by Method 537 Revision 1.1 Using LC/MS/MS”
(Eurofins Document Reference T-PFAS-WI14355, Version 2) for various Saint-Gobain
Performance Plastics Corporation (Saint-Gobain) sites. Validation will be performed to assess
compliance of the sample data to these Eurofins SOPs and any applicable Work Plans and/or
Quality Assurance Project Plans (QAPPs). In addition, the usability of the PFAS data provided
by the analytical laboratory will be determined based on the general guidance provided in the
“National Functional Guidelines for Organic Superfund Data Review” (US EPA, September
2016) and “National Functional Guidelines for High Resolution Superfund Methods Data
Review (USEPA, April 2016). It should be noted that the National Functional Guidelines apply
strictly to data generated by the Contract Laboratory Program (CLP) protocol and are not directly
applicable to validation of data generated by Modified EPA Method 537; therefore, this SOP
presents the specific data qualification actions that will be used for validation.
The validation findings will be presented in a quality assurance review (QAR) that will be
prepared for one or more sample delivery groups (SDGs). Copies of annotated analytical results
summaries (Form I’s), including any changes to the analytical results and data qualifier codes, or
a data summary spreadsheet of the qualified analytical results, will be included in the support
documentation of the QAR.

Data Validation Standard Operating Procedure SOP: DV-PFAS- ELLE
Date: September 19, 2017 Revision No.: 4
Page: 2 of 14
PROPRIETARY
Environmental Standards, Inc. w:\saint gobain\20167391\final\dv pfas elle rev4.doc
2.0 EVALUATION TOOLS
field duplicate form (DVF_DUP_SG_ELLE.xlsm)
Chemistry Applications:
Curve fitting software (DVF_CAL.xlsm)
Methods Database
3.0 REFERENCE DOCUMENTS
“National Functional Guidelines for Organic Superfund Data Review” (US EPA, September
2016)
“National Functional Guidelines for High Resolution Superfund Methods Data Review
(USEPA, April 2016).
Eurofins Document Reference T-PFAS-WI12031.
Eurofins Document Reference T-PFAS-WI14355.
US EPA Method 537, Version 1.1 (September 2009).
Guidance for Labelling Externally Validated Laboratory Analytical Data for Superfund Use
(EPA 540-R-08-005, 2009).
Data Validation Standard Operating Procedure SOP: DV-PFAS- ELLE
Date: September 19, 2017 Revision No.: 4
Page: 3 of 14
PROPRIETARY
Environmental Standards, Inc. w:\saint gobain\20167391\final\dv pfas elle rev4.doc
4.0 PROCEDURE
4.1 EVALUATION OF METHOD COMPLIANCE
The data reviewer will assess the method compliance of the PFAS data based on an
evaluation of information presented in the data package deliverables. Compliance to the
aforementioned SOPs (and Work Plan and/or QAPP when applicable) will be evaluated
as part of the assessment. In addition, the deliverables will be evaluated for reporting
errors and inconsistencies. The findings of the compliance assessment will be described
in terms of comments/deficiencies about the data/deliverables and presented in two
subdivisions (i.e., Reporting Issues and Procedural Issues) of the Organic Data
Evaluation Section of the QAR. Each issue discussed in the QAR will indicate any
subsequent impact on the usability of the data or will identify aspect(s) of the data that
could not be evaluated due to the deficiency.
The data reviewer may contact the project laboratory to request the correction of
deficiencies prior to submittal of the QAR (if feasible and sanctioned by Saint Gobain).
At a minimum, corrections required to allow for a full evaluation of the usability of the
data should be requested. Such correctable deficiencies may include sample result errors,
missing data deliverables, or calculation errors that would require a significant amount of
the data reviewer’s time to correct. Any laboratory resubmittals as a result of such
requests will be discussed in the Reporting Issue subdivision of the QAR and included as
an attachment to the QAR.

Data Validation Standard Operating Procedure SOP: DV-PFAS- ELLE
Date: September 19, 2017 Revision No.: 4
Page: 4 of 14
PROPRIETARY
Environmental Standards, Inc. w:\saint gobain\20167391\final\dv pfas elle rev4.doc
4.2 DETERMINATION OF DATA USABILITY
The data reviewer will determine the usability of the PFAS data based on an evaluation
of the information presented in the data package deliverables. The findings of the PFAS
data usability assessment will be presented in terms of data qualifications that the project
team should consider in order to best utilize the data; these qualifications will be
presented in the Organic Data Qualifier subsection of the QAR. Each qualification
discussed in the QAR will indicate that the affected sample result(s) has been flagged
with a representative qualifier code(s) in the data tables to provide, at a glance, an
indication of the quantitative and qualitative reliability of each analytical result. In
general, the qualifier statements will be presented in the QAR in the following order:
blank contamination (UB), unusable results (R/UR), estimated results (J/UJ), tentative
identifications of target compound results (N), and a general qualifier for all results
reported below the limit of quantitation (if applicable). In addition, a Validation Reason
Code will be presented on the data tables to indicate the reason that a qualifier code has
been applied.
The data reviewer’s criteria for evaluating the usability of the PFAS data and the resultant
qualifications and reason codes will be as stipulated on the attached Table for the
Validation of PFAS Data Generated. Additional qualifications and reason codes will be
assigned based on professional judgement. It should be noted that the project manager
should be consulted when “professional judgement” use is indicated on the attached
table.

Data Validation Standard Operating Procedure SOP: DV-PFAS- ELLE
Date: September 19, 2017 Revision No.: 4
Page: 6 of 14
Table for the Validation of PFAS Data
PROPRIETARY
Environmental Standards, Inc. w:\saint gobain\20167391\final\dv pfas elle rev4.doc
Quality Control Item Usability Criteria Action Temperature Upon Receipt
≤6C If temperature is <2C, no action is required unless samples were frozen/broken and then professional judgment should be used. If temperature is >6C but 20C, qualify positive results as estimated (“J”) and qualify “not-detected” results as estimated (“UJ”). (Validation Reason Code “SPL”) If temperature is > 20C, qualify positive results as estimated (“J”) and qualify “not-detected” results as unusable (“R”). (Validation Reason Code “SPL”) Note time of collection relative to receipt at laboratory. Professional judgement should be used if < 8 hours has elapsed from collection to receipt at the laboratory to determine if qualification due to elevated temperature applies.
Technical Holding Time Solid samples should be extracted within 28 days of sample collection and aqueous samples should be extracted within 14 days of collection. All extracts should be analyzed within 28 days after extraction.
If a holding time is exceeded, qualify positive results as estimated (“J”) and qualify “not-detected” results as estimated (“UJ”). (Validation Reason Code “HPL” or “HAL” for extraction or analysis holding time exceedance, respectively) If a holding time is grossly exceeded (i.e., > twice the holding time), qualify positive results as estimated (“J”) and qualify “not-detected” results as unusable (“R”). (Validation Reason Code “HPL” or “HAL” for extraction or analysis holding time exceedance, respectively)

Data Validation Standard Operating Procedure SOP: DV-PFAS- ELLE
Date: September 19, 2017 Revision No.: 4
Page: 7 of 14
Table for the Validation of PFAS Data
PROPRIETARY
Environmental Standards, Inc. w:\saint gobain\20167391\final\dv pfas elle rev4.doc
Quality Control Item Usability Criteria Action Initial Calibration (See Note #1 for additional information.)
Back calculated concentration of each calibration point should be within 70-130% of true value. The level 1 (lowest) calibration standard back calculated concentrations should be within 50-150% of true value. r2 ≥ 0.99 for each analyte.
When evaluating initial calibration, use professional judgment to first assess impact of any out-of-criteria labeled PFAS on the corresponding target PFAS(s). If the low point or consecutive points at the low end of the curve are below the lower recovery criteria, qualify positive results < lowest compliant point as estimated (“J”) and qualify “not-detected” results as estimated (“UJ”). (Validation Reason Code “ICL”) If the low point or consecutive points at the low end of the curve are above the upper recovery criteria, qualify positive results < lowest compliant point as estimated (“J”). (Validation Reason Code “ICH”) If a point in the middle of the curve or non-consecutive points (beside the low point) quantitate outside of criteria, qualify positive results as estimated (“J”). If the high point or consecutive points at the upper end of the curve quantitates outside of criteria, qualify positive results > highest compliant point as estimated (“J”). (Validation Reason Code “ICL,” “ICH,” or “IC,” are to be used based on whether direction of bias can be determined in these situations) Professional judgement should be used to qualify “not-detected” results as estimated (“UJ”) if low recoveries are observed for standards other than the lowest calibration point. (Validation Reason Code “ICL”) If the r2 ≥ 0.99 for any analyte, qualify positive results as estimated (“J”). (Validation Reason Code “IC”)

Data Validation Standard Operating Procedure SOP: DV-PFAS- ELLE
Date: September 19, 2017 Revision No.: 4
Page: 8 of 14
Table for the Validation of PFAS Data
PROPRIETARY
Environmental Standards, Inc. w:\saint gobain\20167391\final\dv pfas elle rev4.doc
Quality Control Item Usability Criteria Action Second Source Initial Calibration Verification (ICV)
1. Calculated amount for each compound should be within 70-130% (±30%) of the true value. 2. The isotopically labeled injection and/or extraction standards should be within criteria.
Qualification is for all samples associated with initial calibration being verified. When evaluating ICV, use professional judgment to first assess impact of any out-of-criteria labeled PFAS on the corresponding target PFAS. If target PFAS has %D>30% with the response indicating a sensitivity increase, qualify positive results as estimated (“J”) and do not qualify “not-detected” results. (Validation Reason Code “SSH”) If target PFAS has %D>30% but 90%, with the response indicating a sensitivity decrease, qualify positive results as estimated (“J”) and qualify “not-detected” results as estimated (“UJ”). (Validation Reason Code “SSL”) If target PFAS has %D>90% with the response indicating a sensitivity decrease , qualify positive results as estimated (“J”) and qualify “not-detected” results as unusable (“R”). (Validation Reason Code “SSL”)
Continuing Calibration Verification (See Note #2 for additional information.)
Calculated amount should be within ±30% of the true value. The isotopically labeled injection and/or extraction standards should be within criteria. The CCV ran after ICAL must be at CAL3 level. Opening CCV for sequence should be at CAL1 level and must be within 50-150%.
Qualification is for all samples on both sides of the out-of-criteria calibration verification standards. When evaluating calibration verification, use professional judgment to first assess impact of any out-of-criteria labeled PFAS on the corresponding target PFAS. If target PFAS has %D>30% (50% for CAL1 CCV) with the response indicating a sensitivity increase, qualify positive results as estimated (“J”) and do not qualify “not-detected” results. (Validation Reason Code “CVH”) If target PFAS has %D>30% (50% for CAL1 CCV) but 90%, with the response indicating a sensitivity decrease, qualify positive results as estimated (“J”) and qualify “not-detected” results as estimated (“UJ”). (Validation Reason Code “CVL”) If target PFAS has %D>90% with the response indicating a sensitivity decrease, qualify positive results as estimated (“J”) and qualify “not-detected” results as unusable (“R”). (Validation Reason Code “CVL”)

Data Validation Standard Operating Procedure SOP: DV-PFAS- ELLE
Date: September 19, 2017 Revision No.: 4
Page: 9 of 14
Table for the Validation of PFAS Data
PROPRIETARY
Environmental Standards, Inc. w:\saint gobain\20167391\final\dv pfas elle rev4.doc
Quality Control Item Usability Criteria Action Blanks (See Note #3 for additional information.)
Summarize all results greater than the method detection limit (MDL) present in the blanks. The highest positive result associated with a sample should be utilized for evaluation of contamination.
If a target PFAS is found in the blank but not in the associated sample(s), no action is required. If a sample result is 5 the blank result, qualify the positive result as “not detected” (“UB”) and raise the method detection limit (MDL) and/or limit of quantitation (LOQ) (if lower than original reported positive result) to the value of the original result. (Validation Reason Code(s) “EB,” FB,” ”IB,” ”MB,” and or “TB,” as appropriate). If a sample result is >5 blank result, qualification is not required. Professional judgement should be used to evaluate whether an aqueous blank should be used to qualify a solid sample.
Injection/Internal Standards (Labelled Analytes, spiked prior to injection and used as internal standards for extraction standards)
The response for each internal standard in the original sample must be within ±%50 of the average initial calibration response.
If an internal response is outside of criteria, use professional judgment to determine the potential impact on the quantitation of the extraction standard recoveries and whether qualification due to out-of-criteria extraction standard recoveries (see directly below) should be modified.
Extraction Standards (Labelled Analytes, spiked prior to extraction and used as internal standards for target compounds)
The response for each ES in the original sample must be within the advisory limits of 70-130% recovery or laboratory-generated control limits, if available.
If an ES response or recovery is outside of criteria but 10%, qualify positive results as estimated (“J”) and qualify “not-detected” results as estimated (“UJ”) for PFASs quantitated using that ES. (Validation Reason Code “IS”) If an ES response is < 10%, qualify positive results for the associated PFASs as estimated (“J”) and qualify “not-detected” results for the associated PFASs as estimated (“UJ”) or unusable (“R”) using professional judgment (based on the approximate signal-to-noise ratio for the ES and the expected response for the target PFAS at the LOQ). (Validation Reason Code “IS”)

Data Validation Standard Operating Procedure SOP: DV-PFAS- ELLE
Date: September 19, 2017 Revision No.: 4
Page: 10 of 14
Table for the Validation of PFAS Data
PROPRIETARY
Environmental Standards, Inc. w:\saint gobain\20167391\final\dv pfas elle rev4.doc
Quality Control Item Usability Criteria Action Laboratory Control Samples (LCS)/ Laboratory Control Sample Duplicates (LCSD)
%R within 70-130%, RPD ≤ 30%. The LCS qualification will be applied to all samples in the preparation batch. If the recovery is 130%, qualify positive results in all associated samples as estimated (“J”) and do not qualify “not-detected” results. (Validation Reason Code “LAH”) If the recovery is < 70%, qualify positive results in all associated samples as estimated (“J”) and qualify “not-detected” results in all associated samples as estimated (“UJ”). (Validation Reason Code “LAL”) If the recovery is < 30%, qualify positive results in all associated samples as estimated (“J”) and qualify “not-detected” results in all associated samples as unusable (“R”). (Validation Reason Code “LAL”) If the precision between recoveries exceeds the RPD criterion, qualify positive results as estimated (“J”) and do not qualify “not-detected” results. (Validation Reason Code “LP”)
Matrix Spike/Matrix Spike Duplicate (MS/MSD) (If performed)
%R within 70-130%, RPD ≤ 30%. The MS/MSD qualification will be applied to the unspiked parent sample. Data should not be qualified due to %Rs (or RPDs calculated on %Rs) that are outside of criteria if the original concentration of a PFAS is >4 the spiking level for that compound. In such cases, RPDs calculated using MS/MSD results can be used to evaluate precision. If the recovery is 130%, qualify positive results in all associated samples as estimated (“J”) and do not qualify “not-detected” results. (Validation Reason Code “MAH”) If the recovery is < 70%, qualify positive results in all associated samples as estimated (“J”) and qualify “not-detected” results in all associated samples as estimated (“UJ”). If the recovery is < 30%, qualify positive results in all associated samples as estimated (“J”) and qualify “not-detected” results in all associated samples as unusable (“R”). (Validation Reason Code “MAL”) If the precision between recoveries exceeds the RPD criterion, qualify the positive result in the native sample as estimated (“J”) and do not qualify the “not-detected” result. (Validation Reason Code “MP”)

Data Validation Standard Operating Procedure SOP: DV-PFAS- ELLE
Date: September 19, 2017 Revision No.: 4
Page: 11 of 14
Table for the Validation of PFAS Data
PROPRIETARY
Environmental Standards, Inc. w:\saint gobain\20167391\final\dv pfas elle rev4.doc
Quality Control Item Usability Criteria Action Field/Laboratory Duplicate (See Note #4 for additional information)
The RPD should be ≤30% when both results are >5× the sample-specific LOQ (RL). The difference between results should be ≤ 1.5×LOQ when at least one result is ≤5× the LOQ.
If both results are <LOQ, a quantitative assessment of duplicate precision is not performed. If the criteria are not met, qualify positive results for the out-of-criteria PFASs in the original sample and its duplicate as estimated (“J”). (Validation Reason Code “LD” for laboratory duplicate or “FD” for field duplicate) Use the MDL as a numerical value for any “not-detected” result in the difference calculation. Qualify “not-detected” results as estimated (“UJ”) if the difference between the results is outside of criteria. (Validation Reason Code “LD” for laboratory duplicate or “FD” for field duplicate)
Percent Solids Solid samples with less than 30% solid content require qualification.
If a solid sample has a percent solid content <30%, qualify positive results as estimated (“J”) and qualify “not-detected” results as estimated (“UJ”). (Validation Reason Code of “PS”) Use professional judgment to qualified “not-detected” results as unusable (“R”) if a solid sample has a percent solids content <10%. (Validation Reason Code of “PS”)
Compound Quantitation and Qualitative Identification (See Notes #5 for additional information.)
Samples with results that exceed the instrument calibration range should be reanalyzed at a dilution or re-extracted with a lower volume.
If a target PFAS result exceeds the instrument calibration range, qualify positive result as estimated (“J”). (Validation Reason Code “EC”) Use professional judgment to determine whether sample reanalyses and dilutions should be compared to the original analyses. If criteria (see field duplicate usability) between the original sample results and the reanalysis sample results are not met, qualify positive results as estimated (“J”) and qualify “not-detected” results as estimated (“UJ”). (Validation Reason Code “LD”) If a target PFAS is <LOQ but MDL, qualify positive results as estimated (“J”). (Validation Reason Code “RL”) Use professional judgment to determine whether quantitation and qualitative identifications are accurate and whether data qualification is necessary.
System Performance
Professional judgement should be used when assessing the degradation of system performance during analyses.
Use professional judgment to qualify the data if it is determined that system performance degraded during sample analyses.

Data Validation Standard Operating Procedure SOP: DV-PFAS- ELLE
Date: September 19, 2017 Revision No.: 4
Page: 12 of 14
Table for the Validation of PFAS Data
PROPRIETARY
Environmental Standards, Inc. w:\saint gobain\20167391\final\dv pfas elle rev4.doc
Quality Control Item Usability Criteria Action Overall Assessment of Data
Assess overall quality of the data. Review available materials to assess the quality, keeping in mind the additive nature of the analytical problems.
Use professional judgment to determine the need to qualify data not qualified based on the QC previously discussed. Write a brief narrative to give the user an indication of the analytical limitations of the data. If sufficient information on the intended use and required quality of the data is available, include the assessment of the usability of the data within the given context.

Data Validation Standard Operating Procedure SOP: DV-PFAS- ELLE
Date: September 19, 2017 Revision No.: 4
Page: 13 of 14
Validation Notes
PROPRIETARY
Environmental Standards, Inc. w:\saint gobain\20167391\final\dv pfas elle rev4.doc
1. Use professional judgment when evaluating the response intercept of a calibration curve.
If the response intercept is positive, the samples should be evaluated for false positives.
If the response intercept is negative, the sample should be evaluated for false negatives.
2. If instrument instability (i.e., several calibration verification standards with PFASs
exhibiting both increasing and decreasing sensitivity throughout an analytical sequence)
is observed in the analysis of sequential calibration verification standards, “not-detected”
results may be qualified as estimated (“UJ”) due to instrument sensitivity of a continuing
calibration standard response that is greater than the initial calibration standard response
(increase in instrument sensitivity).
3. The frequency of equipment/rinse blanks is determined during the sampling event. The
results of an equipment/rinse blank should be applied to all collected in the same day by
the same techniques, unless only one blank was collected for a several-day sampling
event. In instances where more than one blank is associated with a given sample,
qualification should be based upon a comparison with the associated blank having the
highest concentration of a contaminant. Professional judgement should be used to
evaluate whether an aqueous blank should be used to directly qualify a solid sample.
Method blank contamination should be applied to samples in the preparation batch.
Instrument blank contamination should be applied to samples bracketing the
contaminated instrument blank.
Blanks should also be evaluated using professional judgment for non-target interference.

Data Validation Standard Operating Procedure SOP: DV-PFAS- ELLE
Date: September 19, 2017 Revision No.: 4
Page: 14 of 14
Validation Notes
PROPRIETARY
Environmental Standards, Inc. w:\saint gobain\20167391\final\dv pfas elle rev4.doc
4. Duplicate samples may be collected and analyzed as an indication of overall precision.
Field duplicate analyses measure both field and laboratory precision; therefore, the results
may have more variability than laboratory duplicates that measure only laboratory
performance. Laboratory duplicate results and field duplicate results apply only to the
original sample and the laboratory/field duplicate. Solid duplicate results are expected to
have greater variance than aqueous duplicate results.
5. If a sample result exceeds the instrument calibration range (lower dilution analysis) or is
less than the LOQ (secondary dilution), do not utilize this result when comparing an
original analysis and a diluted reanalysis.
Poor chromatographic performance may affect qualitative identification and/or
quantitation. Indications of substandard performance include:
• High background levels
• Extraneous peaks
• Loss of resolution
• Peak tailing or peak splitting that may result in inaccurate quantitation
• The laboratory analyzes a Cal3 level standard that contains linear and branch chained
isomers of PFOA, PFOS, and PFHxS for analyses. The analysis of this standard is used
to demonstrate where the branch chained isomers elute and is not included in the
calibration curve. This will assist the chemist in the integration of branched isomers of
these compounds in samples.