data warehousing and data mining - niilm university
TRANSCRIPT

managementMEDIAHEALTH
lawD
ESIGN
EDU
CAT
ION
MU
SICagriculture
LA
NG
UA
GEM E C H A N I C S
psychology
BIOTECHNOLOGY
GEOGRAPHY
ARTPHYSICS
history
ECOLOGY
CHEMISTRY
math
ematicsENGINEERING
DATA WAREHOUSING AND DATA MINING

Subject: DATA WAREHOUSING AND DATA MINING Credits: 4
SYLLABUS
Basic Concepts of Data Warehousing
Introduction, Meaning and characteristics of Data Warehousing, Online Transaction Processing (OLTP), Data Warehousing Models, Data warehouse architecture & Principles of Data Warehousing Data Mining. Building a Data Warehouse Project
Structure of the Data warehouse, Data warehousing and Operational Systems, Organizing for building data warehousing, Important considerations – Tighter integration, Empowerment, Willingness Business Considerations: Return on Investment Design Considerations, Technical Consideration, Implementation Consideration, Benefits of Data warehousing. Managing and Implementing a Data Warehouse Project
Project Management Process, Scope Statement, Work Breakdown Structure and Integration, Initiating a data warehousing project Project Estimation, Analyzing Probability and Risk, Managing Risk: Internal and External, Critical Path Analysis. Data Mining
What is Data mining (DM)? Definition and description, Relationship and Patterns, KDD vs Data mining, DBMS vs Data mining, Elements and uses of Data Mining, Measuring Data Mining Effectiveness : Accuracy,Speed & Cost Data Information and Knowledge, Data Mining vs. Machine Learning, Data Mining Models. Issues and challenges in DM, DM Applications Areas. Techniques of Data Mining
Various Techniques of Data Mining Nearest Neighbour and Clustering Techniques, Decision Trees, Discovery of Association Rules, Neural Networks, Genetic Algorithm. OLAP
Need for OLAP, OLAP vs. OLTP Multidimensional Data Model Multidimensional verses Multirelational OLAP Characteristics of OLAP: FASMI Test (Fast, Analysis Share, Multidimensional and Information), Features of OLAP, OLAP Operations Categorization of OLAP Tools: MOLAP, ROLAP Suggested Readings:
1. Pieter Adriaans, Dolf Zantinge Data Mining, Pearson Education2. George M. Marakas Modern Data Warehousing, Mining, and Visualization: Core Concepts, Prentice
Hall, 1st edition3. Alex Berson, Stephen J. Smith Data Warehousing, Data Mining, and OLAP (Data Warehousing/Data
Management), McGraw-Hill 4. Margaret H. Dunham Data Mining, Prentice Hall, 1st edition, 5. David J. Hand Principles of Data Mining (Adaptive Computation and Machine Learning), Prentice Hall,
1st edition 6. Jiawei Han, Micheline Kamber Data Mining, Prentice Hall, 1st edition7. Michael J. Corey, Michael Abbey, Ben Taub, Ian Abramson Oracle 8i Data Warehousing McGraw-Hill
Osborne Media, 2nd edition

i
DA
TA W
AR
EH
OU
SIN
G A
ND
DA
TA M
ININ
G
DATA WAREHOUSING AND DATA MININGMCA
COURSE OVERVIEW
The last few years have seen a growing recognition of informa-
tion as a key business tool. In general, the current business
market dynamics make it abundantly clear that, for any com-
pany, information is the very key to survival.
If we look at the evolution of the information processing
technologies, we can see that while the first generation of client/
server systems brought data to the desktop, not all of this data
was easy to understand, unfortunately, and as such, it was not
very useful to end users. As a result, a number of new tech-
nologies have emerged that are focused on improving the
information content of the data to empower the knowledge
workers of today and tomorrow. Among these technologies are
data warehousing, online analytical processing (OLAP), and data
mining.
Therefore, this book is about the need, the value and the
technological means of acquiring and using information in the
information age.
From that perspective, this book is intended to become the
handbook and guide for anybody who’s interested in planning,
or working on data warehousing and related issues. Meaning
and characteristics of Data Warehousing, Data Warehousing
Models, Data warehouse architecture & Principles of Data
Warehousing, topics related to building a data warehouse
project are discussed along with Managing and implementing a
data warehouse project. Using these topics as a foundation, this
book proceeds to analyze various important concepts related to
Data mining, Techniques of data mining, Need for OLAP,
OLAP vs. OLTP, Multidimensional data model, Multidimen-
sional verses Multirelational OLAP, OLAP Operations and
Categorization of OLAP Tools: MOLAP and ROLAP.
Armed with the knowledge of data warehousing technology,
the student continues into a discussion on the principles of
business analysis, models and patterns and an in-depth analysis
of data mining.
PrerequisiteKnowledge of Database Management Systems
ObjectiveEver since the dawn of business data processing, managers
have been seeking ways to increase the utility of their informa-
tion systems. In the past, much of the emphasis has been on
automating the transactions that move an organization through
the interlocking cycles of sales, production and administration.
Whether accepting an order, purchasing raw materials, or paying
employees, most organizations process an enormous number
of transactions and in so doing gather an even larger amount
of data about their business.
Despite all the data they have accumulated, what users really
want is information. In conjunction with the increased amount
of data, there has been a shift in the primary users of comput-
ers, from a limited group of information systems professionals
to a much larger group of knowledge workers with expertise in
particular business domains, such as finance, marketing, or
manufacturing. Data warehousing is a collection of technologies
designed to convert heaps of data to usable information. It

ii
DA
TA W
AR
EH
OU
SIN
G A
ND
DA
TA M
ININ
G
does this by consolidating data from diverse transactional
systems into a coherent collection of consistent, quality-checked
databases used only for informational purposes. Data ware-
houses are used to support online analytical processing (OLAP).
However, the very size and complexity of data warehouses
make it difficult for any user, no matter how knowledgeable in
the application of data, to formulate all possible hypotheses
that might explain something such as the behavior of a group
of customers. How can anyone successfully explore databases
containing 100 millions rows of data, each with thousands of
attributes?
The newest, hottest technology to address these concerns is data
mining. Data mining uses sophisticated statistical analysis and
modeling techniques to uncover pattern and relationships
hidden in organizational databases – patterns that ordinary
methods might miss.
The objective of this book is to have detailed information
about Data warehousing, OLAP and data mining. I have
brought together these different pieces of data warehousing,
OLAP and data mining and have provided an understandable
and coherent explanation of how data warehousing as well as
data mining works, plus how it can be used from the business
perspective. This book will be a useful guide.

iv
DA
TA W
AR
EH
OU
SIN
G A
ND
DA
TA M
ININ
G
. Lesson No. Topic Page No.
Lesson Plan vi
Data Warehousing
Lesson 1 Introduction to Data Warehousing 1
Lesson 2 Meaning and Characteristics of Data Warehousing 5
Lesson 3 OnLine Transaction Processing 9
Lesson 4 Data warehousing Models 13
Lesson 5 Architecture and Principles of Data warehousing 19
Building a Data Warehouse Project
Lesson 6 Data warehousing and Operational Systems 25
Lesson 7 Building Data Warehousing, Important Considerations 32
Lesson 8 Building Data Warehousing - 2 36
Lesson 9 Business Considerations: Return on Investment
Design Considerations 39
Lesson 10 Technical Consideration, Implementation Consideration 42
Lesson 11 Benefits of Data Warehousing 45
Managing and Implementing a Data Warehouse Project
Lesson 12 Project Management Process, Scope Statement 48
Lesson 13 Work Breakdown Structure 52
Lesson 14 Project Estimation, analyzing Probability and Risk 55
Lesson 15 Managing Risk: Internal and External, Critical Path Analysis 59
Data Mining
Lesson 16 Data Mining Concepts 63
Lesson 17 Data Mining Concepts-2 67
Lesson 18 Elements and uses of Data Mining 73
Lesson 19 Data Information and Knowledge 78
Lesson 20 Data Mining Models 82
Lesson 21 Issues and challenges in DM, DM Applications Areas 87
Data Mining Techniques
Lesson 22 Various Techniques of Data Mining Nearest Neighbor
and Clustering Techniques 93
Lesson 23 Decision Trees 98
CONTENT
DATA WAREHOUSING AND DATA MININGMCA

v
DA
TA W
AR
EH
OU
SIN
G A
ND
DA
TA M
ININ
G
Lesson No. Topic Page No.
Lesson 24 Decision Trees - 2 103
Lesson 25 Neural Networks 107
Lesson 26 Neural Networks 112
Lesson 27 Association Rules and Genetic Algorithm 118
OLAP
Lesson 28 Online Analytical Processing, Need for OLAP
Multidimensional Data Model 124
Lesson 29 OLAP vs. OLTP, Characteristics of OLAP 129
Lesson 30 Multidimensional verses Multirelational OLAP,
Features of OLAP 132
Lesson 31 OLAP Operations 136
Lesson 32 Categorization of OLAP Tools Concepts used
in MOLAP/ ROLAP 141
CONTENT
DATA W AREHOUSING AND DATA MININGMCA

1
DA
TA W
AR
EH
OU
SIN
G A
ND
DA
TA M
ININ
G
LESSON 1INTRODUCTION TO
DATA WAREHOUSING
CHAPTER 1DATA WAREHOUSING
Structure• Objective• Introduction• Meaning of Data warehousing• History of Data warehousing• Traditional Approaches To Historical Data• Data from legacy systems• Extracted information on the Desktop• Factors, which Lead To Data Warehousing
ObjectiveThe main objective of this lesson is to introduce you with thebasic concept and terminology relating to Data Warehousing.By the end of this lesson you will be able to understand:• Meaning of a Data warehouse• Evolution of Data warehouse
IntroductionTraditionally, business organizations create billions of bytes ofdata about all aspects of business everyday, which containmillions of individual facts about their customers, products,operations, and people. However, this data is locked up and isextremely difficult to get at. Only a small fraction of the datathat is captured, processed, and stored in the enterprise isactually available to executives and decision makers.Recently, new concepts and tools have evolved into a newtechnology that make it possible to provide all the key peoplewithin the enterprise with access to whatever level of informa-tion needed for the enterprise to survive and prosper in anincreasingly competitive world. The term that is used for thisnew technology is “data warehousing”. In this unit I will bediscussing about the basic concept and terminology relating toData Warehousing.The Lotus was your first test of “What if “processing on theDesktop. This is what a data warehouse is all about usinginformation your business has gathered to help it react better,smarter, quicker and more efficiently.
Meaning of Data WarehousingData warehouse potential can be magnify if the appropriate datahas been collected and stored in a data warehouse. A datawarehouse is a relational database management system(RDBMS) designed specifically to meet the needs of transactionprocessing system. It can be loosely defined as any centralizeddata repository, which can be queried for business benefit, butthis will be more clearly defined letter. Data warehouse is a newpowerful technique making. It possible to extract archivedoperational data and over come inconsistencies betweendifferent legacy data formats, as well as integrating data through-out an enterprise, regardless of location, format, or
communication requirements it is possible to incorporateadditional or expert information it is.The logical link between what the managers see in their decisionSupport EIS application and the company’s operationalactivities Johan McIntyre of SAS institute Inc.In other words the data warehouse provides warehouseprovides data that is already transformed and summarized,therefore making it an appropriate environment for the moreefficient DSS and EIS applications.A data warehouse is a collection of corporate information,derived directly from operational system and someexternal data sources.Its specific purpose is to support business decisions, notbusiness ask “What if?” questions. The answer to thesequestions will ensure your business is proactive, instead ofreactive, a necessity in today’s information ago.The industry trend today is moving towards more powerfulhardware and software configuration, we now have the ability toprocess vast volumes of information analytically, which wouldhave been unheard of tenor even five years ago. A businesstoday must we able to use this emerging technology or run therisk if being information under loaded. As you read thatcorrectly - under loaded - the opposite of over loaded. Over-loaded means you are so determine what is important. If youare under loaded, you are information deficient. You cannotcope with decision – making expectation because you do notknow where you stand. You are missing critical pieces ofinformation required to make informed decisions. To illustrate the danger of being information under loaded,consider the children’s story of the country mouse is unable tocope with and environment its does not understand.What is a cat? Is it friend or foe?Why is the chess in the middle of the floor on the top of aplatform with a spring mechanism?Sensory deprivation and information overload set in. Thepicture set country mouse cowering in the corner. If is staysthere, it will shrivel up and die. The same fate awaits thebusiness that does not respond to or understand the environ-ment around it. The competition will moves in like cultures andexploit all like weaknesses.In today’s world, you do not want to be the country mouse. Intoday’s world, full of vast amounts of unfiltered information, abusiness that does not effectively use technology to shiftthrough that information will not survive the information age.Access to, and the understating of, information is power. Thispower equate to a competitive advantage and survival. This unitwill discuss building own data warehouse-a repository forstoring information your business needs to use if it hopes tosurvive and thrive in the information age. We will help you

2
DA
TA W
AR
EH
OU
SIN
G A
ND
DA
TA M
ININ
G
understand what a data warehouse is and what it is not. Youwill learn what human resources are required, as well as the rolesand responsibilities of each player. You will be given anoverview of good project management techniques to helpensure the data warehouse initiative dose not fail due the poorproject management. You will learn how to physically imple-ments a data warehouse with some new tools currently availableto help you mine those vast amounts of information storedwith in the warehouse. Without fine running this ability tomine the warehouse, even the most complete warehouse,would be useless.
History of Data WarehousingLet us first review the historical management schemes of theanalysis data and the factors that have led to the evolution ofthe data warehousing application class.
Traditional Approaches to Historical DataThroughout the history of systems development, the primaryemphasis had been given to the operational systems and thedata they process. It was not practical to keep data in theoperational systems indefinitely; and only as an afterthoughtwas a structure designed for archiving the data that the opera-tional system has processed. The fundamental requirements ofthe operational and analysis systems are different: the opera-tional systems need performance, whereas the analysis systemsneed flexibility and broad scope.
Data from Legacy SystemsDifferent platforms have been developed with the developmentof the computer systems over past three decades. In the 1970’s,business system development was done on the IBM mainframecomputers using tools such as Cobol, CICS, IMS, DB2, etc.With the advent of 1980’s computer platforms such as AS/400and VAX/VMS were developed. In late eighties and earlynineties UNIX had become a popular server platform introduc-ing the client/server architecture which remains popular till date.Despite all the changes in the platforms, architectures, tools, andtechnologies, a large number of business applications continueto run in the mainframe environment of the 1970’s. The mostimportant reason is that over the years these systems havecaptured the business knowledge and rules that are incrediblydifficult to carry to a new platform or application. These systemsare, generically called legacy systems. The data stored in suchsystems ultimately becomes remote and becomes difficult to getat.
Extracted Information on the DesktopDuring the past decade the personal computer has become verypopular for business analysis. Business Analysts now havemany of the tools required to use spreadsheets for analysis andgraphic representation. Advanced users will frequently usedesktop database programs to store and work with theinformation extracted from the legacy sources.The disadvantage of the above is that it leaves the data frag-mented and oriented towards very specific needs. Eachindividual user has obtained only the information that she/herequires. The extracts are unable to address the requirements ofmultiple users and uses. The time and cost involved inaddressing the requirements of only one user are large. Due to
the disadvantages faced it led to the development of the newapplication called Data Warehousing
Factors, which Lead To Data WarehousingMany factors have influenced the quick evolution of the datawarehousing discipline. The most important factor has been theadvancement in the hardware and software technologies.Hardware and Software prices: Software and hardware priceshave fallen to a great extent. Higher capacity memory chips areavailable at very low prices.• Powerful Preprocessors: Today’s preprocessor are many
times powerful than yesterday’s mainframes: e.g. Pentium IIIand Alpha processors
• Inexpensive disks: The hard disks of today can storehundreds of gigabytes with their prices falling. The amountof information that can be stored on just a single one-inchhigh disk drive would have required a roomful of disk drivesin 1970’s and early eighties.
• Desktop powerful for analysis tools: Easy to use GUIinterfaces, client/server architecture or multi-tier computingcan be done on the desktops as opposed to the mainframecomputers of yesterday.
• Server software: Server software is inexpensive, powerful,and easy to maintain as compared to that of the past.Example of this is Windows NT that have made setup ofpowerful systems very easy as well as reduced the cost.
The skyrocketing power of hardware and software, along withthe availability of affordable and easy-to-use reporting andanalysis tools have played the most important role in evolutionof data warehouses.
Emergence of Standard BusinessApplicationsNew vendors provide to end-users with popular businessapplication suites. German software vendor SAP AG, Baan,PeopleSoft, and Oracle have come out with suites of softwarethat provide different strengths but have comparable function-ality. These application suites provide standard applications thatcan replace the existing custom developed legacy applications.This has led to the increase in popularity of such applications.Also, the data acquisition from these applications is muchsimpler than the mainframes.
End-user more Technology OrientedOne of the most important results of the massive investmentin technology and movement towards the powerful personalcomputer has been the evolution of a technology-orientedbusiness analyst. Even though the technology-oriented endusers are not always beneficial to all projects, this trend certainlyhas produced a crop of technology-leading business analyststhat are becoming essential to today’s business. These technol-ogy-oriented end users have frequently played an important rolein the development and deployment of data warehouses. Theyhave become the core users that are first to demonstrate theinitial benefits of data warehouses. These end users are alsocritical to the development of the data warehouse model: asthey become experts with the data warehousing system, theytrain other users.

3
DA
TA W
AR
EH
OU
SIN
G A
ND
DA
TA M
ININ
GDiscussions• Write short notes on:
• Legacy systems• Data warehouse• Standard Business Applications
• What is a Data warehouse? How does it differ from adatabase?
• Discuss various factors, which lead to Data Warehousing.• Briefly discuss the history behind Data warehouse.
References1. Adriaans, Pieter, Data mining, Delhi: Pearson Education
Asia, 1996.2. Anahory, Sam, Data warehousing in the real world: a practical
guide for building decision support systems, Delhi: PearsonEducation Asia, 1997.
3. Berry, Michael J.A. ; Linoff, Gordon, Mastering data mining: the art and science of customer relationship management,New York : John Wiley & Sons, 2000
4. Corey, Michael, Oracle8 data warehousing, New Delhi: TataMcGraw- Hill Publishing, 1998.
5. Elmasri, Ramez, Fundamentals of database systems, 3rd ed.Delhi: Pearson Education Asia, 2000.

4
DA
TA W
AR
EH
OU
SIN
G A
ND
DA
TA M
ININ
G
Notes

5
DA
TA W
AR
EH
OU
SIN
G A
ND
DA
TA M
ININ
G
Structure• Objective• Introduction• Data warehousing• Operational vs. Informational Systems• Characteristics of Data warehousing• Subject oriented• Integrated• Time variant• Non-volatiles
ObjectiveThe objective of this lesson is to explain you the significanceand difference between Operational systems and Informationalsystems. This lesson also includes various characteristics of aData warehouse.
IntroductionIn the previous section, we have discussed about the need ofdata warehousing and the factors that lead to it. In this section Iwill explore the technical concepts relating to data warehousingto you.A company can have data items that are unrelated to each other.Data warehousing is the process of collecting together such dataitems within a company and placing it in an integrated datastore. This integration is over time, geographies, and applicationplatforms. By adding access methods (on-line querying,reporting), this converts a ‘dead’ data store into a ‘dynamic’source of information. In other words, turning a liability intoan asset. Some of the definitions of data warehousing are:“A data warehouse is a single, complete, and consistent store ofdata obtained from a variety of sources and made available toend users in a way they can understand and use in a businesscontext.” (Devlin 1997)“Data warehousing is a process, not a product, for assemblingand managing data from various sources for the purpose ofgaining a single, detailed view of part or all of the business.”(Gardner 1998)A Data Warehouse is a capability that provides comprehensiveand high integrity data in forms suitable for decision support toend users and decision makers throughout the organization. Adata warehouse is managed data situated after and outside theoperational systems. A complete definition requires discussionof many key attributes of a data warehouse system DataWarehousing has been the result of the repeated attempts ofvarious researchers and organizations to provide their organiza-tions flexible, effective and efficient means of getting at thevaluable sets of data.
CHAPTER 1: DATA WAREHOUSING
LESSON 2MEANING AND CHARACTERISTICS OF DATA WAREHOUSING
Data warehousing evolved with the integration of a number ofdifferent technologies and experiences over the last two decades,which have led to the identification of key problems.
Data WarehousingBecause data warehouses have been developed in numerousorganizations to meet partic-ular needs, there is no single,canonical definition of the term data warehouse.1 Profes-sionalmagazine articles and books in the popular press have elabo-rated on the meaning in a variety of ways. Vendors havecapitalized on the popularity of the term to help mar-ket avariety of related products, and consultants have provided alarge variety of services, all under the data-warehousing banner.However, data warehouses are quite distinct from traditionaldatabases in their structure, functioning, performance, andpurpose.
Operational vs. Informational SystemsPerhaps the most important concepts that has come out of theData Warehouse movement is the recognition that there are twofundamentally different types of information systems in allorganizations: operational systems and informational systems.“Operational systems” are just what their name implies, they arethe systems that help us run the enterprise operate day-to-day.These are the backbone systems of any enterprise, our “orderentry’, “inventory”, “manufacturing”, “payroll” and “account-ing” systems. Because of their importance to the organization,operational systems were almost always the first parts of theenterprise to be computerized. Over the years, these operationalsystems have been extended and rewritten, enhanced andmaintained to the point that they are completely integrated intothe organization. Indeed, most large organizations around theworld today couldn’t operate without their operational systemsand that data that these systems maintain.On the other hand, there are other functions that go on withinthe enterprise that have to do with planning, forecasting andmanaging the organization. These functions are also critical tothe survival of the organization, especially in our current fastpaced world. Functions like “marketing planning”, “engineeringplanning” and “financial analysis” also require informationsystems to support them. But these functions are differentfrom operational ones, and the types of systems and informa-tion required are also different. The knowledge-based functionsare informational systems.“Informational systems” have to do with analyzing data andmaking decisions, often major decisions about how theenterprise will operate, now and in the future. And not only doinformational systems have a different focus from operationalones, they often have a different scope. Where operational dataneeds are normally focused upon a single area, informationaldata needs often span a number of different areas and needlarge amounts of related operational data.

6
DA
TA W
AR
EH
OU
SIN
G A
ND
DA
TA M
ININ
G
In the last few years, Data Warehousing has grown rapidly froma set of related ideas into architecture for data delivery forenterprise end user computing.They support high-performance demands on an organization’sdata and information. Several types of applications-OLAP, DSS,and data mining applications-are supported. OLAP (on-lineanalytical processing) is a term used to describe the analysis ofcomplex data from the data warehouse. In the hands of skilledknowledge workers. OLAP tools use distributed computingcapabilities for analyses that require more storage and processingpower than can be economically and efficiently located on anindividual desktop. DSS (Decision-Support Systems) alsoknown as EIS (Executive Information Systems, not to beconfused with enterprise integration systems) support anorganization’s leading deci-sion makers with higher-level datafor complex and important decisions. Data mining is used forknowledge discovery, the pro-cess of searching data forunanticipated new knowledge.
Traditional databases support On-Line Transaction Processing(OLTP), which includes insertions, updates, and deletions,while also supporting information query requirements.Traditional relational databases are optimized to process queriesthat may touch a small part of the database and transactionsthat deal with insertions or updates of a few tuples per relationto process. Thus, they cannot be optimized for OLAP, DSS, ordata mining. By contrast, data warehouses are designed preciselyto support efficient extraction, process-ing, and presentation foranalytic and decision-making purposes. In comparison to tradi-tional databases, data warehouses generally contain very largeamounts of data from multiple sources that may includedatabases from different data models and sometimes liesacquired from independent systems and platforms.
A database is a collection of related data and a database systemis a database and database software together. A data warehouseis also a collection of information as well as supporting system.However, a clear distinction exists, Traditional databases aretransactional: relational, object-oriented, network, or hierarchical.Data warehouses have the distinguishing characteristic that theyare mainly intended for decision-support applications. They areoptimized for data retrieval, not routine transaction processing.
Characteristics of Data WarehousingAs per W. H. Inmon, author of building the data warehouseand the guru who is ready widely considered to be the origina-tor of the data warehousing concept, there are generally fourcharacter that describe a data warehouse:W. H. Inmon characterized a data warehouse as “a subject-oriented, integrated, nonvola-tile, time-variant collection of datain support of management’s decisions.” Data ware-housesprovide access to data for complex analysis, knowledge discov-ery, and decision-making.
Subject OrientedData are organized according to subject instead of applicatione.g. an insurance company using a data warehouse wouldorganize their data by costumer, premium, and claim, insteadof by different products (auto. Life etc.). The data organized by
subject contain only the information necessary for decisionsupport processing.
IntegratedWhen data resides in money separate applications in theoperational environment, encoding of data is often inconsis-tent. For instance in one application, gender might be coded as“m” and “f ” in another by o and l. When data are moved fromthe operational environment in to the data warehouse, whendata are moved from the operational environment in to thedata warehouse, they assume a consistent coding conventione.g. gender data is transformed to “m” and “f ”.
Time variantThe data warehouse contains a place for storing data that are fiveto ten years old, or older, to be used for comparisons, trends,and forecasting. These data are not up dated.
Non-volatileData are not update or changed in any way once they enter thedata warehouse, but are only loaded and accessed.
Data warehouses have the following distinctive characteristics.• Multidimensional conceptual view.• Generic dimensionality.• Unlimited dimensions and aggregation levels.• Unrestricted cross-dimensional operations.• Dynamic sparse matrix handling.• Client-server architecture.• Multi-user support.• Accessibility.• Transparency.• Intuitive data manipulation.• Consistent reporting performance.• Flexible reportingBecause they encompass large volumes of data, data ware-houses are generally an order of magnitude (sometimes twoorders of magnitude) larger than the source databases. Thesheer volume of data (likely to be in terabytes) is an issue thathas been dealt with through enterprise-wide data warehouses,virtual data warehouses, and data marts:• Enterprise-wide data warehouses are huge projects requiring
massive investment of time and resources.• Virtual data warehouses provide views of operational
databases that are materialized for efficient access.• Data marts generally are targeted to a subset of the
organization, such as a dependent, and are more tightlyfocused.
To summarize the above, here are some important points toremember about various characteristics of a Data warehouse:• Subject-oriented
• Organized around major subjects, such as customer,product, sales.

7
DA
TA W
AR
EH
OU
SIN
G A
ND
DA
TA M
ININ
G• Focusing on the modeling and analysis of data for
decision making, not on daily operations or transactionprocessing.
• Provide a simple and concise view around particularsubject by excluding data that are not useful in thedecision support process.
• Integrated• Constructed by integrating multiple, heterogeneous
data sources as relational databases, flat files, on-linetransaction records.
• Providing data cleaning and data integrationtechniques.
• Time variant• The time horizon for the data warehouse is
significantly longer than that of operational systems.• Every key structure in the data warehouse contains an
element of time (explicitly or implicitly).• Non-volatile
• A physically separate store of data transformed fromthe operational environment.
• Does not require transaction processing, recovery, andconcurrency control mechanisms.
• Requires only two operations in data accessing: initialloading of data and access of data (no data updates).
Discussions• Write short notes on:
• Metadata• Operational systems• OLAP• DSS• Informational Systems
• What is the need of a Data warehouse in anyorganization?
• Discuss various characteristics of a Data warehouse.• Explain the difference between non-volatile and
Subject-oriented data warehouse.
References1. Adriaans, Pieter, Data mining, Delhi: Pearson Education
Asia, 1996.2. Anahory, Sam, Data warehousing in the real world: a practical
guide for building decision support systems, Delhi: PearsonEducation Asia, 1997.
3. Berry, Michael J.A. ; Linoff, Gordon, Mastering data mining: the art and science of customer relationship management, NewYork : John Wiley & Sons, 2000
4. Corey, Michael, Oracle8 data warehousing, New Delhi: TataMcGraw- Hill Publishing, 1998.
5. Elmasri, Ramez, Fundamentals of database systems, 3rd ed.Delhi: Pearson Education Asia, 2000.

8
DA
TA W
AR
EH
OU
SIN
G A
ND
DA
TA M
ININ
G

9
DA
TA W
AR
EH
OU
SIN
G A
ND
DA
TA M
ININ
G
Structure• Objective• Introduction• Data warehousing and OLTP systems• Similarities and Differences in OLTP and Data Warehousing
Processes in Data Warehousing OLTP• What is OLAP?• Who uses OLAP and WHY?• Multi-Dimensional Views• Benefits of OLAP
ObjectiveThe main objective of this lesson is to introduce you withOnline Transaction Processing. You will learn about theimportance and advantages of an OLTP system.
IntroductionRelational databases are used in the areas of operations andcontrol with emphasis on transaction processing. Recentlyrelational databases are used for building data warehouses,which stores tactical information (<1year into the future) thatanswers who and what questions. In contrast OLAP uses MDviews of aggregate data to provide access strategic information.OLAP enables users to gain insight to a wide variety of possibleviews of information and transforms raw data to reflect theenterprise as understood by the user e.g., Analysts, managersand executives.
Data Warehousing and OLTP SystemsA data base which in built for on line transaction processing,OLTP, is generally regarded as inappropriate for warehousing asthey have been designed with a different set of need in mindi.e., maximizing transaction capacity and typically havinghundreds of table in order not to look out user etc. Datawarehouse are interested in query processing as opposed totransaction processing.OLTP systems cannot be receptacle stored of repositories offacts and historical data for business analysis. They cannot bequickly answer adhoc queries is rapid retrieval is almost impos-sible. The data is inconsistent and changing, duplicate entriesexist, entries can be missing and there is an absence of historicaldata, which is necessary to analyses trends. Basically OLTP offerslarge amounts of raw data, which is not easily understood. Thedata warehouse offers the potential to retrieve and analysisinformation quickly and easily. Data warehouse do havesimilarities with OLTP as shown in the table below.
LESSON 3ONLINE TRANSACTION PROCESSING
Similarities and Differences in OLTP and DataWarehousing
OLTP Data Warehouse
Purpose Run day-to-day operation
Information retrieval and analysis
Structure RDBMS RDBMS
Data Model Normalized Multi-dimensional
Access SQL SQL plus data analysis extensions
Type of Data
Data that run the business
Data that analyses the business
Condition of Data
Changing incomplete Historical descriptive
The data warehouse server a different purpose from that ofOLTP systems by allowing business analysis queries to beanswered as opposed to “simple aggregation” such as ‘what isthe current account balance for this customer?’ Typical datawarehouse queries include such things as ‘which product linesells best in middle America and how dose this correlate todemographic data?
Processes in Data Warehousing OLTPThe first step in data warehousing is to “insulate” your currentoperational information, i.e. to preserve the security andintegrity of mission- critical OLTP applications, while givingyou access to the broadest possible base of data. The resultingdatabase or data warehouse may consume hundred ofgigabytes-or even terabytes of disk space, what is required thanare capable efficient techniques for storing and retrieving massiveamounts of information. Increasingly, large organizations havefound that only parallel processing systems offer sufficientbandwidth.The data warehouse thus retrieves data from a varsity ofheterogeneous operational database. The data is than trans-formed and delivered to the data warehouse/ store based in aselected modal (or mapping definition). The data transforma-tion and movement processes are completed whenever anupdate to the warehouse data is required so there should somefrom of automation to manage and carry out these functions.The information that describes the modal metadata is themeans by which the end user finds and understands the data inthe warehouse and is an important part of the warehouse. Themetadata should at the very least contain:• Structure of the data;• Algorithm used for summarization;

10
DA
TA W
AR
EH
OU
SIN
G A
ND
DA
TA M
ININ
G
• Mapping from the operational environment to the datawarehouse.
Data cleansing is an important viewpoint of creating an efficientdata warehouse of creating an efficient data warehouse in that isthe removal of creation aspects Operational data such as lowlevel transaction information which sloe down the query times.The cleansing stage has to be as dynamic as possible to accom-modate all types of queries even those, which may requirelow-level information. Data should be extracted from produc-tion sources at regular interval and pooled centrally but thecleansing process has to remove duplication and reconciledifferences between various styles of data collection.Once the data has been cleaned it is than transfer to the datawarehouse, which typically is a large database on a high perfor-mance box, either SMP Symmetric Multi- Processing or MPP,Massively parallel Processing Number crunching power isanother importance aspect of data warehousing because of thecomplexity involved in processing adhoc queries and because ofthe vast quantities of data that the organization want to use inthe warehouse. A data warehouse can be used in different ways,for example it can be a central store against which the queries arerun of it can be used like a data mart, data mart which are smallwarehouses can be established to provide subsets of the mainstore and summarized information depending on the require-ments of a specific group/ department. The central storesapproach generally uses every simple data structures with verylittle assumptions about the relationships between data whereas marts often uses multidimensional data base which canspeed up query processing as they can have data structures whichreflect the most likely questions.Many vendors have products that provide on the more of theabove data warehouse functions. However, it can take asignificant amount of work and specialized programming toprovide the interoperability needed between products form.Multiple vendors to enable them to perform the required datawarehouse processes a typical implementation usually involves amixture of procedure forma verity of suppliers.Another approach to data warehousing is the Parsaye Sandwichparadigm put forward by Dr. Kamran Parsaye , CED ofinformation discovery, Hermosa beach. This paradigm orphilosophy encourages acceptance of the probability that thefirst iteration of data warehousing effort will require consider-able revision. The Sandwich paradigm advocates the followingapproach.• Pre-mine the data to determine what formats and data are
needed to support a data- mining application;• Build a prototype mini- data warehouse i.e. the, the meat of
sandwich most of features envisaged for the and product;• Revise the strategies as necessary;• Build the final warehouse.
What is OLAP?• Relational databases are used in the areas of operations and
control with emphasis on transaction processing.• Recently relational databases are used for building data
warehouses, which stores tactical information (< 1 year intothe future) that answers who and what questions.
• In contrast OLAP uses Multi-Dimensional (MD) views ofaggregate data to provide access strategic information.
• OLAP enables users to gain insight to a wide variety ofpossible views of information and transforms raw data toreflect the enterprise as understood by the user e.g. Analysts,managers and executives.
• In addition to answering who and what questions OLAPscan answer “what if “ and “why”.
• Thus OLAP enables strategic decision-making.• OLAP calculations are more complex than simply summing
data.• However, OLAP and Data Warehouses are complementary• The data warehouse stores and manages data while the
OLAP transforms this data into strategic information.
Who uses OLAP and WHY?• OLAP applications are used by a variety of the functions of
an organisation.• Finance and accounting:
BudgetingActivity-based costingFinancial performance analysisAnd financial modelling
• Sales and MarketingSales analysis and forecastingMarket research analysisPromotion analysisCustomer analysisMarket and customer segmentation
• ProductionProduction planningDefect analysis
Thus, OLAP must provide managers with the information theyneed for effective decision-making. The KPI (key performanceindicator) of an OLAP application is to provide just-in-time(JIT) information for effective decision-making. JIT informa-tion reflects complex data relationships and is calculated on thefly. Such an approach is only practical if the response times arealways short The data model must be flexible and respond tochanging business requirements as needed for effective decisionmaking.In order to achieve this in widely divergent functional areasOLAP applications all require:
MD views of dataComplex calculation capabilitiesTime intelligence
Multi-Dimensional Views• MD views inherently represent actual business models,
which normally have more than three dimensions e.g., Salesdata is looked at by product, geography, channel and time.
11
DA
TA W
AR
EH
OU
SIN
G A
ND
DA
TA M
ININ
G• MD views provide the foundation for analytical processing
through flexible access to information.• MD views must be able to analyse data across any dimension
at any level of aggregation with equal functionality and easeand insulate users from the complex query syntax
• What ever the query is they must have consistent responsetimes.
• Users queries should not be inhibited by the complex toform a query or receive an answer to a query.
• The benchmark for OLAP performance investigates a server’sability to provide views based on queries of varyingcomplexity and scope.Basic aggregation on some dimensionsMore complex calculations are performed on otherdimensions• Ratios and averages• Variances on sceneries• A complex model to compute forecasts
• Consistently quick response times to these queries areimperative to establish a server’s ability to provide MD viewsof information.
Benefits of OLAP• Increase the productivity of manager’s developers and whole
organisations.• Users of OLAP systems become more self-sufficient eg
managers no longer depend on IT to make schema changes.• It allows managers to model problems that would be
impossible with less flexible systems• Users have more control and timely access to relevant
strategic information which results in better decisionmaking.(timeliness, accuracy and relevance)
• IT developers also benefit form using OLAP specificsoftware as they can deliver applications to users faster.
• Thus, reducing the application backlog and ensure a betterservice.
• OLAP further reduces the backlog by making its users self-sufficient to build their own models but yet notrelinquishing control over the integrity of the data
• OLAP software reduces the query load and network traffic onOLTP systems and data warehouses.
• Thus, OLAP enables organisations as a whole to respondmore quickly to market demands, which often results inincreased revenue and profitability. The goal of everyorganisation.
Discussions• Write short notes on:
• Multi-Dimensional Views• Operational Systems
• What is the significance of an OLTP System?• Discuss OLTP related processes used in a Data warehouse.• Explain MD views with an example.
• Identify various benefits of OLTP.• “OLAP enables organisations as a whole to respond more
quickly to market demands, which often results in increasedrevenue and profitability”. Comment.
• Who are the primary users of Online Transaction ProcessingSystem?
• “The KPI (key performance indicator) of an OLAPapplication is to provide just-in-time (JIT) information foreffective decision-making”. Explain.
References1. Anahory, Sam, Data warehousing in the real world: a practical
guide for building decision support systems, Delhi: PearsonEducation Asia, 1997.
2. Adriaans, Pieter, Data mining, Delhi: Pearson EducationAsia, 1996.
3. Corey, Michael, Oracle8 data warehousing, New Delhi: TataMcGraw- Hill Publishing, 1998.
4. Elmasri, Ramez, Fundamentals of database systems, 3rd ed.Delhi: Pearson Education Asia, 2000.

12
DA
TA W
AR
EH
OU
SIN
G A
ND
DA
TA M
ININ
G

13
DA
TA W
AR
EH
OU
SIN
G A
ND
DA
TA M
ININ
G
Structure• Introduction• Objective• The Date warehouse Model• Data Modeling for Data Warehouses• Multidimensional models• Roll-up display• A drill-down display• Multidimensional Schemas• Star Schema• Snowflake Schema
ObjectiveThe main objective of this lesson is to make you understand adata warehouse model. It also explains various types ofmultidimensional models and Schemas.
IntroductionData warehousing is the process of extracting and transformingoperational data into informational data and loading it into acentral data store or warehouse. Once the data is loaded it isaccessible via desktop query and analysis tools by the decisionmakers.
The Data Warehouse ModelThe data warehouse model is illustrated in the followingdiagram.
Figure 1: A data warehouse modelThe data within the actual warehouse itself has a distinctstructure with the emphasis on different levels of summariza-tion as shown in the figure below.
LESSON 4DATA WAREHOUSING MODELS
Figure 2: The structure of data inside the data warehouseThe current detail data is central in importance as it:• Reflects the most recent happenings, which are usually the
most interesting;• It is voluminous as it is stored at the lowest level of
granularity;• it is always (almost) stored on disk storage which is fast to
access but expensive and complex to manage.Older detail data is stored on some form of mass storage, it isinfrequently accessed and stored at a level detail consistent withcurrent detailed data.Lightly summarized data is data distilled from the low level ofdetail found at the current detailed level and generally is storedon disk storage. When building the data warehouse have toconsider what unit of time is summarization done over andalso the contents or what attributes the summarized data willcontain.Highly summarized data is compact and easily accessible and caneven be found outside the warehouse.Metadata is the final component of the data warehouse and isreally of a different dimension in that it is not the same as datadrawn from the operational environment but is used as:• a directory to help the DSS analyst locate the contents of the
data warehouse,• a guide to the mapping of data as the data is transformed
from the operational environment to the data warehouseenvironment,
• a guide to the algorithms used for summarization betweenthe current detailed data and the lightly summarized data andthe lightly summarized data and the highly summarizeddata, etc.

14
DA
TA W
AR
EH
OU
SIN
G A
ND
DA
TA M
ININ
G
The basic structure has been described but Bill Inmon fills inthe details to make the example come alive as shown in thefollowing diagram.
Figure 3: An example of levels of summarization of datainside the data warehouse
The diagram assumes the year is 1993 hence the current detaildata is 1992-93. Generally sales data doesn’t reach the currentlevel of detail for 24 hours as it waits until it is no longeravailable to the operational system i.e. it takes 24 hours for it toget to the data warehouse. Sales details are summarized weeklyby subproduct and region to produce the lightly summarizeddetail. Weekly sales are then summarized again to produce thehighly summarized data.
Data Modeling for Data WarehousesMultidimensional models take advantage of inherentrelationships in data to populate data in multidimensionalmatrices called data cubes. (These may be called hypercube ifthey have more than three dimensions.) For data that lendthemselves to dimensional Formatting, query performance inmultidimensional matrices can be much better than in therelational data model. Three examples of dimensions in acorporate data warehouse would be the corporation’s fiscalperiods, products, and regions.A standard spreadsheet is a two-dimensional matrix. Oneexample would be a spreadsheet of regional sales by productfor a particular time period. Products could be shown as rows,with sales revenues for each region comprising the columns.Adding a time dimension, such as an organiza-tion’s fiscalquarters, would produce a three-dimensional matrix, whichcould be repre-sented using a data cube.
In the figure, there is a three-dimensional data cube thatorganizes product sales data by fiscal quarters and sales regions.Each cell could contain data for a specific prod-uct, specific fiscalquarter, and specific region. By including additional dimensions,a data hypercube could be produced, although more than threedimensions cannot be easily visualized at all or presentedgraphically. The data can be queried directly in any combinationof dimensions, by passing complex database queries. Toolsexist for viewing data Data Modeling for Data Warehouses
According to the user’s choice of dimensions. Changing fromone dimensional hierarchy -(orientation) to another is easilyaccomplished in a data cube by a technique called pivoting (alsocalled rotation). In this technique, the data cube can be thoughtof as rotating to show a different orientation of the axes. Forexample, you might pivot the data cube to show regional salesrevenues as rows, the fiscal quarter revenue totals as columns,and company’s products in the third dimension. Hence, thistechnique is equivalent to having a regional sales table for eachproduct separately, where each table shows quarterly sales forthat product region by region.Multidimensional models lend themselves readily to hierarchicalviews in what is known as roll-up display and drill-downdisplay.• Roll-up display moves up the hierar-chy, grouping into
larger units along a dimension (e.g., summing weekly data byquar-ter, or by year). One of the above figures shows a roll-up display that moves from individual products to a coarsergrain of product categories.
• A drill-down display pro-vides the opposite capability,furnishing a finer-grained view, perhaps disaggregatingcountry sales by region and then regional sales by sub regionand also breaking up prod-ucts by styles.
The multidimensional storage model involves two types oftables: dimension tables and fact tables. A dimension tableconsists of tuples of attributes of the dimension. A fact tablecan be thought of as having tuples, one per a recorded fact. Thisfact contains some measured or observed variable(s) andidentifies it (them) with pointers to dimension tables. The fact

15
DA
TA W
AR
EH
OU
SIN
G A
ND
DA
TA M
ININ
Gtable contains the data and the dimensions identify each tuple inthat data. An example of a fact table that can be viewed fromthe perspec-tive of multiple dimensional tables.
Two common multidimensional schemas are the star schemaand the snowflake schema.The star schema consists of a fact table with a single table foreach dimension.The snowflake schema is a variation on the star schema inwhich the dimensional tables from a star schema are organizedinto a hierarchy by normalizing them. Some installations arenormalizing data warehouses up to the third normal form sothat they can access the data warehouse to the finest level ofdetail. A fact con-stellation is a set of fact tables that share somedimension tables. Following figure shows a fact constellationwith two fact tables, business results arid business forecast.These share the dimension table called product. Fact constella-tions limit the possible queries for the ware-house.Data warehouse storage also utilizes indexing techniques tosupport high perfor-mance access. A technique called bitmapindexing constructs a bit vector for each value in a domain(column) being indexed.

16
DA
TA W
AR
EH
OU
SIN
G A
ND
DA
TA M
ININ
G
It works very well for domains of low-cardinality. There is a 1bit placed in the jth position in the vector if the jth rowcontains the value being indexed. For example, imagine aninventory of 100,000 cars with a bitmap index on car size. Ifthere are four-car sizes--economy, compact, midsize, and fullsize-there will be four bit vectors, each containing 100,000 bits(12.5 K) for a total index size of 50K. Bitmap indexing canprovide consider-able input/output and storage space advan-tages in low-cardinality domains. With bit vec-tors a bitmapindex can provide dramatic improvements in comparison,aggregation, and join performance. In a star schema, dimen-sional data can be indexed to tuples in the fact table by joinindexing. Join indexes are traditional indexes to maintainrelationships between primary key and foreign key values. Theyrelate the values of a dimension of a star schema to rows in thefact table. For example, consider a sales fact table that has cityand fiscal quarter as dimensions. If there is a join index on city,for each city the join index maintains the tuple IDs of tuplescontaining that city. Join indexes may involve multiple dimen-sions.Data warehouse storage can facilitate access to summary data bytaking further advantage of the nonvolatility of data ware-houses and a degree of predictability of the analyses that will beperformed using them. Two approaches have been used.(1)smaller tables including summary data such as quarterly sales orrevenue by product line, and (2) encoding of level (e.g., weekly,quarterly, annual) into existing tables. By comparison, theoverhead of creating and maintaining such aggregations wouldlikely be excessive in a volatile, transaction-oriented database.
Discussions
• What are the various kinds of models used in Datawarehousing?
• Discuss the following:• Roll-up display• Drill down operation• Star schema• Snowflake schema
• Why is the star schema called by that name?• State an advantage of the multidimensional database
structure over the relational database structure for datawarehousing applications.
• What is one reason you might choose a relational structureover a multidimensional structure for a data warehousedatabase? .
• Clearly contrast the difference between a fact table and adimension table.
Exercises1. Your college or university is designing a data warehouse to
enable deans, department chairs, and the registrar’s office tooptimize course offerings, in terms of which courses areoffered, in how many sections, and at what times. The datawarehouse planners hope they will be able to do this betterafter examining historical demand for courses andextrapolating any trends that emerge.
a. Give three dimension data elements and two fact dataelements that could be in the database for this datawarehouse. Draw a data cube, for this database.
b. State two ways in which each of the two fact data elementscould be of low quality in some respect.
2. You have decided to prepare a budget for the next 12months based on your actual expenses for the past 12. Youneed to get your expense information into what is in effect adata warehouse, which you plan to put into a spreadsheet foreasy sorting and analysis.
a. What are your information sources for this data warehouse?b. Describe how you would carry out each of the five steps of
data preparation for a data warehouse database, fromextraction through summarization. If a particular step doesnot apply, say so and justify your statement.
References1. Adriaans, Pieter, Data mining, Delhi: Pearson Education
Asia, 1996.2. Anahory, Sam, Data warehousing in the real world: a practical
guide for building decision support systems, Delhi: PearsonEducation Asia, 1997.
3. Berry, Michael J.A. ; Linoff, Gordon, Mastering data mining: the art and science of customer relationship management, NewYork : John Wiley & Sons, 2000
4. Corey, Michael, Oracle8 data warehousing, New Delhi: TataMcGraw- Hill Publishing, 1998.
5. Elmasri, Ramez, Fundamentals of database systems, 3rd ed.Delhi: Pearson Education Asia, 2000.

17
DA
TA W
AR
EH
OU
SIN
G A
ND
DA
TA M
ININ
G

18
DA
TA W
AR
EH
OU
SIN
G A
ND
DA
TA M
ININ
G
Notes

19
DA
TA W
AR
EH
OU
SIN
G A
ND
DA
TA M
ININ
G
Structure• Objective• Introduction• Structure of a Data warehouse• Data Warehouse Physical Architectures• Generic Two-Level• Expanded Three-Level• Enterprise data warehouse (EDW)• Data marts• Principles of a Data warehousing
ObjectiveThe objective of this lesson is to let you know the basicstructure of a Data warehouse. You will also learn about Datawarehouse physical architecture and various principles of a Datawarehousing.
IntroductionLet me start the lesson with an example, which illustrates theimportance and need of a data warehouse. Until several yearsago Coca Cola had no idea how many bottles of Coke itproduced each day because production data were stored on 24different computer systems. Then, it began a technique calledData warehousing. One airline spent and wasted over $100million each year on inefficient mass media advertising cam-paigns to reach frequent flyers…then it began data warehousing.Several years ago, the rail industry needed 8 working days todeliver a freight quote to a customer. The trucking industry, bycontrast, could deliver a freight quote to a customer on thephone instantly, because unlike the rail industry, truckers wereusing…data warehousing.A data warehouse is a data base that collects current informa-tion, transforms it to ways it can be used by the warehouseowner, transforms that information for clients, and offersportals of access to members of your firm to help them makedecisions and future plans.Data warehousing is the technology trend most often associatedwith enterprise computing today. The term conjures up imagesof vast data banks fed from systems all over the globe, withlegions of corporate analysts mining them for golden nuggetsof information that will make their companies more profitable.All of the developments in database technology over the past20 years have culminated in the data warehouse. Entity-relationship modeling, heuristic searches, mass data storage,neural networks, multiprocessing, and natural-languageinterfaces have all found their niches in the data warehouse. Butaside from being a database engineer’s dream, what practicalbenefits does a data warehouse offer the enterprise?When asked, corporate executives often say that having a datawarehouse gives them a competitive advantage, because it gives
LESSON 5ARCHITECTURE AND PRINCIPLES OF DATA WAREHOUSING
them a better understanding of their data and a better under-standing of their business in relation to their competitors, andit lets them provide better customer service.So, what exactly is a data warehouse? Should your companyhave one, and if so, what should it look like?
Structure of a Data WarehouseEssentially, a data warehouse provides historical data fordecision-support applications. Such applications includereporting, online analytical processing (OLAP), executiveinformation systems (EIS), and data mining.According to W. H. Inmon, the man who originally came upwith the term, a data warehouse is a centralized, integratedrepository of information. Here, integrated means cleaned up,merged, and redesigned. This may be more or less complicateddepending on how many systems feed into a warehouse andhow widely they differ in handling similar information.But most companies already have repositories of informationin their production systems and many of them are centralized.Aren’t these data warehouses? Not really.Data warehouses differ from production databases, or onlinetransaction-processing (OLTP) systems, in their purpose anddesign. An OLTP system is designed and optimized for dataentry and updates, whereas a data warehouse is optimized fordata retrieval and reporting, and it is usually a read-only system.An OLTP system contains data needed for running the day-to-day operations of a business but a data warehouse containsdata used for analyzing the business. The data in an OLPTsystem is current and highly volatile, which data elements thatmay be incomplete or unknown at the time of entry. Awarehouse contains historical, nonvolatile data that has beenadjusted for transactions errors. Finally, since their purposes areso different, OLPT systems and data warehouses use differentdata-modeling strategies. Redundancy is almost nonexistent inOLTP systems, since redundant data complicates updates. SoOLPT systems are highly normalized and are usually based on arelational model. But redundancy is desirable in a data ware-house, since it simplifies user access and enhances performanceby minimizing the number of tables that have to be joined.Some data warehouses don’t use a relational model at all,preferring a multidimensional design instead.To discuss data warehouses and distinguish them fromtransactional databases calls for an appropriate data model. Themultidimensional data model is a good fit for OLAP anddecision-support technologies. In contrast to multi-databases,which provide access to disjoint and usually heterogeneousdatabases, a data warehouse is frequently a store of integrateddata from multiple sources, processed for storage in a multidi-mensional model. Unlike most transactional databases, datawarehouses typically support time-series and trend analysis,both of which requires more historical data than are generally

20
DA
TA W
AR
EH
OU
SIN
G A
ND
DA
TA M
ININ
G
maintained in transactional databases. Compared with transac-tional databases, data warehouses are nonvolatile. That meansthat information in the data warehouse changes far less oftenand may be regarded as non-real-time with periodic updating.In transactional systems, transactions are the unit and are theagent of change a database; by contrast, data warehouseinformation is much more coarse grained and is refreshedaccording to a careful choice of refresh policy, usually incremen-tal. Warehouse updates are handled by the warehouse’sacquisition component that provides all required preprocessing.We can also describe data warehousing more generally as “acollection of decision support technologies, aimed at enablingthe knowledge worker (executive, manager, ana-lyst) to make,better and faster decisions.” The following Figure gives anoverview of the conceptual structure of a data warehouse. Itshows the entire data warehousing process. This processincludes possible cleaning and reformatting of data before it’swarehousing. At the end of the process, OLAP, data mining,and DSS may generate new relevant information such as rules;this information is shown in the figure going back into thewarehouse figure also shows that data sources may include files.
Data Warehousing, OnLine Analytical Processing (OLAP) andDecision Support Systems - apart from being buzz words oftoday IT arena - are the expected result of IT systems andcurrent needs. For decades, Information Management Systemshave focused exclusively in the gathering and recording intoDatabase Management Systems data that corresponded toeveryday simple transactions, from which the name OnLineTransaction Processing (OLTP) comes from.Managers and analysts now need to go steps further from thesimple data storing phase and exploit IT systems by posingcomplex queries and requesting analysis results and decisionsthat are based on the stored data. Here is where OLAP and DataWarehousing is introduced, bringing into business the necessarysystem architecture, principles, methodological approach and -finally - tools to assist in the presentation of functionalDecision Support Systems.I.M.F. has been working closely with the academic community -which only recently followed up the progress of the commercialarena that was boosting and pioneering in the area for the pastdecade - and adopted the architecture and methodologypresented in the following picture. This is the result of theESPRIT funded Basic Research project, “Foundations of DataWarehouse Quality - DWQ”.

21
DA
TA W
AR
EH
OU
SIN
G A
ND
DA
TA M
ININ
G
Being basically dependent on architecture in concept, a DataWarehouse - or an OLAP system - is designed by applying datawarehousing concepts on traditional database systems andusing appropriate design tools. Data Warehouses and OLAPapplications designed and implemented comply with theadopted methodology by IMF.The final deployment takes place through the use of specializeddata warehouse and OLAP systems, namely MicroStrategy’sDSS Series. MicroStrategy Inc. is one of the most prominentand accepted international players on data warehousing systemsand tools, offering solutions for every single layer of the DWarchitecture hierarchy.
Data Warehouse Physical Architectures• Generic Two-Level• Expanded Three-Level• Enterprise data warehouse (EDW) - single source of data for
decision making• Data marts - limited scope; data selected from EDW
Fig : Generic Two-Level Physical Architecture

22
DA
T
A W
A
RE
HO
US
ING
AN
D D
A T
A M
ININ
G
Fig : Expanded Three-Level Physical ArchitectureAssociated with the three-level physical architecture• Operational Data
Stored in the various operational systems throughoutthe organization
• Reconciled DataThe data stored in the enterprise data warehouseGenerally not intended for direct access by end users
• Derived DataThe data stored in the data martsSelected, formatted, and aggregated for end userdecision-support applications
Fig : Three-Layer Data Architecture
Principles of a Data Warehousing• Load Performance
Data warehouses require increase loading of new data on aperiodic basic within narrow time windows; performance onthe load process should be measured in hundreds ofmillions of rows and gigabytes per hour and must notartificially constrain the volume of data business.
• Load ProcessingMany steps must be taken to load new or update data intothe data warehouse including data conversion, filtering,reformatting, indexing and metadata update.
• Data Quality ManagementFact-based management demands the highest data quality.The warehouse must ensure local consistency, globalconsistency, and referential integrity despite “dirty” sourcesand massive database size.
• Query PerformanceFact-based management must not be slowed by theperformance of the data warehouse RDBMS; large, complexqueries must be complete in seconds not days.
• Terabyte ScalabilityData warehouse sizes are growing at astonishing rates. Todaythese range from a few to hundreds of gigabytes andterabyte-sized data warehouses.
Discussions• Write short notes on:
• Data Quality Management• OLAP• DSS• Data marts• Operational data
• Discuss Three-Layer Data Architecture with the help of adiagram.
• What are the various Principles of Data warehouse?• What is the importance of a data warehouse in any
organization? Where it is required?
Self TestAs set of multiple choices is given with every question, Choosethe correct answer for the Following questions.1. Data warehouse cannot deal with
a. Data analysisb. Operational activitiesc. Information extractiond. None of these
2. A data warehouse system requiresa. Only current datab. Data for a large periodc. Only data projectionsd. None of these

23
DA
TA W
AR
EH
OU
SIN
G A
ND
DA
TA M
ININ
GReferences1. Adriaans, Pieter, Data mining, Delhi: Pearson Education
Asia, 1996.2. Anahory, Sam, Data warehousing in the real world: a practical
guide for building decision support systems, Delhi: PearsonEducation Asia, 1997.
3. Corey, Michael, Oracle8 data warehousing, New Delhi: TataMcGraw- Hill Publishing, 1998.
4. Elmasri, Ramez, Fundamentals of database systems, 3rd ed.Delhi: Pearson Education Asia, 2000.

24
DA
TA W
AR
EH
OU
SIN
G A
ND
DA
TA M
ININ
G
Notes

25
DA
TA W
AR
EH
OU
SIN
G A
ND
DA
TA M
ININ
G
Structure• Objective• Introduction• Operational Systems• Warehousing” data outside the operational systems• Integrating data from more than one operational system• Differences between transaction and analysis processes• Data is mostly non-volatile• Data saved for longer periods than in transaction systems• Logical transformation of operational data• Structured extensible data model• Data warehouse model aligns with the business structure• Transformation of the operational state information
ObjectiveThe aim of this lesson is to explain you the need and impor-tance of an Operational Systems in a Data warehouse.
IntroductionData warehouse, a collection of data designed to supportmanagement decision-making. Data warehouses contain a widevariety of data that present a coherent picture of businessconditions at a single point in time.Development of a data warehouse includes development ofsystems to extract data from operating systems plus installationof a warehouse database system that provides managers flexibleaccess to the data.The term data warehousing generally refers to the combinationof many different databases across an entire enterprise.
Operational SystemsUp to now, the early database system of the primary purposewas to, meet the needs of operational systems, which aretypically transactional in nature. Classic examples of operationalsystems include• General Ledgers• Accounts Payable• Financial Management• Order Processing• Order Entry• InventoryOperational systems by nature are primarily concerned with thehandling of a single transaction. Look at a banking system,when you, the customer, make a deposit to your checkingaccount, the banking operational system is responsible forrecording the transaction to ensure the corresponding debitappears in your account record.
CHAPTER 2BUILDING A DATA
WAREHOUSE PROJECTLESSON 6
DATA WAREHOUSING ANDOPERATIONAL SYSTEMS
A typical operational system deals with one order, one account,one inventory item. An operational system typically dea1s withpredefined events and, due to the nature of these events,requires fast access. Each transaction usually deals with smallamounts of data.Most of the time, the business needs of an operational systemdo not change much. The application that records the transac-tion, as well as the application that controls access to theinformation, that is, there porting side of the- bankingbusiness does not change much over time. In this type ofsystem, the information required, when a customer initiates atransaction must be current. Before a bank will allow a with-drawal, it must first be certain of your current balance.
“Warehousing” Data outside theOperational SystemsThe primary concept of data warehousing is that the data storedfor business analysis can most effectively be accessed byseparating it from the data in the operational systems. Many ofthe reasons for this separation have evolved over the years. Inthe past, legacy systems archived data onto tapes as it becameinactive and many analysis reports ran from these tapes ormirror data sources to minimize the performance impact on theoperational systems.These reasons to separate the operational data from analysisdata have not significantly changed with the evolution of thedata warehousing systems, except that now they are consideredmore formally during the data warehouse building process.Advances in technology and changes in the nature of businesshave made many of the business analysis processes much morecomplex and sophisticated. In addition to producing standardreports, today’s data warehousing systems support verysophisticated online analysis including multi-dimensionalanalysis.
Integrating Data from more than oneOperational SystemData warehousing systems are most successful when data can becombined from more than one operational system. When thedata needs to be brought together from more than one sourceapplication, it is natural that this integration be done at a placeindependent of the source applications. Before the evolution ofstructured data warehouses, analysts in many instances wouldcombine data extracted from more than one operational systeminto a single spreadsheet or a database. The data warehousemay very effectively combine data from multiple sourceapplications such as sales, marketing, finance, and production.Many large data warehouse architectures allow for the sourceapplications to be integrated into the data warehouse incremen-tally.The primary reason for combining data from multiple sourceapplications is the ability to cross-reference data from these

26
DA
TA W
AR
EH
OU
SIN
G A
ND
DA
TA M
ININ
G
applications. Nearly all data in a typical data warehouse is builtaround the time dimension. Time is the primary filteringcriterion for a very large percentage of all activity against the datawarehouse. An analyst may generate queries for a given week,month, quarter, or a year. Another popular query in many datawarehousing applications is the review of year-on-year activity.For example, one may compare sales for the first quarter of thisyear with the sales for first quarter of the prior years. The timedimension in the data warehouse also serves as a fundamentalcross-referencing attribute. For example, an analyst may attemptto access the impact of a new marketing campaign run duringselected months by reviewing the sales during the same periods.The ability to establish and understand the correlation betweenactivities of different organizational groups within a company isoften cited as the single biggest advanced feature of the datawarehousing systems.The data warehouse system can serve not only as an effectiveplatform to merge data from multiple current applications; itcan also integrate multiple versions of the same application.For example, an organization may have migrated to a newstandard business application that replaces an old mainframe-based, custom-developed legacy application. The datawarehouse system can serve as a very powerful and muchneeded platform to combine the data from the old and the newapplications. Designed properly, the data warehouse can allowfor year-on-year analysis even though the base operationalapplication has changed.
Differences between Transaction and AnalysisProcessesThe most important reason for separating data for businessanalysis from the operational data has always been the potentialperformance degradation on the operational system that canresult from the analysis processes. High performance and quickresponse time is almost universally critical for operationalsystems. The loss of efficiency and the costs incurred withslower responses on the predefined transactions are usually easyto calculate and measure. For example, a loss of five seconds ofprocessing time is perhaps negligible in and of itself; but itcompounds out to considerably more time and high costs onceall the other operations it impacts are brought into the picture.On the other hand, business analysis processes in a datawarehouse are difficult to predefine and they rarely need to haverigid response time requirements.Operational systems are designed for acceptable performance forpre-defined transactions. For an operational system, it istypically possible to identify the mix of business transactiontypes in a given time frame including the peak loads. It alsorelatively easy to specify the maximum acceptable response timegiven a specific load on the system. The cost of a long responsetime can then be computed by considering factors such as thecost of operators, telecommunication costs, and the cost of anylost business. For example, an order processing system mightspecify the number of active order takers and the averagenumber of orders for each operational hour. Even the queryand reporting transactions against the operational system aremost likely to be predefined with predictable volume.
Even though many of the queries and reports that are runagainst a data warehouse are predefined, it is nearly impossibleto accurately predict the activity against a data warehouse. Theprocess of data exploration in a data warehouse takes a businessanalyst through previously undefined paths. It is also commonto have runaway queries in a data warehouse that are triggeredby unexpected results or by users’ lack of understanding of thedata model. Further, many of the analysis processes tend to beall encompassing whereas the operational processes are wellsegmented. A user may decide to explore detail data whilereviewing the results of a report from the summary tables.After finding some interesting sales activity in a particularmonth, the user may join the activity for this month with themarketing programs that were run during that particular monthto further understand the sales. Of course, there would beinstances where a user attempts to run a query that will try tobuild a temporary table that is a Cartesian product of two tablescontaining a million rows each! While an activity like this wouldunacceptably degrade an operational system’s performance, it isexpected and planned for in a data warehousing system.
Data is mostly Non-volatileAnother key attribute of the data in a data warehouse system isthat the data is brought to the warehouse after it has becomemostly non-volatile. This means that after the data is in the datawarehouse, there are no modifications to be made to thisinformation. For example, the order status does not change,the inventory snapshot does not change, and the marketingpromotion details do not change. This attribute of the datawarehouse has many very important implications for the kindof data that is brought to the data warehouse and the timingof the data transfer.Let us further review what it means for the data to be non-volatile. In an operational system the data entities go throughmany attribute changes. For example, an order may go throughmany statuses before it is completed. Or, a product movingthrough the assembly line has many processes applied to it.Generally speaking, the data from an operational system istriggered to go to the data warehouse when most of the activityon these business entity data has been completed. This maymean completion of an order or final assembly of an acceptedproduct. Once an order is completed and shipped, it is unlikelyto go back to backorder status. Or, once a product is built andaccepted, it is unlikely to go back to the first assembly station.Another important example can be the constantly changing datathat is transferred to the data warehouse one snapshot at a time.The inventory module in an operational system may changewith nearly every transaction; it is impossible to carry all of thesechanges to the data warehouse. You may determine that asnapshot of inventory carried once every week to the datawarehouse is adequate for all analysis. Such snapshot datanaturally is non-volatile.It is important to realize that once data is brought to the datawarehouse, it should be modified only on rare occasions. It isvery difficult, if not impossible, to maintain dynamic data in thedata warehouse. Many data warehousing projects have failedmiserably when they attempted to synchronize volatile databetween the operational and data warehousing systems.

27
DA
TA W
AR
EH
OU
SIN
G A
ND
DA
TA M
ININ
GData saved for longer periods than in transactionsystemsData from most operational systems is archived after the databecomes inactive. For example, an order may become inactiveafter a set period from the fulfillment of the order; or a bankaccount may become inactive after it has been closed for a periodof time. The primary reason for archiving the inactive data hasbeen the performance of the operational system. Largeamounts of inactive data mixed with operational live data cansignificantly degrade the performance of a transaction that isonly processing the active data. Since the data warehouses aredesigned to be the archives for the operational data, the datahere is saved for a very long period.In fact, a data warehouse project may start without any specificplan to archive the data off the warehouse. The cost ofmaintaining the data once it is loaded in the data warehouse isminimal. Most of the significant costs are incurred in datatransfer and data scrubbing. Storing data for more than fiveyears is very common for data warehousing systems. There areindustry examples were the success of a data warehousingproject has encouraged the managers to expand the timehorizon of the data stored in the data warehouse. They maystart with storing the data for two or three years and thenexpand to five or more years once the wealth of businessknowledge in the data warehouse is discovered. The fallingprices of hardware have also encouraged the expansion ofsuccessful data warehousing projects.
Figure 3. Reasons for moving data outside the operations systems
•Different performance requirements
•Combine data from multiple applications
•Data is mostly non-volatile
•Data saved for a long time period
Order processing•2 second response time
•Last 6 months orders
DataWarehouse•Last 5 years data
•Response time 2 secondsto 60 minutes
•Data is not modified
Product Price/inventory•10 second response time
•Last 10 price changes
•Last 20 inventory transactions
Marketing•30 second response time
•Last 2 years programs
Daily closed orders
Weekly product price/Inventory
Weekly marketing program
s
In short, the separation of operational data from the analysisdata is the most fundamental data-warehousing concept. Notonly is the data stored in a structured manner outside theoperational system, businesses today are allocating considerableresources to build data warehouses at the same time that theoperational applications are deployed. Rather than archivingdata to a tape as an afterthought of implementing an opera-tional system, data warehousing systems have become theprimary interface for operational systems.Figure 3 highlights the reasons for separation discussed in thissection.
Logical Transformation of OperationalDataThis sub-section explores the concepts associated with the datawarehouse logical model. The data is logically transformedwhen it is brought to the data warehouse from the operationalsystems. The issues associated with the logical transformationof data brought from the operational systems to the datawarehouse may require considerable analysis and design effort.The architecture of the data warehouse and the data warehousemodel greatly impact the success of the project. This sectionreviews some of the most fundamental concepts of relationaldatabase theory that do not fully apply to data warehousingsystems. Even though most data warehouses are deployed onrelational database platforms, some basic relational principles areknowingly modified when developing the logical and physicalmodel of the data warehouses.
Structured Extensible Data ModelThe data warehouse model outlines the logical and physicalstructure of the data warehouse. Unlike the archived data of thelegacy systems, considerable effort needs to be devoted to thedata warehouse modeling. This data modeling effort in theearly phases of the data warehousing project can yield significantbenefits in the form of an efficient data warehouse that isexpandable to accommodate all of the business data frommultiple operational applications.The data modeling process needs to structure the data in thedata warehouse independent of the relational data model thatmay exist in any of the operational systems. As discussed laterin this paper, the data warehouse model is likely to be lessnormalized than an operational system model. Further, theoperational systems are likely to have large amounts ofoverlapping business reference data. Information about currentproducts is likely to be used in varying forms in many of theoperational systems. The data warehouse system needs toconsolidate all of the reference data. For example, the opera-tional order processing system may maintain the pricing andphysical attributes of products whereas the manufacturing floorapplication may maintain design and formula attributes for thesame product. The data warehouse reference table for productswould consolidate and maintain all attributes associated withproducts that are relevant for the analysis processes. Someattributes that are essential to the operational system are likely tobe deemed unnecessary for the data warehouse and may not beloaded and maintained in the data warehouse.

28
DA
TA W
AR
EH
OU
SIN
G A
ND
DA
TA M
ININ
G
Orders
Product
Future
Figure 4. Extensible data warehouse
•Setup framework for Enterprise data warehouse
•Start with few a most valuable source applications
•Add additional applications as business case can be made
Ente
rpris
e D
ata
War
ehou
seFuture
The data warehouse model needs to be extensible and struc-tured such that the data from different applications can beadded as a business case can be made for the data. A datawarehouse project in most cases cannot include data from allpossible applications right from the start. Many of thesuccessful data warehousing projects have taken an incrementalapproach to adding data from the operational systems andaligning it with the existing data. They start with the objectiveof eventually adding most if not all business data to the datawarehouse. Keeping this long-term objective in mind, theymay begin with one or two operational applications thatprovide the most fertile data for business analysis. Figure 4illustrates the extensible architecture of the data warehouse.
Data Warehouse model aligns with the businessstructureA data warehouse logical model aligns with the businessstructure rather than the data model of any particular applica-tion. The entities defined and maintained in the datawarehouse parallel the actual business entities such as custom-ers, products, orders, and distributors. Different parts of anorganization may have a very narrow view of a business entitysuch as a customer. For example, a loan service group in a bankmay only know about a customer in the context of one or moreloans outstanding. Another group in the same bank may knowabout the same customer in context of a deposit account. Thedata warehouse view of the customer would transcend the viewfrom a particular part of the business. A customer in the datawarehouse would represent a bank customer that has any kindof business with the bank.The data warehouse would most likely build attributes of abusiness entity by collecting data from multiple source applica-tions. Consider, for example, the demographic data associated
with a bank customer. The retail operational system mayprovide some attributes such as social security number, address,and phone number. A mortgage system or some purchaseddatabase may provide with employment, income, and networth information.The structure of the data in any single source application is likelyto be inadequate for the data warehouse. The structure in asingle application may be influenced by many factors, including:• Purchased Applications: The application data structure
may be dictated by an application that was purchased from asoftware vendor and integrated into the business. The userof the application may have very little or no control over thedata model. Some vendor applications have a very genericdata model that is designed to accommodate a large numberand types of businesses.
• Legacy Application: The source application may be a veryold mostly homegrown application where the data modelhas evolved over the years. The database engine in thisapplication may have been changed more than once withoutanyone taking the time to fully exploit the features of thenew engine. There are many legacy applications in existencetoday where the data model is neither well documented norunderstood by anyone currently supporting the application.
• Platform Limitations: The source application data modelmay be restricted by the limitations of the hardware/software platform or development tools and technologies. Adatabase platform may not support certain logicalrelationship or there may be physical limitations on the dataattributes.
Figure 5. Data warehouse entities align with the business structure
•No data model restrictions of the source application
•Data warehouse model has business entities
DataWarehouse
Product Price/inventory
MarketingCustomerProfile
Productprice
Order processing
Available Inventory
Customerorders
Productprice
Marketing programs
Productprice
ProductInventory
Product Price changes
Customers
Products
Product Inventory
Product Price
Orders
Figure 5 illustrates the alignment of data warehouse entitieswith the business structure. The data warehouse model breaksaway from the limitations of the source application data modelsand builds a flexible model that parallels the business structure.This extensible data model is easy to understand by thebusiness analysts as well as the managers.

29
DA
TA W
AR
EH
OU
SIN
G A
ND
DA
TA M
ININ
G
OPERATIONAL SYSTEMS D A T A W A R E H O U S E
• PROCESSES THOUSANDS OF MILLIONS OF TRANSACTIONS DAILY.
• PROCESSES ONE TRANSACTION DAILY THAT CONTAINS MILLIONS OF RECORDS.
• Deals with one account at a time.
• Deals with a summary of multiple accounts
• Runs day-to-day operations.
• Creates reports for strategic decision-makers.
• Exists on different machines, dividing university resources.
• Exists on a single machine, providing a centralized resource.
• Provides instantaneous snapshot of an organization's affairs. Data changes from moment to moment .
• Adds layers of snapshots on a regularly scheduled basis. Data changes only when DW Team updates the warehouse.
Transformation of the Operational StateInformationIt is essential to understand the implications of not being ableto maintain the state information of the operational systemwhen the data is moved to the data warehouse. Many of theattributes of entities in the operational system are very dynamicand constantly modified. Many of these dynamic operationalsystem attributes are not carried over to the data warehouse;others are static by the time they are moved to the data ware-house. A data warehouse generally does not containinformation about entities that are dynamic and constantlygoing through state changes.To understand what it means to lose the operational stateinformation, let us consider the example of an order fulfillmentsystem that tracks the inventory to fill orders. First let us lookat the order entity in this operational system. An order may gothrough many different statuses or states before it is fulfilled orgoes to the “closed” status. Other order statuses may indicatethat the order is ready to be filled, it is being filled, back ordered,ready to be shipped, etc. This order entity may go throughmany states that capture the status of the order and thebusiness processes that have been applied to it. It is nearlyimpossible to carry forward all of attributes associated withthese order states to the data warehousing system. The datawarehousing system is most likely to have just one finalsnapshot of this order. Or, as the order is ready to be movedinto the data warehouse, the information may be gathered frommultiple operational entities such as order and shipping tobuild the final data warehouse order entity.Now let us consider the more complicated example of inven-tory data within this system. The inventory may change withevery single transaction. The quantity of a product in the
inventory may be reduced by an order fulfillment transaction orthis quantity may be increased with receipt of a new shipmentof the product. If this order processing system executes tenthousand transactions in a given day, it is likely that the actualinventory in the database will go through just as many states orsnapshots during this day. It is impossible to capture thisconstant change in the database and carry it forward to the datawarehouse. This is still one of the most perplexing problemswith the data warehousing systems. There are many approachesto solving this problem. You will most likely choose to carryperiodical snapshots of the inventory data to the data ware-house. This scenario can apply to a very large portion of thedata in the operational systems. The issues associated with thisget much more complicated as extended time periods areconsidered.
Figure 6. Transformation of the operational state information
•Operational state information is not carried to the data warehouse
•Data is transferred to the data warehouse after all state changes
•Or, data is transferred with period snapshots
Order ProcessingSystem Data
WarehouseDaily closed orders
Order
Up
Inventory
Dow
n
Weekly inventory snapshot
Editor:
Please add Open,Backorder, Shipped,Closed to the arrowaround the order
Inventory snapshot 1
Inventory snapshot 2
Orders (Closed)
Figure 6 illustrates how most of the operational state informa-tion cannot be carried over the data warehouse system.
De-normalization of DataBefore we consider data model de-normalization in the contextof data warehousing, let us quickly review relational databaseconcepts and the normalization process. E. F. Codd developedrelational database theory in the late 1960s while he was aresearcher at IBM. Many prominent researchers have madesignificant contributions to this model since its introduction.Today, most of the popular database platforms follow thismodel closely. A relational database model is a collection oftwo-dimensional tables consisting of rows and columns. Inthe relational modeling terminology, the tables, rows, andcolumns are respectively called relations, attributes, and tuples.The name for relational database model is derived from theterm relation for a table. The model further identifies uniquekeys for all tables and describes the relationship between tables.Normalization is a relational database modeling process wherethe relations or tables are progressively decomposed intosmaller relations to a point where all attributes in a relation arevery tightly coupled with the primary key of the relation. Mostdata modelers try to achieve the “Third Normal Form” with all

30
DA
TA W
AR
EH
OU
SIN
G A
ND
DA
TA M
ININ
G
of the relations before they de-normalize for performance orother reasons. The three levels of normalization are brieflydescribed below:• First Normal Form: A relation is said to be in First Normal
Form if it describes a single entity and it contains no arraysor repeating attributes. For example, an order table orrelation with multiple line items would not be in FirstNormal Form because it would have repeating sets ofattributes for each line item. The relational theory would callfor separate tables for order and line items.
• Second Normal Form: A relation is said to be in SecondNormal Form if in addition to the First Normal Formproperties, all attributes are fully dependent on the primarykey for the relation.
• Third Normal Form: A relation is in Third Normal Form ifin addition to Second Normal Form, all non-key attributesare completely independent of each other.
The process of normalization generally breaks a table into manyindependent tables. While a fully normalized database can yieldfantastically flexible model, it generally makes the data modelmore complex and difficult to follow. Further, a fully normal-ized data model can perform very inefficiently. A data modelerin an operational system would take normalized logical datamodel and convert it into a physical data model that is signifi-cantly de-normalized. De-normalization reduces the need fordatabase table joins in the queries.Some of the reasons for de-normalizing the data warehousemodel are the same as they would be for an operational system,namely, performance and simplicity. The data normalization inrelational databases provides considerable flexibility at the costof the performance. This performance cost is sharply increasedin a data warehousing system because the amount of datainvolved may be much larger. A three-way join with relativelysmall tables of an operational system may be acceptable interms of performance cost, but the join may take unacceptablylong time with large tables in the data warehouse system.
Static Relationships in Historical DataAnother reason that de-normalization is an important processin data warehousing modeling is that the relationship betweenmany attributes does not change in this historical data. Forexample, in an operational system, a product may be part of theproduct group “A” this month and product group “B” startingnext month. In a properly normalized data model, it would beinappropriate to include the product group attribute with anorder entity that records an order for this product; only theproduct ID would be included. The relational theory would callfor a join on the order table and product table to determine theproduct group and any other attributes of this product. Thisrelational theory concept does not apply to a data warehousingsystem because in a data warehousing system you may becapturing the group that this product belonged to when theorder was filled. Even though the product moves to differentgroups over time, the relationship between the product and thegroup in context of this particular order is static.Another important example can be the price of a product. Theprices in an operational system may change constantly. Some of
these price changes may be carried to the data warehouse with aperiodic snapshot of the product price table. In a data ware-housing system you would carry the list price of the productwhen the order is placed with each order regardless of theselling price for this order. The list price of the product maychange many times in one year and your product price databasesnapshot may even manage to capture all these prices. But, it isnearly impossible to determine the historical list price of theproduct at the time each order is generated if it is not carried tothe data warehouse with the order. The relational databasetheory makes it easy to maintain dynamic relationships betweenbusiness entities, whereas a data warehouse system capturesrelationships between business entities at a given time.
Figure 7. Logical transformation of application data
•Structured extensible data model
•Data warehouse model aligns with the business structure
•Transformation of the state information
•Data is de-normalized because the relationships are static
DataWarehouse
Product Price/inventory
MarketingCustomerProfile
Productprice
Order processing
Available Inventory
Customerorders
Productprice
Marketing programs
Productprice
ProductInventory
Product Price changes
Customers
Products
Product Inventory
Product Price
Orders
Exte
nsib
le d
ata
war
ehou
se
De-normalized data
TransformState
Logical transformation concepts of source application datadescribed here require considerable effort and they are a veryimportant early investment towards development of a success-ful data warehouse. Figure 7 highlights the logicaltransformation concepts discussed in this section.
Physical Transformation of OperationalDataPhysical transformation of data homogenizes and purifies thedata. These data warehousing processes are typically known as“data scrubbing” or “data staging” processes. The “datascrubbing” processes are some of the most labor-intensive andtedious processes in a data warehousing project. Yet, withoutproper scrubbing, the analytical value of even the clean data canbe greatly diminished. Physical transformation includes the useof easy-to-understand standard business terms, and standardvalues for the data. A complete dictionary associated with thedata warehouse can be a very useful tool. During these physicaltransformation processes the data is sometimes “staged” beforeit is entered into the data warehouse. The data may be com-bined from multiple applications during this “staging” step orthe integrity of the data may be checked during this process.The concepts associated with the physical transformation of thedata are introduced in this sub-section. Historical data and thecurrent operational application data is likely to have somemissing or invalid values. It is important to note that it isessential to manage missing values or incomplete transforma-

31
DA
TA W
AR
EH
OU
SIN
G A
ND
DA
TA M
ININ
Gtions while moving the data to the data warehousing system.The end user of the data warehouse must have a way to learnabout any missing data and the default values used by thetransformation processes.
Operational terms transformed into uniformbusiness termsThe terms and names used in the operational systems aretransformed into uniform standard business terms by the datawarehouse transformation processes. The operational applica-tion may use cryptic or difficult to understand terms for a varietyof different reasons. The platform software may impose lengthand format restriction on a term, or purchased application maybe using a term that is too generic for your business. The datawarehouse needs to consistently use standard business termsthat are self-explanatory.A customer identifier in the operational systems may be calledcust, cust_id, or cust_no. Further, different operationalapplications may use different terms to refer to the sameattribute. For example, a customer in the loan organization in abank may be referred to as a Borrower. You may choose asimple standard business term such as Customer Id in the datawarehouse. This term would require little or no explanationeven to the novice user of the data warehouse.
Discussions• Give some examples of Operational systems.• Explain how the logical transformation of operational data
takes place.• Describe the Differences between transaction and analysis
processes• Explain the Physical transformation of operational data• Discuss the need of de-normalizing the data.
References
1. Adriaans, Pieter, Data mining, Delhi: Pearson EducationAsia, 1996.
2. Anahory, Sam, Data warehousing in the real world: a practicalguide for building decision support systems, Delhi: PearsonEducation Asia, 1997.
3. Berry, Michael J.A. ; Linoff, Gordon, Mastering data mining: the art and science of customer relationship management, NewYork : John Wiley & Sons, 2000
4. Corey, Michael, Oracle8 data warehousing, New Delhi: TataMcGraw- Hill Publishing, 1998.
5. Elmasri, Ramez, Fundamentals of database systems, 3rd ed.Delhi: Pearson Education Asia, 2000.
Notes

32
DA
TA W
AR
EH
OU
SIN
G A
ND
DA
TA M
ININ
G
Structure• Objective• Introduction• Building a Data Warehouse• Nine decisions in the design of a data warehouse
ObjectiveThe objective of this lesson is to introduce you with the basicconcepts behind building a data warehouse.
IntroductionThere are several reasons why organizations consider datawarehousing a critical need. These drivers for data warehousingcan be found in the business climate of a global marketplace, inthe changing organizational structures of successful corpora-tions, and in the technology.Traditional databases support On-Line Transaction Processing(OLTP), which includes insertions, updates, and deletions,while also supporting information query requirements.Traditional relational databases are optimized to process queriesthat may touch a small part of the database and transactionsthat deal with insertions or updates of a few tuples per relationto process. Thus, they cannot be optimized for OLAP, DSS, ordata mining. By contrast, data warehouses are designed preciselyto support efficient extraction, process-ing, and presentation foranalytic and decision-making purposes. In comparison to tradi-tional databases, data warehouses generally contain very largeamounts of data from multiple sources that may includedatabases from different data models and sometimes liesacquired from independent systems and platforms.
Building a Data WarehouseIn constructing a data warehouse, builders should take a broadview of the anticipated use of the warehouse. There is no wayto anticipate all possible queries or analyses during the designphase. However, the design should specifically support ad-hocquerying, that is, accessing data with any meaningful combina-tion of values for the attributes in the dimension or fact tables.For example; a marketing-intensive consumer-productscompany -would require different ways of organizing the datawarehouse than would a nonprofit charity focused on fundraising. An appropriate schema should be chosen that reflectsanticipated usage.
Acquisition of data for the warehouse involves the followingsteps:
• The data must be extracted from multiple, heterogeneoussources; for example, databases or other data feeds such asthose containing financial market data or environmental data.
• Data must be formatted for consistency within thewarehouse. Names, meanings, and domains of data fromunrelated sources must be reconciled. For instance, subsidiary
LESSON 7BUILDING DATA WAREHOUSING, IMPORTANT CONSIDERATIONS
companies of a large corporation may have different fiscalcalendars with quarters ending on different dates, making itdifficult to aggregate financial data by quarter. Various creditcards may report their transactions differently, making itdifficult to -compute all credit sales. These formatinconsistencies must be resolved.
• The data must be cleaned to ensure validity. Data cleaning isan involved and involved and complex process that has beenidentified as the largest labor-demanding component -datawarehouse construction. For input data, cleaning must occurbefore the data are loaded into the warehouse. There isnothing about cleaning data that is specific to datawarehousing and that could not be applied to a hostdatabase. However, since input data must be examined andformatted consistently, data warehouse builders should takethis opportunity to check for validity and quality.Recognizing erroneous and incomplete data is difficult toautomate, and cleaning that requires automatic errorcorrection can be even tougher. Some aspects, such asdomain checking, are easily coded into data cleaning routines,but automatic recognition of other data problems can bemore challenging. (For example, one might require that City= ‘San Francisco’ together with State = ‘CT’ be recognized asan incorrect combination.)
After such problems have been taken care of, similar data fromdifferent sources must be coordinated for loading into thewarehouse. As data managers in the organization. Discover thattheir data are being cleaned for input into the warehouse; theywill likely want to upgrade their data with the cleaned data. Theprocess of returning cleaned data to the source is called backflushing.• The data must be fitted into the data model of the
warehouse. Data from the various sources must be installedin the data model of the warehouse. Data may have to beconverted from relational, object-oriented, or legacy databases(network and/or hierarchical) to a multidimensional model.
• The data must be loaded into the warehouse. The sheervolume of data in the warehouse makes loading the data asignificant task. Monitoring tools for loads as well asmethods to recover from incomplete or incorrect loads arerequired. With the huge volume of data in the warehouse,incremental updating is usually the only feasible approach.The refresh policy will probably emerge as a compromise thattakes into account the answers to the following questions:
• How up-to-date must the data be?• Can the warehouse go off-line, and for how long?• What are the data interdependencies?• What is the storage availability?• What are the distribution requirements (such as for
replication and partitioning)?

33
DA
TA W
AR
EH
OU
SIN
G A
ND
DA
TA M
ININ
G• What is the loading time (including cleaning, formatting,
copying, transmitting, and overhead such as indexrebuilding)?
As we have said, databases must strike a balance betweenefficiency in transaction processing and supporting queryrequirements (ad hoc user requests), but a data warehouse istypically optimized for access from a decision maker’s, needs.Data storage in a data warehouse reflects this specialization andinvolves the following processes:• Storing the data according to the data model of the
warehouse.• Creating and maintaining, required data structures.• Creating and maintaining appropriate access paths.• Providing for time-variant data as new data are added.• Supporting the updating of warehouse data.• Refreshing the data.• Purging dataAlthough adequate time can be devoted initially to constructingthe warehouse, the sheer volume of data in the warehousegenerally makes it impossible to simply reload the warehouse inits entirety later on. Alternatives include selective (partial)refreshing of data and separate warehouse versions (requiring,double, storage capacity for the ware-house). When thewarehouse uses an incremental data refreshing mechanism, datamay need to be periodically purged; for example, a warehousethat maintains data on the pre-vious twelve business quartersmay periodically purge its data each year.Data warehouses must also be designed with full considerationof the environment in which they will reside. Important designconsiderations include-the following:• Usage projections.• The fit of the data model.• Characteristics of available sources.• Design of the metadata component.• Modular component design.• Design for manageability and change.• Considerations of distributed and parallel architectureWe discuss each of these in turn. Warehouse design is initiallydriven by usage pro-jections; that is, by expectations about whowill use the warehouse and in what way. Choice of a data modelto support this usage is a key initial decision. Usage projectionsand the characteristics of the warehouse’s data sources are bothtaken into account. Modular design is a practical necessity toallow the warehouse to evolve with. the organization and itsinformation environment. In addition, a well-built datawarehouse must be designed for maintainability, enabling thewarehouse managers to effectively plan for and manage changewhile providing optimal support to users.
Metadata is defined as - description of a database including itsschema definition. The metadata repository is a key datawarehouse component. The metadata repository includes bothtechnical and business metadata. The first, technical metadata,covers details of acquisition processing, storage structures, data
descriptions, warehouse operations and maintenance, and accesssupport functionality. The second, business metadata, includesthe relevant business rules and organizational details support-ing the warehouse.The architecture of the organization’s distributed computingenvironment is a major -determining characteristic for thedesign of the warehouse. There are two basic distributedarchitectures: the distributed warehouse and the federatedwarehouse. For a distributed warehouse, all the issues ofdistributed databases are relevant, for example, replication,partitioning, communications, and consistency concerns. Adistributed architecture can provide benefits particularlyimportant to warehouse performance, such as improved loadbalancing, scalability of performance, and higher availability. Asingle replicated metadata repository would reside at eachdistribution site. The idea of the federated warehouse is likethat of the federated database: a decentralized confederation ofautonomous data warehouses, each with its own metadatarepository. Given the magnitude of the challenge inherent todata warehouses, it is likely that such federations will consist ofsmaller-scale components, such as data marts. Large organiza-tions may choose -to federate data marts rather than build hugedata warehouses.
Nine Decisions in the design of a Data WarehouseThe job of a data warehouse designer is a daunting one. Oftenthe newly appointed data warehouse designer is drawn to thejob because of the high vis-ibility and importance of the datawarehouse function. In effect, management says to the designer:“Take all the enterprise data and make it available to manage-ment so that they can answer all their questions and sleep atnight. And please do it very quickly, and we’re sorry, but we can’tadd any more staff until the proof of concept is successful.”This responsibility is exciting and very visible, but mostdesigners feel over-whelmed by the sheer enormity of the task.Something real needs to be accom-plished, and fast. Where doyou start? Which data should be brought up first? Whichmanagement needs are most important? Does the designdepend on the details of the most recent interview, or are theresome underlying and more constant design guidelines that youcan depend on? How do you scope the proj-ect down tosomething manageable, yet at the same time build an extensiblearchitecture that will gradually let you build a comprehensivedata warehouse environment?These questions are close to causing a crisis in the data ware-house industry. Much of the recent surge in the industry toward“data marts” is a reaction to these very issues. Designers want todo something simple and achievable. No one is willing to signup for a galactic design that must somehow get every-thingright on the first try. Everyone hopes that in the rush tosimplification, the long-term coherence and extendibility of thedesign will not be compro-mised. Fortunately, a pathwaythrough this design challenge achieves an implementableimmediate result, and at the same time it continuously mendsthe design so that eventually a true enterprise-scale datawarehouse is built. The secret is to keep in mind a designmethodology, which Ralph Kimball calls the “nine-stepmethod”(see Table 7.1).

34
DA
TA W
AR
EH
OU
SIN
G A
ND
DA
TA M
ININ
G
As a result of interviewing marketing users, finance users, salesforce users, operational users, first- and second-level manage-ment, and senior manage-ment, a picture emerges of what iskeeping these people awake at night.Table 7.1 Nine-Step Method in the Design of a DataWarehouse1. Choosing the subject matter2. Deciding what a fact table represents3. Identifying and conforming the dimensions.4. Choosing the facts5. Storing precalculations in the fact table.6. Rounding out the dimension tables7. Choosing the duration of the database8. The need to track slowly changing dimensions9. Deciding the query priorities and the query modesCan list and prioritize the primary business issues facing theenterprise. At the same time you should conduct a set ofinterviews with the legacy systems’ DBAs who will reveal whichdata sources are clean, which contain valid and consistent data,and which will remain supported over the next few years.Preparing for the design with a proper set of interviews iscrucial. Inter-viewing is also one of the hardest things to teachpeople. I find it helpful to reduce the interviewing process to atactic and an objective. Crudely put, the tactic is to make the end-users talk about what they do, and the objective is to gaininsights that feed the nine design decisions. The tricky part isthat the interviewer can’t pose the design questions directly tothe end users. End users talk about what are important in theirbusiness lives. End users are intim-idated by system designquestions, and they are quite right when they insist that systemdesign is IT responsibility, not theirs. Thus, the challenge of thedata mart designer is to meet the users tar more than half way.In any event, armed with both the top-down view (what keepsmanagement awake) and the bottom-up view (which datasources are available), the data warehouse designer may followthese steps:Step 1: Choosing the subject matter of a particular data mart.The first data mart you build should be the one with the mostbangs for the buck. It should simultaneously answer the mostimportant business questions and be the most accessible interms of data extraction. According to Kimball, a great place tostart in most enterprises is to build a data mart that consists ofcus-tomer invoices or monthly statements. This data source isprobably fairly accessible and of fairly high quality. One ofKimball’s laws is that the best data source in any enterprise isthe record of “how much money they owe us.” Unless costsand profitability are easily available before the data mart is evendesigned, it’s best to avoid adding these items to this first datamart. Nothing drags down a data mart implementation fasterthan a heroic or impossible mission to provide activity-basedcosting as part of the first deliverable.Step 2: Deciding exactly what a fact table record represents. Thisstep, according to R. Kimball, seems like a technical detail at thisearly point, but it is actually the secret to making progress on thedesign. A table is the large central table in the dimensional
designs that has a multipart key. Each component of themultipart key is a foreign key to an individual dimension table.In the example of customer invoices, the “grain” of the facttable is the individual line item on the customer invoice. Inother words, a line item on an invoice is a single fact tablerecord, and vice versa. Once the fact table representation isdecided, a coherent discussion of what the dimen-sions of thedata mart’s fact table are can take place.Step 3: Identifying and conforming the dimensions. Thedimensions are the drivers of the data mart. The dimensionsare the platforms for brows-ing the allowable constraint valuesand launching these constraints. The dimensions are the source’of row headers in the user’s final reports; they carry theenterprise’s vocabulary to the users. A well-architect set ofdimensions makes the data mart understandable and easy touse. A poorly presented or incomplete set of dimensions robsthe data mart of its usefulness. Dimensions should be chosenwith the long-range data warehouse in mind. This choice pre-sents the primary moment at which the data mart architect mustdisregard the data mart details and consider the longer-rangeplans. If any dimension occurs in two data marts, they must beexactly the same dimension, or one must be a mathematicalsubset of the other. Only in this way can two data marts shareone or more dimensions in the same application. When adimen-sion is used in two data marts, this dimension is said tobe conformed. Good examples of dimensions that absolutelymust be conformed between data marts are the customer andproduct dimensions in an enterprise. If these dimensions .areallowed drifting out of synchronization between data marts,the overall data warehouse will fail, because the two data martswill not be able to be used together. The requirement toconform dimensions across data marts i£ very strong. Carefulthought must be given to this requirement before the firs: datamart is implemented. The data mart team must figure out whatan enter-prise customer ID is and what an enterprise productID is. If this task is done correctly, successive data marts can bebuilt at different times, on different machines, and by differentdevelopment teams, and these data martsWill merge coherently into an overall data warehouse. Inparticular, if the dimen-sions of two data marts are conformed,it is easy to implement drill across by sending separate queries tothe two data marts, and then sort-merging the answer sets on aset of common row headers. The row headers can be made becommon only if they are drawn from a conformed dimensioncommon to the two data marts.With these first three steps correctly implemented, designers canattack last six steps (see Table 7.1). Each step gets easier if thepreceding steps have been performed correctly.
Discussions• Write short notes on:
• Data cleaning• Back flushing• Heterogeneous Sources• Metadata repository

35
DA
TA W
AR
EH
OU
SIN
G A
ND
DA
TA M
ININ
G• Discuss various steps involved in the acquisition of data for
the data warehouse.• List out various processes involved in data storage in a data
warehouse.• What are the important design considerations, which need to
be thought of, while designing a data warehouse?• Explain the difference between distributed warehouse and
the federated warehouse.• What are the nine decisions in the design of a data
warehouse?
References1. Anahory, Sam, Data warehousing in the real world: a practical
guide for building decision support systems, Delhi: PearsonEducation Asia, 1997.
2. Berry, Michael J.A. ; Linoff, Gordon, Mastering data mining: the art and science of customer relationship management, NewYork : John Wiley & Sons, 2000
3. Corey, Michael, Oracle8 data warehousing, New Delhi: TataMcGraw- Hill Publishing, 1998.
4. Elmasri, Ramez, Fundamentals of database systems, 3rd ed.Delhi: Pearson Education Asia, 2000.
Notes
36
DA
TA W
AR
EH
OU
SIN
G A
ND
DA
TA M
ININ
G
Structure• Objective• Introduction• Data warehouse Application• Approaches used to build a Data Warehousing• Important considerations• Tighter Integration• Empowerment• Willingness• Reason for Building a Data Warehousing
ObjectiveThe aim of this lesson is to study about Data warehouseapplications and various approaches that are used to build aData warehouse.
IntroductionIt is the professional warehouse team deals with issues anddevelops solutions, which wi1l best suit the needs of theanalytical user community. A process of negotiation and,sometimes of give and take is used to address issues that havecommon ground between the players in the data warehousedelivery team.
Data Warehouse ApplicationIn application, data warehouse application is different transac-tion deals with large amounts of data, which is aggregate innature, a data warehouse application answers questions like• What is the average deposit by branch?• Which day of the week is busiest?• Which customers with high average balances currently are not
participating in a checking- plus account)Because we are dealing with questions, each request is unique.The interface that supports this end user must be flexible bydesign. You have many different applications accessing the sameinformation.Each with a particular strength. A data mart is typically a subsetof your warehouse with a specific purpose in mind. Forexample, you might have a financial mart and a marketing mart;each designed to feed information to a specific part of yourcorporate business community. A key issue in the industrytoday is which approach should you take when building aDecision Support System?
Approaches used to build a Data WarehouseWe have experiences with two approaches to the build process:Top-Down Approach, meaning that an organization hasdeveloped an enterprise data model, collected enterprise widebusiness requirements, and decided to build an enterprise datawarehouse with subset data marts. In this approach, we need to
LESSON 8BUILDING DATA WAREHOUSING - 2
spend the extra time and build a core data warehouse first, andthen use this as the basis to quickly spin off many data marts.Disadvantage is this approach takes longer to build initially sincetime has to be spent analyzing data requirements in the full –blown warehouse, identifying the data elements that will beused in numerous marts down the road.The advantage is that once you go to build the data mart, youalready have the warehouse to draw from.Bottom-Up Approach, implying that the business prioritiesresulted in developing individual data marts, which are thenintegrated into the enterprise data warehouse. In this approachwe need to build a workgroup specific data mart first. Thisapproach gets data into your users hands quicker but the work ittakes to get the information into the data mart may not bereusable when moving the same data into a warehouse or tryingto use similar data in different data mart.Advantage is you gain speed but not portabilityWe don’t care. In fact, we’d like to coin the term “ware mart”.The answer to which approach is correct depends on a numberof vectors. You can take the approach that gets information into your user’s hands quickest. In our experience, that arguingover the marts and evolving into a warhorse. Results are whatcount not arguing over the data mart v/s the warehouseapproach.
Are they Different?Well, you can give many reasons your operational system andyour data warehouses are not the same. The data need tosupport operational needs is differently then the data needed tosupport analytical processing. In fact the data are physicallystored quite differently. An operationa1 system is optimized fortransactional updates, while a data warehouse system isoptimized-for large queries dealing with large data sets. Thesedifferences become apparent. When you begin to monitorcentral processing unit (CPU) usage on a computer that containsa data warehouse v / s CPU usage on a system that contains anoperational system.
Important Considerations• Tighter Integration• Empowerment• Willingness
Tighter IntegrationThe term back end describes the data repository used tosupport the data warehouse coupled with the software thatsupports the repository. For example, Oracle 7 CooperativeServer Front end describes the tools used by the warehouse end-users to support their decision making activities, With classicoperational systems sometimes ad-hoc dialog exist between thefront end and back end to support specialties; with the data

37
DA
TA W
AR
EH
OU
SIN
G A
ND
DA
TA M
ININ
Gwarehouse team, this dialog must be ongoing as the warehousesprings to life. Unplanned fixes may be come necessary for theback end to support what the user community daces to do itdata warehouse system. This tighter integration between thefront end and the back end requires continual communicationbetween the data warehouse project team players. Some toolsexist for end user analytic processing that require specific datastructures in the warehouse and in some cases specific namingstandards, as result sometimes the nature of the front end tooldrives the design of the data structure in the warehouse.
EmpowermentUsers to control their own destiny- no running to the program-mers asking for reports programmed to satisfy burning needs.How many times in operational environments are new reportsidentified, scoped and programmed, only to discover by the tiethey are ready, the user has found other sources for the desiredoutput? An inevitable time delay exists between the identifica-tion of new requirements and their delivery. This is no one’sfault it simple reality.
WillingnessWith the data warehouse Resistance often exists to makingchange, but then a warehouse initiative is rolled out with a setof executives, manager clerks and analysts it will succeed. Withcontinual input and attention to detail the warehouse teamspends most of its time working wit the hands -on involve-ment of the uses. All but the most stubborn users embrace thenew technology because it can provide them with answers totheir question almost immediately. In shops here the move to awindows-like environment has no yet been made the simulta-neous rollout of a point-and- click interface and the placementof power in the hands of the consumer is bound to succeed.
Reason for Building a Data WarehousingOpportunityConsidering a data warehouse development project within everyorganization, many of the same frustration exist. Thesecommon themes are true business opportunity that a data\warehouse can assist in achieving. Whenever one or more ofthe following is heard, it is a signal that a true business reasonexists for building a data warehouse• We have all the data in our system. We just need access to it
to make a better decision for running the business.• We need an easier way to analyze information than training
our business people in SQL.
Self Test1. Identify the factors which does not facilitate change
managementa. Trainingb. Communicationc. Rigid structured. None of these
2. Which group is not responsible for successful warehouse ?a. Usersb. Top management
c. Working managementd. None of these
3. Which is not a key to developing data warehouse?a. Structure of organizationb. Change managementc. User requirementd. Methodology
4. Which of these factors does not track project development?a. Performance measures based requirementsb. Enterprise requirements gatheringc. Cultural requirementsd. None of these
5. Which one is not a consideration for building a datawarehouse?a. Operating efficiencyb. Improved customer servicec. Competitive advantaged. None of these
Discussion1. Write short notes on:
• Tighter Integration• Empowerment• Willingness
2. Discuss different approaches used to build a DataWarehousing. Which approach is generally used for buildinga data warehouse?
3. Discuss various applications of a data warehouse.
References1. Anahory, Sam, Data warehousing in the real world: a practical
guide for building decision support systems, Delhi: PearsonEducation Asia, 1997.
2. Corey, Michael, Oracle8 data warehousing, New Delhi: TataMcGraw- Hill Publishing, 1998.
3. Elmasri, Ramez, Fundamentals of database systems, 3rd ed.Delhi: Pearson Education Asia, 2000.
4. Alex Berson, Stephen J.Smith, Data warehousing, data miningand OLTP: Tata McGraw- Hill Publishing, 2004

38
DA
TA W
AR
EH
OU
SIN
G A
ND
DA
TA M
ININ
G

39
DA
TA W
AR
EH
OU
SIN
G A
ND
DA
TA M
ININ
G
Structure• Objective• Introduction• Need of a Data warehouse• Business Considerations: Return on Investment• Approach• Organizational issues• Design Considerations• Data content• Metadata• Data distribution• Tools• Performance considerations
ObjectiveThe objective of this lesson is to learn about the need of a datawarehouse. It also includes topics related to various businessconsiderations and performance considerations.
IntroductionThe data warehouse is an environment, not a product. It is anarchitectural construct of information systems that providesusers with current and historical decision support informationthat is hard to access or present in traditional operational datastores. In fact, the data warehouse is a cornerstone of theorganization’s ability to do effective information processing,which, among other things, can enable and shear the discoveryand exploration of important business trends and dependen-cies that otherwise would have gone unnoticed.In principle, the data warehouse can meet informational needsof knowledge workers and can provide strategic businessopportunities by allowing customers and vendors access tocorporate data while maintaining necessary security measures.There are several reasons why organizations consider datawarehousing a critical need.
Need of a Data WarehouseThere are several reasons why organizations consider datawarehousing a crit-ical need. These drivers for data warehousingcan be found in the business cli-mate of a global marketplace, inthe changing organizational structures of successful corpora-tions, and in the technology.From a business perspective, to survive and succeed in today’shighly com-petitive global environment, business usersdemand business answers mainly because• Decisions need to be made quickly and correctly, using all
available data. . Users are business domain experts, notcomputer professionals.
LESSON 9BUSINESS CONSIDERATIONS: RETURN ON INVESTMENT DESIGN CONSIDERATIONS
• The amount of data is doubling every 18 months, whichaffects response time and the sheer ability to comprehend itscontent.
• Competition is. Heating up in the areas of businessintelligence. And added Information value.
In addition, the necessity for data warehouses has increased asorganizations dis-tribute control away from the middle-management layer, which has traditionally provided andscreened business information. As users depend more oninforma-tion obtained from Information Technology (IT)systems - from critical-success measures to vital business-event-related information - the need to provide an informationwarehouse for the remaining staff to use becomes more critical.There are several technology reasons for the existence of datawarehousing. First, the data warehouse is designed to addressthe incompatibility of infor-mational and operational transac-tional systems. These two classes of informa-tion systems aredesigned to satisfy different, often incompatible, requirements.At the same time, the IT infrastructure is changing rapidly, andits capabilities are increasing, _s evidenced by the following:• The price of MIPS (computer processing speed) continues to
decline, while• The power of microprocessors doubles every 2 years.• The price of digital storage is rapidly dropping.• Network bandwidth is increasing, while the price of high
bandwidth is decreasing.• The workplace is increasingly heterogeneous with respect to
both the hard- ware and software.• Legacy systems need to, and can, be integrated with new
applications.These business and technology drivers often make building adata warehouse a strategic imperative. This chapter takes a closelook at what it takes to build a successful data warehouse.
Business Considerations: Return onInvestment
ApproachThe information scope of the data warehouse varies with thebusiness require-ments, business priorities, and even magni-tude of the problem. The subject-oriented nature of the datawarehouse means that the nature of the subject determines thescope (or the coverage) of the warehoused information. Specif-ically, if the data warehouse is implemented to satisfy a specificsubject area (e.g., human resources), such a warehouse isexpressly designed to solve busi-ness problems related topersonnel. An organization may choose to build anotherwarehouse for its marketing department. These two ware-houses could be implemented independently and be completelystand-alone applica-tions, or they could be viewed as compo-

40
DA
T
A W
A
RE
HO
US
ING
AN
D D
A T
A M
ININ
G
nents of the enterprise, interacting with each other, and using acommon enterprise data model. As defined earlier the indi-vidual warehouses are known as data marts. Organizationsembarking on data warehousing development can chose one ofthe two approaches:• The top-down approach, meaning that an organization has
developed an enterprise data model, collected enterprise widebusiness requirements, an..: decided to build an enterprisedata warehouse with subset data marts
• The bottom-up approach, implying that the businesspriorities resulted i.e. developing individual data marts,which are then integrated into the enter-prise data warehouse
• The bottom-up approach is probably more realistic, but thecomplexity of the integration may become a serious obstacle,and the warehouse designer’s should carefully analyze eachdata mart for integration affinity.
Organizational IssuesMost IS an organization has considerable expertise in develop-ing operational systems. However; the requirements andenvironments associated with the informational applications ofa data warehouse are different. Therefore, an organization willneed to employ different development practices than the ones ituses for operational applications.The IS department will need to bring together data that cutsacross a com-pany’s operational systems as well as data fromoutside the company. But users will also need to be involvedwith a data warehouse implementation since they are closest tothe data. In many ways, a data warehouse implemen-tation isnot truly a technological issue; rather, it should be moreconcerned with identifying and establishing informationrequirements, the data sources to fulfill these requirements, andtimeliness.
Design ConsiderationsTo be successful, a data warehouse designer must adopt aholistic approach consider all data warehouse components asparts of a single complex system and take into the account allpossible data sources and all known usage requirements. Failingto do so may easily result in a data warehouse design that isskewed toward a particular business requirement, a particulardata source, or a selected access tool.In general, a data warehouse’s design point is to consolidatedata from mul-tiple, often heterogeneous, sources into a querydatabase. This is also one of the reasons why a data warehouseis rather difficult to build. The main factors include• Heterogeneity of data sources, which affects data conversion,
quality, and time-lines. Use of historical data, which impliesthat data may be “old”. Tendency of databases to grow verylarge. Another important point concerns the experience andaccepted practices. Basi-cally, the reality is that the datawarehouse design is different from traditional OLTP. Indeed,the data warehouse is business-driven (not IS-driven, as inOLTP), requires continuous interactions with end users, andis never finished, since both requirements and data sourceschange. Understanding these points allows developers toavoid a number of pitfalls relevant to data warehousedevelopment, and justifies a new approach to data
warehouse design: a business driven, continuous, iterativewarehouse engineering approach. In addition to thesegeneral considerations, there are several specific pointsrelevant to the data warehouse design.
Data contentOne common misconception about data warehouses is thatthey should not con-tain as much detail-level data as operationalsystems used to source this data in. In reality, however, whilethe data in the warehouse is formatted differently from theoperational data, it may be just as detailed. Typically, a datawarehouse may contain detailed data, but the data is cleaned upand-transformed to fit the ware-house model, and certaintransactional attributes of the data are filtered out. Theseattributes are mostly the ones used for the internal transactionsystem logic, and they are not meaningful in the context ofanalysis and decision-making.The content and structure of the data warehouse are reflected inits data model. The data model is the template that describeshow information will be organized within the integratedwarehouse framework. It identifies major sub-jects andrelationships of the model, including keys, attribute, andattribute groupings. In addition, a designer should alwaysremember that decision sup-port queries, because of theirbroad scope and analytical intensity, require data models to beoptimized to improve query performance. In addition to itseffect on query performance, the data model affects data storagerequirements and data loading performance.Additionally, the data model for the data warehouse may be(and quite often is) different from the data models for datamarts. The data marts, discussed in the previous chapter, aresourced from the data warehouse, and may contain highlyaggregated and summarized data in the form of a specializeddemoralized relational schema (star schema) or as a multidi-mensional data cube. The key point is, however, that in adependent data mart environment, the data mart data is cleanedup, is transformed, and is consistent with the data warehouseand other data marts sourced from the same warehouse.
MetadataAs already discussed, metadata defines the contents and locationof data (data model) in the warehouse, relationships betweenthe operational databases and the data warehouse, and thebusiness views of the warehouse data that are accessible by end-user tools. Metadata is searched by users to find datadefini-tions or subject areas. In other words, metadata providesdecision-support oriented pointers to warehouse data, and thusprovides a logical link between warehouse data and the decisionsupport application. A data warehouse design should ensurethat there is mechanisms that populates and maintains themetadata repository, and that all access paths to the datawarehouse have metadata as an entry point. To put it anotherway, the warehouse design should prevent any direct access tothe warehouse data (especially updates) if it does not usemetadata definitions to gain the access.

41
DA
TA W
AR
EH
OU
SIN
G A
ND
DA
TA M
ININ
GData DistributionOne of the biggest challenges when designing a data warehouseis the data placement and distribution strategy. This followsfrom the fact that as the data Volumes continue to grow; thedatabase size may rapidly outgrow a single server. Therefore, itbecomes necessary to know how the data should be dividedacross multiple servers, and which users should get access towhich types of data. The data placement and distributiondesign should consider several options, including data distribu-tion by subject area (e.g., human resources, marketing), location(e.g., geographic regions), or time (e.g., current, monthly,Quarterly). The designers should be aware that, while thedistribution solves a number of problems, it may also create afew of its own; for example, if the warehouse servers aredistributed across multiple locations, a query that spans severalservers across the LAN or WAN may flood the network with alarge amount of data. Therefore, any distribution strategyshould take into account all possible access needs for thewarehouse data.
ToolsA number of tools available today are specifically designed tohelp in the i1hple-mentation of a data warehouse. These toolsprovide facilities for defining the transformation and cleanuprules, data movement (from operational sources into thewarehouse), end-user query, reporting, and data analysis. Eachtool takes a slightly different approach to data warehousing andoften maintains its own version of the metadata, which isplaced in a tool-specific, proprietary meta-data repository. Datawarehouse designers have to be careful not to sacrifice theoverall design to fit a specific tool. At the same time, thedesigners have to make sure that all selected tools are compat-ible with the given data warehouse envi-ronment and with eachother. That means that all selected tools can use a com-monmetadata repository. Alternatively, the tools should be able tosource the metadata from the warehouse data dictionary (if itexists) or from a CASE tool used to design the warehousedatabase. Another option is to use metadata gate-ways thattranslate one tool’s metadata into another tool’s format. Ifthese requirements are not satisfied, the resulting warehouseenvironment may rapidly become unmanageable, since everymodification to the warehouse data model may involve somesignificant and labor-intensive changes to the meta-data’definitions for every tool in the environment. And then, thesechanges would have to be verified for consistency and integrity.
Performance ConsiderationsAlthough the data warehouse design point does not includesub second response times typical of OLTP systems, it isnevertheless a clear business requirement that an ideal datawarehouse environment should support inter-active queryprocessing. In fact, the majority of end-user tools are designedas interactive applications. Therefore, “rapid” query processing isa highly desired feature that should be designed into the datawarehouse. Of course, the actual performance levels arebusiness-dependent and vary widely from one environ-ment toanother. Unfortunately, it is relatively difficult to predict theperfor-mance of a typical data warehouse. One of the reasonsfor this is the unpredictable usage pattern against the data.
Thus, traditional database design and tuning techniques don’talways work in the data warehouse arena. When designing adata warehouse, therefore, the need to clearly understand usersinformational requirements becomes mandatory. Specifically,knowing how end users need to access various data can helpdesign warehouse data-bases to avoid the majority of the mostexpensive operations such as multitable scans and joins. Forexample, one design technique is to populate the ware-housewith a number of demoralized views containing summarized,derived, and aggregated data. If done correctly, many end-userqueries may execute directly against these views, thus maintain-ing appropriate overall perfor-mance levels.
Discussions• Write short notes on:
• Meta data• Data distribution• Data content• CASE tools• Data marts
• Discuss various design considerations, which are taken intoaccount while building a data warehouse.
• Explain the need and importance of a data warehouse.• Describe the organization issues, which are to be considered
while building a data warehouse.• Explain the need of Performance Considerations• “Organizations embarking on data warehousing
development can choose one of the two approaches”.Discuss these two approaches in detail.
• Explain the business considerations, which are taken intoaccount while building a data warehouse
References1. Anahory, Sam, Data warehousing in the real world: a practical
guide for building decision support systems, Delhi: PearsonEducation Asia, 1997.
2. Adriaans, Pieter, Data mining, Delhi: Pearson EducationAsia, 1996.
3. Corey, Michael, Oracle8 data warehousing, New Delhi: TataMcGraw- Hill Publishing, 1998.
4. Elmasri, Ramez, Fundamentals of database systems, 3rd ed.Delhi: Pearson Education Asia, 2000.

42
DA
TA W
AR
EH
OU
SIN
G A
ND
DA
TA M
ININ
G
Structure• Objective• Introduction• Technical Considerations• Hardware platforms• Balanced approach• Optimal hardware architecture for parallel query scalability• Data warehouse and DBMS specialization• Communications infrastructure• Implementation Considerations• Access tools
ObjectiveThe purpose of this lesson is to take a close look at what ittakes to build a successful data warehouse. Here, I am focusingon the Technical Issues, which are to be considered whendesigning and implementing a data warehouse.
IntroductionThere are several technology reasons for the existence of datawarehousing. First, the data warehouse is designed to addressthe incompatibility of informational and operational transac-tional system. These two classes of informa-tion systems aredesigned to satisfy different, often incompatible, requirements.At the same time, the IT infrastructure is changing rapidly, andits capabilities are increasing, _s evidenced by the following:• The price of MIPS (computer processing speed) continues to
decline, while• The power of microprocessors doubles every 2 years.• The price of digital storage is rapidly dropping.• Network bandwidth is increasing, while the price of high
bandwidth is decreasing.• The workplace is increasingly heterogeneous with respect to
both the hard- ware and software.• Legacy systems need to, and can, be integrated with new
applications.These business and technology drivers often make building adata warehouse a strategic imperative. This chapter takes a closelook at what it takes to build a successful data warehouse.
Technical ConsiderationsA number of technical issues are to be considered whendesigning and imple-menting a data warehouse environment.These issues include:• The hardware platform that would house the data
warehouse• The database management system that supports the
warehouse database
LESSON 10TECHNICAL CONSIDERATION, IMPLEMENTATION CONSIDERATION
• The communications infrastructure that connects thewarehouse, data marts,
• Operational systems, and end users• The hardware platform and software to support the
metadata repository• The systems management framework that enables centralized
management and administration of the entire environment.Let’s look at some of these issues in more detail.
Hardware PlatformsSince many data warehouse implementations are developed intoalready exist-ing environments, many organizations tend toleverage the existing platforms and skill base to build a datawarehouse. This section looks at the hardware platformselection from an architectural viewpoint: what platform is bestto build a successful data warehouse from the ground up.An important consideration when choosing a data warehouseserver is its capacity for handling the volumes of data requiredby decision support appli-cations, some of which may require asignificant amount of historical (e.g., up to 10 years) data. Thiscapacity requirement can be quite large. For example, in general,disk storage allocated for the warehouse should be 2 to 3 timesthe size of the data component of the warehouse to accommo-date DSS processing, such as sorting, storing of intermediateresults, summarization, join, and format-ting. Often, theplatform choice is the choice between a mainframe and non-MVS (UNIX or Windows NT) server.Of course, a number of arguments can be made for and againsteach of these choices. For example, a mainframe is based on aproven technology; has large data and throughput capacity; isreliable, available, and serviceable; and may support the legacydatabases that are used as sources for the data warehouse. Thedata warehouse residing on the mainframe is best suited forsituations in which large amounts of legacy data need to bestored in the data warehouse. A mainframe system, however, isnot as open and flexible as a contemporary client/server system,and is not optimized for ad hoc query processing. A mod-ernserver (no mainframe) can also support large data volumes anda large number of flexible GUI-based end-user tools, and canrelieve the mainframe from ad hoc query processing. However,in general, non-MVS servers are not as reliable as mainframes,are more difficult to manage and integrate into the existingenvironment, and may require new skills and even neworganizational structures.From the architectural viewpoint, however, the data warehouseserver has to be specialized for the tasks associated with the datawarehouse, an main frame can be well suited to be a datawarehouse server. Let’s look at the hardware features that makea server-whether it is mainframe, UNIX-, or NT-based-anappropriate technical solution for the data warehouse.

43
DA
TA W
AR
EH
OU
SIN
G A
ND
DA
TA M
ININ
GTo begin with, the data warehouse server has to be able tosupport large data volumes and complex query processing. Inaddition, it has to be scalable, since the data warehouse is neverfinished, as new user requirements, new data sour and morehistorical data are continuously incorporated into the ware-house, a clear as the user population of the data warehousecontinues to grow. Therefore, a clear -requirement for the datawarehouse server is the scalable high performance data loadingand ad hoc query processing as well as the ability to supportdatabases in a reliable, efficient fashion. Chapter 4 brieflytouched on various design points to enable server specializationfor scalability in performance throughput, user support, andvery large database (VLDB) processing.
Balanced ApproachAn important design point when selecting a scalable computingplatform is the right balance between all computing componentexample, between the number of processors in a multiproces-sor system an the I/O bandwidth. Remember that the lack ofbalance in a system inevitably results in a bottleneck!Typically, when a hardware platform is sized to accommodatethe data house, this sizing is frequently focused on the numberand size of disks. A typical disk configuration. Includes 2.5 to 3times the amount of raw important consideration-diskthroughput comes from the actual number of disks, and notthe total disk space. Thus, the number of disks has direct ondata parallelism. To balance the system, it is very important tocorrect number of processors to efficiently handle all disk I/Ooperations. If this allocation is not balanced, an expensive datawarehouse platform can rapidly become CPU-bound. Indeed,since various processors have widely performance ratings andthus can support a different number of CPU, data warehousedesigners should carefully analyze the disk I/O processorcapabilities to derive an efficient system configuration. For if ittakes a CPU rated at 10 SPECint to efficiently handle one 3-Glry- _ drive, then a single 30 SPECint processor in amultiprocessor system can handle three disk drives. Knowinghow much data needs to be processed, should give you an ideaof how big the multiprocessor ‘system should be. A consider-ation is related to disk controllers. A disk controller can supporta -amount of data throughput (e.g., 20 Mbytes/s). Knowingthe per-disk through-put ratio and the total number of diskscan tell you how many controller given type should be config-ured in the system.The idea of a balanced approach can (and should) be carefullyextended to all system components. The resulting systemconfiguration will easily handle known workloads and provide abalanced and scalable computing platform for future growth.
Optimal hardware architecture for parallel queryscalabilityAn important consideration when selecting a hardware platformfor a data warehouse is the -ability. Therefore, a frequentapproach to system selection is to take of hardware parallelismthat comes in the form of shared-memory symmetric multipro-cessors (SMPs), clusters, and shared-nothingdistributed-memory system terns (MPPs). As was shown inChap. 3, the scalability of these systems can be seriously affectedby the system-architecture-induced data skew. This architecture-
induced data skew is more severe in the low-density asymmetricconnection architectures (e.g., daisy-chained, 2-D and 3-Dmesh), and is virtu-ally nonexistent in symmetric connectionarchitectures (e.g., cross-bar switch). Thus, when selecting ahardware platform for a data warehouse, take into account thefact that the system-architecture-induced data skew can over-power even the best data layout for parallel query execution, andcan force an expen-sive parallel computing system to processqueries serially.
Data warehouse and DBMSSpecializationTo reiterate, the two important challenges facing the developersof data ware-houses are the very large size of the databases andthe need to process complex ad hoc queries in a relatively shorttime. Therefore, among the most important requirements forthe data warehouse DBMS are performance, throughput, andscalability.The majority of established RDBMS vendors have imple-mented various degrees of parallelism in their respectiveproducts. Although any relational database managementsystem-such as DB2, Oracle, Informix, or Sybase--supportsparallel database processing, some of these products have beenarchitect to better suit the specialized requirements of the datawarehouse.In addition to the “traditional” relational DBMSs, there aredatabases that have been optimized specifically for datawarehousing, such as Red Brick Warehouse from Red BrickSystems.
Communications InfrastructureWhen planning for a data warehouse, one often-neglectedaspect of the archi-tecture is the cost and efforts associated withbringing access to corporate data directly to the desktop. Thesecosts and efforts could be significant, since many large organiza-tions do not have a large user population with direct electronicaccess to information, and since a typical data warehouse userrequires a rela-tively large bandwidth to interact with the datawarehouse and retrieve a sig-nificant amount of data for theanalysis. This may mean that communications networks have tobe expanded, and new hardware and software may have to bepurchased.
Implementation ConsiderationsA data warehouse cannot be simply bought and installed-itsimplementation requires the integration of many productswithin a data warehouse. The caveat here is that the necessarycustomization drives up the cost of implementing a datawarehouse. To illustrate the complexity of the data warehouseimplemen-tation, let’s discuss the logical steps needed to build adata warehouse:• Collect and analyze business requirements.• Create a data model and a physical design for the data
warehouse.• Define data sources.• Choose the database technology and platform for the
warehouse.

44
DA
TA W
AR
EH
OU
SIN
G A
ND
DA
TA M
ININ
G
• Extract the data from the operational databases, transform it,and clean it up.
• And load it into the database.• Choose database access and reporting tools.• Choose database connectivity software.• Choose data analysis and presentation software.• Update the data warehouse.When building the warehouse, these steps must be performedwithin the constraints of the current state of data warehousetechnologies. .
Access ToolsCurrently, no single tool on the market can handle all possibledata warehouse Access needs. Therefore, most implementationsrely on a suite of tools. The best way to choose this suiteincludes the definition of different types of access. The data andselecting the best tool for that kind of access. Examples ofaccess types include• Simple tabular form reporting• Ranking.• Multivariable analysis• Time series analysis• Data visualization, graphing, charting, and pivoting.
Complex textual search• Statistical analysis• Artificial intelligence techniques for testing of hypothesis,
trends discovery definition, and validation of data clustersand segments
• Information mapping (i.e., mapping of spatial data ingeographic’ information systems)
• Ad hoc user-specified queries• Predefined repeatable queries• Interactive drill-down reporting and analysis• Complex queries with multitable joins, multilevel
subqueries, and sophisticated search criteriaIn addition, certain business requirements often exceed existingtool capabili-ties and may require building sophisticatedapplications to retrieve and analyze warehouse data. Theseapplications often take the form of custom-developed screensand reports that retrieve frequently used data and format it in apre-defined standardized way. This approach may be very usefulfor those data warehouse users who are not yet comfortablewith ad hoc queries.There are a number of query tools on the market today. Manyof these tools are designed to easily compose and execute adhoc queries and build cus-tomized reports with little knowledgeof the underlying database technology, SQL, or even the datamodel (i.e., Impromptu from Cognos, Business Objects, etc.),while others (e.g., Andyne’s GQL) provide relatively low-levelcapabilities for an expert user to develop complex ad hoc queriesin a fashion similar to developing SQL queries for relationaldatabases. Business requirements that exceed the capabilities ofad hoc query and reporting tools are fulfilled by dif-ferent classesof tools: OLAP and data mining tools.
Discussions• Write short notes on:
• Access tools• Hardware platforms• Balanced approach
• Discuss Data warehouse and DBMS specialization• Explain Optimal hardware architecture for parallel query
scalability• Describe the Technical issues, which are to be considered
while building a data warehouse.• Explain the Implementation Considerations, which are
taken into account while building a data warehouse
References
1. Anahory, Sam, Data warehousing in the real world: a practicalguide for building decision support systems, Delhi: PearsonEducation Asia, 1997.
2. Adriaans, Pieter, Data mining, Delhi: Pearson EducationAsia, 1996.
3. Corey, Michael, Oracle8 data warehousing, New Delhi: TataMcGraw- Hill Publishing, 1998.
4. Berson, Smith, Data warehousing, Data Mining, and OLAP,New Delhi: Tata McGraw- Hill Publishing, 2004
5. Elmasri, Ramez, Fundamentals of database systems, 3rd ed.Delhi: Pearson Education Asia, 2000.

45
DA
TA W
AR
EH
OU
SIN
G A
ND
DA
TA M
ININ
G
Structure• Objective• Introduction• Benefits of Data warehousing• Tangible Benefits• Intangible Benefits• Problems with data warehousing• Criteria for a data warehouse
ObjectiveThe aim of this lesson is to study various benefits provided bya data warehouse. You will also learn about the problems withdata warehousing and the criteria for Relational Databases forbuilding a data warehouse
IntroductionToday’s data warehouse is a user-accessible database of historicaland functional company information fed by a mainframe.Unlike most systems, it’s set up according to business ratherthan computer logic. It allows users to dig and churn throughlarge caverns of important consumer data, looking for relation-ships and making queries. That process-where users siftthrough piles of facts and figures to discover trends andpatterns that suggest new business opportunities-is called datamining.All that shines is not gold, however. Data warehouses are notthe quick-hit fix that some assume them to be. A companymust commit to maintaining a data warehouse, making sure allof the data is accurate and timely.Benefits and rewards abound for a company that builds andmaintains a data warehouse correctly. Cost savings and increasesin revenue top the list for hard returns. Add to that an increasein analysis of marketing databases to cross-sell products, lesscomputer storage on the mainframe and the ability to identifyand keep the most profitable customers while getting a betterpicture of who they are, and it’s easy to see why data warehous-ing is spreading faster than a rumor of gold at the old mill.For example, the telecom industry uses data warehouses totarget customers who may want certain phone services ratherthan doing “blanket” phone and mail campaigns and aggravat-ing customers with unsolicited calls during dinner.Some of the soft benefits of data warehousing come in thetechnology’s effect on users. When built and used correctly, awarehouse changes users’ jobs, granting them faster access tomore accurate data and allowing them to give better customerservice.A company must not forget, however, that the goal for any datawarehousing project is to lower operating costs and generaterevenue—this is an investment, after all, and quantifiable ROIshould be expected over time. So if the data warehousing effort
LESSON 11BENEFITS OF DATA WAREHOUSING
at your organization is not striking it rich, you might want toask your data warehousing experts if they’ve ever heard offool’s gold.
Benefits of Data WarehousingData warehouse usage includes• Locating the right information• Presentation of information (reports, graphs). Testing of
hypothesis• Discovery of information• Sharing the analysisUsing better tools to access data can reduce outdated, historicaldata. Arise; users can obtain the data when they need it most,often during business. Decision processes, not on a schedulepredetermined months earlier by the department and computeroperations staff.Data warehouse architecture can enhance overall availability ofbusiness intelligence data, as well as increase the effectivenessand timeliness of business decisions.
Tangible BenefitsSuccessfully implemented data warehousing can realize somesignificant tangible benefits. For example, conservativelyassuming an improvement in out-of-stock conditions in theretailing business that leads to 1 percent increase in sales canmean a sizable cost benefit (e.g., even for a small retail businesswith $200 million in annual sales, a conservative 1 percentimprovement in salary yield additional annual revenue of $2million or more). In fact, several retail enterprises claim that datawarehouse implementations have improved out-of stockconditions to the extent that sales increases range from 5 to 20percent. This benefit is in addition to retaining customers whomight not have returned if, because of out-of-stock problems,they had to do business with other retailers.Other examples of tangible benefits of a data warehouseinitiative include the following:• Product inventory turnover is improved.• Costs of product introduction are decreased with improved
selection of target markets.• More cost-effective decision making is enabled by separating
(ad hoc) query• Processing from running against operational databases.• Better business intelligence is enabled by increased quality
and flexibility of market analysis available through multileveldata structures, which may range from detailed to highlysummarize. For example, determining the effectiveness ofmarketing programs allows the elimination of weaker pro-grams and enhancement of stronger ones.
• Enhanced asset and liability management means that a datawarehouse can provide a “big” picture of enterprise wide

46
DA
TA W
AR
EH
OU
SIN
G A
ND
DA
TA M
ININ
G
purchasing and inventory patterns, and can indicateotherwise unseen credit exposure and opportunities for costsavings.
Intangible BenefitsIn addition to the tangible benefits outlined above, a datawarehouse provides a number of intangible benefits. Althoughthey are more difficult to quantify, intangible benefits shouldalso be considered when planning for the data ware-house.Examples of intangible benefits are:1. Improved productivity, by keeping all required data in a
single location and eliminating the rekeying of data2. Reduced redundant processing, support, and software to
support over- lapping decision support applications.3. Enhanced customer relations through improved knowledge
of individual requirements and trends, throughcustomization, improved communica-tions, and tailoredproduct offerings
4. Enabling business process reengineering-data warehousingcan provide useful insights into the work processesthemselves, resulting in developing breakthrough ideas forthe reengineering of those processes
Problems with Data WarehousingOne of the problems with data mining software has been therush of companies to jump on the band wagon asthese companies have slapped ‘data warehouse’ labels ontraditional transaction-processing products, and co-optedthe lexicon of the industry in order to be consideredplayers in this fast-growing category.Chris Erickson, president and CEO of Red Brick (HPCwire,Oct. 13, 1995)Red Brick Systems have established a criteria for a relationaldatabase management system (RDBMS) suitable for datawarehousing, and documented 10 specialized requirements foran RDBMS to qualify as a relational data warehouse server, thiscriteria is listed in the next section.According to Red Brick, the requirements for data warehouseRDBMSs begin with the loading and preparation of data forquery and analysis. If a product fails to meet the criteria at thisstage, the rest of the system will be inaccurate, unreliable andunavailable.
Criteria for a Data WarehouseThe criteria for data warehouse RDBMSs are as follows:• Load Performance - Data warehouses require incremental
loading of new data on a periodic basis within narrow timewindows; performance of the load process should bemeasured in hundreds of millions of rows and gigabytes perhour and must not artificially constrain the volume of datarequired by the business.
• Load Processing - Many steps must be taken to load newor updated data into the data warehouse including dataconversions, filtering, reformatting, integrity checks, physicalstorage, indexing, and metadata update. These steps must beexecuted as a single, seamless unit of work.
• Data Quality Management - The shift to fact-basedmanagement demands the highest data quality. Thewarehouse must ensure local consistency, global consistency,and referential integrity despite “dirty” sources and massivedatabase size. While loading and preparation are necessarysteps, they are not sufficient. Query throughput is themeasure of success for a data warehouse application. Asmore questions are answered, analysts are catalyzed to askmore creative and insightful questions.
• Query Performance - Fact-based management and ad-hocanalysis must not be slowed or inhibited by the performanceof the data warehouse RDBMS; large, complex queries forkey business operations must complete in seconds not days.
• Terabyte Scalability - Data warehouse sizes are growing atastonishing rates. Today these range from a few to hundredsof gigabytes, and terabyte-sized data warehouses are a near-term reality. The RDBMS must not have any architecturallimitations. It must support modular and parallelmanagement. It must support continued availability in theevent of a point failure, and must provide a fundamentallydifferent mechanism for recovery. It must support near-linemass storage devices such as optical disk and HierarchicalStorage Management devices. Lastly, query performance mustnot be dependent on the size of the database, but rather onthe complexity of the query.
• Mass User Scalability - Access to warehouse data must nolonger be limited to the elite few. The RDBMS server mustsupport hundreds, even thousands, of concurrent userswhile maintaining acceptable query performance.
• Networked Data Warehouse - Data warehouses rarely existin isolation. Multiple data warehouse systems cooperate in alarger network of data warehouses. The server must includetools that coordinate the movement of subsets of databetween warehouses. Users must be able to look at and workwith multiple warehouses from a single client workstation.Warehouse managers have to manage and administer anetwork of warehouses from a single physical location.
• Warehouse Administration - The very large scale and time-cyclic nature of the data warehouse demands administrativeease and flexibility. The RDBMS must provide controls forimplementing resource limits, chargeback accounting toallocate costs back to users, and query prioritization toaddress the needs of different user classes and activities. TheRDBMS must also provide for workload tracking and tuningso system resources may be optimized for maximumperformance and throughput. “The most visible andmeasurable value of implementing a data warehouse isevidenced in the uninhibited, creative access to data itprovides the end user.
• Integrated Dimensional Analysis - The power ofmultidimensional views is widely accepted, and dimensionalsupport must be inherent in the warehouse RDBMS toprovide the highest performance for relational OLAP tools.The RDBMS must support fast, easy creation ofprecomputed summaries common in large data warehouses.It also should provide the maintenance tools to automatethe creation of these precomputed aggregates. Dynamic

47
DA
TA W
AR
EH
OU
SIN
G A
ND
DA
TA M
ININ
Gcalculation of aggregates should be consistent with theinteractive performance needs.
• Advanced Query Functionality - End users requireadvanced analytic calculations, sequential and comparativeanalysis, and consistent access to detailed and summarizeddata. Using SQL in a client/server point-and-click toolenvironment may sometimes be impractical or evenimpossible. The RDBMS must provide a complete set ofanalytic operations including core sequential and statisticaloperations.
Discussions• Write short notes on:
• Query Performance• Integrated Dimensional Analysis• Load Performance• Mass User Scalability• Terabyte Scalability
• Discuss in brief Criteria for a data warehouse• Explain Tangible benefits. Provide suitable examples for
explanation.• Discuss various problems with data warehousing• Explain Intangible benefits. Provide suitable examples for
explanation.• Discuss various benefits of a Data warehouse.
References1. Adriaans, Pieter, Data mining, Delhi: Pearson Education
Asia, 1996.2. Anahory, Sam, Data warehousing in the real world: a practical
guide for building decision support systems, Delhi: PearsonEducation Asia, 1997.
3. Berry, Michael J.A. ; Linoff, Gordon, Mastering data mining: the art and science of customer relationship management, NewYork : John Wiley & Sons, 2000
4. Corey, Michael, Oracle8 data warehousing, New Delhi: TataMcGraw- Hill Publishing, 1998.
5. Elmasri, Ramez, Fundamentals of database systems, 3rd ed.Delhi: Pearson Education Asia, 2000.
6. Berson, Smith, Data warehousing, Data Mining, and OLAP,New Delhi: Tata McGraw- Hill Publishing, 2004
Notes

48
DA
TA W
AR
EH
OU
SIN
G A
ND
DA
TA M
ININ
G
Structure• Objective• Introduction• Project Management Process• Scope Statement• Project planning• Project scheduling• Software Project Planning• Decision Making
ObjectiveThe main objective of this lesson is to introduce you withvarious topics related to Process Management Process. It alsoincludes the need of Scope statement; project planning, ProjectScheduling Software Project Planning and decision-making.
IntroductionNow here we will talk about project management when wehaven’t yet defined the term “project”, For this definition, wefor to the source - the project management institute, The Projectmanagement institute is a nonprofit professional organizationdedicated to advancing the state of the art in the managementof projects.Membership is open to anyone actively engaged or interested inthe application practice teaching, and researching of projectmanagement principles and techniques.According to the book. A Guide to the project managementbody knowledge, published by the project managementinstitute standards committee. A project is a temporaryendeavor undertaken to create u unique product or service.One key point here is temporary endeavor. Any project musthave a defined start and end, If you are unclear about whatmust be done to complete the project, don’t start it. This is asure path to disaster. In addition, if at any point in the projectif becomes clear that the end product of the project cannot bedelivered then the project should be called. This also applies to adata warehouse project. Another key point is to create a uniqueproduct or service. You must have a clear idea of what you arebuilding and why it is unique. It is not necessary for you tounderstand why your product or service is unique from dayone. But through the process of developing the project plan theuniqueness of the project. Only with a define end do you have aproject that can succeed.
Project Management ProcessThe project management institute is a nonprofit professionalorganization dedicated to advancing the state of the art in themanagement of projects.A project is a temporary endeavor undertaken to create a uniqueproduct or service.
CHAPTER 3MANAGING AND IMPLEMENTING A
DATA WAREHOUSE PROJECTLESSON 12
PROJECT MANAGEMENT PROCESS,SCOPE STATEMENT
Every project must have a defined start and end. If you areunclear about what must be done to complete the project, don’tstart it.If at any point in the project if becomes clear that the endproduct of the project cannot be delivered then the projectshould be cancelled. This also applies to a data warehouseproject.One must have a clear idea of what you are building and why itis unique.It is not necessary to understand why your product or service isunique from day one. But through the process of developingthe project plan, the uniqueness of the project. Only with adefine end do you have a project that can succeedIn addressing the unique aspect or providing business userswith timely access to data amidst constantly changing businessconditions, Whether you are embarking on a customer relation-ship management initiative, a balanced scorecardimplementation, a risk management system or other, decisionsupport applications, there is a large body of knowledge aboutwhat factors contributed the most to the failures of these typeof initiative. We, as an industry: need to leverage this knowledgeand learn these lessons so we don’t repeat them in our ownprojects.A data warehouse is often the foundation for many of decisionsupport initiatives. Many studies have show that a significantreason for the failure of data warehousingAnd decision support projects is not failure of the technology,but rather, inappropriate project management including lack ofintegration, lack of communication and lack of clear linkages tobusiness objectives and to benefits achievement.
The Scope StatementOne of the major proven techniques we can use to help us withthis discovery process is called a scope statement. A scopestatement is a written document by which you begin to definethe job at hand and all the key deliverables. In fact, we feel it isgood business practice not to begin work on any project untilyou have developed a scope statement. No work should beginon, a project until a scope statement has been developed. Theseare the major elements in the breakdown of a scope statement.1.Project Title and Description: Every project should have aclear name and description of what you are trying to accom-plish.2.Project Justification: clear description of why this project isbeing done. What is the goal of the project?3. Project Key Deliverables: a 1ist of keys items that must beaccomplished so this project can be completed. What must bedone for us to consider the project done?

49
DA
TA W
AR
EH
OU
SIN
G A
ND
DA
TA M
ININ
G4. Project Objective: an additional list of success criteria.These items must be measurable: a good place to put any time,money, or resource constraints.Think of scope statement as your first stake in the ground.What’s important is that a scope statement provides a docu-mented basis for building a common understanding among allthe shareholders of the project at hand. It is crucial that youbegin to write down and document the project and all itsassumptions. If you do not do this, you will get burned. All astakeholder remembers about a hallway conversation is thedeliverable, not the constraints. Many project managers havebeen burned by making a hallway statement, such as: “If thenew network is put into place by July I, feel comfortable sayingwe can provide you with the legacy data by July 10, not All thestakeholder will remember will remember is the date of July 10,not the constraint associated with it.A scope stmt provides a documented basis for building acommon understanding among all the shareholders of theproject at hand.It is crucial that you begin to write down and document theproject and all its assumptions. If you do not do this, youmight get into some problem.
Project PlanningProject planning is probably the most time-consuming projectmanagement activity. It is a continuous activity from initialconcept through to system delivery. Plans must be regularlyrevised as new information becomes available Various differenttypes of plan may be developed to support the main softwareproject plan that is concerned with schedule and budget.Types of project plan are:• Quality plan• Validation plan• Configuration management plan• Maintenance plan• Staff development planA project plan is usually of the following structure:• Introduction• Project organization• Risk analysis• Hardware and software resource requirements• Work breakdown• Project schedule• Monitoring and reporting mechanismsThree important concepts in project planning are:• Activities in a project should be organised to produce
tangible outputs for management to judge progress• Milestones are the end-point of a process activity• Deliverables are project results delivered to customersThe waterfall process allows for the straightforward definitionof progress milestones.
During early stages of planning, critical decisions must be madedue to estimation results e.g.• Whether or not to bid on a contract, and if so, for how
much• Whether or not build software, or to purchase existing
software that has much of the desired functionality• Whether or not to subcontract (outsource) some of the
software developmentThe project plan is the actual description of:• The tasks to be done• Who is responsible for the tasks• What order tasks are to be accomplished• When the tasks will be accomplished, and how long they will
takeThe Project Plan is updated throughout the project.Project planning is only part of the overall management of theproject. Other project management activities include:• Risk analysis and management• Assigning and organizing project personnel• Project scheduling and tracking• Configuration managementProject Management (across disciplines) is actually considered awhole separate field from software engineering. The ProjectManagement Institute (http://www.pmi.org) has actuallydeveloped an entire Body of Knowledge for project manage-ment, called PMBOK. However, there are some aspects ofsoftware project management that are unique to the manage-ment of software.There are four dimensions of development:• People• Process• Product• TechnologyThe resources a manager should consider during projectplanning are:• Human Resources: This includes “overhead”, and by far is
the most dominant aspect of software costs and effort.• Software Resources: COTS, in-house developed software and
tools, reusable artifacts (e.g. design patterns), historical data(helps with cost/effort estimation)
Note that there is usually not much involving physical re-sources, except as it relates to overhead.
Project SchedulingDuring project scheduling:• Split the project into tasks and estimate time and resources
required to complete each task.• Organize tasks concurrently to make optimal use of work
force• Minimize task dependencies to avoid delays caused by one
task waiting for another to complete

50
DA
TA W
AR
EH
OU
SIN
G A
ND
DA
TA M
ININ
G
This activity is highly dependent on project managers intuitionand experience.Some scheduling problems are:• Estimating the difficulty of problems and hence the cost of
developing a solution is hard• Productivity is not proportional to the number of people
working on a task• Adding people to a late project makes it later because of
communication overheads• For further reading on this, look at Frederick Brooks’ book
“The Mythical Man Month”• The unexpected always happens; always allow contingency in
planning.Scheduling starts with estimation of task duration:• Determination of task duration• Estimation of anticipated problems• Consideration of unanticipated problems• Use of previous project experienceActivity charts are used to show task dependencies. They can beused to identify the critical path i.e. the project duration.Bar charts and activity networks are:• Graphical notations used to illustrate the project schedule• Show project breakdown into tasks• Tasks should not be too small. They should take about a
week or two• Activity charts show task dependencies and the the critical
path• Bar charts show schedule against calendar time• Used to show activity timelines• Used to show staff allocations
Software Project PlanningSoftware project planning is the process of• Determining what the scope and available resources for a
project,• Estimating the costs, total effort and duration of the project
required to develop and deliver the software,• Determining the feasibility of the project,• Deciding on whether or not to go forward with project
implementation,• Creating a plan for the successful on-time and within budget
delivery of reliable software that meets the client’s needs, and• Updating the plan as necessary throughout the project
lifetime.Planning is primarily the job of the “Project Manager” and itssteps are• Develop Goals• Identify the end state• Anticipate problems• Create alternative courses of action• Define strategy
• Set policies and proceduresWhy do we need to make a project plan?There are two quotations that I’d like to include here:• No one plans to fail, they just fail to plan.• Plan the flight, fly the plan.Planning is about making a schedule that involves using toolslike• Activity Networks: PERT/CPM• Gantt Chart• Tabular NotationActivity networks show:• Activities: Task + Duration + Resources• Milestones: No Duration, No Resources
Critical Path MethodDuration of an activity is calculated with the formula Duration = (a + 4m + b)/6Where a is the pessimistic, m is the most likely and b is theoptimistic estimation of the duration of that activity.Terminologies relating to timing between activities are:• ES: early start, soonest an activity can begin• LS: late start, latest time an activity can begin• EF: early finish, earliest an activity can finish• LF: late finish, latest an activity can finish• Slack: difference between ES and LS, if zero critical pathThe scope of the project describes the desired functionality ofthe software, and what constraints are involved. Therefore,project scope is determined as part of the analysis process by therequirements team. The project manager then uses the scopethat has been defined in order to determine project feasibility,and to estimate what costs, total effort and project duration willbe involved in engineering the software.So does that mean that planning should come after require-ments? Definitely no. Project planning is actually an iterativeprocess, which starts at the beginning of the project, andcontinues throughout.
Decision MakingDecision-making during software project planning is simplyoption analysis. In a project, the manager must achieve a set ofessential project goals. He also may have desirable (but notessential) organisational goals. He must plan withinorganisational constraints. There are usually several differentways of tackling the problem with different results as far as goalachievement is concerned.Decision-making is usually based on estimated value: bycomparing the values of possible alternatives.A few examples of goals and constraints are:• Project goals: high reliability, maintainability, development
within budget, development time <2 years• Desirable goals: staff development, increase organisational
profile in application area, reusable software components

51
DA
TA W
AR
EH
OU
SIN
G A
ND
DA
TA M
ININ
G• Organisational constraints: use of a specific programming
language or tool set, limited staff experience in applicationarea.
In decision-making, it is advised to make goals as explicit and(wherever possible) quantified as possible. Then score possibleoptions against each goal, and use a systematic approach tooption analysis to select the best optionIt always helps to use graphs and visual aids during decision-making. When a single value is used, a list is usually sufficient.When more than one value is considered during decision-making, it is advised to use Polar Graphs for presenting thisinformation.As a practice, consider the following problem:You are a project manager and the Rational salesman tells youthat if you buy the Rational Suite of tools, it will pay for itselfin just a few months.The software will cost you $9600. You talk to other companiesand find that there is a 50% chance that the software will cutdefect rework costs by $32000.There is a 20% chance that there will be no improvement and a30% chance that negative productivity will increase project costsby $20000.Should you buy this software package?
Summary• Good project management is essential for project success• The intangible nature of software causes problems for
management• Managers have diverse roles but their most significant
activities are planning, estimating and scheduling• Planning and estimating are iterative processes which
continue throughout the course of a project• A project milestone is a predictable state where some formal
report of progress is presented to management.• The primary objective of software project planning is to plan
for the successful on-time and within budget delivery ofreliable software that meets the client’s needs
• Project scope should be determined through requirementsanalysis and used for planning by the project manager
• The primary resources needed for a software project are theactual developers
• Early on in a project decisions must be made on whether ornot to proceed with a project, and whether or not to buy orbuild the software
• The project tasks, schedule and resource allocation is all partof the Project Plan
• Project planning is only part of the project managementprocess
• Effective management depends on good planning• Planning and estimating are iterative process• Milestones should occur regularly• Option analysis should be carried out to make better
decision
Discussions• Explain the following with related examples:
• Scope Statement• Goals• Deliverables• Organizational Constraints• Decision making• Milestones
• What is Project Management Process?• Describe the need of Project planning. Can a project be
completed in time without Project Planning? Explain withan example.
• Explain the significance of Project scheduling• What is Software Project Planning?• Describe the contents that are included in a Project Plan. Why
do we need to make a project plan?
Reference1. Hughes, Bob, Software project management, 2nd ed. New
Delhi: Tata McGraw- Hill Publishing, 1999.2. Kelkar, S.A., Software project management: a concise study, New
Delhi: Prentice Hall of India, 20023. Meredith, Jack R.; Mantel, Samuel J., Project management: a
managerial approach, New York: John Wiley and Sons, 2002.4. Royce, Walker, Software project management: a unified
framework, Delhi: Pearson Education Asia, 1998.5. Young, Trevor L., Successful project management, London:
Kogan Page, 2002.

52
DA
TA W
AR
EH
OU
SIN
G A
ND
DA
TA M
ININ
G
Structure• Objective• Introduction• Work Breakdown Structure• How to build a WBS• To create work breakdown structure• From WBS to Activity Plan• Estimating Time
ObjectiveWhen you will complete this lesson you should be able to:• Understand the purpose of a Work Breakdown Structure.• Construct a WBS
IntroductionOnce Project scope stmt is completed, another useful techniqueis called Work Breakdown Structure.Work Breakdown Structure is exactly as it sounds a breakdownof all the work that must be done. This includes all deliverables.For e.g.., if you are expected to provide the customer withweekly status reports, this should also be in the structure.
Work Breakdown Structure (WBS)In order to identify the individual tasks in a project it is usefulto create a Work Breakdown Structure. Get the team togetherand brainstorm all of the tasks in the project, in no particularorder. Write them down on sticky notes and put them on awhiteboard. Once everyone has thought of as many tasks asthey can arrange the sticky notes into groups under the majorareas of activity.A work breakdown structure (WBS) is a document that showsthe work involved in completing your project.Keep it simple:• A one-page diagram can convey as much information as a 10-
page document.• As a general rule, each box on your diagram is worth about
80 hours (three weeks) of work.• About 3-4 levels is plenty of detail for a single WBS diagram.
If you need to provide more detail, make another diagram.Draw a work breakdown structure early in the project. It willhelp you:• Clearly explain the project to your sponsor and stakeholders;• Develop more detailed project plans (schedules, Gantt charts
etc) in an organized, structured way.The work breakdown structure is part of the project plan. Thesponsor and critical stakeholders should sign it off before theproject begins.
LESSON 13WORK BREAKDOWN STRUCTURE
Revise the work breakdown structure whenever design conceptsor other key requirements change during the project.
How to build a WBS (a servingsuggestion)1. Identify the required outcome of the project, the overall
objective you want to achieve. Write it on a Post-It Note andstick it high on a handy wall.
2. Brainstorm with your project team and sponsor:• Identify all the processes, systems and other things you will
need to do in the project.• Write each component on a separate Post-It Note.• Stick the components on the wall, arranged randomly under
the first Post-It Note.• Every process should have an outcome (otherwise, why
follow the process?). Identify which Post-Its representprocesses and break them down into their outcomes:products, services, documents or other things you candeliver. Then discard the process Post-Its.
3. Have a break.4. Over the next few hours (or days, for a large or complex
project), return to the wall and move the Post-It Notesaround so that they are grouped in a way that makes sense.
• Every team member should have a chance to do this, eitherin a group or individually.
• Everyone has an equal say about what groupings make sense.• If an item seems to belong in two or more groups, make
enough copies of the Post-It Note to cover all the relevantgroups.
5. When the team has finished its sorting process, reconvene thegroup and agree on titles (labels) for each group of Post-Its.
6. Draw your WBS diagram.Whether the WBS should be activity-oriented or deliverable-oriented is a subject of much discussion. There are also variousapproaches to building the WBS for a project. Project manage-ment software, when used properly, can be very helpful indeveloping a WBS, although in early stages of WBS develop-ment, plain sticky notes are the best tool (especially in teams).An example of a work breakdown for painting a room (activity-oriented) is:• Prepare materials
• Buy paint• Buy a ladder• Buy brushes/rollers• Buy wallpaper remover

53
DA
TA W
AR
EH
OU
SIN
G A
ND
DA
TA M
ININ
G• Prepare room
• Remove old wallpaper• Remove detachable decorations• Cover floor with old newspapers• Cover electrical outlets/switches with tape• Cover furniture with sheets
• Paint the room• Clean up the room
• Dispose or store left over paint• Clean brushes/rollers• Dispose of old newspapers• Remove covers
The size of the WBS should generally not exceed 100-200terminal elements (if more terminal elements seem to berequired, use subprojects). The WBS should be up to 3-4 levelsdeep.
To Create Work Breakdown StructureWork breakdown structure should be at a level where anystakeholder can understand all the steps it will take to accom-plish each task and produce each deliverable.1. Project Management
1.1 Administrative1.1.1 Daily Mgmt1.1.2 Daily Communication1.1.3 Issue Resolution
1.2 Meeting1.2.1 Client Meetings1.2.2 Staff Meetings
2.Technical Editor2.1 Choosing Technical Editor
2.1.1 Determine skill set2.1.2 Screen Candidates2.1.3 Determine appropriate Candidates2.1.4 Choose Candidates
2.2 Working with Technical Editor2.2.1 Establish Procedure2.2.2 Agree on Rule of Engagement.
From WBS to Activity Plan1. Identify irrelevant tasks2. Identify resources needed3. Decide time needed (task time, not lapsed time) for the
smallest units of WBS.4. Identify dependencies (many are already in the WBS, but
there are probably also cross-dependencies.) There are twotypes:• Logical dependency: carpet cannot be laid until painting
is complete.• Resource dependency: if same guy is to paint, he
cannot paint two rooms at the same time
Time dependencies:• End-start (task 1 must end before task 2 can begin)• Start-start (two tasks must begin at the same time, e. g.
simultaneous PR and advertising; forward militarymovement and logistics train activities.)
• End-end: two tasks must end at the same time. E. G.cooking: several ingredients must be ready at the rightmoment to combine together.
• Staggered start. Tasks that could possibly be done start-start,but might not actually require it, may be done staggered-startfor external convenience-related reasons.
Estimating TimeLapsed time: end date minus start date. Takes into accountweekends, other tasks.Task time: just the actual days required to do the job.Hofstadter’s law: things take longer than you planned for,even if you took Hofstadter’s law into account.
Discussion:
• Write short notes on• Activity Plan• Dependencies• Estimated Time• Activity-oriented
• Explain the need and importance of a Work Breakdownstructure.
• Construct a WBS for an Information Technology upgradeproject. Breakdown the work to at least third level for one ofthe WBS items. Make notes of questions you had whilecompleting this exercise.
• Create WBS for the following:• Hotel Management System• Railway Reservation System• Hospital Management System
Reference1. Carl L. Pritchard. Nuts and Bolts Series 1: How to Build a
Work Breakdown Structure.2. Project Management Institute. Project Management Institute
Practice Standard for Work Breakdown Structures.3. Gregory T. Haugan. Effective Work Breakdown Structures
(The Project Management Essential Library Series).
More information1. Noel N Harroff (1995, 2000) “The Work Breakdown
Structure”. Available at http://www.nnh.com/ev/wbs2.html
2. 4pm.com (undated) “Work Breakdown Structure”. Availableat http://www.4pm.com/articles/work_breakdown_structure.htm
3. University of Nottingham (November 2002) “WorkBreakdown Structure” for building the Compass studentportal. Available at http://www.eis.nottingham.ac.uk/compass/workstructure.html

54
DA
TA W
AR
EH
OU
SIN
G A
ND
DA
TA M
ININ
G
4. NASA Academy of Program and Project Leadership(undated) “Tools: work breakdown structure”. Collection ofdocuments available at http://appl.nasa.gov/perf_support/tools/tools_wbs.htm
5. Kim Colenso (2000) “Creating The Work BreakdownStructure”. Available at http://www.aisc.com/us/lang_en/library/white_papers/Creating_a_Work_Breakdown_Structure.pdf
Notes

55
DA
TA W
AR
EH
OU
SIN
G A
ND
DA
TA M
ININ
G
Structure• Objective• Introduction• Project Estimation• Analyzing probability & Risk
ObjectiveWhen you will complete this lesson you should be able to:• Understand the importance of Project Estimation.• Study about probability and Risk analysis.
IntroductionTo estimate budget and control costs, project managers andtheir teams must determine what physical resources (people,equipment and materials) and what quantities of thoseresources are required to complete the project. The nature ofproject and the organization will affect resource planning.Expert judgment and the availability of alternatives are the onlyreal tools available to assist in resource planning. It is importantto have people who have experience and expertise in similarprojects and with the organization performing this particularproject help determine what resources are necessary.Accurately planning and estimating software projects is anextremely difficult software management function. Feworganizations have established formal estimation processes,despite evidence that suggests organizations without formalestimation are four times more likely to experience cancelled ordelayed projects.
Project EstimationIn the 1970s, geologists at Shell were excessively confident whenthey predicted the presence of oil or gas. They would forexample estimate a 40% chance of finding oil, but when tensuch wells were actually drilled, only one or two would produce.This overconfidence cost Shell considerable time and money.Shell embarked on a training programme, which enabled thegeologists to be more realistic about the accuracy of theirpredictions. Now, when Shell geologists predict a 40% chanceof finding oil, four out of ten are successful.Software project managers are required to estimate the size of aproject. They will usually add a percentage for ‘contingency’, toallow for their uncertainty. However, if their estimates areoverconfident, these ‘contingency’ amounts may be insufficient,and significant risks may be ignored. Sometimes several such‘contingency’ amounts may be multiplied together, but this is aclumsy device, which can lead to absurdly high estimates, whilestill ignoring significant risks. In some cases, higher manage-ment will add additional ‘contingency’, to allow for the fallibilityof the project manager. Game playing around ‘contingency’ isrife.
LESSON 14PROJECT ESTIMATION, ANALYZING PROBABILITY AND RISK
This paper proposes that project managers be trained to bemore closely aware of the limitations of their own estimationpowers, which will lead to project plans that explicitly match theproject capabilities and risks, as well as contingency plans thatshould be more meaningful.Most organizations have difficulty estimating what it takes todeliver a data warehouse (DW). The time and effort to imple-ment an enterprise DW, let alone a pilot, is highly variable anddependent on a number of factors. The following qualitativediscussion is aimed toward estimating a pilot project. It can alsobe useful in choosing an acceptable pilot that falls within a timeschedule that is acceptable to management.Each of the following points can make a substantial differencein the cost, risk, time and effort of each DW project.1. What are the number of internal source systems and
database/files?Each source system along with its database and files will takeadditional research, including meetings with those who haveknowledge of data. The time to document the results of theresearch and meeting should also be included in the estimates.2. How many business processes are expected for the pilot?(Examples: analyze sales, analyze markets, and analyze financialaccounts.) a pilot should be limited to just one businessprocess. If management insists on more than one, the time andeffort will be proportionally greater.3. How many subject areas are expected for the pilot?(Examples: customer, supplier/vendor, store/location,product, organizational unit, demographic area of marketsegment, general ledger account, and promotion/campaign.)If possible, a pilot should be limited to just one subject area.If management insists on more than one, the time and effortwill be proportionally greater.4. Will a high-level enterprise model be developed during
the pilot?Ideally, an enterprise model should have been developed priorto the start of the DW pilot, if the model has not beenfinished and the pilot requires its completion. The schedule forthe pilot must be adjusted.5. How many attributes (fields, columns) will be selected
for the pilot?The more attributes to research understand, clean, integrate anddocument, the longer the pilot and the greater the effort.6. Are the source files well modeled and well documented?Documentation is critical to the success of the pilot. Extra timeand effort must be included if the source files and databaseshave not been well documented.

56
DA
TA W
AR
EH
OU
SIN
G A
ND
DA
TA M
ININ
G
7. Will there be any external data (Lundberg, A. C.Nielsen. Dun and Bradstreet) in the pilot system? Is theexternal system well documented?
External data is often not well documented and usually doesnot follow the organization standards. Integrating external datais often difficult and time consuming.8. Is the external data modeled? (Modeled, up-to-date,
accurate, actively being used and comprehensive; a highlevel accurate and timely mode! Exists: an old, out ofdate model exists; no model exists)
Without a model, the effort to understand the source externaldata is significantly greater. It’s unlikely that the external data hasbeen modeled, but external data vendors should find the saleof their data easier when they have models that effectivelydocument their products.9. How much cleaning will the source data require? (Data
need no cleaning, minor complexity, transformations,medium/moderate complexity; and very complicatedtransformation required)
Data cleansing both with and without software tools to aid theprocess is tedious and time consuming organizations usuallyoverestimate the quality of their data and always underestimatethe effort to clean the data.10. How much integration will be required? (None
required, moderate integration required, serious andcomprehensive integration required)
An example of integration is pulling customer data togetherform multiple internal files as well as from external data. Theabsence of consistent customer identifiers can cause significantwork to accurately integrate customer data.11. What the estimated size of the pilot database?Data warehouse Axiom #A – Large DW databases (100GB TO500GB) will always have performance problems. Resolvingthose problems (living within an update/refresh/backupwindow, providing acceptable query performance) will alwaystake significant time and effort.Data Warehouse Axiom #B – A pilot greater than 500 GB isnot a pilot; it’s a disaster waiting to happen.12. What is the service level requirement? (Five days/week,
eight hours/day; six days/weeks, eighteen hours/day;seven days/week, 24 hours/day)
It is always easier to establish an operational infrastructure aswell as a develop the update/refresh/backup scenarios for an8*% than for a 24*& schedule. It’s also easier for operationalpeople and DBAs to maintain a more limited scheduled uptime.13. How frequently will the data be loaded/updated/refreshed? (Monthly, weekly, daily, hourly)The more frequent the load/ update/refresh, the greater theperformance impact, If real time is every being considered, therequirement is for an operational, not a decision supportsystem.
14. Will it be necessary to synchronize the oper5ationalsystem with the data warehouse?
This is always difficult and will require initial planning, genera-tion procedures and ongoing effort form operations.15. Will a new hardware platform be required? If so, will to
different than the existing platform?The installation of new hardware always requires planning andexecution effort.If it is to be a new type of platform, operations training andfamiliarization takes time and efforts, a new operating systemrequires work by the technical support staff. There are newprocedures to follow, new utilities to learn and the shakedownand testing efforts for anything new is always time consumingand riddled with unexpected problems.16. Will new desktop swill require?New desktops require installation, testing and possible trainingof the users of the desktops.17. Will new network work be required?If a robust network (one that one handle the additional loadform the data warehouse with acceptable performance) is alreadyin place, shaken-out and tested, a significant amount of workand risk will be eliminated.18. Will network people be available?If network people are available, it will eliminate the need torecruit or train19. How many query tools will be chosen?Each new query tool takes time to train those responsible forsupport and time to train the end users.20. Is user management sold on and committed to this
project and what is the organization level at which thecommitment was made?
If management is not sold on the project, the risk is signifi-cantly greater. For the project manager, lack of managementcommitment means far more difficulty in getting resources(money, involvement) and getting timely answers.21. Where does the DW project manager’s report in the
organization?The higher up the project mangers report, the greater themanagement commitment, the more visibility and the more theindication that the project is important to the organization.22. Will the appropriate user be committed and available
for the project?If people important to the project are not committed andavailable, it will take far longer for the project to complete. Userinvolvement is essential to the success of any DW project.23. Will knowledgeable application developers
(programmers) be available for the migration process?These programmers need to be available when they are neededunavailability means the project will be delayed.24. How many trained and experienced programmer/
analysts will be available for system testing?If these programmer/analysts are not available, the will have tobe recruited and / or trained.

57
DA
TA W
AR
EH
OU
SIN
G A
ND
DA
TA M
ININ
G25. How many, trained an experienced systems analysts will
be assigned to the project full time?If an adequate number of these trained and experienced systemanalysts are not available full time, the will have to be recruitedand/or trained. A data warehouse project is not a part-timeoption. It requires the full dedication of team members.26. Will the DBAs be familiar with the chosen relational
database management systems (RDBMS), will theyexperienced in database design and will they beavailable for this project full time?
A new RDBMS requires recruitment or training, and there isalways a ramp up effort with software as critical as RDBMS.DBAs have different areas of expertise and to all DBAs willhave database design skill. Database design is a skill that ismandatory for designing a good DW. The DBA for the DWwill be very important and will require a full-time effort.27. Will technical support people be available for capacity
planning, performance monitoring and trouble-shooting?
A Data warehousing of any size will require the involvement oftechnical support people. Capacity planning is very difficult inthis environment as the ultimate size of the DW, user volumesand user access patterns can rarely be anticipated. However,What can be anticipated are performance problems that willrequire the constant attention of the technical support staff.28. Will be necessary to get an RFP (Request for Proposal)
for any of the data warehouse software tools?Some organizations require an RFP on software over a specificdollar amount. RFPs take time to write and to evaluate. It’seasier to get the information other ways without the need forand RFP.29. Will a CASE tool be chosen and will the data
administrators who use the CASE tool be available andexperienced?
A CASE tool should facilitate documentation, communicationwith the users and provide one of the sources of the DWmetadata. Data administrators are usually the folks who use theCASE tools. Their experience with one of the tools willexpedite the documentation, communication and meta-datapopulation processes.30. How many users are expected for the pilot?The more users, the more training, user support and the moreperformance issues that can be anticipated. More users meansmore changes and requests for additional function, and moreproblems that are uncovered that require resolution.31. How many queries/day/’user are expected and what is
the level of complexity? (simple, moderately complex,very complex)
The higher the volume of queries and the greater their complex-ity would indicate performance problems more user trainingrequired and misunderstanding of the ways to write accuratequeries.32. How comfortable and familiar are the users withdesktop computers and with the operating system (Win-dows, NT, OS/2)? (Very familiar and familiarity) What is
the level of sophistication of the users? (Power users,occasional users, little desktop experience)The users; level of familiarity and sophistication will dictate theamount of training and user support required.33. Will migration software will be chosen and used for the
pilot?Migration software will require training and time in the learningcurve, but should decrease the overall data migration effort.34. Will a repository be used for the pilot?A repository of some type is highly recommended of the DWbut it will require training, establishing standards for metadataand repository use as well as the effort to populate the reposi-tory.35. Are there any serious security issues? What audit
requirements need to be followed of the pilot?Security and audit require additional procedures (or at the leastthe implementation of existing procedures) and the time to testand satisfy those procedures.
Analyzing Probability & RiskIn life, most things result in a bell curve. The figure belowshows a sample bell curve that measures the likelihood of on-time project delivery. The graph measures the number ofprojects delivered late, on time, and early.As you can see in the figure the most likely outcome fails to thecenter of the curve. This type of graph is skewed in the center;hence, the terminology bell curve is taken from the shape. Thefollowing table1 summarizes the data presented in the figure.What this teaches us is we currently do time estimates incor-rectly. That is, trying to predict a single point will never work.The law of averages works against/us.
Table 1: Bell Curve Data Summary
Percentage Of projects
Delivered Days fro, Expected Delivery
25 33 days early or 35 days late 50 25 days early or 25 days late
75 8 days early or 13 late
Table 2 : Three-point Time Estimate Worksheet
Task Subtasks Best Case
Most Likely
Worst
Choosing Technical editor
The Determine Skill set
1.0 3.0 5.0
Screen candidates 1.0 2.0 3.0
Choose candidate 0.5 1.0 2.0
Total 2.5 6.0 10.0

58
DA
TA W
AR
EH
OU
SIN
G A
ND
DA
TA M
ININ
G
We should predict project time estimates like we predict rollingdice. Experience has taught us when a pair of dice is rolled; themost likely number to come up is seven. When you look atalternatives, the odds of a number other than seven coming upare less. You should test a three-point estimate the optimisticview, pessimistic view, and the most likely answer?Based on those answers. You can determine a time estimateTable 2 shows an example of a three point estimatedworksheet.As you can see from, Table 2 just the task of choosing thetechnical editor has considerable latitude in possible outcomes,yet each one of these outcomes, yet each one of these outcomeshas a chance of becoming reality. Within a given projectionmany of the tasks would come in on the best case guess andmany of the tasks will also come in on the worst case guess. Inaddition, each one of these outcomes has associated measurablerisks.We recommend you get away fro, single point estimates andmove toward three point estimates. By doing this, you will startto get a handle on your true risk. By doing this exercise withyour team members you will set everyone thinking about thetask and all the associated risks, what if a team member getssick? What if the computer breaks down what if someone getspulled away on another tasks? These things do happen and theydo affect the project.You are now also defining the acceptable level of performance.For example, if project team members came in with 25 days tochoose a technical editor, we would consider this irresponsible.WE would require a great deal of justification.Another positive aspect to the three-point estimate is itimproves the stakeholder’s morale. The customers will begin tofeel more comfortable because he or she will have an excellentcommand on the project. At the same time, when some tasksdo fall behind, everyone realizes this should be expected.Because the project takes all outcomes into consideration. Youcould still come in within the acceptable timelines. Pointestimates and improve the level of accuracy.
Discussions• Write notes on:
• Integration• RFP• External Data
• Discuss various points that can make a substantial differencein the cost, risk, time and effort of each DW project.
• Discuss Probability & Risk Analysis
Reference1. Hughes, Bob, Software project management, 2nd ed. New
Delhi: Tata McGraw- Hill Publishing, 1999.2. Kelkar, S.A., Software project management: a concise study, New
Delhi: Prentice Hall of India, 20023. Meredith, Jack R.; Mantel, Samuel J., Project management: a
managerial approach, New York: John Wiley and Sons, 2002.4. Royce, Walker, Software project management: a unified
framework, Delhi: Pearson Education Asia, 1998.5. Young, Trevor L., Successful project management, London:
Kogan Page, 2002.
Notes

59
DA
TA W
AR
EH
OU
SIN
G A
ND
DA
TA M
ININ
G
StructureObjectiveIntroductionRisk AnalysisRisk management
ObjectiveWhen you have completed this lesson you should be able to:• Understand the importance of Project Risk Management.• Understand what is Risk.• Identify various types of Risks.• Describe Risk Management Process• Discuss Critical Path Analysis
IntroductionProject Risk Management is the art and science of identifying,assigning and responding to risk throughout the life of aproject and in the best interests of meeting project objectives.Risk management can often result in significant improvementsin the ultimate success of projects. Risk management can have apositive impact on selecting projects, determining the scope ofprojects, and developing realistic schedules and cost estimates. Ithelps stakeholders understand the nature of the project,involves team members in defining strengths and weaknesses,and help to integrate the other project management areas.
Risk AnalysisAt a given stage in a project, there is a given level of knowledgeand uncertainty about the outcome and cost of the project. Theprobable cost can typically be expressed as a skewed bell curve,since although there is a minimum cost; there is no maximumcost.
There are several points of particular interest on this curve:
LESSON 15MANAGING RISK: INTERNAL AND EXTERNAL, CRITICAL PATH ANALYSIS
Minimum The lowest possible cost.
Mode The most likely cost.
This is the highest point on the curve.
Median
The midway cost of n projects.
(In other words, n/2 will cost less than the
median, and n/2 will cost more.)
Average The expected cost of n similar projects, divided by n.
Reasonable maximum
The highest possible cost, to a 95% certainty.
Absolute maximum
The highest possible cost, to a 100% certainty.
On this curve, the following sequence holds:Minimum < mode < median < average < reasonable maxi-mum < absolute maximumNote the following points:
• The absolute maximum cost may be infinite, although thereis an infinitesimal tail. For practical purposes, we can take thereasonable maximum cost. However, the reasonablemaximum may be two or three times as great as the averagecost.
• Most estimation algorithms aim to calculate the mode. Thismeans that the chance that the estimates will be achieved on asingle project is much less than 50%, and the chances that thetotal estimates will be achieved on a series of projects is evenlower. (In other words, you do not gain as much on theroundabouts as you lose on the swings.)
• A tall thin curve represents greater certainty, and a low broadcurve represents greater uncertainty.
• Risk itself has a negative value. This is why investorsdemand a higher return on risky ventures than on ‘gilt-edged’ securities. Financial number-crunchers use a measureof risk called ‘beta’.
• Therefore, any information that reduces risk has a positivevalue.

60
DA
TA W
AR
EH
OU
SIN
G A
ND
DA
TA M
ININ
G
This analysis yields the following management points:• A project has a series of decision points, at each of which the
sponsors could choose to cancel.• Thus at decision point k, the sponsors choose between
continuation, which is then expected to cost Rk, andcancellation, which will cost Ck.
• The game is to reduce risk as quickly as possible, and to placedecisions at the optimal points.
• This means we have to understand what specific informationis relevant to the reduction of risk, plan the project so thatthis information emerges as early as possible, and to placethe decision points immediately after this information isavailable.
Risk ManagementRisk management is concerned with identifying risks anddrawing up plans to minimize their effect on a project. A risk isa probability that some adverse circumstance will occur:• Project risks affect schedule or resources• Product risks affect the quality or performance of the
software being developed• Business risks affect the organization developing or
procuring the softwareThe risk management process has four stages:• Risk identification: Identify project, product and business
risks• Risk analysis: Assess the likelihood and consequences of
these risks• Risk planning: Draw up plans to avoid or minimize the
effects of the risk• Risk monitoring: Monitor the risks throughout the projectSome risk types that are applicable to software projects are:• Technology risks• People risks• Organizational risks• Requirements risks• Estimation risks
Risk Analysis• Assess probability and seriousness of each risk• Probability may be very low, low, moderate, high or very high• Risk effects might be catastrophic, serious, tolerable or
insignificantRisk planning steps are:1. Consider each risk and develop a strategy to manage that risk2. Avoidance strategies: The probability that the risk will arise is
reduced3. Minimization strategies: The impact of the risk on the
project or product will be reduced4. Contingency plans: If the risk arises, contingency plans are
plans to deal with that risk
To mitigate the risks in a software development project, amanagement strategy for every identified risk must be devel-oped.Risk monitoring steps are:• Assess each identified risks regularly to decide whether or not
it is becoming less or more probable• Also assess whether the effects of the risk have changed• Each key risk should be discussed at management progress
meetings
Managing Risks: Internal & ExternalWhen a closer look at risk. When you do get caught this istypically due to one of three situations:1. Assumptions – you get caught by unvoiced assumptions
which were never spelled out.2. Constraints – you get caught by restricting factors, which
were not fully understood.3. Unknowns – items you could never predict, by they are acts
of God or human errors.The key to risk management Is to do our best to identify thesource of all risk and the likelihood of its happening.,For example when we project plan, we typically do not takework stoppages into account. But if we were working for andairline that was under threat of major strike, we might reevaluate the likelihood of losing valuable project time.Calculate the cost to the project if the particular risk happensand make decision. You can decide either to accept it, find a wayto avoid it or to prevent it. Always look for ways around theobstacles.
Internal and External RisksDuncan Nevison lists the following types of internal risks:1. Project Characteristics
Schedule BumpsCost HiccupsTechnical Surprises
2. Company politicsCorporate Strategy ChangeDepartmental Politics
3. Project StakeholdersSponsorCustomerSubcontractorsProject Team
As well as the following external risks;1. Economy
• Currency Rate Change• Market Shift• Competitors Entry OR Exit• Immediate Competitive Actions• Supplier Change

61
DA
TA W
AR
EH
OU
SIN
G A
ND
DA
TA M
ININ
G2. Environment
• Fire, Famine, Flood• Pollution• Raw Materials
3. Government• Change in Law• Change in Regulation
By going through at this risk, you get a sense fo all the influ-ences that may impact your particular project. You should takethe time to assess and reassess these. For example; if yourproject is running severely behind schedule, is there anothervendor waiting to try to take the business? If your project isrunning way over budget, is there a chance, the funding may getcut? We must always be aware of the technology with which weare working. Familiarity with technology is important; we needto know if what we are working with is a new release of thesoftware or a release that has been out for a long time.
Critical Path AnalysisAfter your determination what must be done and how long itwill take, you are ready to start looking for your critical paths anddependencies. These critical paths are yet another form of riskwithin a project. For example, there a re inherent dependenciesamong many project activitiesA technical editor must be selected before the editing cycle of achapter can be completed. These are examples of dependencyanalysis.Let’s say we are working on a project with three unique lists ofactivities associated with it. Each unique path (A, B, C) ofactivities is represented based on its dependencies. Each cellrepresents the number of days that activity would take.By adding all the rows together, you tell the duration of eachpath. This is shown in table 3.Start A represents a part of the project with three steps, whichwill take a total of eight days. Start B represents a part of theproject with three steps, which will take a total of six days. StartC represents a path with two steps, which will take a total of 20days
Unique Task
Part # 1
Part # 2
Part # 3
Total
Start A 1 3 4 8 days
Start B 1 2 3 6 days
Start C 15 5 20 days
Table 3 : Critical Path AnalysisThe critical path is Start C. You must begin this as soon aspossible. In fact, this tells us the sooner this project can be doneis 20 days. If you do not start the activity that takes 15 days first,it will delay the entire project ending one day for each day youwait.
Self TestAs set of multiple choices given with every question, choose thecorrect answer for the following question.1. Which on is not an environmental risk
a. Technological changesb. Legal requirementsc. Government decisionsd. Office politics
2. What is a economic risk faced by projecta. Competitor’s exit or entryb. Supplier’s changec. Market shiftd. All of the above
3. Which of these is not internal riska. Policy changeb. Department structuresc. Sponsord. None of these
4. Which of these is an internal riska. Customer expectationsb. Regulatory changesc. Market factorsd. Monetary
5. The project estimation can get delayed because fo the reasona. Wrong assumptionsb. Constraintsc. Unknown factorsd. All of the above
6. Which one is not an environmental riska. Technological changesb. Legal requirementsc. Government decisionsd. Office politics
7. What is a economic risk faced by projecta. Competitor’s exit or entryb. Suppliers changec. Market shiftd. All of the above
8. Which of these is not an internal riska. Policy changeb. Department Structuresc. Sponsord. None of these
9. Which of these is an internal riska. Customer expectationsb. Regulatory changesc. Market factorsd. Monetary

62
DA
TA W
AR
EH
OU
SIN
G A
ND
DA
TA M
ININ
G
10. The project estimation can get delayed because of the reasona. Wrong assumptionsb. Constraintsc. Unknown factorsd. All of the above
Reference1. Hughes, Bob, Software project management, 2nd ed. New
Delhi: Tata McGraw- Hill Publishing, 1999.2. Kelkar, S.A., Software project management: a concise study, New
Delhi: Prentice Hall of India, 20023. Meredith, Jack R.; Mantel, Samuel J., Project management: a
managerial approach, New York: John Wiley and Sons, 2002.4. Royce, Walker, Software project management: a unified
framework, Delhi: Pearson Education Asia, 1998.5. Young, Trevor L., Successful project management, London:
Kogan Page, 2002.
Notes

63
DA
TA W
AR
EH
OU
SIN
G A
ND
DA
TA M
ININ
G
Structure• Objective• Introduction• Data mining• Data mining background• Inductive learning• Statistics• Machine Learning
ObjectiveWhen you have completed this lesson you should be able to:• Understand the basic concepts of data mining.• Discuss data mining background• Learn various concepts like Inductive learning, Statistics and
machine learning
IntroductionData mining is a discovery process that allows users to under-stand the substance of and the relationships between, theirdata. Data mining uncovers patterns and rends in the contentsof this information.I will briefly review the state of the art of this rather extensivefield of data mining, which uses techniques from such areas asmachine learning, statistics, neural networks, and geneticalgorithms. I will highlight the nature of the information thatis discov-ered, the types of problems faced in databases, andpotential applications.
Data MiningThe past two decades has seen a dramatic increase in theamount of information or data being stored in electronicformat. This accumulation of data has taken place at anexplosive rate. It has been estimated that the amount ofinformation in the world doubles every 20 months and the sizeand number of databases are increasing even faster. The increasein use of electronic data gathering devices such as point-of-saleor remote sensing devices has contributed to this explosion ofavailable data. Figure 1 from the Red Brick Company illustratesthe data explosion.
Figure 1: The Growing Base of Data
CHAPTER 4DATA MININGLESSON 16
DATA MINING CONCEPTS
Data storage became easier as the availability of large amountsof computing power at low cost i.e., the cost of processingpower and storage is falling, made data cheap. There was alsothe introduction of new machine learning methods forknowledge representation based on logic programming etc. inaddition to traditional statistical analysis of data. The newmethods tend to be computationally intensive hence a demandfor more processing power.Having concentrated so much attention on the accumulation ofdata the problem was what to do with this valuable resource? Itwas recognized that information is at the heart of businessoperations and that decision-makers could make use of the datastored to gain valuable insight into the business. DatabaseManagement systems gave access to the data stored but this wasonly a small part of what could be gained from the data.Traditional on-line transaction processing systems, OLTPs, aregood at putting data into databases quickly, safely and efficientlybut are not good at delivering meaningful analysis in return.Analyzing data can provide further knowledge about a businessby going beyond the data explicitly stored to derive knowledgeabout the business. This is where Data Mining or KnowledgeDiscovery in Databases (KDD) has obvious benefits for anyenterprise.The term data mining has been stretched beyond its limits toapply to any form of data analysis. Some of the numerousdefinitions of Data Mining, or Knowledge Discovery inDatabases are:Data Mining, or Knowledge Discovery in Databases(KDD) as it is also known, is the nontrivial extraction ofimplicit, previously unknown, and potentially usefulinformation from data. This encompasses a number ofdifferent technical approaches, such as clustering, datasummarization, learning classification rules, findingdependency net works, analyzing changes, and detectinganomalies.William J Frawley, Gregory Piatetsky-Shapiro and Christopher JMatheusData mining is the search for relationships and globalpatterns that exist in large databases but are ‘hidden’among the vast amount of data, such as a relationshipbetween patient data and their medical diagnosis. Theserelationships represent valuable knowledge about thedatabase and the objects in the database and, if the data-base is a faithful mirror, of the real world registered by thedatabase.Marcel Holshemier & Arno Siebes (1994)The analogy with the mining process is described as:Data mining refers to “using a variety of techniques toidentify nuggets of information or decision-making

64
DA
TA W
AR
EH
OU
SIN
G A
ND
DA
TA M
ININ
G
knowledge in bodies of data, and extracting these in such away that they can be put to use in the areas such as decisionsupport, prediction, forecasting and estimation. The data isoften voluminous, but as it stands of low value as no directuse can be made of it; it is the hidden information in thedata that is useful”Clementine User Guide, a data mining toolkitBasically data mining is concerned with the analysis of data andthe use of software techniques for finding patterns andregularities in sets of data. It is the computer, which is respon-sible for finding the patterns by identifying the underlying rulesand features in the data. The idea is that it is possible to strikegold in unexpected places as the data mining software extractspatterns not previously discernable or so obvious that no onehas noticed them before.Data mining analysis tends to work from the data up and thebest techniques are those developed with an orientationtowards large volumes of data, making use of as much of thecollected data as possible to arrive at reliable conclusions anddecisions. The analysis process starts with a set of data, uses amethodology to develop an optimal representation of thestructure of the data during which time knowledge is acquired.Once knowledge has been acquired this can be extended tolarger sets of data working on the assumption that the largerdata set has a structure similar to the sample data. Again this isanalogous to a mining operation where large amounts of low-grade materials are sifted through in order to find something ofvalue.The following diagram summarizes the some of the stages/processes identified in data mining and knowledge discovery byUsama Fayyad & Evangelos Simoudis, two of leading expo-nents of this area.
The phases depicted start with the raw data and finish with theextracted knowledge, which was acquired as a result of thefollowing stages:• Selection - selecting or segmenting the data according to
some criteria e.g. all those people who own a car, in this waysubsets of the data can be determined.
• Preprocessing - this is the data cleansing stage where certaininformation is removed which is deemed unnecessary andmay slow down queries for example unnecessary to note thesex of a patient when studying pregnancy. Also the data is
reconfigured to ensure a consistent format as there is apossibility of inconsistent formats because the data is drawnfrom several sources e.g. sex may recorded as f or m and alsoas 1 or 0.
• Transformation - the data is not merely transferred acrossbut transformed in that overlays may added such as thedemographic overlays commonly used in market research.The data is made useable and navigable.
• Data mining - this stage is concerned with the extraction ofpatterns from the data. A pattern can be defined as given aset of facts(data) F, a language L, and some measure ofcertainty C a pattern is a statement S in L that describesrelationships among a subset Fs of F with a certainty c suchthat S is simpler in some sense than the enumeration of allthe facts in Fs.
• Interpretation and evaluation - the patterns identified bythe system are interpreted into knowledge which can then beused to support human decision-making e.g. prediction andclassification tasks, summarizing the contents of a databaseor explaining observed phenomena.
Data Mining BackgroundData mining research has drawn on a number of other fieldssuch as inductive learning, machine learning and statistics etc.
Inductive LearningInduction is the inference of information from data andinductive learning is the model building process where theenvironment i.e. database is analyzed with a view to findingpatterns. Similar objects are grouped in classes and rulesformulated whereby it is possible to predict the class of unseenobjects. This process of classification identifies classes such thateach class has a unique pattern of values, which forms the classdescription. The nature of the environment is dynamic hencethe model must be adaptive i.e. should be able learn.Generally, it is only possible to use a small number of proper-ties to characterize objects so we make abstractions in thatobjects, which satisfy the same subset of properties, aremapped to the same internal representation.Inductive learning where the system infers knowledge itselffrom observing its environment has two main strategies:• Supervised learning - this is learning from examples where
a teacher helps the system construct a model by definingclasses and supplying examples of each class. The system hasto find a description of each class i.e. the common propertiesin the examples. Once the description has been formulatedthe description and the class form a classification rule, whichcan be used to predict the class of previously unseen objects.This is similar to discriminate analysis as in statistics.
• Unsupervised learning - this is learning from observationand discovery. The data mine system is supplied with objectsbut no classes are defined so it has to observe the examplesand recognize patterns (i.e. class description) by itself. Thissystem results in a set of class descriptions, one for each classdiscovered in the environment. Again this similar to clusteranalysis as in statistics.

65
DA
TA W
AR
EH
OU
SIN
G A
ND
DA
TA M
ININ
GInduction is therefore the extraction of patterns. The quality ofthe model produced by inductive learning methods is such thatthe model could be used to predict the outcome of futuresituations in other words not only for states encountered butrather for unseen states that could occur. The problem is thatmost environments have different states, i.e. changes within,and it is not always possible to verify a model by checking it forall possible situations.Given a set of examples the system can construct multiplemodels some of which will be simpler than others. The simplermodels are more likely to be correct if we adhere to Ockhamsrazor, which states that if there are multiple explanations for aparticular phenomena it makes sense to choose the simplestbecause it is more likely to capture the nature of the phenom-enon.
StatisticsStatistics has a solid theoretical foundation but the results fromstatistics can be overwhelming and difficult to interpret, as theyrequire user guidance as to where and how to analyze the data.Data mining however allows the expert’s knowledge of the dataand the advanced analysis techniques of the computer to worktogether.Statistical analysis systems such as SAS and SPSS have been usedby analysts to detect unusual patterns and explain patternsusing statistical models such as linear models. Statistics have arole to play and data mining will not replace such analyses butrather they can act upon more directed analyses based on theresults of data mining. For example statistical induction issomething like the average rate of failure of machines.
Machine LearningMachine learning is the automation of a learning process andlearning is tantamount to the construction of rules based onobservations of environmental states and transitions. This is abroad field, which includes not only learning from examples,but also reinforcement learning, learning with teacher, etc. Alearning algorithm takes the data set and its accompanyinginformation as input and returns a statement e.g. a conceptrepresenting the results of learning as output. Machine learningexamines previous examples and their outcomes and learnshow to reproduce these and make generalizations about newcases.Generally a machine learning system does not use singleobservations of its environment but an entire finite set calledthe training set at once. This set contains examples i.e. observa-tions coded in some machine-readable form. The training set isfinite hence not all concepts can be learned exactly.
Discussions• Write short notes on:
• KDD• Machine Learning• Inductive Learning• Statistics
• What is Data mining?
• Illustrate various stages of Data mining with the help of adiagram.
• “Inductive learning is a system that infers knowledge itselffrom observing its environment has two main strategies”.Discuss these two main strategies.
• Explain the need of Data mining.• Explain how Data mining helps in decision-making?
References1. Adriaans, Pieter, Data mining, Delhi: Pearson Education
Asia, 1996.2. Berson, Smith, Data warehousing, Data Mining, and OLAP,
New Delhi: Tata McGraw- Hill Publishing, 20043. Elmasri, Ramez, Fundamentals of database systems, 3rd ed.
Delhi: Pearson Education Asia, 2000.
Related Websites• www-db.stanford.edu/~ullman/mining/mining.html• www.cise.ufl.edu/class/cis6930fa03dm/notes.html• www.ecestudents.ul.ie/Course_Pages/Btech_ITT/
Modules/ET4727/lecturenotes.htm

66
DA
TA W
AR
EH
OU
SIN
G A
ND
DA
TA M
ININ
G
Notes

67
DA
TA W
AR
EH
OU
SIN
G A
ND
DA
TA M
ININ
G
Structure• Objective• Introduction• What is Data Mining?• Data Mining: Definitions• KDD vs Data mining,• Stages of KDD
• Selection• Preprocessing• Transformation• Data mining• Data visualization• Interpretation and Evaluation
• Data Mining and Data Warehousing• Machine Learning vs Data mining• DBMS vs Data mining• Data Warehousing• Statistical Analysis• Difference between Database management systems (DBMS),
Online Analytical Processing (OLAP) and Data Mining
ObjectiveWhen you have completed this lesson you should be able to:• Understand the basic concepts of data mining.• Study the concept of Knowledge Discovery of Data (KDD)• Study the relation between KDD and Data mining• Identify various stages of KDD• Understand the difference between Data mining and Data
warehousing• Learn various concepts like Inductive learning, Statistics and
machine learning• Understand the difference between data mining and DBMS• Understand the difference between Database management
systems (DBMS), Online Analytical Processing (OLAP) andData Mining
IntroductionLets revise the topic done in the previous lesson.Can you define the term “data mining”?Here is the answer: “Simply put, data mining is used to discoverpatterns and relationships in your data in order to help youmake better business decisions.”Herb Edelstein, Two Crows“The non trivial extraction of implicit, previously unknown,and potentially useful information from data”
LESSON 17DATA MINING CONCEPTS-2
William J Frawley, Gregory Piatetsky-Shapiro and Christopher JMatheusSome important points about Data mining:• Data mining finds valuable information hidden in large
volumes of data.• Data mining is the analysis of data and the use of software
techniques for finding patterns and regularities in sets ofdata.
• The computer is responsible for finding the patterns byidentifying the underlying rules and features in the data.
• It is possible to “strike gold” in unexpected places as the datamining software extracts patterns not previously discernibleor so obvious that no one has noticed them before.
• Mining analogy:• Large volumes of data are sifted in an attempt to find
something worthwhile.• In a mining operation large amounts of low-grade
materials are sifted through in order to find somethingof value.
What is Data Mining?Data mining in the non-trivial process of identifying valid,novel, potentially useful, and ultimately understandablepatterns in data. With the widespread use of databases and theexplosive growth in their sizes, organizations are faced with theproblem of information overload. The problem of effectivelyutilizing these massive volumes of data is becoming a majorproblem for all enterprises. Traditionally, we have been usingdata for querying a reliable database repository via some well-circumscribed application or canned report-generating utility.While this mode of interaction is satisfactory for a large class ofapplications, there exist many other applications, which demandexploratory data analyses. We have seen that in a data ware-house, the OLAP engine provides an adequate interface forquerying summarized and aggregate information acrossdifferent dimension-hierarchies. Though such methods arerelevant for decision support systems, these lack the exploratorycharacteristics of querying. The OLAP engine for a data ware-house (and query languages for DBMS) supports query-triggered usage of data, in the sense that the analysis is basedon a query posed by a human analyst. On the other hand, datamining techniques support automatic exploration of data. Datamining attempts to source out [patterns and trends in the dataand infers rules from these patterns. With these rules the userwill be able to support, review and examine decisions in somerelated business or scientific area. This opens up the possibilityof a new way of interacting with databases and data ware-houses. Consider, for example, a banking application where themanager wants to know whether there is a specific patternfollowed by defaulters. It is hard to formulate a SQL query for
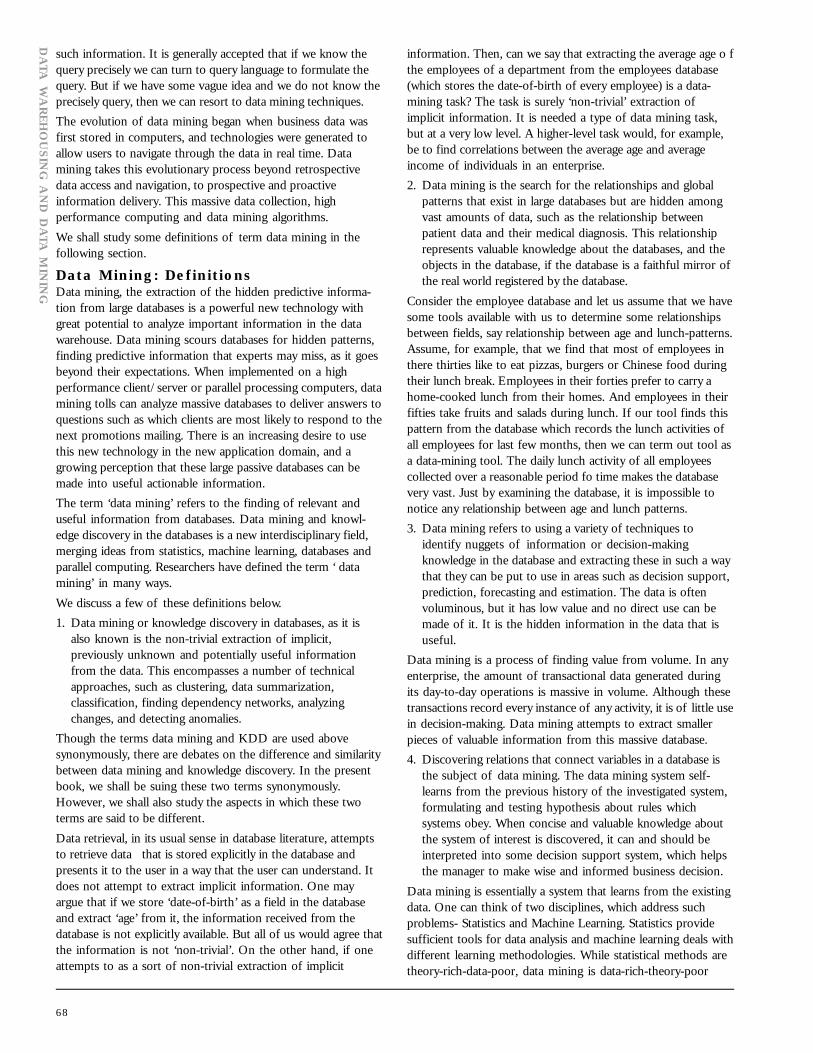
68
DA
TA W
AR
EH
OU
SIN
G A
ND
DA
TA M
ININ
G
such information. It is generally accepted that if we know thequery precisely we can turn to query language to formulate thequery. But if we have some vague idea and we do not know theprecisely query, then we can resort to data mining techniques.The evolution of data mining began when business data wasfirst stored in computers, and technologies were generated toallow users to navigate through the data in real time. Datamining takes this evolutionary process beyond retrospectivedata access and navigation, to prospective and proactiveinformation delivery. This massive data collection, highperformance computing and data mining algorithms.We shall study some definitions of term data mining in thefollowing section.
Data Mining: DefinitionsData mining, the extraction of the hidden predictive informa-tion from large databases is a powerful new technology withgreat potential to analyze important information in the datawarehouse. Data mining scours databases for hidden patterns,finding predictive information that experts may miss, as it goesbeyond their expectations. When implemented on a highperformance client/server or parallel processing computers, datamining tolls can analyze massive databases to deliver answers toquestions such as which clients are most likely to respond to thenext promotions mailing. There is an increasing desire to usethis new technology in the new application domain, and agrowing perception that these large passive databases can bemade into useful actionable information.The term ‘data mining’ refers to the finding of relevant anduseful information from databases. Data mining and knowl-edge discovery in the databases is a new interdisciplinary field,merging ideas from statistics, machine learning, databases andparallel computing. Researchers have defined the term ‘ datamining’ in many ways.We discuss a few of these definitions below.1. Data mining or knowledge discovery in databases, as it is
also known is the non-trivial extraction of implicit,previously unknown and potentially useful informationfrom the data. This encompasses a number of technicalapproaches, such as clustering, data summarization,classification, finding dependency networks, analyzingchanges, and detecting anomalies.
Though the terms data mining and KDD are used abovesynonymously, there are debates on the difference and similaritybetween data mining and knowledge discovery. In the presentbook, we shall be suing these two terms synonymously.However, we shall also study the aspects in which these twoterms are said to be different.Data retrieval, in its usual sense in database literature, attemptsto retrieve data that is stored explicitly in the database andpresents it to the user in a way that the user can understand. Itdoes not attempt to extract implicit information. One mayargue that if we store ‘date-of-birth’ as a field in the databaseand extract ‘age’ from it, the information received from thedatabase is not explicitly available. But all of us would agree thatthe information is not ‘non-trivial’. On the other hand, if oneattempts to as a sort of non-trivial extraction of implicit
information. Then, can we say that extracting the average age o fthe employees of a department from the employees database(which stores the date-of-birth of every employee) is a data-mining task? The task is surely ‘non-trivial’ extraction ofimplicit information. It is needed a type of data mining task,but at a very low level. A higher-level task would, for example,be to find correlations between the average age and averageincome of individuals in an enterprise.2. Data mining is the search for the relationships and global
patterns that exist in large databases but are hidden amongvast amounts of data, such as the relationship betweenpatient data and their medical diagnosis. This relationshiprepresents valuable knowledge about the databases, and theobjects in the database, if the database is a faithful mirror ofthe real world registered by the database.
Consider the employee database and let us assume that we havesome tools available with us to determine some relationshipsbetween fields, say relationship between age and lunch-patterns.Assume, for example, that we find that most of employees inthere thirties like to eat pizzas, burgers or Chinese food duringtheir lunch break. Employees in their forties prefer to carry ahome-cooked lunch from their homes. And employees in theirfifties take fruits and salads during lunch. If our tool finds thispattern from the database which records the lunch activities ofall employees for last few months, then we can term out tool asa data-mining tool. The daily lunch activity of all employeescollected over a reasonable period fo time makes the databasevery vast. Just by examining the database, it is impossible tonotice any relationship between age and lunch patterns.3. Data mining refers to using a variety of techniques to
identify nuggets of information or decision-makingknowledge in the database and extracting these in such a waythat they can be put to use in areas such as decision support,prediction, forecasting and estimation. The data is oftenvoluminous, but it has low value and no direct use can bemade of it. It is the hidden information in the data that isuseful.
Data mining is a process of finding value from volume. In anyenterprise, the amount of transactional data generated duringits day-to-day operations is massive in volume. Although thesetransactions record every instance of any activity, it is of little usein decision-making. Data mining attempts to extract smallerpieces of valuable information from this massive database.4. Discovering relations that connect variables in a database is
the subject of data mining. The data mining system self-learns from the previous history of the investigated system,formulating and testing hypothesis about rules whichsystems obey. When concise and valuable knowledge aboutthe system of interest is discovered, it can and should beinterpreted into some decision support system, which helpsthe manager to make wise and informed business decision.
Data mining is essentially a system that learns from the existingdata. One can think of two disciplines, which address suchproblems- Statistics and Machine Learning. Statistics providesufficient tools for data analysis and machine learning deals withdifferent learning methodologies. While statistical methods aretheory-rich-data-poor, data mining is data-rich-theory-poor

69
DA
TA W
AR
EH
OU
SIN
G A
ND
DA
TA M
ININ
Gapproach. On the other hand machine-learning deals withwhole gamut of learning theory, which most often data miningis restricted to areas of learning with partially specified data.5. Data mining is the process of discovering meaningful, new
correlation patterns and trends by sifting through largeamount of data stored in repositories, using patternrecognition techniques as well as statistical and mathematicaltechniques.
One important aspect of data mining is that it scans through alarge volume of to discover patterns and correlations betweenattributes. Thus, though there are techniques like clustering,decision trees, etc., existing in different disciplines, are notreadily applicable to data mining, as they are not designed tohandle Ii amounts of data. Thus, in order to apply statisticaland mathematical tools, we have to modify these techniques tobe able efficiently sift through large amounts of data stored inthe secondary memory.
KDD vs. Data MinningKnowledge Discovery in Database (KDD) was formalized in1989, with reference to the general concept of being broad andhigh level in the pursuit of seeking knowledge from data. Theterm data mining was then coined; this high-level applicationtechnique is used to present and analyze data for decision-makers.Data mining is only one of the many steps involved inknowledge discovery in databases. The various Steps in theknowledge discovery process include data selection, data cleaningand preprocessing, data transformation and reduction, datamining algorithm selection and finally the post-processing andthe interpretation of the discovered knowledge. The KDDprocess tends to be highly iterative and interactive. Data mininganalysis tends to work up from the data and the best techniquesare developed with an orientation towards large volumes ofdata, making use of as much data as Possible to arrive at reliableconclusions and decisions. The analysis process starts with a setof data, and uses a methodology to develop an optimalrepresentation of the structure of data, during which knowl-edge is acquired. Once knowledge is acquired, this can beextended to large sets of data on the assumption that the largedata set has a structure similar to the simple data set.Fayyad et al. distinguish between KDD and data mining bygiving the following definitions.Knowledge Discovery in Databases is, “Process of identifying avalid, potentially useful and ultimately understandable structurein data. This process involves selecting or sampling data from adata warehouse, cleaning or preprocessing it, transforming orreducing it (if needed), applying a data-mining component toproduce a structure, and then evaluating the derived structure.Data Mining is a step in the KDD process concerned with thealgorithmic means by which patterns or structures are enumer-ated from the data under acceptable computational efficiencylimitations”.Thus, the structures that arc the outcome of the data miningprocess must meet certain conditions so that these can beconsidered as knowledge. These conditions are: validity,understandability, utility, novelty and interestingness.
Stages OF KDDThe stages of KDD, starting with the raw data and finishingwith the extracted knowledge, are given below.
SelectionThis stage is concerned with selecting or segmenting the datathat are relevant to some criteria. For example, for credit cardcustomer profiling, we extract the type of transactions for eachtype of customers and we may not be interested in details ofthe shop where the transaction takes place.
PreprocessingPreprocessing is the data cleaning stage where unnecessaryinformation is removed. For example, it is unnecessary to notethe sex of a patient when studying pregnancy! When the data isdrawn from several sources, it is possible that the sameinformation represented in different sources in differentformats. This stage reconfigures the data to ensure a consistentformat, as there is a possibility of inconsistent formats.
TransformationThe data is not merely transferred across, but transformed inorder to be suitable the task of data mining. In this stage, thedata is made usable and navigable.
Data MiningThis stage is concerned with the extraction of patterns from thedata.
Interpretation and EvaluationThe patterns obtained in the data mining stage are convertedinto knowledge, which turn, is used to support decision-making.
Data VisualizationData visualization makes it possible for the analyst to gain adeeper, more intuitive understanding of the data and as suchcan work well alongside data mining. Data mining allows theanalyst to focus on certain patterns and trends and explore themin depth using visualization. On its own, data visualization canbe overwhelmed by the volume of data in a database but inconjunction with data mining can help with exploration.Data visualization helps users to examine large volumes of dataand detect patterns visually. Visual displays of data such asmaps, charts and other graphics representations allow data to bepresented compactly to the users. A single graphical screen canencode as much information as can a far larger, number of textscreens. For example, if a user wants to find out whether theproduction problems at a plant are correlated to the location ofthe plants, the problem locations can be encoded in a specialcolor, say red, on a map. The user can then discover locations inwhich the problems are occurring. He may then form a hypoth-esis about why problems are occurring in those locations, andmay verify the hypothesis against the database.
Data Mining and Data WarehousingThe goal of a data warehouse is to support decision makingwith data. Data mining can be used in conjunction with a datawarehouse to help with certain types of decisions. Data miningcan be applied to operational databases with individualtransactions. To make data mining more efficient, the datawarehouse should have an aggregated’ or summarized collec-

70
DA
TA W
AR
EH
OU
SIN
G A
ND
DA
TA M
ININ
G
tion of data. Data mining helps in extracting meaningful newpatterns that cannot be found necessarily by merely querying orprocessing data or metadata in the data warehouse. Data miningapplications should therefore be strongly considered early,during the design of a data warehouse. Also, data mining toolsshould be designed to facilitate their use in conjunction withdata ware-houses. In fact, for very large databases ‘running intoterabytes of data, successful use of database mining applica-tions will depend, first on the construction of a datawarehouse.
Machine Learning vs. Data Mining• Large Data sets in Data Mining• Efficiency of Algorithms is important• Scalability of Algorithms is important• Real World Data• Lots of Missing Values• Pre-existing data - not user generated• Data not static - prone to updates• Efficient methods for data retrieval available for use• Domain Knowledge in the form of integrity constraints
available.
Data Mining vs. DBMS• Example DBMS Reports
• Last months sales for each service type• Sales per service grouped by customer sex or age
bracket• List of customers who lapsed their policy
• Questions answered using Data Mining• What characteristics do customers that lapse their policy
have in common and how do they differ fromcustomers who renew their policy?
• Which motor insurance policy holders would bepotential customers for my House Content Insurancepolicy?
Data Warehouse• Data Warehouse: centralized data repository, which can be
queried for business benefit.• Data Warehousing makes it possible to
• Extract archived operational data• Overcome inconsistencies between different legacy data
formats• Integrate data throughout an enterprise, regardless of
location, format, or communication requirements• Incorporate additional or expert information
Statistical Analysis
• Ill-suited for Nominal and Structured Data Types• Completely data driven - incorporation of domain
knowledge not possible• Interpretation of results is difficult and daunting
• Requires expert user guidanceDifference between Database management systems(DBMS), Online Analytical Processing (OLAP) and DataMining
Area DBMS OLAP Data Mining
Task Extraction of detailed and summary data
Summaries, trends and forecasts
Knowledge discovery of hidden patterns and insights
Type of result Information Analysis Insight and
Prediction
Method
Deduction (Ask the question, verify with data)
Multidimensional data modeling, Aggregation, Statistics
Induction (Build the model, apply it to new data, get the result)
Example question
Who purchased mutual funds in the last 3 years?
What is the average income of mutual fund buyers by region by year?
Who will buy a mutual fund in the next 6 months and why?
Discussion• What is data mining?• Discuss the role of data mining in data warehousing.• How a data mining different from KDD?• Explain the stages of KDD.• Write an essay on “Data mining: Concepts, Issues and
Trends”.• How can you link data mining with a DBMS?• Explain the difference between a KDD and Data mining.• Correctly contrast the difference between Database
Management System, OLAP and Data mining?
References1. Adriaans, Pieter, Data mining, Delhi: Pearson Education
Asia, 1996.2. Berson, Smith, Data warehousing, Data Mining, and OLAP,
New Delhi: Tata McGraw- Hill Publishing, 20043. Elmasri, Ramez, Fundamentals of database systems, 3rd ed.
Delhi: Pearson Education Asia, 2000.
Related Websites• www-db.stanford.edu/~ullman/mining/mining.html• www.cise.ufl.edu/class/cis6930fa03dm/notes.html• www.ecestudents.ul.ie/Course_Pages/Btech_ITT/
Modules/ET4727/lecturenotes.htm

71
DA
TA W
AR
EH
OU
SIN
G A
ND
DA
TA M
ININ
G

72
DA
TA W
AR
EH
OU
SIN
G A
ND
DA
TA M
ININ
G
Notes

73
DA
TA W
AR
EH
OU
SIN
G A
ND
DA
TA M
ININ
G
Structure
• Objective• Introduction• Elements and uses of Data Mining• Relationships & Patterns• Data mining problems/issues
• Limited Information• Noise and missing values• Uncertainty• Size, updates, and irrelevant fields
• Potential Applications• Retail/Marketing• Banking
• Insurance and Health Care• Transportation• Medicine
• Data Mining and Data WarehousingData Mining as a Part of the Knowledge Discovery ProcessObjectiveAt the end of this lesson you will be able to• Understand various elements and uses of Data mining• Study the importance and role of relationships and patterns
in data mining• Study various issues related to Data mining• Identify potential applications of data mining• Understand how data mining is a part of KDD
IntroductionAfter studying the previous lessons, you must have understoodthe meaning and significance of Data mining. In this lesson, Iwill explain you about various elements and uses of Datamining. You will study the importance and role of relationshipsand patterns in data mining. There are various issues related toData mining, I will discuss all these issues in this lesson. Youwill also study various potential applications of data mining.Apart from the above topics, I will also tell you how datamining is a part of KDD.
Elements and uses of Data MiningData mining consists of five major elements:1. Extract, transform and load transaction data onto the data
warehouse system.2. Store and manage the data in a multidimensional database
system.3. Provided data access to business analysts and information
technology professionals.
LESSON 18ELEMENTS AND USES OF DATA MINING
4. Analyze the data by application software.5. Present the data in a useful format such as a graph or a table.
Relationships & Patterns• Discovering relationships is key to successful marketing.• In operational or data warehouse system, the data architect
and design personnel have meticulously defined entities andrelationships.
• An entity is a set of information containing fact about arelated set of data. The discovery process in a data miningexercise sheds light on relationships hidden deep down inmany layers of corporate data.
• The benefits of pattern discovery to a business add real valueto a data mining exercise. No one can accurately predict thatperson X is going to perform activity in close proximity withactivity Z.
• Using data mining techniques & systematic analysis onwarehouse data, however this prediction can be backed up bythe detection of patterns behavior.
• Patterns are closely related to habit; in other words, thelikelihood of an activity being performed in closelyproximity to another activity is discovered in the midst ofidentifying a pattern.
• Some operational systems in the midst of satisfying dailybusiness requirements create vast amount of data.
• The data is complex and the relationships between elementsare not easily found by the naked eye.
• We need Data mining Softwares to do these tasks.• Insightful Miner• XAffinity
Data Mining Problems/IssuesData mining systems rely on databases to supply the raw datafor input and this raises problems in that databases tend bedynamic, incomplete, noisy, and large. Other problems arise as aresult of the adequacy and relevance of the information stored.
Limited InformationA database is often designed for purposes different from datamining and sometimes the properties or attributes that wouldsimplify the learning task are not present nor can they berequested from the real world. Inconclusive data causesproblems because if some attributes essential to knowledgeabout the application domain are not present in the data it maybe impossible to discover significant knowledge about a givendomain. For example cannot diagnose malaria from a patientdatabase if that database does not contain the patients’ redblood cell count.

74
DA
TA W
AR
EH
OU
SIN
G A
ND
DA
TA M
ININ
G
Noise and missing valuesDatabases are usually contaminated by errors so it cannot beassumed that the data they contain is entirely correct. Attributes,which rely on subjective or measurement judgments, can giverise to errors such that some examples may even be mis-classified. Error in either the values of attributes or classinformation are known as noise. Obviously where possible it isdesirable to eliminate noise from the classification informationas this affects the overall accuracy of the generated rules.Missing data can be treated by discovery systems in a number ofways such as;• simply disregard missing values• omit the corresponding records• infer missing values from known values• treat missing data as a special value to be included
additionally in the attribute domain• or average over the missing values using Bayesian techniques.Noisy data in the sense of being imprecise is characteristic of alldata collection and typically fit a regular statistical distributionsuch as Gaussian while wrong values are data entry errors.Statistical methods can treat problems of noisy data, andseparate different types of noise.
UncertaintyUncertainty refers to the severity of the error and the degree ofnoise in the data. Data precision is an important considerationin a discovery system.
Size, Updates, and Irrelevant FieldsDatabases tend to be large and dynamic in that their contentsare ever-changing as information is added, modified orremoved. The problem with this from the data miningperspective is how to ensure that the rules are up-to-date andconsistent with the most current information. Also the learningsystem has to be time-sensitive as some data values vary overtime and the discovery system is affected by the ‘timeliness’ ofthe data.Another issue is the relevance or irrelevance of the fields in thedatabase to the current focus of discovery for example postcodes are fundamental to any studies trying to establish ageographical connection to an item of interest such as the salesof a product.
Potential ApplicationsData mining has many and varied fields of application some ofwhich are listed below.
Retail/Marketing• Identify buying patterns from customers• Find associations among customer demographic
characteristics• Predict response to mailing campaigns• Market basket analysis
Banking• Detect patterns of fraudulent credit card use• Identify ‘loyal’ customers
• Predict customers likely to change their credit card affiliation• Determine credit card spending by customer groups• Find hidden correlations between different financial
indicators• Identify stock trading rules from historical market data
Insurance and Health Care• Claims analysis - i.e which medical procedures are claimed
together• Predict which customers will buy new policies• Identify behaviour patterns of risky customers• Identify fraudulent behaviour
Transportation• Determine the distribution schedules among outlets• Analyse loading patterns
Medicine• Characterise patient behaviour to predict office visits• Identify successful medical therapies for different illnesses
Data Mining and Data WarehousingThe goal of a data warehouse is to support decision makingwith data. Data mining can be used in conjunction with a datawarehouse to help with certain types of decisions. Data miningcan be applied to operational databases with individualtransactions. To make data mining more efficient, the datawarehouse should have an aggregated’ or summarized collec-tion of data. Data mining helps in extracting meaningful newpatterns that cannot be found necessarily by merely querying orprocessing data or metadata in the data warehouse. Data miningapplications should therefore be strongly considered early,during the design of a data warehouse. Also, data mining toolsshould be designed to facilitate their use in conjunction withdata ware-houses. In fact, for very large databases ‘running intoterabytes of data, successful use of database mining applica-tions will depend, first on the construction of a datawarehouse.
Data Mining as a Part of the Knowledge DiscoveryProcessKnowledge Discovery in Databases, frequently abbreviated asKDD, typically encompasses more than data mining. Theknowledge discovery process comprises six phases: 6 dataselection, data cleansing, enrichment, data transformation orencoding, data mining, and the reporting and display of thediscovered information.As an example, consider a transaction database maintained by aspecialty consumer goods retailer. Suppose the client dataincludes a customer name, zip code, phone num-ber, date ofpurchase, item code, price, quantity, and total amount. A varietyof new knowledge can be discovered by KDD processing onthis client database. During data selec-tion, data about specificitems or categories of items, or from stores in a specific regionor area of the country, may be selected. The data cleansingprocess then may correct invalid zip codes or eliminate recordswith incorrect phone prefixes. Enrichment typically enhances thedata with additional sources of information. For example,

75
DA
TA W
AR
EH
OU
SIN
G A
ND
DA
TA M
ININ
Ggiven the client names and phone numbers, the store maypurchase other data about age, income, and credit rating andappend them to each record. Data transformation and encodingmay be done to reduce the amount of data. For instance, itemcodes may be grouped in terms of product categories intoaudio, video, supplies, electronic gadgets, camera, accessories,and ;0 on. Zip codes may be aggregated into geographicregions; incomes may be divided into Len ranges, and so on.
Goals of Data Mining and KnowledgeDiscoveryBroadly speaking, the goals of data mining fall into thefollowing classes: Prediction, identification, classification, andopti-mization.• Prediction - Data mining can show how certain attributes
within the data will behave in the future. Examples ofpredictive data mining include the analysis of buy-ingtransactions to predict what consumers will buy under certaindiscounts, how much sales volume a store would generate ina given period, and whether deleting a product line wouldyield more profits. In such applications, business logic isused cou-pled with data mining. In a scientific context,certain seismic wave patterns may pre-dict an earthquake withhigh probability.
• Identification - Data patterns can be used to identify theexistence of an item, an event, or an activity. For example,intruders trying to break a system may be identified by theprograms executed, files accessed, and CPU time per session.In biological applica-tions, existence of a gene may beidentified by certain sequences of nucleotide symbols in theDNA sequence. The area known as authentication is a formof identification .It ascertains whether a user is indeed a’specific’ user or one from an authorized class; it involves acomparison of parameters or images or signals against adatabase.
• Classification - Data mining can partition the data so thatdifferent classes or categories can be identified based oncombinations of parameters. For example, customer in asupermarket can be categorized into discount-seekingshoppers, shoppers in a rush, loyal regular shoppers, andinfrequent shoppers. This classification may be in differentanalyses of customer buying transactions as a post-miningactivity times classification based on common domainknowledge is used as an input to decompose the miningproblem and make it simpler. For instance, health foods,party foods, or school lunch foods are distinct categories inthe supermarket business. It -makes sense to analyzerelationships within and across categories as separate prob-lems. Such, categorization may be used to encode the dataappropriately before subjecting it to further data mining.
• Optimization - One eventual goal of data mining may be tooptimize the use off limited resources such as time, space,money, or materials and to maximize output variables suchas sales or profits under a given set of constraints. As such,this goal of mining resembles the objective function used inoperations research problems deals with optimization underconstraints.
The term data mining is currently used in a very broad sense. Insome situation includes statistical analysis and constrainedoptimization as well as machine. There is no sharp lineseparating data mining from these disciplines. It is beyond ourscope, therefore, to discuss in detail the entire range of applica-tions that make up this body of work.Types of Knowledge Discovered during Data MiningThe term “knowledge” is broadly interpreted as involving somedegree of intelligence. Knowledge is often class inductive anddeductive. Data mining addresses inductive knowledge.Knowledge can be represented in many forms in an unstruc-tured sense; it can be represented by rules, or prepositional logic.In a structured form, it may be represented in decision trees,semantic networks, neural works, or hierarchies of classes orframes. The knowledge discovered during data mining can bedescribed in five ways, as follows.1. Association. Rules-These rules correlate the presence of a
set of items another range of values for another set ofvariables. Examples: (1) When a _ retail shopper buys ahandbag, she is likely to buy shoes. (2) An X-ray imagemaintaining characteristics a and b is likely to also exhibitcharacteristic c.
2. Classification hierarchies-The goal is to work from anexisting set of even a transaction to create a hierarchy ofclasses. Examples: (1) A population may be -divided intofive ranges of credit worth -iness based on a history ofprevious co transactions. (2) A model may be developed forthe factors that determine desirability of location of a. store-on a 1-10 scale. (3) Mutual funds may be classified based onperformance data using characteristics such as growth,income, and stability.
3. Sequential patterns-A sequence of actions or events issought. Example: If a patient underwent cardiac bypasssurgery for blocked arteries and an aneurysm and laterdeveloped high blood urea within a year of surgery, he or sheis likely to suffer from kidney failure within the next 18months. Detection of sequential pat-terns is equivalent todetecting association among events with certain temporalrelationships.
4. Patterns within time series-Similarities can be detectedwithin positions of the time series. Three examples followwith the stock market price data as a time series: (1) Stocks ofa utility company ABC Power and a financial company XYZSecurities show the same pattern during 1998 in terms ofclosing stock price. (2) Two products show the same sellingpattern in summer but a different one in win-ter. (3) Apattern in solar magnetic wind may be used to predictchanges in earth atmospheric conditions
5. Categorization and segmentation-: A given population ofevents or items can be partitioned (segmented) into sets of“similar” elements. Examples: (1) An entire population oftreatment data on a disease may be divided into groupsbased on the similarity of side effects produced. (2) Theadult popu1ation in the United States may be categorizedinto five groups from “most likely to buy” to “least likely tobuy” a new product. (3) The web accesses made by acollection of users against a set of documents (say, in a

76
DA
TA W
AR
EH
OU
SIN
G A
ND
DA
TA M
ININ
G
digital library) may be analyzed in. terms of the key-words ofdocuments to reveal clusters or categories of Users.
For most applications, the desired knowledge is a combinationof the above types. We expand on each of the above knowledgetypes in the following subsections.
Discussions• Write short notes on:
• Association Rules• Discuss various elements and uses of data mining.• Explain the significance of relationship and pattern in data
mining.• Give some examples of Operational systems.
References1. Adriaans, Pieter, Data mining, Delhi: Pearson Education
Asia, 1996.2. Anahory, Sam, Data warehousing in the real world: a practical
guide for building decision support systems, Delhi: PearsonEducation Asia, 1997.
3. Berry, Michael J.A. ; Linoff, Gordon, Mastering data mining: the art and science of customer relationship management, NewYork : John Wiley & Sons, 2000
4. Elmasri, Ramez, Fundamentals of database systems, 3rd ed.Delhi: Pearson Education Asia, 2000.
5. Berson, Smith, Data warehousing, Data Mining, and OLAP,New Delhi: Tata McGraw- Hill Publishing, 2004
Related Websites• www-db.stanford.edu/~ullman/mining/mining.html• www.cise.ufl.edu/class/cis6930fa03dm/notes.html• www.ecestudents.ul.ie/Course_Pages/Btech_ITT/
Modules/ET4727/lecturenotes.htm

77
DA
TA W
AR
EH
OU
SIN
G A
ND
DA
TA M
ININ
G
Notes

78
DA
TA W
AR
EH
OU
SIN
G A
ND
DA
TA M
ININ
G
Structure• Objective• Introduction• Data, Information and Knowledge• Information• Knowledge• Data warehouse• What can Data Mining Do?• How Does Data Mining Work?• Data Mining in a Nutshell• Differences between Data Mining and Machine Learning
ObjectiveAt the end of this lesson you will be able to• Understand the meaning and difference of Data,
Information and knowledge• Study the need of data mining• Understand the working of data mining• Study the difference between Data Mining and Machine
Learning
IntroductionIn the previous lesson you have studied various elements anduses of data mining. In this lesson, I will explain you thedifference and significance of Data, information and knowledge.Further, you will also study about the need and working ofdata mining.
Data, Information and KnowledgeData are any facts, numbers, or text that can be processed by acomputer. Today, organizations are accumulating vast andgrowing amounts of data in different formats and differentdatabases. This includes• Operational or transactional data such as sales, cost,
inventory, payroll, accounting.• Non-operational data such as industry sales, forecast data,
and macro economic data.• Meta data-data about the data itself, such as logical database
design or data dictionary definitions
InformationThe patterns, associations, or relationships among all this datacan provide information. For example, analysis of retail pointof sale transaction data can yield information on which productare selling and when.Meta data-data about the data itself, such as logical databasedesign or data dictionary definitions
LESSON 19DATA INFORMATION AND KNOWLEDGE
KnowledgeInformation can be converted into knowledge about historicalpatterns and future trends. For example summary informationon retail supermarket sales can be analyzed in light of promo-tional efforts to provide knowledge of consumer buyingbehavior. Thus, a manufacturer or retailer could determinewhich items are most susceptible to promotional efforts.
Data WarehouseDramatic advances in data capture, processing power, datatransmission and storage capabilities are enabling organizationto integration their various databases into data warehouses.Data warehousing is defined as a process of centralized datamanagement and retrieval. Data warehousing, like data mining,is a relatively new term although the concept itself has beenaround for years. Data warehousing represents an ideal visionof maintaining a central repository of all organizational data.Centralization of data is needed to maximize user access andanalysis. Dramatic technological advances are making this visiona reality for many companies. And, equally dramatic advances indata analysis software is what support data mining.
What can Data Mining do?Data mining is primarily used today by companies with a strongconsumer focus retail, financial communication, and marketingorganizations. It enables these companies to determinerelationships among “ internal” factors such as price, productpositioning, or staff skills and external factors such as economicindicators, competition and customer demographics. And itcorporate profits. Finally, it enables them to “drill down” intosummary information to view detail transactional data.With data mining, a retailer could use point of sale records ofcustomer purchase to send targeted promotions based on anindividual’s purchase history. By mining demographic data fromcomment or warranty cards, the retailer could develop productsand promotions to appeal to specific customer segments. Forexample, Blockbuster Entertainment mines its video rentalhistory database to recommend rentals to individual customers.American Express can suggest products to its cardholders basedon analysis of their monthly expenditures.Wal-Mart is pioneering massive data mining to transform itssupplier relationships. Captures point of sale transactions fromover 2,900 stores in 6 countries and continuously transmits thisdata to its massive 7.5 terabyte tera data warehouse. Wal-Martallows more than 3,500 suppliers, to access data on theirproducts and perform data analyses. These suppliers use thisdata to identify customer-buying patterns at the store displaylevel. They use this information to mange local store inventoryand identify new merchandising opportunities. In 1995, Wal-mart computers processed over 1 million complex queries.

79
DA
TA W
AR
EH
OU
SIN
G A
ND
DA
TA M
ININ
GThe national Basketball Association (NBA) is exploring a datamining application that can be used in conjunction with imagerecordings of basketball games. The Advanced Scout softwareanalyzes the movement of players to help coaches orchestrateplayers and strategies. For example and analysis of the play byplay sheet of the game played between the NEW YORK Knickand the Cleveland Cavaliers on January 6, 1995 reveals thatwhen mark price played the guard position, john Williamsattempted four jump shots and made each one! Advancedscout not only finds this pattern, but also explains that it isinteresting because it differs considerably form the averageshooting percentage of 49.30%, for the cavaliers during thatgame.By using the NBA universal clock, a coach can automaticallybring up the video clips showing each of the jump shotsattempted by Williams with price on the floor, without needingto comb through hours of video footage. Those clips showvery successful picks and roll pay in which price draws the knick’sdefense, and then finds Williams for and open jumps shot.
How does Data Mining Work?While large-scale information technology has been evolvingseparate transaction and analytical systems, data miningprovides the link between the two. Data mining softwareanalyzes relationships and patterns in stored transaction databased on open-ended user queries. Several type of analyticalsoftware is available: statistical, machine learning, and neuralnetworks. Generally, any of four types of relationships aresought:Classes: Stored data is used to locate data in predeterminedgroups. For example, a restaurant chain could mine customerpurchase data to determine when customers visit and what theytypically order. This information could be used to increase trafficby having daili specialsClusters: Data items are grounded according to logical relation-ship or consumer preferences; For example, data can be minedto identify market segments or consumer affinities.Association: Data can be mined to identify associations. Thebeer diaper example is an example of associative mining.Sequential patterns: Data is mined to anticipate behaviorpatterns and trends. For example, an outdoor equipmentretailer could predict the likelihood of a backpack beingpurchased based on a consumer’s purchase of sleeping bags andhiking shoes.
Data Mining in a NutshellThe past two decades has seen dramatic increases in the amountof information or data being stored in electronic format. Thisaccumulation of data has taken palace at an explosive rate. It hasbeen estimated that the amount of information in the worlddoubles every 20 months and number of databases areincreasing even faster. The increase in use of electronic datagathering devices such as point-of-sale or remote sensingdevices has contributed to this explosion of available data.Figure 1 form the red brick company illustrates the dataexplosion.
Data storage becomes easier as the availabilities of large amountcomputing power at low cost i.e., the cost of processing powerand storage is falling, made data cheap. There was also aintroduction of few machine learning method for statisticalanalysis of data. The new method tend to be computationallyintensive hence a demand for more processing power.Having concentrated so much attention of the accumulation ofdata the problem was what to do with this valuable resource? Itwas recognize that information is at the heart of businessoperations and that decision-markets could make use of thedata stored to gain valuable insight into the business. DatabaseManagement systems gave access to the data stored but this wasonly a small part of what would be gained from the data.Traditional on-line transaction processing system, OLTP, Saregoods at putting data into database quickly, safely and efficientlybut are not good at delivering meaningful analysis in return.Analyzing data can provide further knowledge about a businessby going beyond the data explicitly stored to derive knowledgeabout the business. This is where data mining or knowledgediscovery in data base (KDD) has obvious for any enterprise.The term data mining has been stretched beyond its limits toapply to any form of data analysis. Some of the numerousdefinitions of data mining, or knowledge discovery in databaseare:Data mining or knowledge discovery in database (KDD) as it isalso known is the nontrivial extraction of implicit, previouslyunknown, and potentially useful information from data. Thisencompasses a number of different technical approaches, suchas clustering, data summarization learning classification rulesfinding dependency net works analyzing changes and detectinganomalies.Willam J frawley, Gregory piatetsky – Shapiro and christopher jmatheus Data ming is the search of relationships and globalpatterns that exit in large database but are hidden among thevast amount of data such as a relationship between patient dataand their medical diagnosis. These relationships representvaluable knowledge about the database and the object in thedatabase and if the database is a faithful mirror; of the realworld registered by the database.Data mining analysis tends to work from the data up and thebest techniques are those developed with an orientationtowards large volumes of data, making use of as much of thecollected data as possible to arrive at reliable conclusions anddecisions. The analysis process starts with a set of data, uses amethodology to develop an optimal representation of thestructure of the data during which time knowledge id acquired.Once knowledge has been acquired this can be extended tolarger data set has a structure similar to the sample data. Againthis is analogous to a mining operation where large amounts oflow-grade materials are sifted through in order to find some-thing of value.Differences between Data Mining and Machine LearningKnowledge Discovery in Databases (KDD) or Data Mining,and the part of Machine Learning (ML) dealing with learningfrom examples overlap in the algorithms used and the prob-lems addressed.The main differences are:

80
DA
TA W
AR
EH
OU
SIN
G A
ND
DA
TA M
ININ
G
• KDD is concerned with finding understandable knowledge,while ML is concerned with improving performance of anagent. So training a neural network to balance a pole is partof ML, but not of KDD. However, there are efforts toextract knowledge from neural networks, which are veryrelevant for KDD.
• KDD is concerned with very large, real-world databases,while ML typically (but not always) looks at smaller data sets.So efficiency questions are much more important for KDD.
• ML is a broader field, which includes not only learning fromexamples, but also reinforcement learning, learning withteacher, etc.
KDD is that part of ML which is concerned with findingunderstandable knowledge in large sets of real-world examples.When integrating machine-learning techniques into databasesystems to implement KDD some of the databases require:• More efficient learning algorithms because realistic databases
are normally very large and noisy. It is usual that the databaseis often designed for purposes different from data miningand so properties or attributes that would simplify thelearning task are not present nor can they be requested fromthe real world. Databases are usually contaminated by errorsso the data-mining algorithm has to cope with noise whereasML has laboratory type examples i.e. as near perfect aspossible.
• More expressive representations for both data, e.g. tuples inrelational databases, which represent instances of a problemdomain, and knowledge, e.g. rules in a rule-based system,which can be used to solve users’ problems in the domain,and the semantic information contained in the relationalschemata.
Practical KDD systems are expected to include three intercon-nected phases• Translation of standard database information into a form
suitable for use by learning facilities;• Using machine learning techniques to produce knowledge
bases from databases; and• Interpreting the knowledge produced to solve users’
problems and/or reduce data spaces. Data spaces being thenumber of examples.
References
1. Adriaans, Pieter, Data mining, Delhi: Pearson EducationAsia, 1996.
2. Berson, Smith, Data warehousing, Data Mining, and OLAP,New Delhi: Tata McGraw- Hill Publishing, 2004
3. Elmasri, Ramez, Fundamentals of database systems, 3rd ed.Delhi: Pearson Education Asia, 2000.
Related Websites• www-db.stanford.edu/~ullman/mining/mining.html• www.cise.ufl.edu/class/cis6930fa03dm/notes.html• www.ecestudents.ul.ie/Course_Pages/Btech_ITT/
Modules/ET4727/lecturenotes.htm• http://web.utk.edu/~peilingw/is584/ln.pdf

81
DA
TA W
AR
EH
OU
SIN
G A
ND
DA
TA M
ININ
G

82
DA
TA W
AR
EH
OU
SIN
G A
ND
DA
TA M
ININ
G
Structure• Objective• Introduction• Data mining• Data Mining Models• Verification Model• Discovery Model• Data warehousing
ObjectiveAt the end of this lesson you will be able to• Reviewing the concept of Data mining• Study various types of data mining models• Understand the difference between Verification and
Discovery model.
IntroductionIn the previous lesson, I have explained you the difference andsignificance of Data, Information and Knowledge. You havealso studied about the need and working of data mining. Inthis lesson, I will explain you various types of Data MiningModels.
Data MiningData mining, the extraction of the hidden predictive informa-tion from large databases is a powerful new technology withgreat potential to analyze important information in the datawarehouse. Data mining scours databases for hidden patterns,finding predictive information that experts may miss, as it goesbeyond their expectations. When implemented on a highperformance client/server or parallel processing computers, datamining tolls can analyze massive databases to deliver answers toquestions such as which clients are most likely to respond to thenext promotions mailing. There is an increasing desire to usethis new technology in the new application domain, and agrowing perception that these large passive databases can bemade into useful actionable information.The term ‘data mining’ refers to the finding of relevant anduseful information from databases. Data mining and knowl-edge discovery in the databases is a new interdisciplinary field,merging ideas from statistics, machine learning, databases andparallel computing. Researchers have defined the term ‘ datamining’ in many ways.1. Data mining or knowledge discovery in databases, as it is
also known is the non-trivial extraction of implicit,previously unknown and potentially useful informationfrom the data. This encompasses a number of technicalapproaches, such as clustering, data summarization,classification, finding dependency networks, analyzingchanges, and detecting anomalies.
LESSON 20DATA MINING MODELS
Though the terms data mining and KDD are used abovesynonymously, there are debates on the difference and similaritybetween data mining and knowledge discovery. In the presentbook, we shall be suing these two terms synonymously.However, we shall also study the aspects in which these twoterms are said to be different.Data retrieval, in its usual sense in database literature, attemptsto retrieve data that is stored explicitly in the database andpresents it to the user in a way that the user can understand. Itdoes not attempt to extract implicit information. One mayargue that if we store ‘date-of-birth’ as a field in the databaseand extract ‘age’ from it, the information received from thedatabase is not explicitly available. But all of us would agree thatthe information is not ‘non-trivial’. On the other hand, if oneattempts to as a sort of non-trivial extraction of implicitinformation. Then, can we say that extracting the average age o fthe employees of a department from the employee’s database(which stores the date-of-birth of every employee) is a data-mining task? The task is surely ‘non-trivial’ extraction ofimplicit information. It is needed a type of data mining task,but at a very low level. A higher-level task would, for example,be to find correlations between the average age and averageincome of individuals in an enterprise.2. Data mining is the search for the relationships and global
patterns that exist in large databases but are hidden amongvast amounts of data, such as the relationship betweenpatient data and their medical diagnosis. This relationshiprepresents valuable knowledge about the databases, and theobjects in the database, if the database is a faithful mirror ofthe real world registered by the database.
Consider the employee database and let us assume that we havesome tools available with us to determine some relationshipsbetween fields, say relationship between age and lunch-patterns.Assume, for example, that we find that most of employees inthere thirties like to eat pizzas, burgers or Chinese food duringtheir lunch break. Employees in there forties prefer to carry ahome-cooked lunch from their homes. And employees in therefifties take fruits and salads during lunch. If our tool finds thispattern from the database which records the lunch activities ofall employees for last few months, then we can term out tool asa data-mining tool. The daily lunch activity of all employeescollected over a reasonable period fo time makes the databasevery vast. Just by examining the database, it is impossible tonotice any relationship between age and lunch patterns.3. Data mining refers to using a variety of techniques to
identify nuggets of information or decision-makingknowledge in the database and extracting these in such a waythat they can be put to use in areas such as decision support,prediction, forecasting and estimation. The data is oftenvoluminous, but it has low value and no direct use can be

83
DA
TA W
AR
EH
OU
SIN
G A
ND
DA
TA M
ININ
Gmade of it. It is the hidden information in the data that isuseful.
Data mining is a process of finding value from volume. In anyenterprise, the amount of transactional data generated duringits day-to-day operations is massive in volume. Although thesetransactions record every instance of any activity, it is of little usein decision-making. Data mining attempts to extract smallerpieces of valuable information from this massive database.4. Discovering relations that connect variables in a database is
the subject of data mining. The data mining system self-learns from the previous history of the investigated system,formulating and testing hypothesis about rules whichsystems obey. When concise and valuable knowledge aboutthe system of interest is discovered, it can and should beinterpreted into some decision support system, which helpsthe manager to make wise and informed business decision.
Data mining is essentially a system that learns from the existingdata. One can think of two disciplines, which address suchproblems- Statistics and Machine Learning. Statistics providesufficient tools for data analysis and machine learning deals withdifferent learning methodologies. While statistical methods aretheory-rich-data-poor, data mining is data-rich-theory-poorapproach. On the other hand machine-learning deals withwhole gamut of learning theory, which most often data miningis restricted to areas of learning with partially specified data.5. Data mining is the process of discovering meaningful, new
correlation patterns and trends by sifting through largeamount of data stored in repositories, using patternrecognition techniques as well as statistical and mathematicaltechniques.
One important aspect of data mining is that it scans through alarge volume of to discover patterns and correlations betweenattributes. Thus, though there are techniques like clustering,decision trees, etc., existing in different disciplines, are notreadily applicable to data mining, as they are not designed tohandle Ii amounts of data. Thus, in order to apply statisticaland mathematical tools, we have to modify these techniques tobe able efficiently sift through large amounts of data stored inthe secondary memory.
Data Mining ModelsIBM have identified two types of model or modes of opera-tion which may be used to unearth information of interest tothe user.
Verification ModelThe Verification model takes a hypothesis from the user andtests the validity of it against the data. The emphasis is with theuser who is responsible for formulating the hypothesis andissuing the query on the data to affirm or negate the hypothesis.In a marketing division for example with a limited budget for amailing campaign to launch a new product it is important toidentify the section of the population most likely to buy thenew product. The user formulates an hypothesis to identifypotential customers and the characteristics they share. Historicaldata about customer purchase and demographic informationcan then be queried to reveal comparable purchases and thecharacteristics shared by those purchasers, which in turn can be
used to target a mailing campaign. The whole operation can berefined by ‘drilling down’ so that the hypothesis reduces the‘set’ returned each time until the required limit is reached.The problem with this model is the fact that no new informa-tion is created in the retrieval process but rather the queries willalways return records to verify or negate the hypothesis. Thesearch process here is iterative in that the output is reviewed, anew set of questions or hypothesis formulated to refine thesearch and the whole process repeated. The user is discoveringthe facts about the data using a variety of techniques such asqueries, multidimensional analysis and visualization to guidethe exploration of the data being inspected.
Discovery ModelThe discovery model differs in its emphasis in that it is thesystem automatically discovering important information hiddenin the data. The data is sifted in search of frequently occurringpatterns, trends and generalizations about the data withoutintervention or guidance from the user. The discovery or datamining tools aim to reveal a large number of facts about thedata in as short a time as possible.An example of such a model is a bank database, which is minedto discover the many groups of customers to target for amailing campaign. The data is searched with no hypothesis inmind other than for the system to group the customersaccording to the common characteristics found.The typical discovery driven tasks are• Discovery of association rules• Discovery of classification rules• ClusteringThese tasks are of an exploratory nature and cannot be directlyhanded over to currently available database technology. We shallconcentrate on these tasks now.
Discovery of Association RulesAn association rule is an expression of the form XÞY, where Xand Y are the sets of items. The intuitive meaning of such arule is that the transaction of the database which contains Xtends to contain Y. Given a database, the goal is to discover allthe rules that have the support and confidence greater than orequal to the minimum support and confidence, respectively.Let L ={l1,l2,….,lm} be a set of literals called items. Let D, thedatabase, be a set of transactions, where each transactions,where each transaction T is a set of items. T is a set of items. Tsupports an item x, if x is in T. T is said to support a subset ofitems X, if T supports each item x in X. XÞY holds withconfidence c, if c% of the transactions in D that support X alsosupport. Y. the rule X Þ Y has support is the transaction set Dif s% of the transactions in D support XOY. Support meanshow often X and Y occur together as a percentage of the totaltransactions. Confidence measures how much a particular itemis dependent on another.Thus, the association with a very high support and confidence isa pattern that occurs often in the database that should beobvious to the end user. Patterns with extremely low supportand confidence should be regarded as of no significance. Onlypatterns with a combination of intermediate values of confi-

84
DA
TA W
AR
EH
OU
SIN
G A
ND
DA
TA M
ININ
G
dence and support provide the user with interesting andpreviously unknown information. We shall study the tech-niques to discover association rules in the following chapters.
Discovery of Classification RulesClassification involves finding rules that partition the data intodisjoint groups. The input for the classification is the trainingdata set, whose class labels are already known. Classificationanalyzes the training data set and constructs a model based onthe class label, and aims to assign a class label to the futureunlabelled records. Since the class field is known, this type ofclassification is known as supervised learning. A set of classifiesfuture data and develops a better understanding of each class inthe database. We can term this as supervised learning too.There are several classification discovery models. They are: thedecision trees, neural networks, genetic algorithms and thestatistical models like linear/ geometric discriminates. Theapplications include the credit card analysis, banking, medicalapplications and the like. Consider the following example.The domestic flights in our country were at one time onlyoperated by Indian Airlines. Recently, many other private airlinesbegan their operations for domestic travel. Some of thecustomers of Airlines started flying with these private airlinesand, as a result, Indian Airlines lost these customers. Let usassume that Indian Airlines want to understand why somecustomers remain loyal while others leave. Ultimately, the airlinewants to predict which customers it is most likely to lose to itscompetitors. Their aim to build a model based on the historicaldata of loyal customers versus customers who have left. Thisbecomes a classifications problem. It is supervised learning task,as the historical data becomes the training set, which is used totrading the model. The decision tree is the most popularclassification technique. We shall discuss different methods ofdecision tree construction in the forthcoming lessons.
ClusteringClustering is a method of grouping data into different groups,so that the data in each group share similar trends and patterns.Clustering constitutes a major class of data mining algorithms.The algorithm attempts to automatically partition the data spaceinto a set of regions or clusters, to which the examples in thetable are assigned, either deterministically or probability-wise.The goal of process is to identify all sets of similar examples inthe data, in some optimal fashion.Clustering according to similarity is a concept which appears inmany disciplines. If a measure of similarity is available, thenthere are a number of techniques for forming clusters. Anotherapproach is to build set functions that measure some particularproperty of groups. This latter approach achieves what isknown as optimal partitioning.The objectives of clustering are:• To uncover natural groupings• To initiate hypothesis about the data• To find consistent and valid organization of the data.A retailer may want to know where similarities in his customerbase, so that he can create and understand different groups. Hecan use the existing database of the different customers or,
more specifically, different transactions collected over a period oftime. The clustering methods will help him in identifyingdifferent categories of customers. During the discovery process,the differences between data sets can be discovered in order toseparate them into different groups, and similarity between datasets can be used to group similar data together. We shall discussin detail about using the clustering algorithm for data miningtasks in further lessons.
Data WarehousingData mining potential can be enhanced if the appropriate datahas been collected and stored in a data warehouse. A datawarehouse is a relational database management system(RDBMS) designed specifically to meet the needs of transactionprocessing systems. It can be loosely defined as any centralizeddata repository which can be queried for business benefit butthis will be more clearly defined later. Data warehousing is a newpowerful technique making it possible to extract archivedoperational data and overcome inconsistencies between differentlegacy data formats. As well as integrating data throughout anenterprise, regardless of location, format, or communicationrequirements it is possible to incorporate additional or expertinformation. It is,The logical link between what the managers see in theirdecision support EIS applications and the company’soperational activitiesJohn McIntyre of SAS Institute IncIn other words the data warehouse provides data that is alreadytransformed and summarized, therefore making it an appropri-ate environment for more efficient DSS and EIS applications.
Discussion• Explain the relation between a data warehouse and data
mining• What are the various kinds of Data mining models?• “Data warehousing is a new powerful technique making it
possible to extract archived operational data and overcomeinconsistencies between different legacy data formats”.Comment.
• Explain the problems associated with the Verification Model.• “Data mining is essentially a system that learns from the
existing data”. Illustrate with examples.

85
DA
TA W
AR
EH
OU
SIN
G A
ND
DA
TA M
ININ
G

86
DA
TA W
AR
EH
OU
SIN
G A
ND
DA
TA M
ININ
G
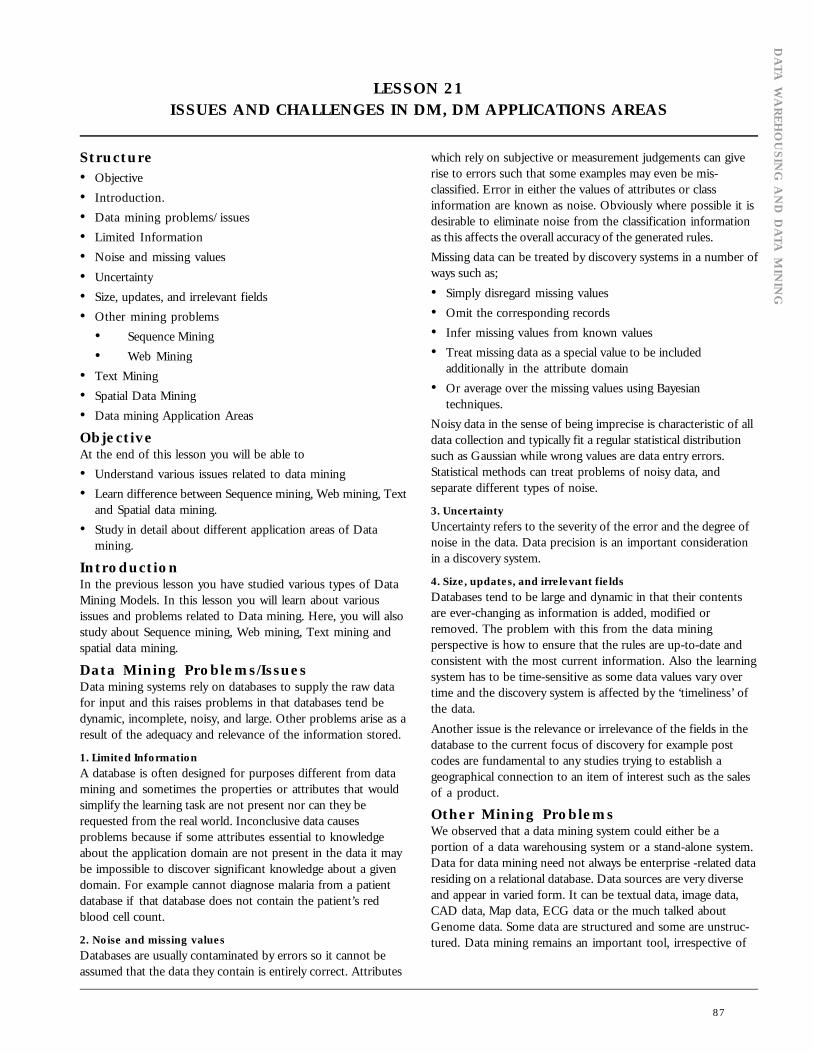
87
DA
TA W
AR
EH
OU
SIN
G A
ND
DA
TA M
ININ
G
Structure• Objective• Introduction.• Data mining problems/issues• Limited Information• Noise and missing values• Uncertainty• Size, updates, and irrelevant fields• Other mining problems
• Sequence Mining• Web Mining
• Text Mining• Spatial Data Mining• Data mining Application Areas
ObjectiveAt the end of this lesson you will be able to• Understand various issues related to data mining• Learn difference between Sequence mining, Web mining, Text
and Spatial data mining.• Study in detail about different application areas of Data
mining.
IntroductionIn the previous lesson you have studied various types of DataMining Models. In this lesson you will learn about variousissues and problems related to Data mining. Here, you will alsostudy about Sequence mining, Web mining, Text mining andspatial data mining.
Data Mining Problems/IssuesData mining systems rely on databases to supply the raw datafor input and this raises problems in that databases tend bedynamic, incomplete, noisy, and large. Other problems arise as aresult of the adequacy and relevance of the information stored.
1. Limited InformationA database is often designed for purposes different from datamining and sometimes the properties or attributes that wouldsimplify the learning task are not present nor can they berequested from the real world. Inconclusive data causesproblems because if some attributes essential to knowledgeabout the application domain are not present in the data it maybe impossible to discover significant knowledge about a givendomain. For example cannot diagnose malaria from a patientdatabase if that database does not contain the patient’s redblood cell count.
2. Noise and missing valuesDatabases are usually contaminated by errors so it cannot beassumed that the data they contain is entirely correct. Attributes
LESSON 21ISSUES AND CHALLENGES IN DM, DM APPLICATIONS AREAS
which rely on subjective or measurement judgements can giverise to errors such that some examples may even be mis-classified. Error in either the values of attributes or classinformation are known as noise. Obviously where possible it isdesirable to eliminate noise from the classification informationas this affects the overall accuracy of the generated rules.Missing data can be treated by discovery systems in a number ofways such as;• Simply disregard missing values• Omit the corresponding records• Infer missing values from known values• Treat missing data as a special value to be included
additionally in the attribute domain• Or average over the missing values using Bayesian
techniques.Noisy data in the sense of being imprecise is characteristic of alldata collection and typically fit a regular statistical distributionsuch as Gaussian while wrong values are data entry errors.Statistical methods can treat problems of noisy data, andseparate different types of noise.
3. UncertaintyUncertainty refers to the severity of the error and the degree ofnoise in the data. Data precision is an important considerationin a discovery system.
4. Size, updates, and irrelevant fieldsDatabases tend to be large and dynamic in that their contentsare ever-changing as information is added, modified orremoved. The problem with this from the data miningperspective is how to ensure that the rules are up-to-date andconsistent with the most current information. Also the learningsystem has to be time-sensitive as some data values vary overtime and the discovery system is affected by the ‘timeliness’ ofthe data.Another issue is the relevance or irrelevance of the fields in thedatabase to the current focus of discovery for example postcodes are fundamental to any studies trying to establish ageographical connection to an item of interest such as the salesof a product.
Other Mining ProblemsWe observed that a data mining system could either be aportion of a data warehousing system or a stand-alone system.Data for data mining need not always be enterprise -related dataresiding on a relational database. Data sources are very diverseand appear in varied form. It can be textual data, image data,CAD data, Map data, ECG data or the much talked aboutGenome data. Some data are structured and some are unstruc-tured. Data mining remains an important tool, irrespective of

88
DA
TA W
AR
EH
OU
SIN
G A
ND
DA
TA M
ININ
G
the forms or sources of data. We shall study the Data miningproblems for different types of data.
Sequence MiningSequence mining is concerned with mining sequence data. Itmay be noted that in the, discovery of association rules, we areinterested in finding associations between items irrespective oftheir order of occurrence. For example, we may be interested inthe association between the purchase of a particular brand ofsoft drinks and the occurrence of stomach upsets. But it ismore relevant to identify whether there is some pattern in thestomach upsets which occurs after the purchase of the softdrink. Then one is inclined to infer that the soft drink causesstomach upsets. On the other hand, if it is more likely that thepurchase of the soft drink follows the occurrence of thestomach upset, then it is probable that the soft drink providessome sort of relief to the user. Thus, the discovery of temporalsequences of events concerns causal relationships among theevents in a sequence. Another application of this domainconcerns drug misuse. Drug misuse can occur unwittingly,when a patient is prescribed two or more interacting drugswithin a given time period of each other. Drugs that interactundesirably are recorded along with the time frame as a patternthat can b located within the patient records. The rules thatdescribe such instances of drug misuse are then successfullyinducted based on medical records.Another related area which falls into the larger domain oftemporal data mining is trend discovery. One characteristic ofsequence-pattern discovery in comparison with trend discoveryis the lack of shapes, since the causal impact of a series ofevents, cannot be shaped.
Web MiningWith the huge amount of information available online, theWorld Wide Web is a ferti1e area for data mining research. Webmining research is at the crossroads of research from severalresearch communities, such as database, information retrieval,and within AI, especially the sub areas of machine learning andnatural language processing. Web mining is the use of datamining techniques to automatically discover and extractinformation from web documents and services. This area ofresearch is so huge today partly due to the interests of variousresearch commuI1ities, the tremendous growth of informationsources available on the web and the recent interest in e-commerce. This phenomenon often creates confusion when weask what constitutes web mining. Web mining can be brokendown into following subtasks:1. Resource finding: retrieving documents intended for the
web.2. Information selection and preprocessing: automatically
selecting and preprocessing specific information fromresources retrieved from the web.
3. Generalization: to automatically discover general patterns atindividual web site as well as across multiple sites.
4. Analysis: validation and/or interpretation of the minedpatterns.
Text MiningThe term text mining or KDT (Knowledge Discovery in Text)was first proposed by Feldman and Dagan in 1996. Theysuggest that text documents be structured by means ofinformation extraction, text categorization, or applying NLPtechniques as a preprocessing step before performing any kindof KDTs. Presently the term text mining, is being used to covermany applications such as text categorization, exploratory dataanalysis, text clustering, finding patterns in text databases,finding sequential patterns in texts, IE (Information Extrac-tion), empirical computational linguistic tasks, and associationdiscovery.
Spatial Data MiningSpatial data mining is the branch of data mining that deals withspatial (location) data. The immense explosion in geographi-cally-referenced data occasioned by developments in IT, digitalmapping, remote sensing, and the global diffusion of GIS,places demands on developing data driven inductive approachesto spatial analysis and modeling. Spatial data mining is regardedas a special type of data mining that seeks to perform similargeneric functions as conventional data mining tools, butmodified to take into account the special features of spatialinformation.For example, we may wish to discover some association amongpatterns of residential colonies and topographical features. Atypical spatial association may look like: ‘The residential landpockets are dense in a plain region and rocky areas are thinlypopulated”; or, “The economically affluent citizens reside inhilly, secluded areas whereas the middle income group residentsprefer having their houses near the market”.
Data mining Application AreasThe discipline of data mining is driven in part by new applica-tions, which require new capabilities that are not currently beingsupplied by today’s technology. These new applications can benaturally divided into three broad categories [Grossman, 1999].
A. Business And E-Commerce DataThis is a major source category of data for data mining applica-tions. Back-office front-office, and network applications producelarge amounts of data about business processes. Using thisdata for effective decision-making remains a fundamentalchallenge.
Business TransactionsModern business processes are consolidating with millions ofcustomers and billions of their transactions. Business enter-prises require necessary information for their effectivefunctioning in today’s competitive world. For example, theywould like know: “Is this transaction fraudulent?”; “Whichcustomer is likely to migrate?”, and “What product is thiscustomer most likely to buy next?’.
Electronic CommerceNot only does electronic commerce produce large data sets inwhich the analysis marketing patterns and risk patterns is criticalbut, it is also important to do this near-real time, in order tomeet the demands of online transactions.

89
DA
TA W
AR
EH
OU
SIN
G A
ND
DA
TA M
ININ
GB. Scientific, Engineering And Health Care DataScientific data and metadata tend to be more complex instructure than business data. In addition, scientists andengineers are making increasing use of simulation and systemswith application domain knowledge.
Genomic DataGenomic sequencing and mapping efforts have produced anumber of databases, which are accessible on the web. Inaddition, there are also a wide variety of other online databases.Finding relationships between these data sources is anotherfundamental challenge for data mining. .
Sensor DataRemote sensing data is another source of voluminous data.Remote sensing satellites and a variety of other sensors producelarge amounts of geo-referenced data. A fundamental challengeis to understand the relationships, including causal relation-ships, amongst this data.
Simulation DataSimulation is now accepted as an important mode of science,supplementing theory and experiment. Today, not only doexperiments produce huge data sets, but so do simulations.Data mining and, more generally, data intensive computing isproving to be a critical link between theory; simulation, andexperiment.
Health Care DataHospitals, health care organizations, insurance companies, andthe concerned government agencies accumulate large collectionsof data about patients and health care-related details. Under-standing relationships in this data is critical for a Wide variety ofproblems ranging from determining what procedures andclinical protocols are most effective, to how best deliver healthcare to the maximum number of people.
Web DataThe data on the web is growing not only in volume but also incomplexity. Web data now includes not only text, audio andvideo material, but also streaming data and numerical data.
Multimedia DocumentsToday’s technology for retrieving multimedia items on the webis far from satisfactory. On the other hand, an increasingly largenumber of matters are on the web and the number of users isalso growing explosively. It is becoming harder to extractmeaningful information from the archives of multimedia dataas the volume grows.
Data WebToday, the web is primarily oriented toward documents andtheir multimedia extensions. HTML has proved itself to be asimple, yet powerful, language for supporting this. Tomorrow,the potential exists for the web to prove equally important forworking with data. The Extensible Markup Language (XML) isan emerging language for working with data in networkedenvironments. As this infrastructure grows, data mining isexpected to be a critical enabling technology for the emergingdata web.
Data Mining Applications-Case StudiesThere is a wide range of well-established business applicationsfor data mining. These include customer attrition, profiling,promotion forecasting, product cross-selling, fraud detection,targeted marketing, propensity analysis, credit scoring, riskanalysis, etc. We shall now discuss a few mock case studies andareas of DM applications.
Housing Loan Prepayment PredictionA home-finance loan actually has an average life-span of only 7to 10 years, due to prepayment. Prepayment means that theloan is paid off early, rather than at the end of say, 25 years.People prepay loans when they refinance or when they sell theirhome. The financial return that a home-finance institutionderives from a loan depends on its life-span. Therefore, it isnecessary for the financial institutions to be able to predict thelife-spans of their loans. Rule discovery techniques can be usedto accurately predict the aggregate number of loan prepaymentsin a given quarter (or, in a year), as a function of prevailinginterest rates, borrower characteristics, and account data. Thisinformation can be used to fine-tune loan parameters such asinterest rates, points, and fees, in order to maximize profits.
Mortgage Loan Delinquency PredictionLoan defaults usually entail expenses and losses for the banksand other lending institutions. Data mining techniques can beused to predict whether or not a loan would go delinquentwithin the succeeding 12 months, based on historical data, onaccount information, borrower demographics, and economicindicators. The rules can be used to estimate and finetune loanloss reserves and to gain some business insight into thecharacteristics and circumstances of delinquent loans. This willalso help in deciding the funds that should be kept aside tohandle bad loans.
Crime DetectionCrime detection is another area one might immediately associatewith data mining. Le us consider a specific case: to find patternsin ‘bogus official’ burglaries.A typical example of this kind of crime is when someone turnsup at the door pretending to be from the water board, electricityboard, telephone department or gas company. Whilst theydistract the householder, their partners will search the premisesand steal cash and items of value. Victims of this sort of crimetend to be the elderly. These cases have no obvious leads, anddata mining techniques may help in providing some unexpectedconnections to known perpetrators.In order to apply data mining techniques, let us assume thateach case is filed electronically, and contains descriptive informa-tion about the thieves. It also contains a description of theirmodus operandi. We can use any of the clustering techniques toexamine a situation where a group of similar physical descrip-tions coincide with a group of similar modus operandi. If there isa good match here, and the perpetrators are known for one ormore of the offences, then each of the unsolved cases couldhave well been committed by the same people.By matching unsolved cases with known perpetrators, it wouldbe possible to clear up old cases and determine patterns ofbehavior. Alternatively, if the criminal is unknown but a large

90
DA
TA W
AR
EH
OU
SIN
G A
ND
DA
TA M
ININ
G
cluster of cases seem to point to the same offenders, then thesefrequent offenders can be subjected to careful examination.
Store-Level Fruits Purchasing PredictionA super market chain called ‘Fruit World’ sells fruits of differenttypes and it purchases these fruits from the wholesale supplierson a day-to-day basis. The problem is to analyze fruit-buyingpatterns, using large volumes of data captured at the ‘basket’level. Because fruits have a short shelf life, it is important thataccurate store-level purchasing predictions should be made toensure optimum freshness and availability. The situation isinherently complicated by the ‘domino’ effect. For example,when one variety of mangoes is sold out, then sales aretransferred to another variety. With help of data miningtechniques, a thorough understanding of purchasing trendsenables a better availability of fruits and greater customersatisfaction.
Other Application Area
Risk AnalysisGiven a set of current customers and an assessment of theirrisk-worthiness, develop descriptions for various classes. Usethese descriptions to classify a new customer into one of therisk categories.
Targeted MarketingGiven a database of potential customers and how they haveresponded to a solicitation, develop a model of customersmost likely to respond positively, and use the model for morefocused new customer solicitation. Other applications are toidentify buying patterns from customers; to find associationsamong customer demographic characteristics, and to predict theresponse to mailing campaigns.Retail/Marketing• Identify buying patterns from customers• Find associations among customer demographic
characteristics• Predict response to mailing campaigns• Market basket analysis
Customer RetentionGiven a database of past customers and their behavior prior toattrition, deve1op a model of customers most likely to leave.Use the model for determining the course of action for thesecustomers.
Portfolio ManagementGiven a particular financial ‘asset, predict the return on invest-ment to determine the inclusion of the asset in a folio or not.
Brand LoyaltyGiven a customer and the product he/she uses, predict whetherthe customer will switch brands.
BankingThe application areas in banking are:• Detecting patterns of fraudulent credit card use• Identifying ‘loyal’ customers• Predicting customers likely to change their credit card
affiliation
• Determine credit card spending by’ customer groups• Finding hidden correlations between different financial
indicators• Identifying stock trading rules from historical market data
Insurance and Health Care• Claims analysis - i.e., which medical procedures are claimed
together• Predict which customers will buy new policies• Identify behavior patterns of risky customers• Identify fraudulent behavior
Transportation• Determine the distribution schedules among outlets• Analyze loading patterns
Medicine• Characterize patient behavior to predict office visits• Identify successful medical therapies for different illnesses
Discussion• Discuss different data mining tasks.• What is spatial data mining?• What is sequence mining?• What is web mining?• What is text mining?• Discuss the applications of data mining in the banking
industry.• Discuss the applications of data mining in customer
relationship management.• How is data mining relevant to scientific data?• How is data mining relevant for web-based computing?• Discuss the application of data mining in science data.
Bibliography• Agrawal R, Gupta A., and Sarawagi S., Modeling
multidimensional databases. ICDE, 1997.• Anahory S., and Murray D. Data warehousing in the Real
World: Apracfical guide for building decision support systems.Addison Wesley Longman, 1997.
• Barbara D. (ed.) Special Issue on Mining of Large Datasets;IEEE Data Engineering Bulletin, 21 (1), 1998
• Brachman R., Khabaza T., Kloesgen W., Shapiro G.P.,and Simoudis E., Industrial applications of data miningand knowledge discovery, Communication of ACM,- 1926.
• Fayyad U.M., Piatetsky-Shapiro G., Smyth P.,Uthurusamy R. (Eds.): Advances in Knowledge Discovery andData Mining. Menlo Park, CA: AAAI Press/ The MIT Press,1996
• Fayyad U.M., Uthurusamy R. (eds.): Special issue on datamining. CommunicatJon of ACM,1996 .
• Grossman R., Kasif S.,Moore R., Rocke D. and UllmannJ. Data Mining Research: Opportunities and Challenges, A Report.www..ncdni.uic.edu/M3D-final-report.htm., Jan 1999.

91
DA
TA W
AR
EH
OU
SIN
G A
ND
DA
TA M
ININ
G• Heckerman D., Bayesian networks for data, mining. Data
mining and knowledge Discovery, 1997.• Imielinski T., Virmani A., Association Rules ... and What’s
Next? Towards Second Generation Data Mining Systems; InProceedings of the 2nd East=European ADBIS Conference., pp. 6-25,1998.
• Mannila H., Methods and Problems in Data Mining; InProceedings of the 6’h International Ccmference on DatabaseTheory 1997 ,.Springer LNCS 1186.
• Nestorov S., and Tsur S. Integrating data miniqg with:relational DBMS: A tightly coupled approach, “www-db.stanford.edu/people/evitov.html; 1998.
• Piatetsky-Shapiro G., and Frawley W. (ed.): KnowledgeDiscovery in Databases, MIT Press, Cambridge, Ma, 1991
• Sarawagi S., et al. Integrating Association Rule Mining withRelational Database Systems: Alternatives and Implications;In Proceedings of the ACM SIGMOD International Conferenceon Management of Data 1998,343-354.
• Vinnani A. Second Generation Data Mining: Concepts andimplementation ; Ph.D. Thesis, Rutgers University, Apri11998.
Some slides on important Topics:

92
DA
TA W
AR
EH
OU
SIN
G A
ND
DA
TA M
ININ
G
Notes

93
DA
TA W
AR
EH
OU
SIN
G A
ND
DA
TA M
ININ
G
CHAPTER 5DATA MINING TECHNIQUES
LESSON 22VARIOUS TECHNIQUES OF DATA
MINING NEAREST NEIGHBOR ANDCLUSTERING TECHNIQUES
Structure• Objective• Introduction.• Types of Knowledge Discovered during Data Mining
• Association Rules• Classification hierarchies• Sequential patterns• Patterns within time series• Categorization and segmentation
• Comparing the Technologies• Clustering And Nearest-Neighbor Prediction Technique• Where to Use Clustering and Nearest-Neighbor Prediction• Clustering for clarity• Nearest neighbor for prediction• There is no best way to cluster• How are tradeoffs made when determining which records fall
into which clusters?• What is the difference between clustering nearest-neighbor
prediction?• Cluster Analysis: Overview
ObjectiveAt the end of this lesson you will be able to• Understand various techniques used in Data mining• Study about Nearest Neighbor and clustering techniques• Understand about Cluster Analysis.
IntroductionIn this lesson you will study about various techniques used inData mining. You will study in detail about Nearest Neighborand clustering techniques. I will also cover Cluster Analysis inthis lesson.
Types of Knowledge Discovered during Data MiningThe term “knowledge” is broadly interpreted as involving somedegree of intelligence. Knowledge is often class inductive anddeductive. Data mining addresses inductive knowledge.Knowledge can be represented in many forms in an unstruc-tured sense; it can be represented by rules, or prepositional logic.In a structured form, it may be represented in decision trees,semantic networks, neural works, or hierarchies of classes orframes.The knowledge discovered during data mining can be describedin five ways, as follows.1. Association Rules-These rules correlate the presence of a set
of items another range of values for another set of variables.Examples: (1) When a _ retail shopper buys a handbag, she
is likely to buy shoes. (2) An X-ray image maintainingcharacteristics a and b is likely to also exhibit characteristic c.
2. Classification hierarchies-The goal is to work from anexisting set of even a transaction to create a hierarchy ofclasses. Examples: (1) A population may be -divided intofive ranges of credit worthiness based on a history ofprevious co transactions. (2) A model may be developed forthe factors that determine desirability of location of a. store-on a 1-10 scale. (3) Mutual funds may be classified based onperformance data using characteristics such as growth,income, and stability.
3. Sequential patterns - A sequence of actions or events issought. Example: If a patient underwent cardiac bypasssurgery for blocked arteries and an aneurysm and laterdeveloped high blood urea within a year of surgery, he or sheis likely to suffer from kidney failure within the next 18months. Detection of sequential pat-terns is equivalent todetecting association among events with certain temporalrelationships.
4. Patterns within time series - Similarities can be detectedwithin positions of the time series. Three examples followwith the stock market price data as a time series: (1) Stocks ofa utility company ABC Power and a financial company XYZSecurities show the same pattern during 1998 in terms ofclosing stock price. (2) Two products show the same sellingpattern in summer but a different one in win-ter. (3) Apattern in solar magnetic wind may be used to predictchanges in earth atmospheric conditions
5. Categorization and segmentation - A given population ofevents or items can be partitioned (segmented) into sets of“similar” elements. Examples: (1) An entire population oftreatment data on a disease may be divided into groupsbased on the similarity of side effects produced. (2) Theadult popu1ation in the United States may be categorizedinto five groups from “most likely to buy” to “least likely tobuy” a new product. (3) The web accesses made by acollection of users against a set of documents (say, in adigital library) may be analyzed in. terms of the key-words ofdocuments to reveal clusters or categories of Users.
Comparing the TechnologiesMost of the data mining technologies that are out there todayare relatively new to the business community, and there are a lotof them (each technique usually is accompanied by a plethora ofnew companies and products). Given this state of affairs, oneof the most important questions being asked right after “Whatis data mining?” is “Which technique(s) do I choose for myparticular business problem?” The answer is, of course, not asimple one. There are inher-ent strengths and weaknesses ofthe different approaches, but most of the weaknesses can beovercome. How the technology is implemented into the data-
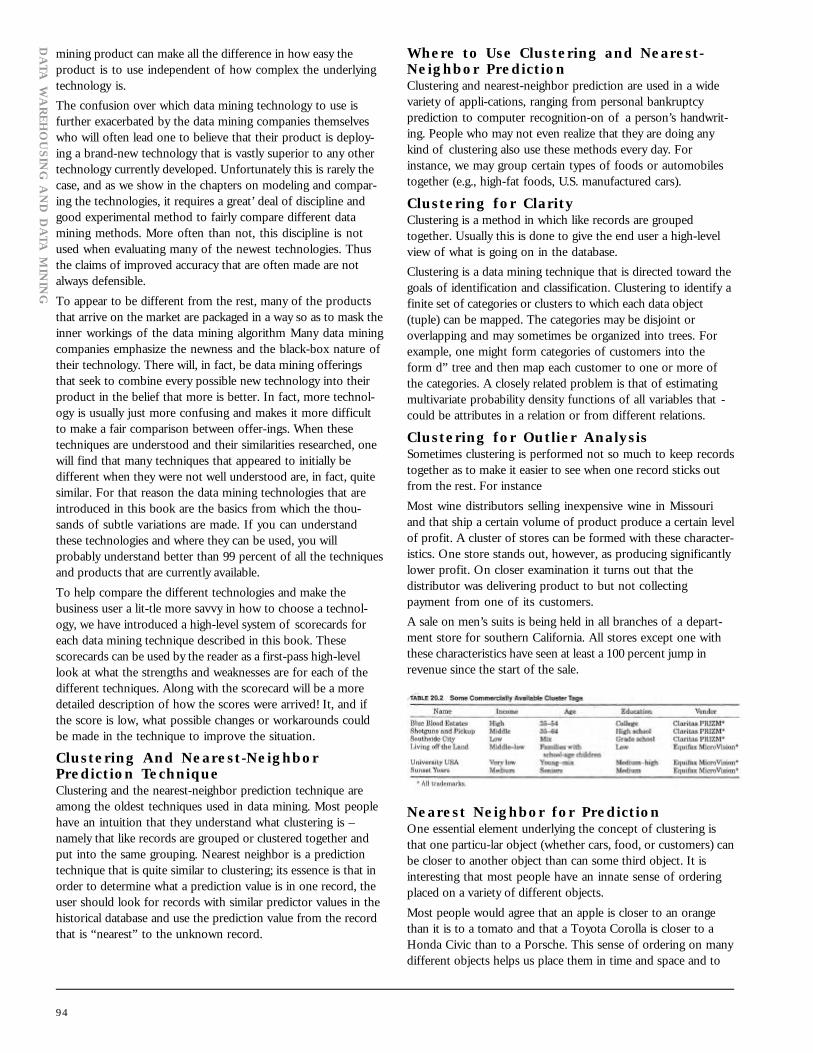
94
DA
TA W
AR
EH
OU
SIN
G A
ND
DA
TA M
ININ
G
mining product can make all the difference in how easy theproduct is to use independent of how complex the underlyingtechnology is.The confusion over which data mining technology to use isfurther exacerbated by the data mining companies themselveswho will often lead one to believe that their product is deploy-ing a brand-new technology that is vastly superior to any othertechnology currently developed. Unfortunately this is rarely thecase, and as we show in the chapters on modeling and compar-ing the technologies, it requires a great’ deal of discipline andgood experimental method to fairly compare different datamining methods. More often than not, this discipline is notused when evaluating many of the newest technologies. Thusthe claims of improved accuracy that are often made are notalways defensible.To appear to be different from the rest, many of the productsthat arrive on the market are packaged in a way so as to mask theinner workings of the data mining algorithm Many data miningcompanies emphasize the newness and the black-box nature oftheir technology. There will, in fact, be data mining offeringsthat seek to combine every possible new technology into theirproduct in the belief that more is better. In fact, more technol-ogy is usually just more confusing and makes it more difficultto make a fair comparison between offer-ings. When thesetechniques are understood and their similarities researched, onewill find that many techniques that appeared to initially bedifferent when they were not well understood are, in fact, quitesimilar. For that reason the data mining technologies that areintroduced in this book are the basics from which the thou-sands of subtle variations are made. If you can understandthese technologies and where they can be used, you willprobably understand better than 99 percent of all the techniquesand products that are currently available.To help compare the different technologies and make thebusiness user a lit-tle more savvy in how to choose a technol-ogy, we have introduced a high-level system of scorecards foreach data mining technique described in this book. Thesescorecards can be used by the reader as a first-pass high-levellook at what the strengths and weaknesses are for each of thedifferent techniques. Along with the scorecard will be a moredetailed description of how the scores were arrived! It, and ifthe score is low, what possible changes or workarounds couldbe made in the technique to improve the situation.
Clustering And Nearest-NeighborPrediction TechniqueClustering and the nearest-neighbor prediction technique areamong the oldest techniques used in data mining. Most peoplehave an intuition that they understand what clustering is –namely that like records are grouped or clustered together andput into the same grouping. Nearest neighbor is a predictiontechnique that is quite similar to clustering; its essence is that inorder to determine what a prediction value is in one record, theuser should look for records with similar predictor values in thehistorical database and use the prediction value from the recordthat is “nearest” to the unknown record.
Where to Use Clustering and Nearest-Neighbor PredictionClustering and nearest-neighbor prediction are used in a widevariety of appli-cations, ranging from personal bankruptcyprediction to computer recognition-on of a person’s handwrit-ing. People who may not even realize that they are doing anykind of clustering also use these methods every day. Forinstance, we may group certain types of foods or automobilestogether (e.g., high-fat foods, U.S. manufactured cars).
Clustering for ClarityClustering is a method in which like records are groupedtogether. Usually this is done to give the end user a high-levelview of what is going on in the database.Clustering is a data mining technique that is directed toward thegoals of identification and classification. Clustering to identify afinite set of categories or clusters to which each data object(tuple) can be mapped. The categories may be disjoint oroverlapping and may sometimes be organized into trees. Forexample, one might form categories of customers into theform d” tree and then map each customer to one or more ofthe categories. A closely related problem is that of estimatingmultivariate probability density functions of all variables that -could be attributes in a relation or from different relations.
Clustering for Outlier AnalysisSometimes clustering is performed not so much to keep recordstogether as to make it easier to see when one record sticks outfrom the rest. For instanceMost wine distributors selling inexpensive wine in Missouriand that ship a certain volume of product produce a certain levelof profit. A cluster of stores can be formed with these character-istics. One store stands out, however, as producing significantlylower profit. On closer examination it turns out that thedistributor was delivering product to but not collectingpayment from one of its customers.A sale on men’s suits is being held in all branches of a depart-ment store for southern California. All stores except one withthese characteristics have seen at least a 100 percent jump inrevenue since the start of the sale.
Nearest Neighbor for PredictionOne essential element underlying the concept of clustering isthat one particu-lar object (whether cars, food, or customers) canbe closer to another object than can some third object. It isinteresting that most people have an innate sense of orderingplaced on a variety of different objects.Most people would agree that an apple is closer to an orangethan it is to a tomato and that a Toyota Corolla is closer to aHonda Civic than to a Porsche. This sense of ordering on manydifferent objects helps us place them in time and space and to

95
DA
TA W
AR
EH
OU
SIN
G A
ND
DA
TA M
ININ
Gmake sense of the world. It is what allows us to build clus-ters-both in databases on computers and in our daily lives. Thisdefinition of nearness that seems to be ubiquitous also allowsus to make predictions. The nearest-neighbor predictionalgorithm, simply stated, isObjects that are “near” to each other will have similar predictionvalues as well. Thus, if you know the prediction value of oneof the objects, you can predict it for its nearest neighbors.One of the classic places where nearest neighbor has been usedfor prediction has been in text retrieval. The problem to besolved in text retrieval is one in which end users define adocument (e.g., a Wall Street Journal article, a techni-cal confer-ence paper) that is interesting to them and they solicit thesystem to “find more documents like this one,” effectivelydefining a target of “this is the interesting document” or “thisis not interesting.” The prediction problem is that only a veryfew of the documents in the database actually have values forthis prediction field (viz., only the documents that the readerhas had a chance to look at so far). The nearest-neighbortechnique is used to find other documents that share importantcharacteristics with those documents that have been marked asinteresting. AB with almost all prediction algorithms, nearestneigh-bor can be used for a wide variety of places. Its successfuluse depends mostly on the pre-formatting of the data, so thatnearness can be calculated, and where individual records can bedefined. In the text-retrieval example this was not too difficult-the objects were documents. This is not always as easy as it isfor text retrieval. Consider what it might be like in a time seriesproblem-say, for pre-dicting the stock market. In this case theinput data is just a long series of stock prices over time withoutany particular record that could be considered to be an object.The value to be predicted is just the next value of the stockprice.This problem is solved for both nearest-neighbor techniquesand for some other types of prediction algorithms by creatingtraining records, taking, for instance, 10 consecutive stock pricesand using the first 9 as predictor values and the 10th as theprediction value. Doing things this way, if you had 100 datapoints in your time series, you could create at least 10 differenttraining records.You could create even more training records than 10 by creatinga new record starting at every data point. For instance, you couldtake the first 10 Data points in your time series and create arecord. Then you could take the 10 consecutive data pointsstarting at the second data point, then the 10 consecu-tive datapoints starting at the third data point. Even though some ofthe data points would overlap from one record to the next, theprediction value would always be different. In our example of100 initial data points, 90 different training records could becreated this way, as opposed to the 10 training records createdvia the other method.
There is no best way to clusterThis example, although simple, points up some importantquestions about clus-tering. For instance, is it possible to saywhether the first clustering that was per-formed above (byfinancial status) was better or worse than the second clustering(by age and eye color)? Probably not, since the clusters were
constructed for no particular purpose except to note similaritiesbetween some of the records and that the view of the databasecould be somewhat simplified by using clusters. But even thedifferences that were created by the two different clustering weredriven by slightly different motivations (financial vs. romantic).In general, the reasons for clustering are just this ill definedbecause clusters are used more often than not for explorationand summarization and nut _s much as for prediction.
How are tradeoffs made when determining whichrecords fall into which clusters?Note that for the first clustering example, there was a prettysimple rule by which the records could be broken up intoclusters-namely, by income.TABLE : A Simple Clustering of the Example Database
ID. Name Prediction Age Balance ($) Income Eyes Gender
3 Betty No 47 16,543 High Brown F
5 Carla Yes 21 2,300 High Blue F 6 Carl No 27 5,400 High Brown M 8 Don Yes 46 0 High Blue M
1 Amy No 62 0 Medium Brown F 2 AI No 53 1,800 Medium Green M 4 Bob Yes 32 45 Medium Green M
7 Donna Yes 50 165 Low Blue F 9 Edna Yes 27 . 500 Low Blue F 10 Ed No 68 1,200 Low Blue M
What is the difference between clustering nearest-neighbor prediction?The main distinction between clustering and the nearest-neighbor technique is that clustering is what is called anunsupervised learning technique and near-est neighbor is generallyused for prediction or a supervised learning technique. Unsuper-vised learning techniques are unsupervised in the sense thatwhen they are run, there is no particular reason for the creationof the models the way there is for supervised learning tech-niques that are trying to perform predic-tion. In prediction, thepatterns that are found in the database and presented in themodel are always the most important patterns in the databasefor perform-ing some particular prediction. In clustering there isno particular sense of why certain records are near to each otheror why they all fall into the same cluster. Some of the differ-ences between clustering and nearest-neighbor prediction aresummarized in Table 20.7.
How is the space for clustering and nearestneighbor defined?For clustering, the n-dimensional space is usually defined byassigning one predictor to each dimension. For the nearest-neighbor algorithm, predictors are also mapped to dimensions,but then those dimensions are literally stretched or compressedaccording to how important the particular predictor is in makingthe prediction. The stretching of a dimension effectively makes

96
DA
TA W
AR
EH
OU
SIN
G A
ND
DA
TA M
ININ
G
that dimension (and hence predictor) more important than theothers in calculating the distance.For instance, ‘if you were a mountain climber and someonetold you that you were 2 mi from your destination, the distancewould be the same whether it were 1 mi north and’ 1 mi up theface of the mountain or 2 mi north on level ground, but clearlythe former route is much different from the latter. The dis-tancetraveled straight upward is the most important in figuring outhow long it will really take to get to the destination, and youwould probably like to con-sider this “dimension” to be moreimportant than the others. In fact, you, as a mountain climber,could “weight” the importance of the vertical dimension incalculating some new distance by reasoning that every mileupward is equiva-lent to 10 mi on level ground.If you used this rule of thumb to weight the importance ofone dimension over the other, it would be clear that in one caseyou were much “farther away” from your destination (limit)than in the second (2 mi). In the net section we’ll show how thenearest neighbor algorithm uses the distance measure thatsimilarly weights the important dimensions more heavily whencalculating a distance.
Nearest Neighbor Clustering
Used for prediction as well as consolidation. Space is defined by the problem to be solved (Supervised Learning). Generally, only uses distance metrics to determine nearness.
Used mostly for consolidating data into a high-level view and general grouping of records into like behaviors. Space is defined as default n-dimensional space, or is defined by the user, or is a predefined space driven by past experience (Unsupervised learning). Can use other metrics besides distance to determine nearness of two records – for example, linking points together.
Cluster Analysis: OverviewIn an unsupervised learning environment the system has todiscover its own classes and one way in which it does this is tocluster the data in the database as shown in the followingdiagram. The first step is to discover subsets of related objectsand then find descriptions e.g., D1, D2, D3 etc. which describeeach of these subsets.Figure 5: Discovering clusters and descriptions in a database
Clustering and segmentation basically partition the database sothat each partition or group is similar according to some criteriaor metric. Clustering according to similarity is a concept, whichappears in many disciplines. If a measure of similarity isavailable there are a number of techniques for forming clusters.Membership of groups can be based on the level of similaritybetween members and from this the rules of membership canbe defined. Another approach is to build set functions thatmeasure some property of partitions ie groups or subsets asfunctions of some parameter of the partition. This latterapproach achieves what is known as optimal partitioning.Many data mining applications make use of clustering accordingto similarity for example to segment a client/customer base.Clustering according to optimization of set functions is used indata analysis e.g. when setting insurance tariffs the customerscan be segmented according to a number of parameters and theoptimal tariff segmentation achieved.Clustering/segmentation in databases are the processes ofseparating a data set into components that reflect a consistentpattern of behavior. Once the patterns have been establishedthey can then be used to “deconstruct” data into more under-standable subsets and also they provide sub-groups of apopulation for further analysis or action, which is importantwhen dealing with very large databases. For example a databasecould be used for profile generation for target marketing whereprevious response to mailing campaigns can be used to generatea profile of people who responded and this can be used topredict response and filter mailing lists to achieve the bestresponse.
Discussion1. Write short notes on:
• Clustering• Sequential patterns• Segmentation• Association rules• Classification hierarchies
2. Explain Cluster analysis.3. Correctly contrast the difference between supervised and
unsupervised learning.4. Discuss in brief, where Clustering and Nearest-Neighbor
Prediction are used?5. How is the space for clustering and nearest neighbor
defined? Explain.6. What is the difference between clustering nearest-neighbor
prediction?7. How are tradeoffs made when determining which records fall
into which clusters?8. Explain the following:
• Clustering• Nearest-Neighbor

97
DA
TA W
AR
EH
OU
SIN
G A
ND
DA
TA M
ININ
GSome important slides

98
DA
TA W
AR
EH
OU
SIN
G A
ND
DA
TA M
ININ
G
Structure• Objective• Introduction• What is a Decision Tree?• Advantages and Shortcomings of Decision Tree
Classifications:• Where to Use Decision Trees?• Tree Construction Principle• The Generic Algorithm• Guillotine Cut• Overfit
ObjectiveAt the end of this lesson you will be able to understandDecision trees, as techniques for data mining.
IntroductionThe classification of large data sets is an important problem indata mining. The classification problem can be simply stated asfollows. For a database with a number of records and for a setof classes such that each record belongs to one of the givenclasses, the problem of classification is to decide the class towhich a given record belongs. But there is much more to thisthan just simply classifying. The classification problem is alsoconcerned with generating a description or a model for each classfrom the given data set. Here, we are concerned with a type ofclassification called supervised classification. In supervisedclassification, we have a training data set of records and for eachrecord of this set; the respective class to which it belongs is alsoknown. Using the training set, the classification processattempts to generate the descriptions of the classes, and thesedescriptions help to classify the unknown records. In additionto the training set, we can also have a test data set, which is usedto determine the effectiveness of a classification. There areseveral approaches to supervised classifications. Decision trees(essentially, Classification trees) are especially attractive in the data-mining environment as they represent rules. Rules can readily beexpressed in natural language and are easily comprehensible.Rules can also be easily mapped to a database access language,like SQL.This lesson is concerned with decision trees as techniques fordata mining. Though the decision-tree method is a well-knowntechnique in statistics and machine learning, these algorithms arenot suitable for data mining purposes. The specific require-ments that should be taken into consideration while designingany decision tree construction algorithms for data mining arethat:a. The method should be efficient in order to handle a very
large-sized database,b. The method should be able to handle categorical attributes.
LESSON 23DECISION TREES
What is a Decision Tree?A decision tree is a predictive model that, as its name implies,can be viewed as a tree. Specifically, each branch of the tree is aclassification question, and the leaves of the tree are partitionsof the data set with their classification. For instance, if we weregoing to classify customers who churn (don’t renew their phonecontracts) in the cellular telephone industry, a decision treemight look something like that found in following figure.
You may notice some interesting things about the tree.
• It divides the data on each branch point without losing anyof the data (the number of total records in a given parentnode is equal to the sum of the records contained in its twochildren).
• The number of churners and no churners is conserved asyou move up or down the tree.
• It is pretty easy to understand how the model is being built(in contrast to
• The models from neural networks or from standardstatistics).
• It would also be pretty easy to use this model if you actuallyhad to target
• Those customers who are likely to churn with a targetedmarketing offer.
• You may also build some intuitions about your customerbase, for example,
• Customers who have been with you for a couple of yearsand have up-to-date
• Cellular phones and are pretty loyal
From a business perspective, decision trees can be viewed ascreating a seg-mentation of the original data set (each segmentwould be one of the leaves of the tree). Segmentation of

99
DA
TA W
AR
EH
OU
SIN
G A
ND
DA
TA M
ININ
Gcustomers, products, and sales regions is something thatmarketing managers have been doing for many years. In thepast this seg-mentation has been performed in order to get ahigh-level view of a large amount of data-with no particularreason for creating the segmentation except that the recordswithin each segmentation were somewhat similar to each other.In this case the segmentation is done for a particular reason-namely, for the prediction of some important piece ofinformation. The records that fall within each segment fall therebecause they have similarity with respect to the infor-mationbeing predicted-not just that they are similar-without “similar-ity” being well defined. These predictive segments that arederived from the deci-sion tree also come with a description ofthe characteristics that define the pre-dictive segment. Thus thedecision trees and the algorithms that create them may becomplex, but the results can be presented in an easy-to-understand way that can be quite useful to the business user.
Decision TreesDecision trees are simple knowledge representation and theyclassify examples to a finite number of classes, the nodes arelabeled with attribute names, the edges are labeled with possiblevalues for this attribute and the leaves labeled with differentclasses. Objects are classified by following a path down the tree,by taking the edges, corresponding to the values of theattributes in an object.The following is an example of objects that describe theweather at a given time. The objects contain information on theoutlook, humidity etc. Some objects are positive examplesdenote by P and others are negative i.e. N. Classification is inthis case the construction of a tree structure, illustrated in thefollowing diagram, which can be used to classify all the objectscorrectly.
Decision Tree StructureIn order to have a clear idea of a decision tree, I have explainedit with the following examples:
Example 23.1Let us consider the following data sets-the training data set (seeTable 23.1) and the test data set (see Table 23.2). The data sethas five attributes.
Table 23.1 Training Data Set
OUTLOOK TEMP(F) HUMIDITY(%) WINDY CLASS
sunny 79 90 true no play
sunny 56 70 false play
sunny 79 75 true play
sunny 60 90 true no play
overcast 88 88 false no play
overcast 63 75 true play
overcast 88 95 false play
ram 78 60 false play
ram 66 70 false no play
ram 68 60 true no play
There is a special attribute: the attribute class is the class label.The attributes, temp (temperature) and humidity are numericalattributes and the other attributes are categorical, that is, theycannot be ordered. Based on the training data set, we want tofind a set of rules to know what values of outlook, temperature,humidity and wind, determine whether or not to play golf. Figure23.1 gives a sample decision tree for illustration.In the above tree (Figure 23.1), we have five leaf nodes. In adecision’ tree, each leaf node represents a rule. We have thefollowing rules corresponding to the tree given in Figure 23.1.RULE 1 If it is sunny and the humidity is not above 75%,
then play.RULE 2 If it is sunny and the humidity is above 75%, then do
not play.RULE 3 If it is overcast, then play.RULE 4 If it is rainy and not windy, then play.RULE 5 If it is rainy and windy. then don’t play.Please note that this may not be the best set of rules that can_be derived from the given set of training data.
Humidity Play Windy
Play No Play No Play Play
Outlook
< = 75 > 75 True FalseFigure 23.1 A Decision Tree

100
DA
TA W
AR
EH
OU
SIN
G A
ND
DA
TA M
ININ
G
The classification of an unknown input vector is done bytraversing the tree from the root node to a leaf node. A recordenters the tree at the root node. At the root, a test is applied todetermine which child node the record will encounter next. Thisprocess is repeated until the record arrives at a leaf node. All therecords that end up at a given leaf of the tree are classified in thesame way. There is a unique path from the root to each leaf. Thepath is a rule, which is used to classify the records.In the above tree, we can carry out the classification for anunknown record as follows. Let us assume” for the record, thatwe know the values of the first four attributes (but we do notknow the value of class attribute) asoutlook= rain; temp = 70; humidity = 65; and windy= true.We start from the root node to check the value of the attributeassociated at the root node. This attribute is the splittingattribute at this node. Please note that for a decision tree, atevery node there is an attribute: associated with the node calledthe splitting attribute. In our example, outlook is the splittingattribute at root. Since for the given record, outlook = rain, wemove to the right-most child node of the root. At this node,the splitting attribute is windy and we find that for the recordwe want classify, windy = true. Hence, we move to the left childnode to conclude that the class label is “no play”.Note that every path from root node to leaf nodes represents arule. It may be noted that many different leaves of the tree mayrefer to the same class labels, but each leaf refers to a differentrule.The accuracy of the classifier is determined by the percentage ofthe test data set that is correctly classified. Consider the follow-ing test data set (Table 23.2).Table 23.2 Test Data Set
OUTLOOK TEMP(F) HUMIDITY(%) WINDY CLASS sunny 79 90 true play
sun)1Y 56 70 false play sunny 79 75 true no play sunny 50 90 true no play
overcast 88 88 false no play overcast 63 75 true Play overcast 88 95 false Play
ram 78 60 false play ram 66 70 false no play rain 68 60 true play
We can see that for Rule 1 there are two records of the test dataset satisfying outlook= sunny and humidity s 75, and only oneof these is correctly classified as play. Thus, the accuracy of thisrule is 0.5 (or 50%). Similarly, the accuracy of Rule 2 is also 0'.5(or 50%). The accuracy of Rule 3 is 0.66.
Example 23.2At this stage, let us consider another example to illustrate theconcept of categorical attributes. Consider the following trainingdata set (Table 23.3). There are three attributes, namely, age, pincode and class. The attribute class is used for class label.Table 23.3 Another Example
ID AGE PINCODE CLASS 1 30 5600046 Cl 2 25 5600046 Cl 3 21 5600023 C2 4' 43 5600046 Cl 5 18 5600023 C2 6 33 5600023 Cl 7 29 5600023 Cl 8 55 5600046 C2 9 48 5600046 Cl
The attribute age is a numeric attribute, whereas pincode is acategorical one. Though the domain of pincode is numeric, noordering can be defined among pincode values. You cannotderive any useful information if one pin-code is greater thananother pincode. Figure 23.2 gives a decision tree for thistraining data. The splitting attribute at the root is pincode andthe splitting criterion here is pincode = 500 046. Similarly, forthe left child node, the splitting criterion is age £ 48 (thesplitting attribute is age). Although the right child node has thesame attribute as the splitting attribute, the splitting criterion isdifferent.Most decision tree building algorithms begin by trying to findthe test, which does the best job of splitting the records amongthe desired categories. At each succeeding level of the tree, thesubsets created by the preceding split are themselves splitaccording to whatever rule works best for them. The treecontinues to grow until it is no longer possible to find betterways to split up incoming records, or when all the records are inone class.Figure 23.2 A Decision Tree
Age < = 48; 1,2,4,8,9
Age < = 21; [3,5,6,7]
C1; 1,2,4,9 C2; 8 C2; [3,5] C1;[6,7]
Pin code = 560046; [1-9]
In Figure 23.2, we see that at the root level we have 9 records.The associated splitting criterion is pincode = 500 046. As aresult, we split the records into two subsets, Records 1, 2, 4, 8and 9 are to the left child node and the remaining to the rightnode. This process is repeated at every node.A decision tree construction process is concerned with identify-ing the splitting attributes and splitting criteria at every level ofthe tree. There are several alternatives and the main aim of the

101
DA
TA W
AR
EH
OU
SIN
G A
ND
DA
TA M
ININ
Gdecision tree construction process is to generate simple,comprehensible rules with high accuracy.Some rules are apparently better than others. In the aboveexample, we see that Rule 3 is simpler than Rule 1. The measureof simplicity is the number of antecedents of the rule. It mayhappen that another decision tree may yield a rule like: "if thetemperature lies between 70° F and 80° F, and the humidity isbetween 75% and 90%, and it is not windy, and it is sunny,then play". Naturally, we would prefer a rule like Rule 1 to thisrule. That is why simplicity is sought after.Sometimes the classification efficiency of the tree can beimproved by revising the Tree through some processes likepruning and grafting. These processes are activated after thedecision tree is built.Advantages and Shortcomings of Decision Tree Classifications:The major strength~ of the decision tree methods are thefollowing:• Decision trees are able to generate understandable rules,• They are able to handle both numerical and the categorical
attributes, and• They provide a clear indication of which fields are most
important for prediction or classification.Some of the weaknesses of the decision trees are:• Some decision trees can only deal with binary-valued target
classes. Others are able to assign records to an arbitrarynumber of classes, but are error-prone when the number oftraining examples per class gets small. This can happen ratherquickly in a tree with many levels and/or many branches pernode.
• The process of growing a decision tree is computationallyexpensive. At each node, each candidate splitting field isexamined before its best split can be found.
Where to use Decision Trees?Decision trees are a form of data mining technology that hasbeen around in a form very similar to the technology of todayfor almost 20 years now, and early versions of the algorithmsdate back till the 1960s. Often these techniques were originallydeveloped for statisticians to automate the process of determin-ing which fields in their database were actually useful orcorrelated with the particular problem that they were trying tounderstand. Partly because of this history, decision treealgorithms tend to automate the entire process of hypothesisgeneration and then validation much more completely and in amuch more integrated way than any other data mining tech-niques. They are also particularly adept at handling raw data withlittle or no preprocessing. Perhaps also because they wereoriginally developed to mimic the way an analyst interactivelyperforms data mining, they provide a simple-to-understandpredictive model based on rules (such as "90 percent of the timecredit card customers of less than 3 months who max out theircredit limits are going to default on their credit card loans").Because decision trees score so highly on so many of the criticalfeatures of data mining, they can be used in a wide variety ofbusiness problems for both exploration and prediction. Theyhave been used for problems ranging from credit card attrition
prediction to time series prediction of the exchange rate ofdifferent international currencies. There are also some problemswhere decision trees will not do as well. Some very simpleproblems in which the prediction is just a simple multiple ofthe predictor can be solved much more quickly and easily bylinear regression. Usually the models to be built and theinteractions to be detected are much more complex in real-worldproblems, and this is where decision trees excel.
Tree Construction PrincipleAfter having understood the basic features of decision trees, weshall now focus on the methods of building such trees from agiven training data set. Based on the foregoing discussion, Ishall formally define few concepts for your study.
Definition 23.1: Splitting AttributeWith every node of the decision tree, there is an associatedattribute whose values determine the partitioning of the dataset when the node is expanded.
Definition 23.2: Splitting CriterionThe qualifying condition on the splitting attribute for data setsplitting at a node, is called the splitting criterion at that node.For a numeric attribute, the criterion can be an equation or aninequality. For a categorical attribute, it is a membershipcondition on a subset of values.All the decision tree construction methods are based on theprinciple of recursively' partitioning the data set till homogene-ity is achieved. We shall study this common principle later anddiscuss in detail the features of different algorithms individu-ally. The construction of the decision tree involves the followingthree main phases.• Construction phase - The initial decision tree is constructed
in this phase, based on the entire training data set. It requiresrecursively partitioning the training set, into two, or more,sub-partitions using splitting criteria, until a stopping criteriais met.
• Pruning phase - The tree constructed in the previous phasemay not result in the best possible set of rules due to over-fitting (explained below). The pruning phase removes someof the lower branches and nodes to improve itsperformance.
• Processing the pruned tree - to improve understandability.Though these three phases are common to most of the well-known algorithms, some of them attempt to integrate the firsttwo phases into a single process.
The Generic AlgorithmMost of the existing algorithms of the construction phase useHunt's method as the basic principle in this phase. Let thetraining data set be T with class-labels {C1, C2, .., Ck}, The treeis built by repeatedly partitioning the training data, using somecriterion like the goodness of the split. The process is continuedtill all the records in a partition belong to the same class.• T is homogeneous T contains cases all belonging to a single
class Cj. The decision tree for T is a leaf identifying class Cj.• T is not homogeneous T contains cases that belong to a
mixture of classes. A test is chosen, based on a singleattribute, that has one or more mutually exclusive outcomes

102
DA
TA W
AR
EH
OU
SIN
G A
ND
DA
TA M
ININ
G
{Ol, O2, ..., On} .T is partitioned into the subsets T1, T2,T3, ..., Tn where T1; contains all those cases in T that havethe outcome OJ of the chosen test. The decision tree for Tconsists of a decision node identifying the test, and onebranch for each possible outcome. The same tree buildingmethod is applied recursively to each subset of training cases.Most often, n is chosen to be 2 and hence, the algorithmgenerates a binary decision tree.
• T is trivial T contains no cases. The decision tree T is a leaf,but the class to be associated with the leaf must bedetermined from information other than T.
The generic algorithm of decision tree construction outlines thecommon principle of all algorithms. Nevertheless, the follow-ing aspects should be taken into account while studying anyspecific algorithm. In one sense, the following are three majordifficulties, which arise when one uses a decision tree in a real-life situation.
Guillotine CutMost decision tree algorithms examine only a single attribute ata time. As mentioned in the earlier paragraph, normally thesplitting is done for a single attribute at any stage and if theattribute is numeric, then the splitting test is an inequality.Geometrically, each splitting can be viewed as a plane parallel toone of the axes. Thus, splitting one single attribute leads torectangular classification boxes that may not correspond toowell with the actual distribution of records in the decision space.We call this the guillotine cut phenomenon. The test is of theform (X> z) or (X < z), which is called a guillotine cut, since itcreates a guillotine cut subdivision of the Cartesian space of theranges of attributes.However, the guillotine cut approach has a serious problem if apair of attributes are correlated. For example, let us considertwo numeric attributes, height (in meters) and weight (inKilograms). Obviously, these attributes have a strong correla-tion. Thus, whenever there exists a correlation betweenvariables, a decision tree with the splitting criteria on a singleattribute is not accurate. Therefore, some researchers propose anoblique decision tree that uses a splitting criteria involving morethan one attribute.
Over FitDecision trees are built from the available data. However, thetraining data set may not be a proper representative of the real-life situation and may also contain noise. In an attempt to builda tree from a noisy training data set, we may grow a decision treejust deeply enough to perfectly classify the training data set.
Definition 23.3 OverfitA decision tree T is said to over fit the training data if thereexists some other tree T' which is a simplification of T, suchthat T has smaller error than T' over the training set but T' has asmaller error than T over the entire distribution of instances.Overfitting can lead to difficulties when there is noise in thetraining data, or when the number of training examples is toosmall. Specifically, if there is no conflicting instances in thetraining data set, the error of the fully built tree is zero, whilethe true error is likely to be bigger. There are many disadvan-tages of an overfitted decision tree:
a. Overfitted models are incorrectb. Overfitted decision trees require more space and more
computational resources.c. Overfitted models require the collection of unnecessary
featuresd. They are more difficult to comprehend.The pruning phase helps in handling the overfitting problem.The decision tree is pruned back by removing the subtreerooted at a node and replacing it by a leaf node, using somecriterion. Several pruning algorithms are reported in literature.In the next lesson we will study about Decision Tress Construc-tion Algorithms and the working of decision trees.
Exercises1. What is a decision tree? Illustrate with an example.2. Describe the essential features in a decision tree. How is it
useful to classify data?3. What is a classification problem? What is supervised
classification? How is a decision tree useful in classification?4. Explain where to use Decision Trees?5. What are the disadvantages of the decision tree over other
classification techniques?6. What are advantages and disadvantages of the decision tree
approach over other approaches of data mining?7. What are the three phases of construction of a decision tree?
Describe the importance of each of the phases.8. The 103 generates a
a. Binary decision treeb. A decision tree with as many branches as there are
distinct values of the attributec. A tree with a variable number of branches, not related
to the domain of the attributesd. A tree with an exponential number of branches.
Suggested Readings1. Pieter Adriaans, Dolf Zantinge Data Mining, Pearson
Education, 19962. George M. Marakas Modern Data Warehousing, Mining, and
Visualization: Core Concepts, Prentice Hall, 1st edition, 20023. Alex Berson, Stephen J. Smith Data Warehousing, Data
Mining, and OLAP (Data Warehousing/Data Management),McGraw-Hill, 1997
4. Margaret H. Dunham Data Mining, Prentice Hall, 1stedition, 2002
5. David J. Hand Principles of Data Mining (AdaptiveComputation and Machine Learning), Prentice Hall, 1stedition, 2002
6. Jiawei Han, Micheline Kamber Data Mining, Prentice Hall,1st edition, 2002
7. Michael J. Corey, Michael Abbey, Ben Taub, Ian AbramsonOracle 8i Data Warehousing McGraw-Hill Osborne Media,2nd edition, 2001

103
DA
TA W
AR
EH
OU
SIN
G A
ND
DA
TA M
ININ
G
Structure• Objective• Introduction• Best Split• Decision Tree Construction Algorithms• CART• ID3• C4.5• CHAID• When does the tree stop growing?• Why would a decision tree algorithm prevent the tree from
growing if there weren’t enough data?• Decision trees aren’t necessarily finished after they are fully
grown• Are the splits at each level of the tree always binary yes/no
splits?• Picking the best predictors• How decision trees works?
ObjectiveThe objective of this lesson is to introduce you with decisiontree construction algorithms along with the working of decisiontrees.
IntroductionIn this lesson, I will explain you various kinds of decision treeconstruction algorithms like CART, ID3, C4.5 and CHAID.You will study about the working of decision trees in detail.
Best SplitWe have noticed that there are several alternatives to choosefrom for the splitting attribute and the splitting criterion. But inorder to build an optimal decision tree, it is necessary to selectthose corresponding to the best possible split. The mainoperations during the tree building are1. Evaluation of splits for each attribute and the selection of
the best split; determination of the splitting attribute,2. Determination of the splitting condition on the selected
splitting attribute, and3. Partitioning the data using the best split.The complexity lies in determining the best split for eachattribute. The splitting also depends on the domain of theattribute being numerical or categorical. The generic algorithmfor the construction of decision trees assumes that the methodto decide the splitting attribute at a node and the splittingcriteria are known. The desirable feature of splitting is that itshould do the best job of splitting at the given stage.The first task is to decide which of the independent attributesmakes the best splitter. The best split is defined as one that
LESSON 24DECISION TREES - 2
does the best job of separating the records into groups, where asingle class predominates. To choose the best splitter at a node,we consider each independent attribute in turn.Assuming that an attribute takes on multiple values, we sort itand then, using some evaluation function as the measure ofgoodness, evaluate each split. We compare the effectiveness ofthe split provided by the best splitter from each attribute. Thewinner is chosen as the splitter for the root node. How doesone know which split is better than the other? We shall discussbelow two different evaluation functions to determine thesplitting attributes and the splitting criteria.
Decision Tree Construction AlgorithmsA number of algorithms for inducing decision trees have beenproposed over the years. However, they differ among them-selves in the methods employed for selecting splitting attributesand splitting conditions. In the following few sections, we shallstudy some of the major methods of decision tree construc-tions.
CARTCART (Classification And Regression Tree) is one of thepopular methods of building decision trees in the machinelearning community. CART builds a binary decision tree bysplitting the records at each node, according to a function of asingle attribute. CART uses the gini index for determining thebest split. CART follows the above principle of constructingthe decision tree. We outline the method for the sake ofcompletenessThe initial split produces two nodes, each of which we nowattempt to split in the same manner as the root node. Onceagain, we examine all the input fields to find the candidatesplitters. If no split can be found that significantly decreases thediversity of a given node, we label it as a leaf node. Eventually,only leaf nodes remain and we have grown the full decisiontree. The full tree may generally not be the tree that does thebest job of classifying a new set of records, because ofoverfitting.At the end of the tree-growing process, every record of thetraining set has been assigned to some leaf of the full decisiontree. Each leaf can now be assigned a class and an error rate. Theerror rate of a leaf node is the percentage of incorrect classifica-tion at that node. The error rate of an entire decision tree is aweighted sum of the error rates of all the leaves. Each leaf ’scontribution to the total is the error rate at that leaf multipliedby the probability that a record will end up in there.
ID3Quinlan introduced the ID3, Iterative Dichotomizer 3, forconstructing the decision trees from data. In ID3, each nodecorresponds to a splitting attribute and each arc is a possiblevalue of that attribute. At each node the splitting attribute isselected to be the most informative among the attributes not

104
DA
TA W
AR
EH
OU
SIN
G A
ND
DA
TA M
ININ
G
yet considered in the path from the root. Entropy is used tomeasure how informative is a node. This algorithm uses thecriterion of information gain to determine the goodness of asplit. The attribute with the greatest information gain is taken asthe splitting attribute, and the data set is split for all distinctvalues of the attribute.
C4.5C4.5 is an extension of ID3 that accounts for unavailablevalues, continuous attribute value ranges, pruning of decisiontrees and rule derivation. In building a decision tree, we can dealwith training sets that have records with unknown attributevalues by evaluating the gain, or the gain ratio, for an attributeby considering only those records where those attribute valuesare available. We can classify records that have unknownattribute values by estimating the probability of the variouspossible results. Unlike CART, which generates a binary decisiontree, C4.5 produces trees with variable branches per node. Whena discrete variable is chosen as the splitting attribute in C4.5,there will be one branch for each value of the attribute.
CHAIDCHAID, proposed by Kass in 1980, is a derivative of AID(Automatic Interaction Detection), proposed by Hartigan in1975. CHAID attempts to stop growing the tree beforeoverfitting occurs, whereas the above algorithms generate a fullygrown tree and then carry out pruning as post-processing step.In that sense, CHAID avoids the pruning phase.In the standard manner, the decision tree is constructed bypartitioning the data set into two or more subsets, based on thevalues of one of the non-class attributes. After the data set ispartitioned according to the chosen attributes, each subset isconsidered for further partitioning using the same algorithm.Each subset is partitioned without regard to any other subset.This process is repeated for each subset until some stoppingcriterion is met. In CHAID, the number of subsets in apartition can range from two up to the number of distinctvalues of the splitting attribute. In this regard, CHAID differsfrom CART, which always forms binary splits, and from ID3 orC4.5, which form a branch for every distinct value.The splitting attribute is chosen as the one that is mostsignificantly associated with the dependent attributes accordingto a chi-squared test of independence in a contingency table (across-tabulation of the non-class and class attribute). The mainstopping criterion used by such methods is the p-value fromthis chi-squared test. A small p-value indicates that the observedassociation between the splitting attribute and the dependentvariable is unlikely to have occurred solely as the result ofsampling variability.If a splitting attribute has more than two possible values, thenthere may be a very large number of ways to partition the dataset based on these values. A combinatorial search algorithm canbe used to find a partition that has a small p-value for the chi-squared test. The p-values for each chi-squared test are adjustedfor the multiplicity of partitions. A Bonferroni adjustment isused for the p-values computed from the contingency tables,relating the predictors to the dependent variable. The adjust-ment is conditional on the number of branches (compound
categories) in the partition, and thus does not take into accountthe fact that different numbers of branches are considered.
When does the tree stop growing?If the decision tree algorithm just continued like this, it couldconceivably cre-ate more and more questions and branches inthe tree so that eventually there was only one record in thesegment. To let the tree grow to this size is compu-tationallyexpensive and also unnecessary. Most decision tree algorithmsstop growing the tree when one of three criteria are met:1. The segment contains only one record or some
algorithmically defined min-imum number of records,(Clearly, there is no way to break a smile-record segment intotwo smaller segments, and segments with very few recordsare not likely to be very helpful in the final prediction sincethe predictions that they are making won’t be based onsufficient historical data.)
2. The segment is completely organized into just oneprediction value. There is no reason to continue furthersegmentation since this data is now com-pletely organized(the tree has achieved its goal).
3. The improvement in organization is not sufficient towarrant making the split. For instance, if the startingsegment were 90 percent churners and the resulting segmentsfrom the best possible question were 90.001 percent churnersand 89.999 percent churners, then not much progress wouldhave been or could be made by continuing to build the tree.
Why would a decision tree algorithm prevent thetree from growing if there weren’t enough data?Consider the following example of a segment that we mightwant to split further because it has only two examples. Assumethat it has been created out of a much larger customer databaseby selecting only those customers aged 27 with blue eyes andwith salaries ranging between $80,000 and $81,000.In this case all the possible questions that could be asked aboutthe two cus-tomers turn out to have the same value (age, eyecolor, salary) except for name.TABLE: Decision Tree Algorithm Segment>
Name Age Eyes Salary ($) Churned? Steve 27 Blue 80,000 Yes Alex 27 Blue 80,000 No * This segment cannot be split further except by using thepredictor “name.”
Decision trees aren’t necessarily finished after theyare fully grownAfter the tree has been grown to a certain size (depending onthe particular stop-ping criteria used in the algorithm), theCART algorithm has still more work to do. The algorithm thenchecks to see if the model has been over fit to the data. It doesthis in several ways using a cross-validation approach or a testset valida-tion approach-basically using the same mind-numbingly simple approach it used to find the best questionsin the first place: trying many different simpler versions of thetree on a held-aside test set. The algorithm as the best modelselects the tree that does the best on the held-aside data. The

105
DA
TA W
AR
EH
OU
SIN
G A
ND
DA
TA M
ININ
Gnice thing about CART is that this testing and selection is all anintegral part of the algo-rithm as opposed to the after-the-factapproach that other techniques use.
Are the splits at each level ofthe tree always binary yes/nosplits?There are several different methods ofbuilding decision trees, some of whichcan make splits on multiple values attime-for instance, eye color: green, blue,and brown. But recognize that any treethat can do binary splits can effectivelypartition the data in the same way byjust building two levels of the tree: the first, which splits brownand blue from green; and the second, which splits apart thebrown and blue split. Either way, the minimum number ofquestions you need to ask is two.
How the Decision Tree WorksIn the late 1970s J. Ross Quinlan introduced a decision treealgorithm named ID3. This was one of the first decision treealgorithms though it was built solidly on previous work oninference systems and concept learning systems from thatdecade and the preceding decade. Initially ID3 was used fortasks such as learn-ing good game-playing strategies for chessend games. Since then ID3 has been applied to a wide variety ofproblems in both academia and industry and has been modi-fied, improved, and borrowed from many times over.ID3 picks predictors and their splitting values on the basic ofthe gain in information that the split or splits provide. Gainrepresents the difference between the amount of informationthat is needed to correctly make a predic-tion both before andafter the split has been made (if the amount of informa-tionrequired is much lower after the split is made, then that split hasdecreased the disorder of the original single segment) and isdefined as the dif-ference between the entropy of the originalsegment and the accumulated entropies of the resulting splitsegments. Entropy is a well-defined measure of the disorder orinformation found in data.The entropies of the child segments are accumulated byweighting their con-tribution to the entire entropy of the splitaccording to the number of records they contain. For instance,which of the two splits shown in Table 18.7 would you thinkdecreased the entropy the most and thus would provide thelargest gain?Split A is actually a much better split than B because it separatesout more of the data despite the fact that split B creates a newsegment that is perfectly homogeneous (0 entropy). Theproblem is that this perfect zero-entropy seg-ment has only onerecord in it and splitting off one record at a time will not cre-atea very useful decision tree. The small number of records in eachsegment (Let 1) is unlikely to provide usefulrepeatable patterns. The calculation (met-ric)that we use
Table - Two Possible Splits for Eight Records withCalculation of Entropy for Each Split Shown*
to determine which split is chosen should make the correctchoice in this case and others like it. The metric needs to takeinto account two main effects:• How much has the disorder been lowered in the new
segments?• How should the disorder in each segment be weighted?The entropy measure can easily be applied to each of the newsegments as eas-ily as it was applied to the parent segment toanswer the first question, but the second criterion is a bit harder.Should all segments that result from a split be treated equally?This question needs to be answered in the example abovewhere the split has produced a perfect new segment but withlittle real value because of its size. If we just took the averageentropy for the new segments, we would choose split B since inthat case the average of 0.99 and 0.0 is around 0.5 We can alsodo this calculation for split A and come up with an averageentropy of 0.72 for the new segments.If, on the other hand, we weighted the contribution of eachnew segment with respect to the size of the segment (andconsequently how much of the database that segment ex-plained), we would get a quite different measure of thedisor-der across the two new segments. In this case theweighted entropy of the two segments for split A is the sameas before but the weighted entropy of split B is quite a bithigher. (See the following Table)Since the name of this game is to reduce entropy to as little aspossible, we are faced with two different choices of which is thebest split. If we average the entropies of the new segments, wewould pick split B; if we took into account the number ofrecords that are covered by each split, we would pick split A.ID3 uses the weighted entropy approach as it has been found,in general, to produce better predictions than just averaging theentropy. Part of the reason for this may be that, as .we haveseen from the modeling chapter, that the more data that is usedin a prediction, the more likely the prediction is to be correct andthe more likely the model is to match the true underlying causalreasons and processes that are actually at work in forming theprediction values.

106
DA
TA W
AR
EH
OU
SIN
G A
ND
DA
TA M
ININ
G
State of the IndustryThe current offerings in decision tree software emphasizedifferent important aspects and use of the algorithm. Thedifferent emphases are usually driven because of differences inthe targeted user and the types of problems being solved. Thereare four main categories of products:• Business-those that emphasize ease of use for the business
users• Performance-those that emphasize the overall performance
and database size• Exploratory-those that emphasize ease of use for the
analyst• Research-those tailored specifically for detailed research
or academic experimentationTools such as Pilot Software’s Discovery Server fall into thecategory of busi-ness use. The Pilot Discovery Server (trade-mark) provides easy-to-use graphi-cal tools to help the businessuser express their modeling problem and also providesapplications such as the Pilot Segment Viewer and Pilot ProfitChart (both trademarks) to allows business end users tovisualize the model and per-form simple profitless models ondifferent targeted marketing applications. A tool that falls intothe performance category would be Thinking Machines Cor-poration’s Star Tree tool, which implements CART on MPPand SMP computer hardware and has been optimized for largedatabases and difficult-to-solve problems. Angoss’ KnowledgeSeeker (trademark) tool, on the other hand, is targeted mostly atthe PC user but provides more control to the analyst to spec-ifydifferent parameters that control the underlying CHAIDalgorithm, if desired. Salford Systems’ CART product provideseven more control over the underlying algorithms but providesonly limited GUI or applications support; however, it is usefulto researchers and business analysts who want in-depth analysisand control over their model creation.
Exercises1. What are advantages and disadvantages of the decision tree
approach over other approaches of data mining?2. Describe the ID3 algorithm of the decision tree construction.
Why is it unsuitable for data mining applications?3. Consider the following examples
MOTOR WHEELS DOORS SIZE TYPE CLASS
NO 2 0 small cycle bicycle
NO 3 0 small cycle tricycle
YES 2 0 small cycle motorcycle
YES 4 2 small automobile Sports car
YES 4 3 medium automobile minivan
YES 4 4 medium automobile sedan
YES 4 4 large automobile sumo
Use this example to illustrate the working of different algo-rithms.4. Overfitting is an inherent characteristic of decision tree and
its occurrence depends on the construction process and noton the training data set. True or False?
5. Pruning is essentially to avoid overfitting. True or False?6. Bootstrapping is carried out in the main memory. True or
False?7. Write short notes on:
• C4.5• CHAID• ID3• CART
Suggested Readings
1. Pieter Adriaans, Dolf Zantinge Data Mining, PearsonEducation, 1996
2. George M. Marakas Modern Data Warehousing, Mining, andVisualization: Core Concepts, Prentice Hall, 1st edition, 2002
3. Alex Berson, Stephen J. Smith Data Warehousing, DataMining, and OLAP (Data Warehousing/Data Management),McGraw-Hill, 1997
4. Margaret H. Dunham Data Mining, Prentice Hall, 1stedition, 2002
5. David J. Hand Principles of Data Mining (AdaptiveComputation and Machine Learning), Prentice Hall, 1st edition,2002
6. Jiawei Han, Micheline Kamber Data Mining, Prentice Hall,1st edition, 2002
7. Michael J. Corey, Michael Abbey, Ben Taub, IanAbramson Oracle 8i Data Warehousing McGraw-Hill OsborneMedia, 2nd edition, 2001

107
DA
TA W
AR
EH
OU
SIN
G A
ND
DA
TA M
ININ
G
Structure• Objective• Introduction• What is a Neural Network?• Learning in NN• Unsupervised Learning• Data Mining using NN: A Case Study
ObjectiveThe aim of this lesson is to introduce you with the concept ofNeural Networks. It also includes various topics, which explainshow the method of neural network is helpful in extracting theknowledge from the warehouse.
IntroductionData mining is essentially a task of learning from data andhence, any known technique which attempts to learn from datacan, in principle, be applied for data mining purposes. Ingeneral, data mining algorithms aim at minimizing I/Ooperations of disk-resident data, whereas conventionalalgorithms are more concerned about time and space complexi-ties, accuracy and convergence. Besides the techniques discussedin the earlier lessons, a few other techniques hold promise ofbeing suitable for data mining purposes. These are NeuralNetworks (NN), Genetic Algorithms (GA) and Support VectorMachines (SVM). The intention of this chapter is to brieflypresent you the underlying concepts of these subjects anddemonstrate their applicability to data mining. We envisage thatin the coming years these techniques are going to be importantareas of data mining techniques.
Neural NetworksThe first question that comes to the mind is, what is thisNeural Network?When data mining algorithms are discussed these days, peopleare usually talking about either decision trees or neural net-works. Of the two, neural net-works have probably been ofgreater interest through the formative stages of data miningtechnology. As we will see, neural networks do have disadvan-tages that can be limiting in their ease of use and ease ofdeployment, but they do also have some significant advantages.Foremost among these advantages are their highly accuratepredictive models, which can be applied across a large numberof different types of problems.To be more precise, the term neural network might be definedas an “artifi-cial” neural network. True neural networks arebiological systems [also known as (a.k.a.) brains] that detectpatterns, make predictions, and learn. The artifi-cial ones arecomputer programs implementing sophisticated patterndetection and machine learning algorithms on a computer tobuild predictive models from large historical databases. Artificialneural networks derive their name from their historical develop-
LESSON 25NEURAL NETWORKS
ment, which started off with the premise that machines couldbe made to “think” if scientists found ways to mimic the struc-ture and functioning of the human brain on the computer.Thus historically neural networks grew out of the communityof artificial intelligence rather than from the discipline ofstatistics. Although scientists are still far from understandingthe human brain, let alone mimicking it, neural networks thatrun on computers can do some of the things that people cando.lt is difficult to say exactly when the first “neural network” on acomputer was built. During World War II a seminal paper waspublished by McCulloch and Pitts which first outlined the ideathat simple processing units (like the individual neurons in thehuman brain) could be connected together in large \networksto create a system that could solve difficult problems anddisplay behavior that’ was much more complex than the simplepieces that made it up. Since that time much progress has beenmade in finding ways to apply artifi cial neural networks to real-world prediction problems and improving the per-formance ofthe algorithm in general. In many respects the greatest break-through in neural networks in recent years have been in theirapplication to more mundane real-world problems such ascustomer response prediction or fraud detection rather than theloftier goals that were originally set out for the techniques suchas overall human learning and computer speech and imageunderstanding.
Don’t neural networks learn to make betterpredictions?Because of the origins of the techniques and because of someof their early suc-cesses, the techniques have enjoyed a great dealof interest. To understand how neural networks can detectpatterns in a database, an analogy is often made that they“learn” to detect these patterns and make better predictions,similar to the way human beings do. This view is encouraged bythe way the historical training data is often supplied thenetwork-one record (example) at a time.Networks do “learn” in a very real sense, but under the hood,the algo-rithms and techniques that are being deployed are nottruly different from the techniques found in statistics or otherdata mining algorithms. It is, for instance, unfair to assume thatneural networks could outperform other tech-niques becausethey “learn” and improve over time while the other techniquesremain static. The other techniques, in fact, “learn” fromhistorical examples in exactly the same way, but often theexamples (historical records) to learn from are processed all atonce in a more efficient manner than are neural networks, whichoften modify their model one record at a time.
Are neural networks easy to use?A common claim for neural networks is that they are automatedto a degree where the user does not need to know that muchabout how they work, or about predictive modeling or even the

108
DA
TA W
AR
EH
OU
SIN
G A
ND
DA
TA M
ININ
G
database in order to use them. The implicit claim is also thatmost neural networks can be unleashed on your data straightout of the box without the need to, rearrange or modify thedata very much to begin with.Just the opposite is often true. Many important designdecisions need to be made in order to effectively use a neuralnetwork, such as• How should the nodes in the network be connected?• How many neurons like processing units should be used?• When should “training” be stopped in order to avoid over
fitting?There are also many important steps required for preprocessingthe data that goes into a neural network-most often there is arequirement to normalize numeric data between 0.0 and 1.0,and categorical predictors may need to be broken up into virtualpredictors that are 0 or 1 for each value of the original categoricalpredictor. And, as always, understanding what the data in yourdatabase means and a clear definition of the business problemto be solved are essential to ensuring eventual success. Thebottom line is that neural networks provide no shortcuts.
Business ScorecardNeural networks are very powerful predictive modelingtechniques, but some of the power comes at the expense ofease of use and ease of deployment. As we will see in thischapter, neural networks create very complex models that arealmost always impossible to fully understand, even by experts.The model itself is represented by numeric values in a complexcalculation that requires all the predictor values to be in the formof a number. The output of the neural net-work is alsonumeric and needs to be translated if the actual prediction valueis categorical (e.g., predicting the demand for blue, white, orblack jeans for a clothing manufacturer requires that thepredictor values blue, black and white for the predictor color beconverted to numbers). Because of the complexity of thesetechniques, much effort has been expended in trying to increasethe clar-ity with which the model can be understood by the enduser. These efforts are still in their infancy but are of tremen-dous importance since most data mining techniques includingneural networks are being deployed against real businessproblems where significant investments are made on the basisof the predic-tions from the models (e.g., consider trusting thepredictive model from a neural network that dictates which onemillion customers will receive a $1 mailing).These shortcomings in understanding the meaning of theneural network model have been successfully addressed in twoways:1. The neural network is packaged up into a complete solution
such as fraud prediction. This allows the neural network tobe carefully crafted for one particular application, and once ithas been proven successful, it can be used over and overagain without requiring a deep understanding of how itworks.
2. The neural network is packaged up with expert consultingservices. Here trusted experts who have a track record ofsuccess deploy the neural network. The experts either are ableto explain the models or trust that the models do work.
The first tactic has seemed to work quite well because when thetechnique is used for a well-defined problem, many of thedifficulties in preprocessing the data can be automated (becausethe data structures have been seen before) and interpretation ofthe model is less of an issue since entire industries begin to usethe technology successfully and a level of trust is created. Severalven-dors have deployed this strategy (e.g., HNC’s Falcon systemfor credit card fraud prediction and Advanced Software Applica-tions’ Model MAX package for direct marketing).Packaging up neural networks with expert consultants is also aviable strat-egy that avoids many of the pitfalls of using neuralnetworks, but it can be quite expensive because it is human-intensive. One of the great promises of data mining is, after all,the automation of the predictive modeling process. Theseneural network-consulting teams are little different from theanalytical departments many companies already have in house.Since there is not a great difference in the overall predictiveaccuracy of neural networks over standard statistical techniques,the main difference becomes the replacement of the sta-tisticalexpert with the neural network expert. Either with statistics orneural network experts, the value of putting easy-to-use toolsinto the hands of the business end user is still not achieved.Neural networks rate high for accurate mod-els that providegood return on investment but rate low in terms of automa-tion and clarity, making them more difficult to deploy across theenterprise.
Where to use Neural NetworksNeural networks are used in a wide variety of applications. Theyhave been used in all facets of business from detecting thefraudulent use of credit cards and credit risk prediction toincreasing the hit rate of targeted mailings. They also have along history of application in other areas such as the military forthe automated driving of an unmanned vehicle at 30 mph onpaved roads to biological simulations such as learning thecorrect pronunciation of English words from written text.
Neural Networks for ClusteringNeural networks of various kinds can be used for clustering andprototype cre-ation. The Kohonen network described in thischapter is probably the most common network used forclustering and segmentation of the database. Typi-cally thenetworks are used in a unsupervised learning mode to create theclus-ters. The clusters are created by forcing the system tocompress the data by cre-ating prototypes or by algorithms thatsteer the system toward creating clus-ters that compete againsteach other for the records that they contain, thus ensuring thatthe clusters overlap as little as possible.
Business Score Card for Neural NetworksData mining measure DescriptionAutomation Neural networks are often repre
sented as automated data miningtechniques. While they are verypowerful at building predictivemodels, they do require significantdata preprocessing and a goodunderstanding and definition ofthe prediction target. Usually

109
DA
TA W
AR
EH
OU
SIN
G A
ND
DA
TA M
ININ
Gnormalizing predictor values between 0.0 and1.0 and converting categorical to numericvalues is required. The networks themselvesalso require the setting of numerousparameters that determine how the neuralnetwork is to be constructed (e.g., thenumber of hidden nodes). There can besignificant differences in performance due tosmall differences in the neural network setupor the way the data is preformatted.
Clarity The bane of neural networks is often theclarity with which the user can see andunderstand the results that are beingpresented. To some degree the complexity ofthe neural network models goes hand inhand with their power to create accuratepredictions. This shortcoming in clarity isrecognized by the neural network vendors,and they have tried to provide powerfultechniques to better visualize the neuralnetworks and to possibly
ROI provide understandable rulers prototypes tohelp explain the models. Neural networksdo provide powerful predictive models andtheoretically are more general than other datamining and standard statistical techniques. Inpractice, however, the gains in accuracy overother techniques are often quite small andcan be dwarfed by some of the costs becauseof careless construction or use of the modelby nonexperts. The models can also be quitetime-consuming to build.
Neural Networks for Feature ExtractionOne of the important problems in all data mining is determin-ing which predic-tors are the most relevant and the mostimportant in building models that are most accurate at predic-tion. These predictors may be used by themselves or inconjunction with other predictors to form “features.” A simpleexample of a fea-ture in problems that neural networks areworking on is the feature of a verti-cal line in a computer image.The predictors, or raw input data, are just the colored pixels(picture elements) that make up the picture. Recognizing thatthe predictors (pixels) can be organized in such a way as to createlines, and then using the line as the input predictor, can proveto dramatically improve the accuracy of the model and decreasethe time to create it.Some features such “as lines in computer images are things thathumans are already pretty good at detecting; in other problemdomains it is more difficult to recognize the features. One novelway that neural networks have been used to detect features is toexploit the idea that features are a form of a compres-sion ofthe training database. For instance, you could describe an imageto a friend by rattling off the color and intensity of each pixelon every point in the picture, or you could describe it at a higherlevel in terms of lines and circles or maybe even at a higher levelof features such as trees and mountains. In either case yourfriend eventually gets all the information needed to know what
the picture looks like, but certainly describing it in terms ofhigh-level features requires much less communication ofinformation than the “paint by numbers” approach ofdescribing the color on each square millimeter of the image.If we think of features in this way, as an efficient way tocommunicate our data, then neural networks can be used toautomatically extract them. Using just five hidden nodes usesthe neural network shown in Fig. 25.1 to extract features byrequiring the network to learn to re-create the input data at theoutput nodes. Consider that if you were allowed 100 hiddennodes, then re-creating the data for the network would be rathertrivial-involving simply pass-ing the input node value directlythrough the corresponding hidden node and on to the outputnode. But as there are fewer and fewer hidden nodes, that infor-mation has to be passed through the hidden layer in a moreand more efficient manner since there are less hidden nodes tohelp pass along the information.To accomplish this, the neural network tries to have the hiddennodes extract features from the input nodes that efficientlydescribe the record rep-resented at the input layer. This forced“squeezing” of the data through the narrow hidden layer forcesthe neural network to extract only those predictors and combi-nations of predictors that are best at re-creating the inputrecord. The link weights used to create the inputs to the hiddennodes are effectively cre-ating features that are combinations ofthe input node values.
Applications Score CardTable 25.1 show the applications scorecard for neural net-workswith respect to how well they perform for a variety of basicunderlying applications. Neural networks have been used forjust about every type of supervised and unsupervised learningapplication. Because the underlying model is a complexmathematical equation, the generation of rules and the effi-cientdetection of links in the database is a stretch for neural net-works. Also, because of the large number of different words intext-based applications (high dimensionality), neural networksare seldom used for text retrieval. They do provide some senseof confidence in the degree of the prediction so that outlierswho do not match the existing model can be detected.
Fig: 25.1

110
DA
TA W
AR
EH
OU
SIN
G A
ND
DA
TA M
ININ
G
TABLE 25.1 Applications Score Card for Neural NetworksProblem type DescriptionClusters Although neural networks were
originally conceived to mimic neuralfunction in the brain and then usedfor a variety of prediction andclassification tasks, they have alsobeen found useful for clustering.Almost coincidentally, the self-organizing nature of the brainwhen mimicked in an artificialneural network results in theclustering of records from adatabase.
Links Neural networks can be used todetermine links and patterns in thedatabase, although to be efficient,neural architectures very differentfrom the standard single hiddenlayer need to be used. To do thisefficiently, a network wouldgenerally have as many input nodesas output nodes and each nodewould represent an individualobject that could be linked together.
Outliers The general structure of the neuralnetwork is not designed for outlierdetection in the way that nearest-neighbor classification techniquesare, but they can be used for outlierdetection by simply building thepredictive model and seeing whichrecord’s actual values correspond tothe predicted values. Any largedisparity between the actual andpredicted could well be an outlier.
Rules Neural networks do not generaterules either for classification orexplanation. Some new techniquesare now being developed thatwould create rules after the fact totry to help explain the neuralnetwork, but these are additions tothe basic neural network architecture.
Sequences Because of their strengths inperforming predictions for numericprediction values and regression ingeneral, neural networks are oftenused to do sequence prediction (likepredicting the stock market).Generally a significant amount ofpreprocessing of the data needs tobe performed to convert the timeseries data into something useful tothe neural network.
Text Because of the large number of possibleinput nodes (number of different wordsused in a given language), neural networksare seldom used for text retrieval. They havebeen used at a higher level to create a networkthat learns the relationships betweendocuments.
The General Idea
What does a neural network look like?A neural network is loosely based on concepts of how thehuman brain is orga-nized and how it learns. There are twomain structures of consequence in the neural network:1. The node-which loosely corresponds to the neuron in the
human brain2. The link-which loosely corresponds to the connections
between neurons(Axons, dendrites, and synapses) in the human brainFigure 25.2 is a drawing of a simple neural network. The roundcircles repre-sent the nodes, and the connecting lines representthe links. The neural net-work functions by accepting predictorvalues at the left and performing calculations on those values toproduce new values in the node at the far right. The value at thisnode represents the prediction from the neural network model.In this case the network takes in values for predictors for ageand income and predicts whether the person will default on abank loan.
How does a neural net make a prediction?In order to make a prediction, the neural network accepts thevalues for the predictors on what are called the input nodes.These become the values for those nodes; these values are thenmultiplied by values that are stored in the links (sometimescalled weights and in some ways similar to the weights that areapplied to predictors in the nearest-neighbor method). Thesevalues are then added together at the node at the far right (theoutput node), a special threshold function is applied, and theresulting number is the prediction. In this case, if the resultingnumber is 0, the record is considered to be a good

111
DA
TA W
AR
EH
OU
SIN
G A
ND
DA
TA M
ININ
G
Figure 25.3, The normalized input values are multiplied bythe link weights and added together at the output.Credit risk (no default); if the number is 1; the record isconsidered to be a bad credit risk (likely default).A simplified version of the calculations depicted in Fig. 25.2might look like Fig. 25.3. Here the value of age of 47 isnormalized to fall between 0.0 and 1.0 and has the value 0.47,and the income is normalized to the value 0.65. This simplifiedneural network makes the prediction of no default for a 47-year-old making $65,000. The links are weighted at 0.7 and 0.1, andthe resulting value after multiplying the node values by the linkweights is 0.39. The network has been trained to learn that anoutput value of 1.0 indicates default and that 0.0 indicate nodefault. The output value calculated here (0.39) is closer to 0.0than to 1.0, so the record is assigned a no default prediction.
How is the neural network model created?The neural network model is created by presenting it with manyexamples of the predictor values from records in the training set(in this example age and income are used) and the predictionvalue from those same records. By comparing the correct answerobtained from the training record and the pre-dicted answerfrom the neural network, it is possible to slowly change thebehavior of the neural network by changing the values of thelink weights. In some ways this is like having a grade schoolteacher ask questions of her student (a.k.a. the neural network)and if the answer is wrong, to verbally correct the student. Thegreater the error, the harsher the verbal correction; thus largeerrors are given greater attention at correction than are smallerrors.For the actual neural network, it is the weights of the links thatactually con-trol the prediction value for a given record. Thus theparticular model that is being found by the neural network is, infact, fully specified by the weights and the architectural structureof the network. For this reason it is the link weights that aremodified each time an error is made.
How complex can the neural network modelbecome?The models shown in Figs. 25.2 and 25.3 have been designedto be as simple as possible in order to make them understand-able. In practice no networks are as simple as these. Figure 25.4shows a network with many more links and many more nodes.This was the architecture of a neural network system calledNET talk, which learned how to pronounce written Englishwords. This draw-ing shows only some of the nodes and links.Each node in the network was con-nected to every node in thelevel above it and below it, resulting in 18,629 link weights thatneeded to be learned in the network. Note that this networkalso now has a row of nodes in between the input nodes andthe output nodes. These are called “hidden nodes” or the“hidden layer” because the values of these nodes are not visibleto the end user in the way that the output nodes are (whichcontain the prediction) and the input nodes (which just containthe pre-dictor values). There are even more complex neuralnetwork architectures that have more than one hidden layer. Inpractice one hidden layer seems to suffice, however.
Fig. 25.4
Notes

112
DA
TA W
AR
EH
OU
SIN
G A
ND
DA
TA M
ININ
G
Structure• Objective• What Is A Neural Network?• Hidden nodes are like trusted advisors to the output nodes• Design decisions in architecting a neural network• How does the neural network resemble the human brain?• Applications Of -Neural Networks• Data Mining Using NN: A Case Study
ObjectiveThe main objective of this lesson is to introduce you theprinciples of neural computing.
What is a Neural Network?Neural networks are a different paradigm for computing, whichdraws its inspiration from neuroscience. The human brainconsists of a network of neurons, each of which is made up ofa number of nerve fibres called dendrites, connected to the cellbody where the cell nucleus is located. The axon is a long, singlefibre that originates from the cell body and branches near its endinto a number of strands. At the ends of these strands are thetransmitting ends of the synapses that connect to otherbiological neurons through the receiving ends of the synapsesfound on the dendrites as well as the cell body of biologicalneurons. A single axon typically makes thousands of synapseswith other neurons. The transmission process is a complexchemical process, which effectively increases or decreases theelectrical potential within the cell body of the receiving neuron.When this electrical potential reaches a threshold value (actionpotential), it enters its excitatory state and is said to fire. It is theconnectivity of the neuron that gives these simple ‘devices’ theirreal power.Artificial neurons (or processing elements, PE) are highlysimplified models of biological neurons. As in biologicalneurons, an artificial neuron has a number of inputs, a cell body(most often consisting of the summing node and the transferfunction), and an output, which can be connected to a numberof other artificial neurons. Artificial neural networks are denselyinterconnected networks of PEs, together with a rule (learningrule) to adjust the strength of the connections between theunits in response to externally supplied data.
The evolution of neural networks as a new computationalmodel originates from the pioneering work of McCulloch andPitts in 1943. They suggested a simple model of a neuron thatconnoted the weighted sum of the inputs to the neuron and anoutput of 1 or 0, according to whether the sum was over athreshold value or not. A 0 output would correspond to theinhibitory state of the neuron, while a 1 output wouldcorrespond to the excitatory state of the neuron. Consider asimple example illustrated below.
LESSON 26NEURAL NETWORKS
The network has 2 binary inputs, I0 and I1 and one binaryoutput Y. W0 and W1 are the connection strengths of input 1and input 2, respectively. Thus, the total input received at theprocessing unit is given by
W0I0 + W1I1 - Wb,whereWb is the threshold (in another notational convention, it isviewed as the bias). The output Y takes on the value 1, if W0I0
+ W1I1 - Wb, > 0 and, otherwise, it is 0 ifW0I0 + Will - Wb £ O.But the model, known as perceptron, was far from a true modelof a biological neuron as, for a start, the biological neuron’soutput is a continuous function rather than a step function.This model also has a limited computational capability as itrepresents only a linear-separation. For two classes of inputs,which are linearly separable, we can find the weights such thatthe network returns 1 as output for one class and 0 for anotherclass.
There have been many improvements on this simple modeland many architectures have been presented in recently. As a firststep, the threshold function or the step function is replaced byother more general, continuous functions called activation.
Figure 26.1 a simple perceptron
Figure 26.2 A Typical Artificial Neuron with ActivationFunction

functions. Figure 26.2 illustrates the structure of a node (PE)with an activation function. For this particular node, n weightedinputs (denoted W;, i = 1,..., n) are combined via a combinationfunction that often consists of a simple summation. A transferfunction then calculates a corresponding value, the resultyielding a single output, usually between 0 and 1. Together, thecombination function and the transfer function make up theactivation function of the node.
Three common transfer functions are the sigmoid, linear andhyperbolic functions. The sigmoid function (also known as thelogistic function) is very widely used and it produces valuesbetween 0 and 1 for any input from the combination function.The sigmoid function is given by (the subscript n identifies aPE):
Y =
Note that the function is strictly positive and defined for allvalues of the input. When plotted, the graph takes on asigmoid shape, with an inflection point at (0, .5) in the Carte-sian plane. The graph (Figure 26.3) plots the different values ofS as the input varies from -10 to 10.
Individual nodes are linked together in different ways to createneural networks. In a feed-forward network, the connectionsbetween layers are unidirectional from input to output. Wediscuss below two different architectures of the feed-forwardnetwork, Multi-Layer Perceptron and Radial-Basis Function.
Figure 26.3 Sigmoid Functions
Hidden nodes are like trusted advisors to the outputnodesThe meanings of the input nodes and the output nodes areusually pretty well understood-and are usually defined by theend user with respect to the par-ticular problem to be solvedand the nature and structure of the database. The hiddennodes, however, do not have a predefined meaning and aredetermined by the neural network as it trains. This poses twoproblems:
1. It is difficult to trust the prediction of the neural network ifthe meaning of these nodes is not well understood.
2. Since the prediction is made at the output layer and thedifference between the prediction and the actual value iscalculated there, how is this error cor-rection fed backthrough the hidden layers to modify the link weights. Thoseconnect them?
The meaning of these hidden nodes is not necessarily wellunderstood but sometimes after the fact they can be studied tosee when they are active (have larger numeric values) and whenthey are not and derive some meaning from them. In some ofthe earlier neural networks were used to learn the family trees oftwo different families-one was Italian and one was English andthe network was trained to take as inputs either two people andreturn their rela-tionship (father, aunt, sister, etc.) or given oneperson and a relationship to return the. Other person. Aftertraining, the units in one of the hidden layers were exam medto see If there was any discernible explanation as to their role inthe prediction. Several of the nodes did seem to have specificand under-standable purposes. One, for instance, seemed tobreak up the input records (people) into either Italian orEnglish descent, another unit encoded for which generation aperson belonged to, and another encoded for the branch of thefamily that the person came from. The neutral network to aid inpredictor automatically extracted each of these nodes.Any interpretation of the meaning of the hidden nodes needsto be done after the fact-after the network has been trained, andit is not always possible to determine a logical description forthe particular function for the hidden nodes. The secondproblem with the hidden nodes is perhaps more serious (if ithadn’t been solved, neural networks wouldn’t work). Luckily ithas been solved.The learning procedure for the neural network has been definedto work for the weights in the links connecting the hidden layer.A good analogy of how this works would be a militaryoperation in some war where there are many layers of com-mand with a general ultimately responsible for making thedecisions on where to advance and where to retreat. Sev-erallieutenant generals probably advise the general, and severalmajor generals, in turn, probably advise each lieutenant general.This hierarchy continues downward through colonels andprivates at the bottom of the hierarchy.This is not too far from the structure of a neural network withseveral hid-den layers and one output node. You can think ofthe inputs coming from the hidden nodes as advice. The linkweight corresponds to the trust that generals have in theiradvisors. Some trusted advisors have very high weights andsome advisors may not be trusted and, in fact, have negativeweights. The other part of the advice from the advisors has todo with how competent the particularAdvisor is for a given situation. The general may have a trustedadvisor, but if that advisor has no expertise in aerial invasionand the situation in question involves the air force, this advisormay be very well trusted but the advisor per-sonally may nothave any strong opinion one way or another.

In this analogy the link weight of a neural network to anoutput unit is like the trust or confidence that commandershave in their advisors and the actual node value represents howstrong an opinion this particular advisor has about thisparticular situation. To make a decision, the general considershow trustworthy and valuable the advice is and how knowl-edgeable and confident all the advisors are in making theirsuggestions; then, taking all this into account, the general makesthe decision to advance or retreat.In the same way, the output node will make a decision (aprediction) by tak-ing into account all the input from itsadvisors (the nodes connected to it). In the case of the neuralnetwork multiplying the link weight by the output value of thenode and summing these values across all nodes reach thisdecision. If the prediction is incorrect, the nodes that had themost influence on making the decision have their weightsmodified so that the wrong prediction is less likely to be madethe next time.This learning in the neural network is very similar to whathappens when the general makes the wrong decision. Theconfidence that the general has in all those advisors who gavethe wrong recommendation is decreased-and all the more so forthose advisors who were very confident and vocal in they’re rec-ommendations. On the other hand, any advisors who weremaking the correct recommendation but whose input was nottaken as seriously would be taken more seriously the next time.Likewise, any advisors who were reprimanded for giving thewrong advice to the general would then go back to their ownadvisors and determine which of them should have beentrusted less and whom should have been listened to moreclosely in rendering the advice or recommendation to thegeneral. The changes generals should make in listening to theiradvisors to avoid the same bad decision in the future are shownin Table 26.1.This feedback can continue in this way down throughout theorganizational each level, giving increased emphasis to thoseadvisors who had advised cor-rectly and decreased emphasis tothose who had advised incorrectly. In this way the entireorganization becomes better and better at supporting the gen-eral in making the correct decision more of the time.A very similar method of training takes place in the neuralnetwork. It is called back propagation and refers to the propaga-tion of the error backward from the output nodes (where theerror is easy to determine as the difference between the actualprediction value from the training database and the pre-
TABLE 26.1 Neural Network Nodes.
General's trust Advisor's
Recommendation
Advisor's
Confidence
Change to
General’s trust
High Good High Great increase
High Good Low Increase
High Bad High Great decrease
High Bad Low Decrease
Low Good High Increase
Low Good Low Small increase
Low Bad High Decrease
Low Bad Low Small decrease
*The link weights in a neural network are analogous to theconfidence that gen-erals might have. In there trusted advisors.diction from the neural network) through the hidden layers andto the input layers. At each level the link weights between thelayers are updated so as to decrease the chance of making thesame mistake again.
Design decisions in architecting a neural networkNeural networks are often touted as self-learning automatedtechniques that simplify the analysis process. The truth is thatthere still are many decisions to be made by the end user indesigning the neural network even before training begins. Ifthese decisions are not made wisely, the neural network willlikely come up with a sub optimal model. Some of thedecisions that need to be made include• How will predictor values be transformed for the input
nodes? Will normal-ization be sufficient? How willcategoricals be entered?
• How will the output of the neural network be interpreted?• How many hidden layers will there be?• How will the nodes be connected? Will every node be
connected to every other node, or will nodes just beconnected between layers?
• How many nodes will there be in the hidden layer? (This canhave an impor-tant influence on whether the predictivemodel is over fit to the training database.)
• How long should the network be trained for? (This also hasan impact on whether the model over fits the data.)
Depending on the tool that is being used, these decisions maybe (explicit, where the user must set some parameter value, orthey may be decided for the user because the particular neural

115
DA
TA W
AR
EH
OU
SIN
G A
ND
DA
TA M
ININ
Gnetwork is being used for a specific type of prob-lem (like frauddetection).
Different types of Neural NetworksThere are literally hundreds of variations on the back propaga-tion feed forward neural networks that have been brieflydescribed here. One involves changing the architecture of theneural network to include recurrent connections where theoutput from the output layer is connected back as input intothe hidden layer. These recurrent nets are sometimes used forsequence prediction, in which the previous outputs from thenetwork need to be stored someplace and then fed back into thenetwork to provide context for the current prediction. Recurrentnetworks have also been used for decreasing the amount oftime that it takes to train the neural network. Another twist onthe neural net theme is to change the way that the networklearns. Back propagation effec-tively utilizes a search techniquecalled gradient descent to search for possible improvement inthe link weights to reduce the error. There ever, many otherways of doing search in a high-dimensional space effectivelyutilizes a search technique called gradient descent to search forthe best possible improvement in the link weights to reduce theerror. There are, how-ever, many other ways of doing search in ahigh-dimensional space (each link weight corresponds to adimension), including Newton’s methods and conju-gategradient as well as simulating the physics of cooling metals in aprocess called simulated annealing or in simulating the searchprocess that goes on in biological evolution and using geneticalgorithms to optimize the weights of theNeural networks. It has even been suggested that creating alarge number of neural networks with randomly weighted linksand picking the one with the lowest error rate would be the bestlearning procedure.Despite all these choices, the back propagation learning proce-dure is the most commonly used. It is well understood, isrelatively simple, and seems to work in a large number ofproblem domains. There are, however, two other neural net-work architectures that are used relatively often. Kohonenfeature maps are often used for unsupervised learning andclustering, and radial-basis-function networks are used forsupervised learning and in some ways represent a hybridbetween nearest-neighbor and neural network classifications.
Kohonen feature MapsKohonen feature maps were developed in the 1970s and werecreated late certain human brain functions. Today they are usedmostly to unsupervised learning and clustering.Kohonen networks are feed forward neural networks generallywith den layer. The networks contain only an input layer and anoutput h the nodes in the output layer compete amongthemselves to display the strongest activation to a given record,what is sometimes called a “win all” strategy.Behaviors 01 the real neurons were ‘taken into effect-namely,that physical locality of the neurons seems to play an importantrole in the behavior learning of neurons. The specific featuresof real neurons were:• Nearby neurons seem to compound the activation of each
other.
• Distant neurons seemed to inhibit each other• The tasks assigned to other neurons.Much of this early research came from the desire to simulate theway that vision worked in the brain. For instance, some of theearly physiological showed that surgically rotating a section of afrog’s eye ball so that it was upside down would result in thefrog jumping up for food that was al below the frog’s body.This led to the belief that the neurons had certainty enable rolesthat were dependent on the physical location of the neuron.Koho-nen networks were developed to accommodate thesephysiological features by a very simple learning algorithm:1. Layout the output nodes of the network on a two-
dimensional grid with no hidden layer.2. Fully connect the input nodes to the output nodes.3. Connect the output nodes so that nearby nodes would
strengthen each other and distant nodes would weaken eachother.
4. Start with random weights on the links.5. Train by determining which output node responded most
strongly to the Current record being input.6. Change the weights to that highest-responding node to
enable it to respond even more strongly in the future. This isalso known as Hebbian Learning.
7. Normalize the link weights so that they add up to someconstant amount; thus, increasing one weight decreasessome other.
8. Continue training until some form of global organization isformed on the two-dimensional output grid (where there areclear winning nodes for each input and, in general, localneighborhoods of nodes are activated).
When these networks were run, in order to simulate the real-world visual system it became obvious that the organizationthat was automatically being con-structed on the data was alsovery useful for ‘3egmenting and clustering the train-ingdatabase: Each output node represented a cluster and nearbyclusters were nearby in the two-dimensional output layer. Eachrecord in the database would fall into one and only one cluster(the most active output node), but the other clusters in which itmight also fit would be shown and likely to be next to the bestmatching cluster. Figure 26.4 shows the general form of aKohonen network.
Fig:26.4

116
DA
TA W
AR
EH
OU
SIN
G A
ND
DA
TA M
ININ
G
How does the neural network resemble the humanbrain?Since the inception of the idea of neural networks, the ultimategoal for these techniques has been to have them recreatedhuman thought and learning. This has once again proved to bea difficult task-despite the power of these new techniques andthe similarities of their architecture to that of the human brain.Many of the things that people take for granted are difficult forneural networks-such as avoiding over fitting and working withreal-world data without a lot of preprocessing required. Therehave also been some exciting successes.
The human brain is still much morepowerfulWith successes like NET talk and ALVINN and some of thecommercial suc-cesses of neural networks for fraud predictionand targeted marketing, it 1.1; tempting to claim that neuralnetworks are making progress toward “think-ing,” but it isdifficult to judge just how close we are. Some real facts that wecan look at are to contrast the human brain as a computer to theneural net-work implemented on the computer.Today it would not be possible to create an artificial neuralnetwork that even had as many neurons in it as the humanbrain, let alone all the process-ing required for the complexcalculations that go on inside the brain. The cur-rent estimatesare that there are 100 billion neurons in the average person(roughly 20 times the number of people on earth). Each singleneuron can receive input from up to as many as 100,000synapses or connections to other neurons, and overall there are10,000 trillion synapses.To get an idea of the size of these numbers, consider that ifyou had a 10-Tbyte data warehouse (the largest warehouse inexistence today), and you were able to store all of the complex-ity of a synapse in only a single byte of data within thatwarehouse, you would still require 1000 of these warehousesjust to store the synapse information. This doesn’t include thedata required for the neu-rons or all the computer processingpower required to actually run this simu-lated brain. Thebottom line is that we’re still a factor of 1000 away from evenstoring the required data to simulate a brain. If storage densitieson disks and other media keep increasing and the pricescontinue to decrease, this problem may well be solved. None-theless, there is much more work to be done in under-standinghow real brains function.
Applications of Neural NetworksThese days, neural networks are used in a very large number ofapplications. We list here some of those relevant to our study.Neural networks are being used in• Investment analysis:
To predict the movement of stocks, currencies etc., fromprevious data. There, they are replacing earlier simpler linearmodels.
• Monitoring:Networks have been used to monitor the state of aircraftengines. By monitoring vibration levels and sound, an earlywarning of engine problems can be given.
• Marketing:Neural networks have been used to improve marketingmailshots. One technique is to run a test mailshot, and lookat the pattern of returns from this. The idea is to find apredictive mapping from the data known about the clients tohow they have responded. This mapping is then used todirect further mailshots.
Data Mining Using NN: A Case StudyIn this section, I will outline a case study to you to illustrate thepotential application of NN for Data mining. This case study istaken from [Shalvi, 1996].
Knowledge Extraction Through DataMiningKohonen, self-organizing maps (SOMs) are used to cluster aspecific medical data set containing information about thepatients’ drugs, topographies (body locations) and morpholo-gies (physiological abnormalities); these categories can beidentified as the three input subspaces. Data mining techniquesare used to collapse the subspaces into a form suitable fornetwork classification. The goal is to acquire medical knowledgewhich may lead to tool formation, automation and to assistmedical decisions regarding population. The data is organizedas three hierarchical trees, identified as Drugs, Topography andMorphology. The most significant portion of the morphologytree is displayed in Figure 26.5. Before presenting the data to theneural network, certain preprocessing should be done. Standardtechniques can be employed to clean erroneous and redundantdata.
Fig:26.5

117
DA
TA W
AR
EH
OU
SIN
G A
ND
DA
TA M
ININ
GThe data is processed at the root level of each tree-fourteen rootlevel drugs, sixteen root level topographies and ten root levelmorphologies. By constraining all the data to the root level, thedegree of differentiation has been greatly reduced fromthousands to just 40. Each tuple is converted into a bipolarformat. Thus, each tuple is a 40-dimensional bipolar array-avalue of either 1 or -1 depending on whether any data existedfor the leaves of that root node.
The Kohonen self-organizing map (SOM) was chosen toorganize the data, in order to make use of a spatially ordered, 2-dimensional map of arbitrary granularity. An n x n SOM wasimplemented for several values ofn. We describe below only thecase with n= 1 O. The input layer consists of 40 input nodes;the training set consists of 2081 tuples; and the training periodwas of 30 epochs. The learning coefficient S is initialized to 0.06.After approximately 7Y2 epochs, S is halved to 0.03. Afteranother 7Y2 epochs, it is halved again to 0.015. For the final setof7Y2 epochs, it is halved again to become 0.0075.
After the network is trained it is used for one final pass throughthe input data set, in which the weights are not adjusted. Thisprovides the final classification of each input data tuple into asingle node in the l0 x 10 grid. The output is taken from thecoordinate layer as an (x, y) pair. The output of the SOM is apopulation distribution of tuples with spatial significance(Figure 26.6). This grid displays the number of tuples that wereclassified into each Kohorien layer node (square) during testing;for example, Square (1,1) contains 180 tuples.Upon examination of the raw data within these clusters, onefinds similarities between the tuples which are indicative ofmedical relationships or dependencies. Numerous hypothesescan be made regarding these relationships, many of which werenot known a priori. The SOM groups together tuples in eachsquare according to their similarity. The only level at which theSOM can detect similarities between tuples is at the root level ofeach of the three subspace trees, since this is the level of
differentiation presented to the SOM’s input. For example,every one of the tuples in square (1,1) contains root level dataonly for Drug 6, Topography 6 and Morphology 5. The tuple atsquare (2,1) contains these three root level nodes as well as Drug7, a difference slight enough for the network to distinguish thetuple by classifying it one square away from (1,1). All 34 tuplesin square (3,1) contain Drug 6, Topography D and Morphology5; but only 29 of the 34 tuples contain Topography 6. Clearly,the difference between square (3,1) and square (1,1) is greaterthan the difference between square (2,1) and square (1,1).
Exercises
1. Describe the principle of neural computing and discuss itssuitability to data mining.
2. Discuss various application areas of Neural Networks.3. Explain in brief different types of neural networks.4. “Hidden nodes are like trusted advisors to the output
nodes”. Discuss.5. Explain in brief Kohonen feature maps.
Notes

118
DA
TA W
AR
EH
OU
SIN
G A
ND
DA
TA M
ININ
G
Structure• Objective• Association Rules• Basic Algorithms for Finding Association Rules• Association Rules among Hierarchies• Negative Associations• Additional Considerations for Association Rules• Genetic Algorithms (GA)• Crossover• Mutation• Problem-Dependent Parameters• Encoding• The Evaluation Step
• Data Mining Using GA
ObjectiveThe objective of this lesson is to introduce you with datamining techniques like association rules and genetic algorithm.
Association RulesOne of the major technologies in data mining involves thediscovery of association rules. The database is regarded as acollection of transactions, each involving. Set of items. Acommon example is that of market-basket data. Here themarket basket corresponds to what a consumer buys in asupermarket during one visit. Consider four such transactionsin a random sample:Transaction-id Time Items- Brought101 6:35 milk, bread, juice792 7:38 milk, juice1130 8:05 milk, eggs1735 8:40 bread, cookies, coffeeAn association rule is of the form X=>Y, where X = {x1, x2...xn}, and Y = {y1, y2...ym} are sets, of items, with xi and Yj beingdistinct items for all i and j. This association states that if acustomer buys X, he or she is also likely to buy Y. In general,any association rule has the form LHS (left-hand side) Þ RHS(right-hand side), where LHS and RHS are sets of items.Association rules should supply both support and confidence.
The support for the rule LHSÞRHS is the percentage oftransactions that hold all of the items in the union, the set LHSU RHS. If the support is low, it implies that there is nooverwhelming evidence that items in LHS U RHS occurtogether, because the union happens in only a small fraction oftransactions. The rule MilkÞJuice has 50% support, while Bread
LESSON 27ASSOCIATION RULES AND GENETIC ALGORITHM
Þ Juice has only 25% support. Another term for support ispreva-lence of the rule.
To compute confidence we consider all transactions that includeitems in LHS. The confidence for the association rule LHSÞRHS is the percentage (fraction) of such transactions that alsoinclude RHS. Another term for confidence is strength of therule.
For MilkÞJuice, the confidence is 66.7% (meaning that, of threetransactions in which milk occurs, two contain juice) andbreadÞjuice has 50% confidence (meaning that one of twotransactions containing bread also contains juice.)As we can see, support and confidence do not necessarily gohand in hand. The goal of mining association rules, then, is togenerate all possible rules that exceed some mini-mum user-specified support and confidence thresholds. The problem isthus decomposed into two subproblems:1. Generate all item sets that have a support that exceeds the
threshold. These sets of items are called large itemsets. Notethat large here means large support.
2. For each large item set, all the rules that have a minimumconfidence are gener-ated as follows: for a large itemset X andY C X, let Z = X – Y; then if support (X) /support (Z) Þminimum confidence, the rule Z ÞY (Le., X - Y Þ Y) is avalid rule. [Note: In the previous sentence, Y C X reads, “Yis a subset of X.”]
Generating rules by using all large itemsets and their supports isrelatively straightforward. However, discovering all largeitemsets together with the value for their support is a majorproblem if the cardinality of the set of items is very high. Atypical supermarket has thousands of items. The number ofdistinct itemsets is 2m, where m is the number c£ items, andcounting support for all possible itemsets becomes verycomputation-intensive.To reduce the combinatorial search space, algorithms for findingassociation rule have the following properties:• A subset of a large itemset must also be large (i.e., each
subset of a large itemset: L exceeds the minimum requiredsupport).
• Conversely, an extension of a small itemset is also small(implying that it does 00: have enough support).
The second property helps in discarding an itemset from furtherconsideration J extension, if it is found to be small.
Basic Algorithms for Finding AssociationRulesThe current algorithms that find large itemsets are designed towork as follows:

119
DA
TA W
AR
EH
OU
SIN
G A
ND
DA
TA M
ININ
G1. Test the support for itemsets of length 1, called l-itemsets,
by scanning the database. Discard those that do not meetminimum required support.
2. Extend the large l-itemsets into 2-itemsets by appending oneitem each time, to generate all candidate itemsets of lengthtwo. Test the support for all candidate itemsets by scanningthe database and eliminate those 2-itemsets that do not meetthe minimum support.
3. Repeat the above steps at step k; the previously found (k - 1)itemsets are extended into k-itemsets and tested forminimum support.
The process is repeated until no large item sets can be found.However, the naive ver-sion of this algorithm is a combinato-rial nightmare. Several algorithms have been pro-posed to minethe association rules. They vary mainly in terms of how thecandidate itemsets are generated, and how the supports for thecandidate item sets are counted.Some algorithms use such data structures as bitmaps and hastrees to keep informa-tion about item sets. Several algorithmshave been proposed that use multiple scans of the databasebecause the potential number of item sets, 2m, can be too largeto set up counters during a single scan. We have proposed analgorithm called the Partition algorithm Summarized below.
If we are given a database with a small number of potentiallarge item sets, say, a few thousand, then the support for all ofthem can be tested in one scan by using a partition-ing tech-nique. Partitioning divides the database into no overlappingpartitions; these are individually considered as separate data-bases and all large item sets for that partition are generated inone pass. At the end of pass one, we thus generate a list oflarge item sets from each partition. When these lists are merged,they contain some false positives. That is, some of the itemsetsthat are large in one partition may not qualify in several otherpar-titions and hence may not exceed the minimum supportwhen the original database is considered. Note that there are nofalse negatives, i.e., no large itemsets will be missed. The unionof all large item sets identified in pass one is input to pass twoas the candidate itemsets, and their actual support is measuredfor the entire database. At the end of phase two, all actual largeitemsets are identified. Partitions are chosen in such a way thateach partition can be accommodated in main memory and apartition is read only once in each phase. The Partition algo-rithm lends itself to parallel implementation, for efficiency.Fur-ther improvements to this algorithm have been suggested.
Association Rules among HierarchiesThere are certain types of associations that are particularlyinteresting for a special reason. These associations occur amonghierarchies of items. Typically, it is possible to divide itemsamong disjoint hierarchies based on the nature of the domain.For example, foods in a supermarket, items in a departmentstore, or articles in a sports shop can be categorized into classesand subclasses that give rise to hierarchies. Which shows thetaxonomy of items in a supermarket. The figure shows twohierarchies—beverages and desserts, respectively. The entiregroups may not produce associations of the form beverages pÞ desserts, or dessertsÞbeverages.
However, associations of the type Healthy-brand frozen yogurtÞ bottled water, or Richcream-brand ice cream Þ wine cooler mayproduce enough confidence and sup-port to be valid associationrules of interest.Therefore, if the application area has a natural classification ofthe itemsets into hier-archies, discovering associations withinthe hierarchies is of no particular interest. The ones of specificinterest are associations across hierarchies. They may occuramong item groupings at-different levels.
Negative AssociationsThe problem of discovering a negative association is harderthan that of discovering a positive association. A negativeassociation is of the following type: “60% of customers whobuy potato chips do not buy bottled water.” (Here, the 60%refers to the confidence for the negative association rule.) In adatabase with 10,000 items, there are 210000 possible combina-tions of items, a majority of which do not appear even once inthe database. If the absence of a certain item combination istaken to mean a negative association, then we potentially havemillions and millions of negative ass0ci-ation rules with RHSsthat are of no interest at all. The problem, then, is to find onlyinteresting negative rules. In general, we are interested in cases inwhich two specific sea of items appear very rarely in the sametransaction.This poses two problems: For a total item inventory of 10,000items, the probability of any two being bough together is (1/10,000) * (1/10,000) = 10-8. If we find the actual support forthese two occurring together to be zero, that does not’ representa significant departure from expectation and hence is not aninteresting (negative) association.The other problem is more serious. We are looking for itemcombinations with very low support, and there are millions andmillions with low or even zero support. For example, a data setof 10 million transactions has most of the 2.5 billion pairwisecombinations of 10,000 items missing. This would generatebillions of useless rules.Therefore, to make negative association rules interesting wemust use prior knowledge about the itemsets. One approach isto use hierarchies. Suppose we use the hierar-chies of softdrinks and chips shown in Fig 27.1. A strong positive associa-tion has been shown between soft drinks and chips. If we finda large support for the fact that when customers buy pays chips

120
DA
TA W
AR
EH
OU
SIN
G A
ND
DA
TA M
ININ
G
they predominantly buy Topsy and not Joke and not Wakeupthat would be interesting. This is so because we would Nor-mally expect that if there is a strong association between Daysand Topsy, there should also be such a strong associationbetween Days and Joke or Days and Wakeup.In the frozen yogurt and bottled water groupings in Fig 27.1,suppose the Reduce versus Healthy brand division is 80-20 andthe Plain and Clear brands division 60-40 among respectivecategories. This would give a joint probability of Reduce frozenyogurt.Being purchased with Plain bottled water as 48% among thetransactions containing a frozen yogurt and bottled water. Ifthis support, however, is found to be only 20%, that wouldindicate a significant negative association among Reduce yogurtand Plain bottled water; again, that would be interesting.The problem of finding negative association is important in theabove situations given the domain knowledge in the form ofitem generalization hierarchies (that is, the beverage given anddesserts hierarchies shown in Fig 27.1), the existing positiveassociations (such as between the frozen-yogurt and bottledwater group’s), and the distribution of items (such as the namebrands within related groups). Recent work has been reportedby the database group at Georgia Tech in this context (seebibliographic notes). The Scope of dis-covery of negativeassociations is limited in terms of knowing the item hierarchiesand dis-tributions. Exponential growth of negative associa-tions remains a challenge.
Additional Considerations forAssociation RulesFor very large datasets, one way to improve efficiency is bysampling. If a representative sample can be found that trulyrepre-sents the properties of the original data, then most of therules can be found. The problem then reduces to one ofdevising a proper sampling procedure. This process has thepotential danger of discovering some false positives (large itemsets that are not truly large) as well as hawing false negatives bymissing some large itemsets and corresponding associationrules.
Fig: 27.1
Mining association rules in real-life databases is further compli-cated by the following factors.
The cardinality of itemsets in most situations is extremely large,and the volume of transactions is very high as well. Someoperational databases in retailing and commu-nication indus-tries collect tens of millions of transactions per day.Transactions show variability in such factors as geographiclocation and seasons, making sampling difficult. Item classifica-tions exist along multiple dimensions. Hence, driving thediscovery process with domain knowledge, particularly fornegative rules, is extremely difficult. Quality of data is variable;significant problems exist with missing, erroneous, con-flicting,as well as redundant data in many industries.
Association rules can be generalized for data mining purposesalthough the notion of itemsets was used above to discoverassociation rules, almost any data in the standard relationalform with a number of attributes can be used. For example,consider blood-test data with attributes like hemoglobin, redblood cell count, white blood cell count, blood--sugar, urea, ageof patient, and so on. Each of the attributes can be dividedinto ranges, and the presence of an attribute with a value can beconsidered equivalent to an item. Thus, if the hemoglobinattribute is divided into ranges 0-5, 6-7, 8-9, 10-12, 13-14, andabove 14, then we can. Consider them as items HI, H2... H7.Then a specific hemoglo-bin value for a patient corresponds toone of these seven items being present. The mutual exclusionamong these hemoglobin items can be used to some advantagein the scanning for large itemsets. This way of dividing variablevalues into ranges allows us to apply the association-rulemachinery to any database for mining purposes. The rangeshave to be determined from domain knowledge such as therelative importance of each of the hemo-globin values.
Genetic AlgorithmGenetic algorithms (GA), first proposed by Holland in 1975,are a class of computational models that mimic naturalevolution to solve problems in a wide variety of domains.Genetic algorithms are particularly suitable for solving complexoptimization problems and for applications that requireadaptive problem-solving strategies. Genetic algorithms aresearch algorithms based on the mechanics of natural genetics,i.e., operations existing in nature. They combine a Darwinian‘survival of the fittest approach’ with a structured, yet random-ized, information exchange. The advantage is that they cansearch complex and large amount of spaces efficiently and locatenear-optimal solutions pretty rapidly. GAs was developed in theearly 1970s by John Holland at the University of Michigan(Adaptation in Natural and Artificial Systems, 1975).A genetic algorithm operates on a set of individual elements(the population) and there is a set of biologically inspiredoperators that can change these individuals. According to theevolutionary theory_ only the more suited individuals in thepopulation are likely to survive and to generate offspring, thustransmitting their biological heredity to new generations.In computing terms, genetic algorithms map strings ofnumbers to each potential solution. Each solution becomes an“individual in the population, and each string becomes arepresentation of an individual. There should be a way to deriveeach individual from its string representation. The geneticalgorithm then manipulates the most promising strings in itssearch for an improved solution. The algorithm operatesthrough a simple cycle:• Creation of a population of strings.• Evaluation of each string.• Selection of the best strings.
• Genetic manipulation to create a new population of strings.Figure 27.2 shows how these four stages interconnect. Eachcycle produces a new generation of possible solutions (indi-viduals) for a given problem. At the first stage, a population ofpossible solutions is created as a starting point. Each individual

121
DA
TA W
AR
EH
OU
SIN
G A
ND
DA
TA M
ININ
Gin this population is enc6ded into a string (the chromosome) tobe manipulated by the genetic operators. In the next stage, theindividuals are evaluated, first the individual is created from itsstring description (its chromosome), then its performance inrelation to the target response is evaluated. This determineshow fit this individual is in relation to the others. in thepopulation. Based on each individual’s fitness, a selectionmechanism chooses the best pairs for the genetic manipulationprocess. The selection policy is responsible to ensure thesurvival of the fittest individuals.The manipulation process enables the genetic operators toproduce a new population of individuals, the offspring, bymanipulating the genetic information possessed by the pairschosen to reproduce. This information is stored in the strings(Chromosomes) that describe the individuals. Two operatorsare used: Crossover and Mutation. The offspring generated by thisprocess take the place of the older population and the cycle isrepeated until a desired level of fitness is attained, or a deter-mined number of cycles is reached.
CrossoverCrossover is one of the genetic operators used to recombine thepopulation’s genetic material. It takes two chromosomes andswaps part of their genetic information to produce newchromosomes. As Figure 27.3 shows, after the crossover pointhas been randomly chosen, portions of the parent’s chromo-some (strings). Parent 1 and Parent 2 are combined to producethe new offspring, Son.
Genetic Algorithms In detailGenetic algorithms (GAs) are a class of randomized searchprocesses capable of adaptive and robust search over a widerange of search space to pologies. Modeled after the adaptiveemergence of biological species from evolutionary mechanisms,and introduced by Holland GAs have been successfully appliedin such diverse. Fields such as image analysis, scheduling, andengineering design.
Genetic algorithms extend the idea from human genetics of thefour-letter alphabet loosed on the A, C, T, G nucleotides) ofthe human DNA code. The construction of a genetic algorithminvolves devising an alphabet that encodes the solutions to thedeci-sion problem in terms of strings of that alphabet. Stringsare equivalent to individuals. A fitness function defines whichsolutions, can survive and which cannot. The ways in whichsolutions can be combined are patterned after the crossover
operation of cutting and combining strings from a father and amother. An initial population of well-varied population isprovided, and a game of evolution is played in which muta-tions occur among strings. They combine to produce a newgeneration of individuals the fittest indi-viduals survive andmutate until a family of successful solutions develops.
The solutions produced by genetic algorithms (GAs) aredistinguished from most other search techniques by thefollowing characteristics:• A GA search uses a set of solutions during each generation
rather than a single solu-tion.• The search in the string-space represents a much larger
parallel search in the space of encoded solutions. .• The memory of the search done is represented solely by the
set of solutions available for a generation.• A genetic algorithm is a randomized algorithm since search
mechanisms use ‘probabi-listic operators.• While progressing from one generation to next, a GA finds
near-optimal balance between knowledge acquisition andexploitation by manipulating encoded solutions.
Genetic algorithms are used for problem solving and clusteringproblems. Their ability to solve problems in parallel provides apowerful tool for data mining. The draw-backs of GAs includethe large overproduction, of individual solutions, the randomchar-acter of the searching process, and the high demand oncomputer processing. In general, substantial computing poweris required to achieve anything of significance with geneticalgorithms.
Figure 27.3 Crossover
The selection process associated with the recombination madeby the crossover, assures that special genetic structures, calledbuilding blocks, are retained for future generations. Thesebuilding blocks represent the fittest genetic structures in thepopulation.
MutationThe mutation operator introduces new genetic structures in thepopulation by randomly changing some of its building blocks.Since the modification is totally random and thus not related toany previous genetic structures present in the population, itcreates different structures related to other sections of the searchspace. As shown in Figure 27.4, the mutation is implementedby occasionally altering a random bit from a chromosome(string). The figure shows the operator being applied to thefifth element of the chromosome.

122
DA
TA W
AR
EH
OU
SIN
G A
ND
DA
TA M
ININ
G
A number of other operators, apart from crossover andmutation, have been introduced since the basic model wasproposed. They are usually versions of the recombination andgenetic alterations processes adapted to the constraints of aparticular problem. Examples of other operators are: inversion,dominance and genetic edge recombination.
Figure 27.4 Mutation
Problem-Dependent ParametersThis description of the GA’ s computational model reviews thesteps needed to create the algorithm. However, a real implemen-tation takes into account a number of problem-dependentparameters. For instance, the offspring produced by geneticmanipulation (the next population to be evaluated) can eitherreplace the whole population (generational approach) or just itsless fit members (steady-state approach). The problem con-straints will dictate the best option. Other parameters to beadjusted are the population size, crossover and mutation rates,evaluation method, and convergence criteria.
EncodingCritical to the algorithm’s performance is the choice of underly-ing encoding for the solution of the optimization problem (theindividuals or the population). Traditionally, binary encodinghas being used because they are easy to implement. Thecrossover and mutation operators described earlier are specific tobinary encoding. When symbols other than 1 or 0 are used, thecrossover and mutation operators must be tailored accordingly.
The Evaluation StepThe evaluation step in the cycle, shown in Figure 27.2, is moreclosely related to the actual application the algorithm is trying tooptimize. It takes the strings representing the individuals of thepopulation and, from them, creates the actual individuals to betested the way the individuals are coded as strings will dependon what parameters one is tying to optimize and the actualstructure of possible solutions (individuals). After the actualindividuals have been created, they have to be tested and scored.These two tasks again are closely related to the actual systembeing optimized. The testing depends on what characteristicsshould be optimized and the scoring. The production of asingle value representing the fitness of an individual dependson the relative importance of each different characteristic valueobtained during testing.
Data Mining using GAThe application of the genetic algorithm in the context of datamining is generally for the tasks of hypothesis testing andrefinement, where the user poses some hypothesis and thesystem first evaluates the hypothesis and then seeks to refine it.Hypothesis refinement is achieved by “seeding” the system withthe hypothesis and then allowing some or all parts of it to vary.One can use a variety of evaluation functions to determine thefitness of a candidate refinement. The important aspect of theGA application is the encoding of the hypothesis and theevaluation function for fitness.
Another way to use GA for data mining is to design hybridtechniques by blending one of the known techniques with GA.For example, it is possible to use the genetic algorithm foroptimal decision tree induction. By randomly generatingdifferent samples, we can build many decision trees using anyof the traditional techniques. But we are not sure of theoptimal tree. At this stage, the GA is very useful in deciding onthe optimal tree and optimal splitting attributes. The geneticalgorithm evolves a population of biases for the decision treeinduction algorithm. We can use a two-tiered search strategy. Onthe bottom tier, the traditional greedy strategy is performedthrough the space of the decision trees. On the top tier, one canhave a genetic search in a space of biases. The attribute selectionparameters are used as biases, which are used to modify thebehavior of the first tier search. In other words, the GAcontrols the preference for one type of decision tree overanother.An individual (a bit string) represents a bias and is evaluated byusing testing data subsets. The “fitness” of the individual is theaverage cost of classification of the decision tree. In the nextgeneration, the population is replaced with new individuals.The new individuals are generated from the previous genera-tion, using mutation and crossover. The fittest individuals inthe first generation have the most offspring in the secondgeneration. After a fixed number of generations, the algorithmhalts and its output is the decision tree the determined by thefittest individual.
Exercises1. Write short notes on
a. Mutationb. Negative Associationsc. Partition algorithm
2. Discuss the importance of association rules.3. Explain the basic Algorithms for Finding Association Rules.4. Discuss the importance of crossover in Genetic algorithm.5. Explain Association Rules among Hierarchies with example.6. Describe the principle of Genetic algorithm and discuss its
suitability to data mining.7. Discuss the salient features of the genetic algorithm. How
can a data-mining problem be an optimization problem?How do you use GA for such cases?

123
DA
TA W
AR
EH
OU
SIN
G A
ND
DA
TA M
ININ
GReference• Goldberg D.E., Genetic Algorithm in Search, Optimization and
Machine Learning, Addison-Wesley Publishing Company,1989.
• Holland J.H. Adaptation in Natural and Artificial System (2nded.), Prentice Hall, 1992.
• Marmelstein R., and Lamont G. Pattern Classification using aHybrid Genetic Program-Decision Tree Approach. InProceedings of the Jed Annual Genetic Programming Conference,223-231, 1998.
• McCallum R., and Spackman K. Using genetic algorithms tolearn disjunctive rules from examples. In Proceedings of the7th International Conference on Machine Learning, 149-152,1990.
• Ryan M.D., and Rayward-Smith V.J. The evolution ofdecision trees. In Proceedings of the Third Annual GeneticProgramming Conference, 350-358, 1998.
• Syswerda G. In First Workshop on the Foundations of GeneticAlgorithms and Classification Systems, Morgan Kaufmann,1990.
Notes

124
DA
TA W
AR
EH
OU
SIN
G A
ND
DA
TA M
ININ
G
Structure• Objective• Introduction• On-line Analytical processing• What is Multidimensional (MD) data and when does it
become OLAP?• OLAP Example• What is OLAP?• Who uses OLAP and WHY?• Multi-Dimensional Views• Complex Calculation capabilities• Time intelligence
ObjectiveAt the end of this lesson you will be able to• Understand the significance of OLAP in Data mining• Study about Multi-Dimensional Views, Complex Calculation
capabilities, and Time intelligence
IntroductionThis lesson focuses on the need of Online Analytical Process-ing. Solving modern business problems such as market analysisand financial forecasting requires query-centric database schemasthat are array-oriented and multidimensional in nature. Thesebusiness problems are characterized by the need to retrieve largenumbers of records from very large data sets and summarizethem on the fly. The multidimensional nature of the problemsit is designed to address is the key driver for OLAP.In this lesson i will cover all the important aspects of OLAP.
On Line Analytical ProcessingA major issue in information processing is how to processlarger and larger databases, containing increasingly complex data,without sacrificing response time. The client/server architecturegives organizations the opportunity to deploy specializedservers, which are optimized for handling specific data manage-ment problems. Until recently, organizations have tried to targetrelational database management systems (RDBMSs) for thecomplete spectrum of database applications. It is howeverapparent that there are major categories of database applicationswhich are not suitably serviced by relational database systems.Oracle, for example, has built a totally new Media Server forhandling multimedia applications. Sybase uses an object-oriented DBMS (OODBMS) in its Gain Momentum product,which is designed to handle complex data such as images andaudio. Another category of applications is that of on-lineanalytical processing (OLAP). OLAP was a term coined by E FCodd (1993) and was defined by him as;The dynamic synthesis, analysis and consolidation of largevolumes of multidimensional data
CHAPTER 6OLAP
LESSON 28ONLINE ANALYTICAL PROCESSING,
NEED FOR OLAP MULTIDIMENSIONALDATA MODEL
Codd has developed rules or requirements for an OLAPsystem;• Multidimensional conceptual view• Transparency• Accessibility• Consistent reporting performance• Client/server architecture• Generic dimensionality• Dynamic sparse matrix handling• Multi-user support• Unrestricted cross dimensional operations• Intuitative data manipulation• Flexible reporting• Unlimited dimensions and aggregation levelsAn alternative definition of OLAP has been supplied by NigelPendse who unlike Codd does not mix technology prescrip-tions with application requirements. Pendse defines OLAP as,Fast Analysis of Shared Multidimensional Information,which means:Fast in that users should get a response in seconds and sodoesn’t lose their chain of thought;Analysis in that the system can provide analysis functions in anintuitative manner and that the functions should supplybusiness logic and statistical analysis relevant to the usersapplication;Shared from the point of view of supporting multiple usersconcurrently;Multidimensional as a main requirement so that the systemsupplies a multidimensional conceptual view of the dataincluding support for multiple hierarchies;Information is the data and the derived information requiredby the user application.One question that arises is,
What is Multidimensional (MD) data and when doesit become OLAP?It is essentially a way to build associations between dissimilarpieces of information using predefined business rules aboutthe information you are using. Kirk Cruikshank of ArborSoftware has identified three components to OLAP, in an issueof UNIX News on data warehousing;• A multidimensional database must be able to express
complex business calculations very easily. The data must bereferenced and mathematics defined. In a relational systemthere is no relation between line items, which makes it verydifficult to express business mathematics.

125
DA
TA W
AR
EH
OU
SIN
G A
ND
DA
TA M
ININ
G• Intuitive navigation in order to ‘roam around’ data, which
requires mining hierarchies.• Instant response i.e. the need to give the user the
information as quickly as possible.Dimensional databases are not without problem as they are notsuited to storing all types of data such as lists for examplecustomer addresses and purchase orders etc. Relational systemsare also superior in security, backup and replication services asthese tend not to be available at the same level in dimensionalsystems. The advantages of a dimensional system are thefreedom they offer in that the user is free to explore the dataand receive the type of report they want without being restrictedto a set format.
OLAP ExampleAn example OLAP database may be comprised of sales datawhich has been aggregated by region, product type, and saleschannel. A typical OLAP query might access a multi-gigabyte/multi-year sales database in order to find all product sales ineach region for each product type. After reviewing the results, ananalyst might further refine the query to find sales volume foreach sales channel within region/product classifications. As alast step the analyst might want to perform year-to-year orquarter-to-quarter comparisons for each sales channel. Thiswhole process must be carried out on-line with rapid responsetime so that the analysis process is undisturbed. OLAP queriescan be characterized as on-line transactions which:• Access very large amounts of data, e.g. several years of sales
data.• Analyze the relationships between many types of business
elements e.g. sales, products, regions, and channels.• Involve aggregated data e.g. sales volumes, budgeted dollars
and dollars spent.• Compare aggregated data over hierarchical time periods e.g.
monthly, quarterly, and yearly.• Present data in different perspectives e.g. sales by region vs.
sales by channels by product within each region.• Involve complex calculations between data elements e.g.
expected profit as calculated as a function of sales revenue foreach type of sales channel in a particular region.
• Are able to respond quickly to user requests so that users canpursue an analytical thought process without being stymiedby the system.
What is OLAP?• Relational databases are used in the areas of operations and
control with emphasis on transaction processing.• Recently relational databases are used for building data
warehouses, which stores tactical information (< 1 year intothe future) that answers who and what questions.
• In contrast OLAP uses Multi-Dimensional (MD) views ofaggregate data to provide access strategic information.
• OLAP enables users to gain insight to a wide variety ofpossible views of information and transforms raw data toreflect the enterprise as understood by the user e.g. Analysts,managers and executives.
• In addition to answering who and what questions OLAPscan answer “what if “ and “why”.
• Thus OLAP enables strategic decision-making.• OLAP calculations are more complex than simply summing
data.• However, OLAP and Data Warehouses are complementary• The data warehouse stores and manages data while the
OLAP transforms this data into strategic information.
Who uses OLAP and WHY?• OLAP applications are used by a variety of the functions of
an organisation.• Finance and accounting:
• Budgeting• Activity-based costing• Financial performance analysis• And financial modelling
• Sales and Marketing• Sales analysis and forecasting• Market research analysis• Promotion analysis• Customer analysis• Market and customer segmentation
• Production• Production planning• Defect analysis
Thus, OLAP must provide managers with the information theyneed for effective decision-making. The KPI (key performanceindicator) of an OLAP application is to provide just-in-time(JIT) information for effective decision-making. JIT informa-tion reflects complex data relationships and is calculated on thefly. Such an approach is only practical if the response times arealways short The data model must be flexible and respond tochanging business requirements as needed for effective decisionmaking.In order to achieve this in widely divergent functional areasOLAP applications all require:• MD views of data• Complex calculation capabilities• Time intelligence
Multi-Dimensional Views• MD views inherently represent actual business models,
which normally have more than three dimensions e.g., Salesdata is looked at by product, geography, channel and time.
• MD views provide the foundation for analytical processingthrough flexible access to information.
• MD views must be able to analyse data across any dimensionat any level of aggregation with equal functionality and easeand insulate users from the complex query syntax
• What ever the query is they must have consistent responsetimes.

126
DA
TA W
AR
EH
OU
SIN
G A
ND
DA
TA M
ININ
G
• Users queries should not be inhibited by the complex toform a query or receive an answer to a query.
• The benchmark for OLAP performance investigates a serversability to provide views based on queries of varyingcomplexity and scope.• Basic aggregation on some dimensions• More complex calculations are performed on other
dimensions• Ratios and averages• Variances on sceneries• A complex model to compute forecasts• Consistently quick response times to these queries are
imperative to establish a server’s ability to provide MD viewsof information.
Complex Calculations• The ability to perform complex calculations is a critical test
for an OLAP database.• Complex calculations involve more than aggregation along a
hierarchy or simple data roll-ups, they also include percentageof the total share calculations and allocations utilisinghierarchies from a top-down perspective.
• Further calculations include:• Algebraic equations for KPI• Trend algorithms for sales forecasting• Modelling complex relationships to represent real
world situations• OLAP software must provide powerful yet concise
computational methods.• The method for implementing computational methods
must be clear and non-procedural• Its obvious why such methods must be clear but they must
also be non-procedural otherwise changes can not be done ina timely manner and thus eliminate access to JITinformation.
• In essence OLTP systems are judged on their ability to collectand manage data while OLAP systems are judged on theirability to make information from data. Such abilities involvesthe use of both simple and complex calculations
Time Intelligence• Time is important for most analytical applications and is a
unique dimension in that it is sequential in character. Thustrue OLAP systems understand the sequential nature oftime.
• The time hierarchy can be used in a different way to otherhierarchies eg sales for june or sales for the first 5 months of2000.
• Concepts such as year to date must be easily defined• OLAP must also understand the concept of balances over
time. Eg in some cases, for employees, an average is usedwhile in other cases an ending balance is used.
The OLAP performance benchmark contains how time is usedin OLAP applications. Eg the forecast calculation uses this year’svs. last year’s knowledge, year-to-date knowledge factors.

127
DA
TA W
AR
EH
OU
SIN
G A
ND
DA
TA M
ININ
G

128
DA
TA W
AR
EH
OU
SIN
G A
ND
DA
TA M
ININ
G
Exercise1. Write short notes on:
• Multidimensional Views• Time Intelligence• Complex Calculations
2. What do you understand by Online Analytical Processing(OLAP)? Explain the need of OLAP.
3. Who uses OLAP and why?4. Correctly contrast the difference between OLAP and Data
warehouse.5. Discuss various applications of OLAP.
Notes

129
DA
TA W
AR
EH
OU
SIN
G A
ND
DA
TA M
ININ
G
Structure• Objective• Definitions of OLAP• Comparison of OLAP and OLTP• Characteristics of OLAP: FASMI• Basic Features of OLAP• Special features
ObjectiveAt the end of this lesson you will be able to• Understand the significance of OLAP.• Compare between OLAP and OLTP• Learn about various characteristics of OLAP.
Definitions of OLAPIn a white paper entitled ‘Providing OLAP (On-line AnalyticalProcessing) to User-Analysts: An IT Mandate’, E.F. Coddestablished 12 rules to define an OLAP system. In the samepaper he listed three characteristics of an OLAP system. Dr.Codd later added 6 additional features of an OLAP system tohis original twelve rules.Three significant characteristics of an OLAP system• Dynamic Data AnalysisThis refers to time series analysis of data as opposed to staticdata analysis, which does not allow for manipulation acrosstime. In an OLAP system historical data must be able to bemanipulated over multiple data dimensions. This allows theanalysts to identify trends in the business.• Four Enterprise Data Models• The Categorical data model describes what has gone on
before by comparing historical values stored in the relationaldatabase. The Exegetical data model reflects what haspreviously occurred to bring about the state, which thecategorical model reflects. The Contemplative data modelsupports exploration of ‘what-if ’ scenarios. The Formulaicdata model indicates which values or behaviors acrossmultiple dimensions must be introduced into the model toaffect a specific outcome.
Comparison of OLAP and OLTPOLAP applications are quite different from On-line TransactionProcessing (OLTP) applications, which consist of a largenumber of relatively simple transactions. The transactionsusually retrieve and update a small number of records that arecontained in several distinct tables. The relationships betweenthe tables are generally simple.A typical customer order entry OLTP transaction might retrieveall of the data relating to a specific customer and then insert anew order for the customer. Information is selected from thecustomer, customer order, and detail line tables. Each row in
LESSON 29OLAP VS. OLTP, CHARACTERISTICS OF OLAP
each table contains a customer identification number, which isused to relate the rows from the different tables. The relation-ships between the records are simple and only a few records areactually retrieved or updated by a single transaction.The difference between OLAP and OLTP has been summarizedas, OLTP servers handle mission-critical production dataaccessed through simple queries; while OLAP servers handlemanagement-critical data accessed through an iterative analyticalinvestigation. Both OLAP and OLTP have specialized require-ments and therefore require special optimized servers for thetwo types of processing.OLAP database servers use multidimensional structures tostore data and relationships between data. Multidimensionalstructures can be best visualized as cubes of data, and cubeswithin cubes of data. Each side of the cube is considered adimension.Each dimension represents a different category such as producttype, region, sales channel, and time. Each cell within themultidimensional structure contains aggregated data relatingelements along each of the dimensions. For example, a singlecell may contain the total sales for a given product in a region fora specific sales channel in a single month. Multidimensionaldatabases are a compact and easy to understand vehicle forvisualizing and manipulating data elements that have manyinter relationships.OLAP database servers support common analytical operationsincluding: consolidation, drill-down, and “slicing and dicing”.• Consolidation - involves the aggregation of data such as
simple roll-ups or complex expressions involving inter-related data. For example, sales offices can be rolled-up todistricts and districts rolled-up to regions.
• Drill-Down - OLAP data servers can also go in the reversedirection and automatically display detail data, whichcomprises consolidated data. This is called drill-downs.Consolidation and drill-down are an inherent property ofOLAP servers.
• “Slicing and Dicing” - Slicing and dicing refers to the abilityto look at the database from different viewpoints. One sliceof the sales database might show all sales of product typewithin regions. Another slice might show all sales by saleschannel within each product type. Slicing and dicing is oftenperformed along a time axis in order to analyse trends andfind patterns.
OLAP servers have the means for storing multidimensionaldata in a compressed form. This is accomplished by dynamicallyselecting physical storage arrangements and compressiontechniques that maximize space utilization. Dense data (i.e., dataexists for a high percentage of dimension cells) are storedseparately from sparse data (i.e., a significant percentage of cellsare empty). For example, a given sales channel may only sell a

130
DA
TA W
AR
EH
OU
SIN
G A
ND
DA
TA M
ININ
G
few products, so the cells that relate sales channels to productswill be mostly empty and therefore sparse. By optimizing spaceutilization, OLAP servers can minimize physical storagerequirements, thus making it possible to analyse exceptionallylarge amounts of data. It also makes it possible to load moredata into computer memory, which helps to significantlyimprove performance by minimizing physical disk I/O.In conclusion OLAP servers logically organize data in multipledimensions, which allows users to quickly, and easily analyzecomplex data relationships. The database itself is physicallyorganized in such a way that related data can be rapidly retrievedacross multiple dimensions. OLAP servers are very efficientwhen storing and processing multidimensional data. RDBMSshave been developed and optimized to handle OLTP applica-tions. Relational database designs concentrate on reliability andtransaction processing speed, instead of decision support need.The different types of server can therefore benefit a broad rangeof data management applications.
Characteristics of OLAP: FASMIFast – means that the system targeted to deliver most re-sponses to user within about five second, with the simplestanalysis taking no more than one second and very few takingmore than 20 seconds.Analysis – means that the system can cope with any businesslogic and statistical analysis that it relevant for the applicationand the user, keep it easy enough for the target user. Althoughsome pre programming may be needed we do not think itacceptable if all application definitions have to be allow the userto define new adhoc calculations as part of the analysis and toreport on the data in any desired way, without having toprogram so we exclude products (like Oracle Discoverer) that donot allow the user to define new adhoc calculation as part of theanalysis and to report on the data in any desired product that donot allow adequate end user oriented calculation flexibility.Share – means that the system implements all the securityrequirements for confidentiality and, if multiple write access isneeded, concurrent update location at an appropriated level notall applications need users to write data back, but for thegrowing number that do, the system should be able to handlemultiple updates in a timely, secure manner.Multidimensional – is the key requirement. OLAP systemmust provide a multidimensional conceptual view of the data,including full support for hierarchies, as this is certainly themost logical way to analyze business and organizations.Information – are all of the data and derived informationneeded? Wherever it is and however much is relevant for theapplication. We are measuring the capacity of various productsin terms of how much input data they can handle, not howmany gigabytes they take to store it.
Basic Features of OLAP• Multidimensional Conceptual view: We believe this to be the
central core of OLAP• Initiative data manipulation: Dr. Codd prefers data
manipulation to be done through direct action on cells in theview w/o resource to menus of multiple actions.
• Accessibility: OLAP as a mediator, Dr. Codd essentiallydescribes OLAP engines as middleware, sittingheterogeneous data sources & OLAP front-end.
• Batch Extraction vs. Interpretive: this rule effectively requiresthat products offer both their own staging database forOLAP data as well as offering live access to external data.
• OLAP analysis models: Dr. Codd requires that OLAPproducts should support all four-analysis models thatdescribes in his white paper model
• Client server architecture: Dr. Codd requires not only that theproduct should be client/server but that the servercomponent of an OLAP product should be sufficientlyintelligent that various client can be attached with minimumeffort and programming for integration.
• Transparency: full compliance means that a user should beable to get full value from an OLAP engine and not even beaware of where the data ultimately comes from. To do thisproducts must allow live excess to heterogeneous datasources from a full function spreadsheet add-in, with theOLAP server in between.
• Multi-user support: Dr. Codd recognizes that OLAPapplications are not all read-only, & says that, to be regardedas strategic, OLAP tools must provide concurrent access,integrity & security.
Special features• Treatment of non-normalize data: this refers to the
integration between an OLAP engine and denormalizedsource data.
• Storing OLAP Result: keeping them separate from sourcedata. This is really an implementation rather than a productissue. Dr. Codd is endorsing the widely held view that read-write OLAP applications should not be implemented directlyon live transaction data, and OLAP data changes should bekept distinct from transaction data.
• Extraction of missing value: all missing value are to bedistinguished from zero values.
• Treatment of Missing values: all missing values to beignored by the OLAP analyzer regardless of their source.

131
DA
TA W
AR
EH
OU
SIN
G A
ND
DA
TA M
ININ
G
Exercise1. Write short notes on• Client Server Architecture• Slicing and Dicing• Drill down2. Correctly contrast and Compare OLAP and OLTP with
example.3. What is FASMI? Explain in brief.4. Explain various Basic Features of OLAP5. Discuss the importance of Multidimensional View in OLAP.
Explain with an example.

132
DA
TA W
AR
EH
OU
SIN
G A
ND
DA
TA M
ININ
G
Structure• Objective• Introduction• Multidimensional Data Model• Multidimensional versus Multirelational OLAP• OLAP Guidelines
ObjectiveAt the end of this lesson you will be able to• Study in detail about Multidimensional Data Model• Understand the difference between Multidimensional verses
Multirelational OLAP.• Identify various OLAP Guidelines
IntroductionOLAP is an application architecture, not intrinsically a datawarehouse or a database management system (DBMS).Whether it uti-lizes a data warehouse or not, OLAP is becom-ing an architecture that an increasing number of enterprises areimplementing to support analytical applications. The majorityof OLAP applications are deployed in a “stovepipe” fashion,using specialized MDDBMS technology, a narrow set of data,and, often, a prefabricated application-user interface. AB we lookat OLAP trends, we can see that the architectures have clearlydefined layers and that delin-eation exists between the applica-tion and the DBMS.Solving modern business problems such as market analysis andfinancial fore-casting requires query-centric database schemas thatare array-oriented and multidimensional in nature. Thesebusiness problems are characterized by the need to retrieve largenumbers of records from very large data sets (hundreds ofgigabytes and even terabytes) and summarize them on the fly.The multi-dimensional nature of the problems it is designed toaddress is the key driver for OLAP.The result set may look like a multidimensional spreadsheet(hence. the term multidimensional). Although all the necessarydata can be represented in a relational database and accessed viaSQL, the two-dimensional relational model of data and theStructured Query Language (SQL) have some serious limita-tions for such complex real-world problems. For example, aquery may translate into a number of complex SQL statements,each of which may involve full table scan, multiple joins,aggregations and sorting, and large temporary tables for storingintermediate results. The resulting query may require signif-icantcomputing resources that may not be available at all times andeven then may take a long time to complete. Another drawbackof SQL is its weakness in handling time series data andcomplex mathematical functions. Time series calculations suchas a 3-month moving average or net present value calcula-tions
LESSON 30MULTIDIMENSIONAL VERSES MULTIRELATIONAL OLAP,
FEATURES OF OLAP
typically require extensions to ANSI SQL rarely found incommercial products.
Response time and SQL functionality are not the only prob-lems. OLAP is a continuous, iterative, and preferably interactiveprocess. An analyst may drill down into the data to see, forexample, how an individual salesperson’s per-formance affectsmonthly revenue numbers. At the same time, the drill-downprocedure may help the analyst discover certain patterns in salesof given products. This discovery can force another set ofquestions of similar or greater complexity. Technically, all theseanalytical questions can be answered by a large number of rathercomplex queries against a set of detailed and presum-marizeddata views. In reality, however, even if the analyst could quicklyand accurately formulate SQL statements of this complexity, theresponse time and resource consumption problems would stillpersist, and the analyst’s produc-tivity would be seriouslyimpacted.
Multidimensional Data ModelThe multidimensional nature of business questions is reflectedin the fact that, for example, marketing managers are no longersatisfied by asking simple one-dimensional questions such as“How much revenue did the new product gener-ate?” Instead,they ask questions such as “How much revenue did the newproduct generate by month, in the northeastern division,broken down by user demographic, by sales office, relative tothe previous version of the product, compared the with plan?”-A six-dimensional question. One way to look at themultidimensional data model is to view it as a cube (see Fig.30.1). The table on the left contains detailed sales data byproduct, market, and time. The cube on the right associatessales numbers (units sold) with dimensions-product type,market, and time-with the UNIT variables organized as cells inan array. This cube can be expanded to include another array-price-which can be associated with all or only some dimensions(for example, the unit price of a product mayor may not changewith time, or from city to city). The cube sup-ports matrixarithmetic that allows the cube to present the dollar sales arraysimply by performing a single matrix operation on all cells ofthe array {dollar sales = units * price}.The response time of the multidimensional query still dependson how many cells have to be added on the fly. The caveat hereis that, as the number of dimensions increases, the number ofthe cube’s cells increases exponentially. On the other hand, themajority of multidimensional queries deal with sum-marized,high-level data. Therefore, the solution to building an efficientmulti-dimensional database is to preaggregate (consolidate) alllogical subtotals and totals along all dimensions. Thispreaggregation is especially valuable since typical dimensions arehierarchical in nature. For example, the TIME dimen-sion maycontain hierarchies for years, quarters, months, weeks, and days;

133
DA
TA W
AR
EH
OU
SIN
G A
ND
DA
TA M
ININ
GGEOGRAPHY may contain country, state, city, etc. Having thepredefined hier-archy within dimensions allows for logical preaggregation and, conversely, allows for a logical drill-down-fromthe product group to individual products, from annual sales toweekly sales, and so on.Another way to reduce the size of the cube is to properly handlesparse data. Often, not every cell has a meaning across alldimensions (many marketing databases may have more than 95percent of all cells empty or containing 0). Another kind ofsparse data is created when many cells contain duplicate data(Le., if the cube contains a PRICE dimension, the same pricemay apply to all markets and all quarters for the year). The abilityof a multidimensional data-base to skip empty or repetitivecells can greatly reduce the size of the cube and the amount ofprocessing.
Dimensional hierarchy, sparse data management, and preaggregation are the keys, since they can significantly reduce thesize of the database and the need to calculate values. Such adesign obviates the need for multi table joins and providesquick and direct access to the arrays of answers, thus signifi-cantly speeding up execution of the multidimensional queries.
Fig :30.1
Multidimensional versus MultirelationalOLAPThese relational implementations of multidimensionaldatabase systems are sometimes referred to as multirelationaldatabase systems. To achieve the required speed, these productsuse the star or snowflake schemas-specially optimized anddenormalized data models that involve data restructuring andaggregation. (The snowflake schema is an extension of the starschema that supports multiple fact tables and joins betweenthem.)One benefit of the star schema approach is reduced complexityin the data model, which increases data “legibility,” making iteas-ier for users to pose business questions of OLAP nature.Data warehouse queries can be answered up to 10 times fasterbecause of improved navigations.Two types of database activity:
1. OLTP: On-Line Transaction Processing
• Short transactions, both queries and updates (e.g., update account balance, enroll in course)
• Queries are simple
(e.g., find account balance, find grade in course)• Updates are frequent
(e.g., concert tickets, seat reservations, shopping carts)2 OLAP: On-Line Analytical Processing
• Long transactions, usually complex queries (e.g., all statistics about all sales, grouped by dept and
month)• “Data mining” operations• Infrequent updates
OLAP GuidelinesThe data that is presented through any OLAP access routeshould be identical to that used in operational systems. Thevalues achieved through ‘drilling down’ on the OLAP sideshould match the data accessed through an OLTP system.12 Rules satisfied by an OLAP system1. Multi-Dimensional Conceptual View
This is a key feature of OLAP. OLAP databases shouldsupport multi-dimensional view of the data allowing for‘slice and dice’ operations as well as pivoting and rotating thecube of data. This is achieved by limiting the values ofdimensions and by changing the orders of the dimensionswhen viewing the data.
2. TransparencyUsers should have no need to know they are looking at anOLAP database. The users should be focused only upon thetool used to analysis the data, not the data storage.
3. AccessibilityOLAP engines should act like middleware, sitting betweendata sources and an OLAP front end. This is usually achievedby keeping summary data in an OLAP database and detaileddata in a relational database.
4. Consistent Reporting PerformanceChanging the number of dimensions or the number ofaggregation levels should not significantly change reportingperformance.
5. Client-Server ArchitectureOLAP tools should be capable of being deployed in a client-server environment. Multiple clients should be able to accessthe server with minimum effort.
6. Generic DimensionalityEach dimension must be equivalent in both its structure andoperational capabilities. Data structures, formulae, andreporting formats should not be biased toward any datadimension.
7. Dynamic Sparse Matrix HandlingA multi-dimensional database may have many cells that haveno appropriate data. These null values should be stored in away that does not adversely affect performance andminimizes space used.
8. Multi-User SupportOLAP applications should support concurrent access whilemaintaining data integrity.

134
DA
T
A W
A
RE
HO
US
ING
AN
D D
A T
A M
ININ
G
9. Unrestricted Cross-Dimensional OperationsAll forms of calculations should be allowed across alldimensions.
10.Intuitive Data ManipulationThe users should be able to directly manipulate the datawithout interference from the user interface.
11.Flexible ReportingThe user should be able to retrieve any view of data requiredand present it in any way that they require.
12.Unlimited Dimensions and Aggregation LevelsThere should be no limit to the number of dimensions oraggregation levels.
Six additional features of an OLAP system1. Batch Extraction vs. Interpretive
OLAP systems should offer both their own multi-dimensional database as well as live access to external data.This describes a hybrid system where users can transparentlyreach through to detail data.
2. OLAP Analysis ModelsOLAP products should support all four data analysis modelsdescribed above (Categorical, Exegetical, Contemplative, andFormulaic)
3. Treatment of Non-Normalized DataOLAP systems should not allow the user to alter de-normalized data stored in feeder systems. Anotherinterpretation is that the user should not be allowed to alterdata in calculated cells within the OLAP database.
4. Storing OLAP Results: keeping them separate from SourceDataRead-write OLAP applications should not be implementeddirectly on live transaction data and OLAP data changesshould be kept distinct from transaction data.
5. Extraction of Missing ValuesMissing values should be treated as Null values by the OLAPdatabase instead of zeros.
6. Treatment of Missing ValuesAn OLAP analyzer should ignore missing values.Many people take issue with the rules put forth by Dr. Codd.Unlike his rules for relational databases, these rules are notbased upon mathematical principles. Because a softwarecompany, Arbor Software Corporation, sponsored his paper,some members of the OLAP community feel that his rules aretoo subjective. Nigel Pendise of the OLAP Report has offeredan alternate definition of OLAP. This definition is based uponthe phrase Fast Analysis of Shared Multidimensional Informa-tion (FASMI).• Fast
The system should deliver most responses to users within afew seconds. Long delays may interfere with the ad hocanalysis.
• AnalysisThe system should be able to cope with any business logicand statistical analysis that is relevant for the application.
• SharedThe system implements all the security requirements forconfidentiality. Also, if multiple write access is needed, thesystem provides concurrent update locking at an appropriatelevel.
• MultidimensionalThis is the key requirement. The system should provide amultidimensional conceptual view of the data, includingsupport for hierarchies and multiple hierarchies.
• InformationThe system should be able to hold all data needed by theapplications. Data sparsity should be handled in an efficientmanner.

135
DA
TA W
AR
EH
OU
SIN
G A
ND
DA
TA M
ININ
G
Exercise
1. Write short notes on:• OLTP• Consistent Reporting Performance• OLAP• FASMI
2. Illustrate with the help of a diagram the Client-ServerArchitecture in brief.
3. Explain the importance of Multidimensional Data Model inOLAP.
4. Correctly contrast the difference between Multidimensionalversus Multirelational OLAP.
5. Discuss in brief OLAP guidelines suggested by C.J.Codd.
Notes

136
DA
TA W
AR
EH
OU
SIN
G A
ND
DA
TA M
ININ
G
Structure• Objective• Introduction• OLAP Operations• Lattice of cubes, slice and dice operations• Relational representation of the data cube• Database management systems (DBMS), Online Analytical
Processing (OLAP) and Data Mining• Example of DBMS, OLAP and Data Mining: Weather data
ObjectiveThe main objective of this lesson is to introduce you withvarious OLAP Operations
IntroductionIn today’s fast-paced, information-driven economy, organiza-tions heavily rely on real-time business information to makeaccurate decisions. The number of individuals within anenterprise who have a need to perform more sophisticatedanalysis is growing. With their ever-increasing requirements fordata manipulating tools, end users cannot be already satisfiedwith flat grids and a fixed set of parameters for query execution.OLAP is the best technology that empowers users withcomplete ease in manipulating their data. The very moment youreplace your common grid with an OLAP interface users will beable independently to perform various ad-hoc queries, arbitrarilyfilter data, rotate a table, drill down, get desired summaries, andrank. From users’ standpoint, the information system equippedwith OLAP-tool gains a new quality; helps not only getinformation but also summarize and analyze it.From the developer’s point of view, OLAP is an elegant way toavoid thankless and tedious programming of multiple on-lineand printed reports.
OLAP OperationsAssume we want to change the level that we selected for thetemperature hierarchy to the intermediate level (hot, mild, cool).To do this we have to group columns and add up the valuesaccording to the concept hierarchy. This operation is called roll-up, and in this particular case it produces the following cube.
cool mild hot week 1 2 1 1 week 2 1 3 1
In other words, climbing up the concept hierarchy producesroll-up’s. Inversely, climbing down the concept hierarchyexpands the table and is called drill-down. For example, thedrill down of the above data cube over the time dimensionproduces the following:
LESSON 31OLAP OPERATIONS
cool mild hot day 1 0 0 0 day 2 0 0 0 day 3 0 0 1 day 4 0 1 0 day 5 1 0 0 day 6 0 0 0 day 7 1 0 0 day 8 0 0 0 day 9 1 0 0 day 10 0 1 0 day 11 0 1 0 day 12 0 1 0 day 13 0 0 1 day 14 0 0 0
Lattice of Cubes, Slice and DiceOperationsThe number of dimensions defines the total number of datacubes that can be created. Actually this is the number ofelements in the power set of the set of attributes. Generally ifwe have a set of N attributes, the power set of this set willhave 2N elements. The elements of the power set form alattice. This is an algebraic structure that can be generated byapplying intersection to all subsets of the given set. It has abottom element - the set itself and a top element - the emptyset. Here is a part of the lattice of cubes for the weather datacube.
{} _____|______ | | ... {outlook} {temperature} ... ___________|________ | | ... {temperature,humidity} {outlook,temperature} ... | | ... ... ... | {outlook,temperature,humidity,windy} {time,temperature,humidity,windy} |____________________________________| | {time,outlook,temperature,humidity,windy}
In the above terms the selection of dimensions actually meansselection of a cube, i.e. an element of the above lattice.

137
DA
TA W
AR
EH
OU
SIN
G A
ND
DA
TA M
ININ
GThere are two other OLAP operations that are related to theselection of a cube - slice and dice. Slice performs a selection onone dimension of the given cube, thus resulting in a subcube.For example, if we make the selection (temperature=cool) wewill reduce the dimensions of the cube from two to one,resulting in just a single column from the table above.
cool day 1 0 day 2 0 day 3 0 day 4 0 day 5 1 day 6 0 day 7 1 day 8 0 day 9 1 day 10 0 day 11 0 day 12 0 day 13 0 day 14 0
The dice operation works similarly and performs a selection ontwo or more dimensions. For example, applying the selection(time = day 3 OR time = day 4) AND (temperature = coolOR temperature = hot) to the original cube we get thefollowing subcube (still two-dimensional):
cool hot day 3 0 1 day 4 0 0
Relational Representation of the DataCubeThe use of the lattice of cubes and concept hierarchies gives us agreat flexibility to represent and manipulate data cubes.However, a still open question is how to implement all this. Aninteresting approach to this based on a simple extension ofstandard relational representation used in DBMS is proposedby Jim Gray and collaborators. The basic idea is to use the valueALL as a legitimate value in the relational tables. Thus, ALLwill represent the set of all values aggregated over the corre-sponding dimension. By using ALL we can also represent thelattice of cubes, where instead of dropping a dimension whenintersecting two subsets, we will replace it with ALL. Then allcubes will have the same number of dimensions, where theirvalues will be extended with the val,ue ALL. For example, apart of the above shown lattice will now look like this:
{ALL,ALL,temperature,ALL,ALL} __________________|_________________ | |
{ALL,ALL,temperature,humidity,ALL} {ALL,outlook,temperature,ALL,ALL}
Using this technique the whole data cube can be represented as asingle relational table as follows (we use higher levels in theconcept hierarchies and omit some rows for brevity):
Time Outlook Temperature Humidity Windy Play week 1 sunny cool normal true 0 week 1 sunny cool normal false 0 week 1 sunny cool normal ALL 0 week 1 sunny cool high true 0 week 1 sunny cool high false 0 week 1 sunny cool high ALL 0 week 1 sunny cool ALL true 0 week 1 sunny cool ALL false 0 week 1 sunny cool ALL ALL 0 week 1 sunny mild normal true 0
... ... ... ... ... ... week 1 overcast ALL ALL ALL 2 week 1 ALL ALL ALL ALL 4 week 2 sunny cool normal true 0 week 2 sunny cool normal false 1 week 2 sunny cool normal ALL 1 week 2 sunny cool high true 0
... ... ... ... ... ... ALL ALL ALL high ALL 3 ALL ALL ALL ALL true 3 ALL ALL ALL ALL false 6 ALL ALL ALL ALL ALL 9
The above table allows us to use an unified approach toimplement all OLAP operations - they all can me implementedjust by selecting proper rows. For example, the following cube,can be extracted from the table by selecting the rows that matchthe pattern (*, ALL, *, ALL, ALL), where * matches all legiti-mate values for the corresponding dimension except for ALL.
cool mild hot week 1 2 1 1 week 2 1 3 1

138
DA
TA W
AR
EH
OU
SIN
G A
ND
DA
TA M
ININ
G
Database Management Systems (DBMS), OnlineAnalytical Processing (OLAP) and Data Mining
Area DBMS OLAP Data Mining
Task Extraction of detailed and
summary data
Summaries, trends and forecasts
Knowledge discovery of
hidden patterns and insights
Type of result Information Analysis Insight and
Prediction
Method
Deduction (Ask the
question, verify with data)
Multidimensional data modeling,
Aggregation, Statistics
Induction (Build the model, apply it to new data, get the result)
Example question
Who purchased
mutual funds in the last 3
years?
What is the average income of mutual
fund buyers by region by year?
Who will buy a mutual fund in
the next 6 months and
why?
Example of DBMS, OLAP and Data Mining: WeatherDataAssume we have made a record of the weather conditionsduring a two-week period, along with the decisions of a tennisplayer whether or not to play tennis on each particular day. Thuswe have generated tuples (or examples, instances) consisting ofvalues of four independent variables (outlook, temperature,humidity, windy) and one dependent variable (play). See thetextbook for a detailed description.
DBMSConsider our data stored in a relational table as follows:
Day Outlook Temperature Humidity Windy Play 1 Sunny 85 85 false no 2 Sunny 80 90 true no 3 overcast 83 86 false yes 4 Rainy 70 96 false yes 5 Rainy 68 80 false yes 6 Rainy 65 70 true no 7 overcast 64 65 true yes 8 Sunny 72 95 false no 9 Sunny 69 70 false yes 10 Rainy 75 80 false yes 11 Sunny 75 70 true yes 12 overcast 72 90 true yes 13 overcast 81 75 false yes 14 Rainy 71 91 true no
By querying a DBMS containing the above table we may answerquestions like:• What was the temperature in the sunny days? {85, 80, 72, 69,
75}• Which days the humidity was less than 75? {6, 7, 9, 11}• Which days the temperature was greater than 70? {1, 2, 3, 8,
10, 11, 12, 13, 14}• Which days the temperature was greater than 70 and the
humidity was less than 75? The intersection of the abovetwo: {11}
OLAPUsing OLAP we can create a Multidimensional Model of ourdata (Data Cube). For example using the dimensions: time,outlook and play we can create the following model.
9 / 5 s u n n y rainy overcas t
Week 1 0 / 2 2 / 1 2 / 0
Week 2 2 / 1 1 / 1 2 / 0
Obviously here time represents the days grouped in weeks(week 1 - days 1, 2, 3, 4, 5, 6, 7; week 2 - days 8, 9, 10, 11, 12, 13,14) over the vertical axis. The outlook is shown along thehorizontal axis and the third dimension play is shown in eachindividual cell as a pair of values corresponding to the twovalues along this dimension - yes / no. Thus in the upper leftcorner of the cube we have the total over all weeks and alloutlook values.By observing the data cube we can easily identify some impor-tant properties of the data, find regularities or patterns. Forexample, the third column clearly shows that if the outlook isovercast the play attribute is always yes. This may be put as arule:if outlook = overcast then play = yesWe may now apply “Drill-down” to our data cube over the timedimension. This assumes the existence of a concept hierarchyfor this attribute. We can show this as a horizontal tree asfollows:• time
• week 1• day 1• day 2• day 3• day 4• day 5• day 6• day 7
• week 2• day 8• day 9• day 10• day 11• day 12• day 13

139
DA
TA W
AR
EH
OU
SIN
G A
ND
DA
TA M
ININ
G• day 14• day 15
The drill-down operation is based on climbing down theconcept hierarchy, so that we get the following data cube:
9 / 5 Sunny Rainy Overcast 1 0 / 1 0 / 0 0 / 0 2 0 / 1 0 / 0 0 / 0 3 0 / 0 0 / 0 1 / 0 4 0 / 0 1 / 0 0 / 0 5 0 / 0 1 / 0 0 / 0 6 0 / 0 0 / 1 0 / 0 7 0 / 0 0 / 0 1 / 0 8 0 / 1 0 / 0 0 / 0 9 1 / 0 0 / 0 0 / 0 10 0 / 0 1 / 0 0 / 0 11 1 / 0 0 / 0 0 / 0 12 0 / 0 0 / 0 1 / 0 13 0 / 0 0 / 0 1 / 0 14 0 / 0 0 / 1 0 / 0
The reverse of drill-down (called roll-up) applied to this datacube results in the previous cube with two values (week 1 andweek 2) along the time dimension.
Data MiningBy applying various Data Mining techniques we can findassociations and regularities in our data, extract knowledge inthe forms of rules, decision trees etc., or just predict the valueof the dependent variable (play) in new situations (tuples). Hereare some examples (all produced by Weka):
Mining Association RulesTo find associations in our data we first discretize the nu-meric attributes (a part of the data pre-processing stage indata mining). Thus we group the temperature values in threeintervals (hot, mild, cool) and humidity values in two (high,normal) and substitute the values in data with the correspond-ing names. Then we apply the Apriori algorithm and get thefollowing association rules:1. Humidity=normal windy=false 4 ==> play=yes (4, 1)2. Temperature=cool 4 ==> humidity=normal (4, 1)3. Outlook=overcast 4 ==> play=yes (4, 1)4. Temperature=cool play=yes 3 ==> humidity=normal(3, 1)5. Outlook=rainy windy=false 3 ==> play=yes (3, 1)6. Outlook=rainy play=yes 3 ==> windy=false (3, 1)7. Outlook=sunny humidity=high 3 ==> play=no (3, 1)8. Outlook=sunny play=no 3 ==> humidity=high (3, 1)9. Temperature=cool windy=false 2 ==> humidity=normal
play=yes (2, 1)10. Temperature=cool humidity=normal windy=false 2 ==>
play=yes (2, 1)
These rules show some attribute values sets (the so called itemsets) that appear frequently in the data. The numbers after eachrule show the support (the number of occurrences of the itemset in the data) and the confidence (accuracy) of the rule.Interestingly, rule 3 is the same as the one that we produced byobserving the data cube.
Classification by Decision Trees andRulesUsing the ID3 algorithm we can produce the following decisiontree (shown as a horizontal tree):• outlook = sunny
• humidity = high: no• humidity = normal: yes
• outlook = overcast: yes• outlook = rainy
• windy = true: no• windy = false: yes
The decision tree consists of decision nodes that test the valuesof their corresponding attribute. Each value of this attributeleads to a subtree and so on, until the leaves of the tree arereached. They determine the value of the dependent variable.Using a decision tree we can classify new tuples (not used togenerate the tree). For example, according to the above tree thetuple {sunny, mild, normal, false} will be classified underplay=yes.A decision trees can be represented as a set of rules, where eachrule represents a path through the tree from the root to a leaf.Other Data Mining techniques can produce rules directly. Forexample the Prism algorithm available in Weka generates thefollowing rules.If outlook = overcast then yesIf humidity = normal and windy = false then yesIf temperature = mild and humidity = normal then yesIf outlook = rainy and windy = false then yesIf outlook = sunny and humidity = high then noIf outlook = rainy and windy = true then no
Prediction MethodsData Mining offers techniques to predict the value of thedependent variable directly without first generating a model.One of the most popular approaches for this purpose is basedof statistical methods. It uses the Bayes rule to predict theprobability of each value of the dependent variable given thevalues of the independent variables. For example, applyingBayes to the new tuple discussed above we get:P(play=yes | outlook=sunny, temperature=mild,humidity=normal, windy=false) = 0.8P(play=no | outlook=sunny, temperature=mild,humidity=normal, windy=false) = 0.2Then obviously the predicted value must be “yes”.

140
DA
TA W
AR
EH
OU
SIN
G A
ND
DA
TA M
ININ
G
Exercise1. Write short notes on:o Relational representation of the data cubeo Mining Association Ruleso Slice and dice operations2. Explain in brief various OLAP Operations.3. Differentiate between Database management systems
(DBMS), Online Analytical Processing (OLAP) and DataMining
4. Explain the difference between DBMS, OLAP and DataMining with related example.
Notes

141
DA
TA W
AR
EH
OU
SIN
G A
ND
DA
TA M
ININ
G
Summary• Objective• Categorization of OLAP Tools• MOLAP• ROLAP• Managed query environment (MQE)• Cognos PowerPlay• Pilot Software• OLAP Tools and the Internet
ObjectiveThe objective of this lesson is to introduce you with variousOLAP Tools
Categorization of OLAP ToolsOn-line analytical processing (OLAP) tools are based on theconcepts of multi-dimensional databases and allow a sophisti-cated user to analyze the data using elaborate,multidimensional, complex views. Typical business applica-tions for these tools include product performance andprofitability, effective-ness of a sales program or a marketingcampaign, sales forecasting, and capacity planning. These toolsassume that the data is organized in a multidi-mensionalmodel, which is supported by a special multidimensionaldatabase (MDDB) or by a relational database designed to enablemultidimensional prop-erties (e.g., star schema,). A chartcomparing capabilities of these two classes of OLAP tools isshown in Fig. 32.1.
Fig 32.1
MOLAPTraditionally, these products utilized specialized data structures[i.e., multi-dimensional database management systems
LESSON 32CATEGORIZATION OF OLAP TOOLS CONCEPTS USED IN MOLAP/ ROLAP
(MDDBMSs)] to organize, navi-gate, and analyze data, typicallyin an aggregated form, and traditionally required a tightcoupling with the application layer and presentation layer. Thererecently has been a quick movement by MOLAP vendors tosegregate the OLAP through the use of published applicationprogramming interfaces (APIs). Still, there remains the need tostore the data in a way similar to the way in which it will beutilized, to enhance the performance and provide a degree ofpredictability for complex analysis queries. Data structures usearray technology and, in most cases, provide improved storagetechniques to minimize the disk space requirements throughsparse data management. This architecture enables excellentperformance when the data is utilized as designed, and predict-able application response times for applications address-ing anarrow breadth of data for a specific DSS requirement. Inaddition, some products treat time as a special dimension (e.g.,Pilot Software’s Analysis Server), enhancing their ability toperform time series analysis. Other products provide stronganalytical capabilities (e.g., Oracle’s Express Server) built into thedatabase.Applications requiring iterative and comprehensive time seriesanalysis of trends are well suited for MOLAP technology (e.g.,financial analysis and bud-geting). Examples include ArborSoftware’s Essbase, Oracle’s Express Server, Pilot Software’sLightship Server, Sinper’s TM/l, Planning Sciences’ Gentium,and Kenan Technology’s Multiway.
Several challenges face users considering the implementation ofapplications with MOLAP products. First, there are limitationsin the ability of data struc-tures to support multiple subjectareas of data (a common trait of many strate-gic DSS applica-tions) and the detail data required by many analysis applications.This has begun to be addressed in some products, utilizingrudi-mentary “reach through” mechanisms that enable theMOLAP tools to access detail data maintained in an RDBMS (asshown in Fig. 32.2). There are also limitations in the way datacan be navigated and analyzed, because the data is structuredaround the navigation and analysis requirements known at thetime the data structures are built. When the navigation ordimension requirements change, the data structures may needto be physically reorganized to optimally support the newrequirements. This problem is similar in nature to the olderhierarchical and network DBMSs (e.g., IMS, IDMS), wheredifferent sets of data had to be created for each application thatused the data in a manner different from the way the data wasoriginally maintained. Finally, MOLAP products require adifferent set of skills and tools for the database administratorto build and maintain the database, thus increasing the cost andcomplexity of support.To address this particular issue, some vendors significantlyenhanced their reach-through capabilities. These hybridsolutions have as their primary char-acteristic the integration of

142
DA
TA W
AR
EH
OU
SIN
G A
ND
DA
TA M
ININ
G
specialized multidimensional data storage with RDBMStechnology, providing users with a facility that tightly “couples”the multidimensional data structures (MDDSs) with datamaintained in an RDBMS (see Fig. 32.2, left). This allows theMDDSs to dynamically obtain detail data maintained in anRDBMS, when the application reaches the bottom of themultidimensional cells during drill-down analysis.
Fig. 32.2
This may deliver the best of both worlds, MOLAP andROLAP. This approach can be very useful for organizationswith performance-sensitive multidimensional analysis require-ments and that have built, or are in the process of building, adata warehouse architecture that contains multiple subject areas.An example would be the creation of sales data measured byseveral dimensions (e.g., product and sales region) to be storedand maintained in a persistent structure. This structure wouldbe provided to reduce the application overhead of performingcalcula-tions and building aggregations during applicationinitialization. These struc-tures can be automatically refreshed atpredetermined intervals established by an administrator.
ROLAPThis segment constitutes the fastest-growing style of OLAPtechnology, with new vendors (e.g., Sagent Technology) enteringthe market at an accelerating pace. Products in this group havebeen engineered from the beginning to support RDBMSproducts directly through a dictionary layer of metadata,bypassing any requirement for creating a static multidimensionaldata structure (see Fig. 32.3). This enables multiple multidimen-sional views of the two-dimensional relational tables to becreated without the need to structure the data around thedesired view. Finally, some of the products in this segment havedeveloped strong SQL- generation engines to support thecomplexity of multidimensional analysis. This includes thecreation of multiple SQL statements to handle user requests,being “RDBMS-aware,” and providing the capability to generatethe SQL based on the optimizer of the DBMS engine. Whileflexibility is an attractive feature of ROLAP products, there areproducts in this segment that recommend, or require, the useof highly denormalized database designs (e.g., star schema).
Fig.32.3
The ROLAP tools are undergoing some technology realign-ment. This shift in technology emphasis is coming in twoforms. First is the movement toward pure middlewaretechnology that provides facilities to simplify development ofmultidimensional applications. Second, there continues furtherblurring of the lines that delineate ROLAP and hybrid-OLAPproducts. Vendors of ROLAP tools and RDBMS productslook to provide an option to create multi-dimensional,persistent structures, with facilities to assist in the administra-tion of these structures. Examples include InformationAdvantage (Axsys), MicroStrategy (DSS AgentIDSS Server),Platinum/Prodea Software (Beacon), Informix/StanfordTechnology Group (Metacube), and Sybase (HighGate Project).
Managed Query Environment (MQE)This style of OLAP, which is beginning to see increased activity,provides users with the ability to perform limited analysiscapability, either directly against RDBMS products, or byleveraging an intermediate MOLAP server (see Fig. 32.4). Someproducts (e.g., Andyne’sPablo) that have a heritage in ad hocquery have developed features to provide “datacube” and “sliceand dice” analysis capabilities. This is achieved by first develop-ing a query to select data from the DBMS, which then deliversthe requested data to the desktop, where it is placed into adatacube. This datacube can be stored and maintained locally, toreduce the overhead required to create the struCture each timethe query is executed. Once the data is in the datacube, users canperform multidimen-sional analysis (i.e., slice, dice, and pivotoperations) against it. Alternatively, these tools can work withMOLAP servers, and the data from the relational DBMS can bedelivered to the MOLAP server, and from there to the desktop.The simplicity of the installation and administration of suchproducts makes them particularly attractive to organizationslooking to provide seasoned users with more sophisticatedanalysis capabilities, without the significant cost and mainte-nance of more complex products. With all the ease ofinstallation and administration that accompanies the desktopOLAP products, most of these tools require the datacube to bebuilt and maintained on the desktop or a sep-arate server.

143
DA
TA W
AR
EH
OU
SIN
G A
ND
DA
TA M
ININ
G
Fig. 32.4
With metadata definitions that assist users in retrieving the cor-rect set of data that makes up the datacube, this method causesa plethora of data redundancy and strain to most networkinfrastructures that support many users. Although thismechanism allows for the flexibility of each user to build acustom datacube, the lack of data consistency among users, andthe rel-atively small amount of data that can be efficientlymaintained are significant challenges facing tool administrators.Examples include Cognos Software’s PowerPlay, AndyneSoftware’s Pablo, Business Objects’ Mercury Project, Dimen-sional Insight’s CrossTarget, and Speedware’s Media.OLAP tools provide an intuitive way to view corporate data.These tools aggre-gate data along common business subjects ordimensions and then let users navigate through the hierarchies,and dimensions with the click of a mouse but-ton. Users candrill down, across, or up levels in each dimension or pivot andswap out dimensions to change their view of the data.Some tools, such as Arbor Software Corp.’s Essbase andOracle’s Express, pre aggregate data in special multidimensionaldatabases. Other tools work directly against relational data andaggregate data on the fly, such as Micro-Strategy, Inc.’s DSSAgent or Information Advantage, Inc.’s DecisionSuite. Sometools process OLAP data on the desktop instead of a server.Desktop OLAP tools include Cognos’ PowerPlay, BrioTechnology, Inc.’s HrioQuery, Plan-ning Sciences, Inc.’s Gen-tium, and Andyne’s Pablo. Many of the differences betweenOLAP tools are fading. Vendors are rearchitecting their productsto give users greater control over the tradeoff between flexibilityand perfor-mance that is inherent in OLAP tools. Manyvendors are rewriting pieces of their products in Java.Database vendors eventually might be the largest OLAPproviders. The lead-ing database vendors plan to incorporateOLAP functionality in their database kernels. Oracle, InformixSoftware, Inc., and-most recently-Microsoft have taken the firststep toward this end by acquiring OLAP vendors (lRI Software,Stanford Technology Group, and Panorama, respectively.)Red Brick Systellls’ Red Brick Warehouse has always supportedSQL exten-sions that perform simple OLAP functions, such asrank, sorts, and moving averages. Red Brick Warehouse 5.0 alsosupports data mining algorithms.
Cognos PowerPlayPowerPlay from Cognos is a mature and popular software toolfor multidimen-sional analysis of corporate data. PowerPlay canbe characterized as an MQE tool that can leverage corporate
investment in the relational database technology to providemultidimensional access to enterprise data, at the same timeproving robustness, scalability, and administrative control.Cognos PowerPlay is an open OLAP solution that caninteroperate with a wide variety of third-party software tools,databases, and applications. The analytical data used byPowerPlay is stored in multidimensional data sets calledPowerCubes. Cognos’ client/server architecture allows for thePower-Cubes to be stored on the Cognos universal client or ona server. PowerPlay offers a single universal client for OLAPservers that supports PowerCubes located locally, on the LAN,or (optionally) inside popular relational databases. In additionto the fast installation and deployment capabilities, PowerPlaypro-vides a high level of usability with a familiar Windowsinterface, high perfor-mance, scalability, and relatively low costof ownership.Specifically, starting with version 5, Cognos PowerPlay clientoffers• Support for enterprise-size data sets (PowerCubes) of 20+
million records,100,000 categories, and 100 measures• A drill-through capability for queries from Cognos
Impromptu• Powerful 3-D charting capabilities with background and
rotation control for advanced users• Scatter charts that let users show data across two measures,
allowing easy comparison of budget to actual values• Linked displays that give users multiple views of the same
data in a report• Full support for OLE2 Automation, as both a client and a
server• Formatting features for financial reports: brackets for
negative numbers,• Single and double underlining, and reverse sign for expenses• Faster and easier ranking of data• A “home” button that automatically resets the dimension
line to the top level• Unlimited undo levels and customizable toolbars• An enhanced PowerPlay Portfolio that lets users build
graphical, interactive, EIS-type briefing books fromPowerPlay reports; Impromptu reports; word processing,spreadsheet, or presentation documents; or any otherdocuments or reports
• A 32-bit architecture for Windows NT, Windows 95, andWindows 3.1
• Access to third-party OLAP tools including direct nativeaccess to Arbor’s Essbase and Oracle’s Expressmultidimensional databases
• PowerCube creation and access within in existing relationaldatabases such as ORACLE, SYBASE, or Microsoft SQLServer right inside the data warehouse.
• PowerCube creation scheduled for off-peak processing, orsequential to other processes
• Advanced security control by dimension, category, andmeasure-on the client, the server, or both

144
DA
TA W
AR
EH
OU
SIN
G A
ND
DA
TA M
ININ
G
• Remote analysis where users pull subsets of informationfrom the server down to the client
• Complete integration with relational database security anddata manage-ment features
• An open API through OLE Automation, allowing bothserver- and client--based PowerCubes to be accessed byVisual Basic applications, spreadsheets, and other third-partytools and applications
PowerPlay Administrator. As was mentioned above, PowerPlay’s capabilities include drill-to-detail using Impromptu. Also,cubes can be built using data from multiple data sources. Forthe administrators who are responsible for cre-ating multidi-mensional cubes, new capabilities allow them to populate thesePowerCubes inside popular relational databases, and to do theprocessing off the desktop and on UNIX servers. To provide arobust administration capabil-ities, Cognos offers a companiontool-PowerPlay Administrator, which is available in Databaseand Server editions.In Power Play Administrator Database edition, the administra-tor would con-tinue to model the cube and run the populationof the cube process (called Transform) on the client platform.The advantage is that data from multiple sources can now beused to generate a PointerCube for the client, and the actualPowerCube can be inside a relational database. This means thatexist-ing database management tools and the database adminis-trator can be used to manage the business data, and a singledelivery mechanism can be employed for both application andOLAP processing. A sophisticated security model is providedwhich in effect creates a “master” cube to service a variety ofusers. This is defined and controlled through the Authenticator,also included with PowerPlay.The Administrator Server edition of PowerPlay lets usersprocess the popu-lation of the cube on a UNIX platform. Anadministrator uses client Trans-former to create a model, andmoves it to the UNIX server using the supplied softwarecomponent called PowerGrid. The server Transformer, oncetriggered, will create the PowerCube, and the only prerequisite isthat all data sources be accessible. Once completed, the resultingPowerCube (or PointerCube if the multidimensional databaseis placed inside an RDBMS) is copied or trans-ferred to theclient platform for subsequent PowerPlay analysis by the user.The Authenticator can be used to establish user classes andaccess security, and can also be used to redirect cube access sinceall database passwords and locations can be known to theAuthenticator.PowerPlay supports clients on Windows 3.1, Windows 95, andWindows NT. Administrator Database and Server editionsexecute on HP/UX, IBM AIX, and Sun Solaris, and supportPowerCubes in ORACLE 7, SYBASE SQL Server, andMicrosoft SQL Server.
Pilot SoftwarePilot Software offers the Pilot Decision Support Suite of toolsfrom a high speed multidimensional database (MOLAP), DataWarehouse integration (ROLAP), data mining, and a diverse setof customizable business applications targeted after sales and
marketing professionals. The following products are at the coreof Pilot Software’s offering:Pilot Analysis Server. A full-function multidimensionaldatabase with high-speed consolidation, graphical user interface(Pilot Model Builder), and expert-level interface. .The latestversion includes relational integration of the multidimensionalmodel with relational data stores, thus allowing the user thechoice between high-speed access of a multidimensionaldatabase or on-the-fly (ROLAP) access of detail data storeddirectly in the data ware-house or data mart.Pilot Link. A database connectivity tool that includes ODBCconnectivity and high-speed connectivity via specialized driversto the most popular rela-tional database platforms. A graphicaluser interface allows the user seam-less and easy access to a widevariety of distributed databases.Pilot Designer. An application design environment specificallycreated to enable rapid development of OLAP applications.Pilot Desktop. A collection of applications that allow the enduser easy nav-igation and visualization of the multidimensionaldatabase.Pilot Sales and Marketing Analysis; Library. A collection ofsophisticated applications designed for the Sales and Marketingbusiness end user (includ-ing 80/20 Pareto analysis, time-basedranking, BCG quadrant analysis, trendline, and statisticalforecasting). The applications can be modified and tailored tomeet individual needs fGr particular customers.Pilot Discovery Server. A predictive data mining tool thatembeds directly into the relational database and does not requirethe user to copy or trans-form the data. The data mining resultsare stored with metadata into the data warehouse as a predictivesegmentation and are embedded into the multidimensionalmodel as a dimension. The discovery server contains a graphicaluser interface called Pilot Discovery Server Launch, which easesbuilding data mining models.Pilot Marketing Intelligence Library. Currently there are twoapplications for exposing the value of the data mining results.One allows the user to graphically view the predictive segmenta-tion and rules that describe the prediction; the other allows forprofi1lloss and return on investment analysis for the datamining results.Pilot Internet Publisher. A tool that easily allows users toaccess their Pilot multidimensional database via browsers on theInternet or intranets.Some of the distinguishing features of Pilot’s product offeringinclude the over-all complete solution from powerful OLAPengine and data mining engine to their customizable businessapplications. Within their OLAP offering, these are some of thekey features:Time intelligence. The Pilot Analysis Server has a number offeatures to support time as a special dimension. Among theseare the ability to process data on the fly to convert from thenative periodicity (e.g., the data was col-lected weekly) to theperiodicity preferred by the customer viewing the data (e.g., viewthe data monthly). This feature is accomplished via special opti-mized structures within the multidimensional database.

145
DA
TA W
AR
EH
OU
SIN
G A
ND
DA
TA M
ININ
GEmbedded data mining. The Pilot Analysis Server is the firstproduct to integrate predictive data mining (as it is described inthis book) with the multidimensional database model. Thisallows the user to benefit from not only the predictive power ofdata mining but also the descriptive and ana-lytical power ofmultidimensional navigation.Multidimensional database compression. In addition to thecompression of sparsity (the removal of cells in the multidi-mensional database which have no value), Pilot Analysis Serveralso has special code for compressing data values over time. Anew feature called a “dynamic dimension” allows somedimensions to be calculated on the fly when they are attributesof an exist-ing dimension. This allows the database to be muchsmaller and still provide fast access. Dynamic variables, which arealso calculated on the fly, are also available to further decrease thetotal size of the database and thus also decrease the time forconsolidation of the database.Relational Integration. Pilot allows for a seamless integrationof both MOLAP and ROLAP to provide the user with eitherthe speed of MOLAP or the more space-efficient ROLAP. Theusers interface with the system by defining the multidimen-sional model or view that they prefer, and the sys-temself-optimizes the queries into precalculated MOLAP storage ordirectly in the relation data store depending on the usage patternand the time/space tradeoff preferences of the end user.
OLAP Tools and the InternetThe two most pervasive themes in computing have been theInternet/WWW and data warehousing. From a marketingperspective, a marriage of these two giant technologies is anatural and unavoidable event. The reason for this trend issimple; the compelling advantages in using the Web for accessare _magnified even further in a data warehouse. Indeed:
The Internet is a virtually free resource, which provides auniversal connec-tivity within and between companies. The Webeases complex administrative tasks of managing distributedenvi-ronments.
The Web allows companies to store and manage both data andapplications on servers that can be centrally managed, main-tained, and updated, thus eliminating problems with softwareand data currency.For these and other reasons, the Web is a perfect medium fordecision support. Let’s look at the general features of the Web-enabled data access.The first-generation Web sites used a static distribution model,in which clients access static HTML pages via Web browsers. Inthis model, the deci-sion support reports were stored as HTMLdocuments and delivered to users on request. Clearly, thismodel has some serious deficiencies, including inability toprovide Web clients with interactive analytical capabilities such asdrill-down.The second-generation Web sites support interactive databasequeries by uti-lizing a multitiered architecture in which a Webclient submits a query in the form of HTML-encoded requestto a Web server, which in turn transforms the request forstructured data into a CGI (Common Gateway Interface) script,
or a script written to a proprietary Web-server API (Le.,Netscape Server API, or NSAPI). The gateway submits SQLqueries to the database, receives the results, translates them intoHTML, and sends the pages to the requester (see Fig. 32.5).Requests for the unstructured data (e.g., images, other HTMLdocuments, etc.) can be sent directly to the unstructured datastore.The emerging third-generation Web sites replace HTMLgateways with Web--based application servers. These servers candownload Java applets or ActiveX applications that execute onclients, or interact with corresponding applets running onservers-servlets. The third-generation Web servers pro-videusers with all the capabilities of existing decision-supportapplications without requiring them to load any client softwareexcept a Web browser.
Fig. 34.5
Not surprisingly, vendors of decision support applications,especially query, reporting, and OLAF tools, are rapidly convert-ing their tools to work on the Web. Vendor approaches fordeploying tools on the Web includeHTML publishing. This approach involves transforming anoutput of a query into the HTML page that can be downloadedinto a browser. This approach does not support interactiveaccess to data or reports.
Helper applications. In this approach, a tool is configured as ahelper appli-cation that resides within a browser. This is the caseof a “fat” client, in which, once the data is downloaded, userscan take advantage of all capabil-ities of the tool to analyze data.However, maintaining these helper applica-tions becomesanother task for system administrators.
Plug-ins. A variation on the previous approach, plug-ins arehelper appli-cations that are downloaded from the Web serverprior to their initial use. Since the plug-ins are downloadedfrom the server, their normal administra-tion and installationtasks are significantly reduced. However, typically plug-ins arebrowser-specific, and may not run on all platforms or with allbrowsers. Also, as browsers get updated, this plug-ins may haveto be upgraded as well, creating additional administrationworkload.Server-centric components. In this approach the vendorrebuilds a desktop tool as a server component, or creates a newserver component that can be integrated with the Web via aWeb gateway (e.g., CGI or NSAFI scripts).

146
DA
TA W
AR
EH
OU
SIN
G A
ND
DA
TA M
ININ
G
Java and ActiveX applications. This approach is for a vendorto redevelop all or portions of its tool in Java or ActiveX. Theresult is a true “thin” client model. There are advantages anddisadvantages to both, but this approach appears to be one ofthe most promising and flexible.The remainder of this section looks at several OLAF tools froma perspective of Internet/Web implementations.

147
DA
TA W
AR
EH
OU
SIN
G A
ND
DA
TA M
ININ
G
Exercise1. Write short notes on:
• Managed Query environment• MDDB
2. Explain the following:• ROLAP• MOLAP
3. Discuss the difference between Relational OLAP andMultidimensional OLAP.
4. Explain the basic architecture of OLAP with the help of adiagram.
5. What are the various OLAP tools available? Explain any oneof them.
Notes

9, Km Milestone, NH-65, Kaithal - 136027, HaryanaWebsite: www.niilmuniversity.in
“The lesson content has been compiled from various sources in public domain including but not limited to the internet for the convenience of the users. The university has no proprietary right on the same.”