data warehousing & data mining - mycsvtu...
TRANSCRIPT

DATA WAREHOUSING & DATA MINING
by:Prof. Asha Ambhaikar
1March 18, 2012 Prof. Asha Ambhaikar, RCET Bhilai.
UNIT-I
Overview and Concepts
2March 18, 2012 Prof. Asha Ambhaikar, RCET Bhilai.

Contents of Unit-I
Need for data warehousing, Basic elements of data warehousing, Trends in data warehousing. Planning
And Requirements: Project planning and management, Collecting the requirements. Architecture And
Infrastructure: Architectural components, Infrastructure and metadata
3March 18, 2012 Prof. Asha Ambhaikar, RCET Bhilai.

Text Books:
Prabhu,Data ware housing- concepts, Techniques, Products and Applications, Prentice hall of India
Soman K P, “Insight into Data Mining: Theory & Pratice” , Prentice hall of India
M.H. Dunham, “Data Mining Introductory and Advanced Topics”, Pearson Education.
4March 18, 2012 Prof. Asha Ambhaikar, RCET Bhilai.

Reference Books:
Paulraj Ponniah, “Data Warehousing Fundamentals”, John Wiley.
Arun K. Pujari, “Data mining Techniques”, Universities Press.
Ralph Kimball, “The Data Warehouse Lifecycle toolkit”, John Wiley.
IBM, “Introduction to Building The Data warehouse” PHI
5March 18, 2012 Prof. Asha Ambhaikar, RCET Bhilai.

6
What is Data Warehousing?
A process of transformingdata into informationand making it available to users in a timely enough manner to make a difference
Data
Information
Prof. Asha Ambhaikar, RCET Bhilai.
7
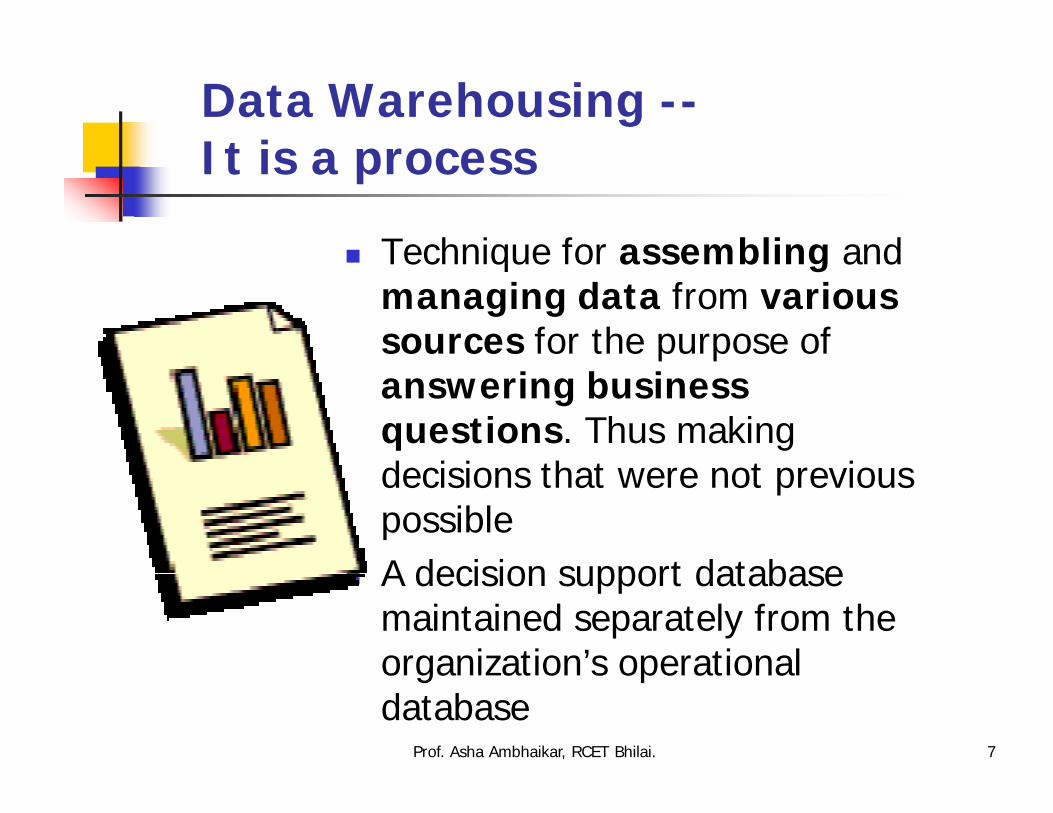
Data Warehousing --It is a process
Technique for assembling and managing data from various sources for the purpose of answering business questions. Thus making decisions that were not previous possible
A decision support database maintained separately from the organization’s operational database
Prof. Asha Ambhaikar, RCET Bhilai.

8
What is Data Warehouse?
“A data warehouse is a subject-oriented, integrated, time-variant, and nonvolatile collection of data in support of management’s decision-making process.”—W. H. Inmon
Data warehousing: The process of constructing and
using data warehousesMarch 18, 2012 Prof. Asha Ambhaikar, RCET Bhilai.

9
Data Warehouse—Subject-Oriented
Organized around major subjects, such as customer,
product, sales.
Focusing on the modeling and analysis of data for
decision makers, not on daily operations or transaction
processing.
Provide a simple and concise view around particular
subject issues by excluding data that are not useful in
the decision support process.
March 18, 2012 Prof. Asha Ambhaikar, RCET Bhilai.

10
Data Warehouse—Integrated
Constructed by integrating multiple, heterogeneous data sources relational databases, flat files, on-line transaction
records Data cleaning and data integration techniques
are applied. Ensure consistency in naming conventions, encoding
structures, attribute measures, etc. among different data sources E.g., Hotel price: currency, tax, breakfast covered, etc.
When data is moved to the warehouse, it is converted.
March 18, 2012 Prof. Asha Ambhaikar, RCET Bhilai.

11
Data Warehouse—Time Variant
The time horizon for the data warehouse is significantly longer than that of operational systems.
Operational database: current value data.
Data warehouse data: provide information from a historical perspective (e.g., past 5-10 years)
Every key structure in the data warehouse
Contains an element of time, explicitly or implicitly
But the key of operational data may or may not contain “time element”.
March 18, 2012 Prof. Asha Ambhaikar, RCET Bhilai.

12
Data Warehouse—Non-Volatile
A physically separate store of data transformed from
the operational environment.
Operational update of data does not occur in the
data warehouse environment.
Does not require transaction processing, recovery,
and concurrency control mechanisms
Requires only two operations in data accessing:
initial loading of data and access of data.
March 18, 2012 Prof. Asha Ambhaikar, RCET Bhilai.

13
Very Large Data Bases
Terabytes -- 10^12 bytes:
Petabytes -- 10^15 bytes:
Exabytes -- 10^18 bytes:
Zettabytes -- 10^21 bytes:
Zottabytes -- 10^24 bytes:
Walmart-- 24 Terabytes
Geographic Information Systems
National Medical Records
Weather images
Intelligence Agency Videos
March 18, 2012 Prof. Asha Ambhaikar, RCET Bhilai.

14
Data Warehousing Physical separation of operational and decision
support environments Purpose: to establish a data repository making
operational data accessible Transforms operational data to relational form Only data needed for decision support come from the
TPS Data are transformed and integrated into a
consistent structure Data warehousing (information warehousing): solves
the data access problem End users perform ad hoc query, reporting analysis
and visualizationMarch 18, 2012 Prof. Asha Ambhaikar, RCET Bhilai.

Evolution of Data Warehouse
15March 18, 2012 Prof. Asha Ambhaikar, RCET Bhilai.

16
Data Warehouse vs. Heterogeneous DBMS
Traditional heterogeneous DB integration: Build on top of heterogeneous databases
Query driven approach
When a query is posed to a client site, a meta-dictionary is used to translate the query into queries appropriate for individual heterogeneous sites involved, and the results are integrated into a global answer set
Complex information filtering, compete for resources
Data warehouse: update-driven, high performance Information from heterogeneous sources is integrated in
advance and stored in warehouses for direct query and analysis
March 18, 2012 Prof. Asha Ambhaikar, RCET Bhilai.

Benefits of Data warehouse
Better Information Better Strategies and plans Better tactics and decisions More efficient processed Time saving Reduction in paper reporting
17March 18, 2012 Prof. Asha Ambhaikar, RCET Bhilai.

18
Data Warehousing Benefits
Increase in knowledge worker productivity Supports all decision makers’ data requirements Provide ready access to critical data Insulates operation databases from ad hoc
processing Provides high-level summary information Provides drill down capabilities
Yields Improved business knowledge Competitive advantage Enhances customer service and satisfaction Facilitates decision making Help streamline business processes
March 18, 2012 Prof. Asha Ambhaikar, RCET Bhilai.

Benefits of DW
Executives, managers and staff are provided with improved access to data from many databases with in the organization.
Manager manage with the data they want rather than the data they get.
Less time spent gathering data from various systems and more time available to analyze and act.
Ability to quickly answer a series of questions, each of which depends upon the answer to the previous question. (in a sec or min)
19March 18, 2012 Prof. Asha Ambhaikar, RCET Bhilai.

20
Data Warehouse vs. Operational DBMS
OLTP (on-line transaction processing) Major task of traditional relational DBMS
Day-to-day operations: purchasing, inventory, banking, manufacturing, payroll, registration, accounting, etc.
OLAP (on-line analytical processing) Major task of data warehouse system
Data analysis and decision making
Distinct features (OLTP vs. OLAP): User and system orientation: customer vs. market
Data contents: current, detailed vs. historical, consolidated
Database design: ER + application vs. star + subject
View: current, local vs. evolutionary, integrated
Access patterns: update vs. read-only but complex queriesMarch 18, 2012 Prof. Asha Ambhaikar, RCET Bhilai.

21
OLTP vs. Data Warehouse
OLTP systems are tuned for known transactions and workloads while workload is not known a priori in a data warehouse
Special data organization, access methods and implementation methods are needed to support data warehouse queries (typically multidimensional queries)
March 18, 2012 Prof. Asha Ambhaikar, RCET Bhilai.

22
OLTP vs Data Warehouse
OLTP Application Oriented Used to run business Detailed data Current up to date Isolated Data Repetitive access Clerical User
Warehouse (DSS) Subject Oriented Used to analyze business Summarized and refined Snapshot data Integrated Data Ad-hoc access Knowledge User
(Manager)
March 18, 2012 Prof. Asha Ambhaikar, RCET Bhilai.

23
OLTP vs Data Warehouse
OLTP Performance Sensitive Few Records accessed at a
time (tens)
Read/Update Access
No data redundancy Database Size 100MB -
100 GB
Data Warehouse Performance relaxed Large volumes accessed at
a time(millions) Mostly Read (Batch
Update) Redundancy present Database Size 100
GB - few terabytes
March 18, 2012 Prof. Asha Ambhaikar, RCET Bhilai.

24
OLTP vs Data Warehouse
OLTP Transaction
throughput is the performance metric
Thousands of users Managed in
entirety(whole)
Data Warehouse Query throughput is
the performance metric
Hundreds of users Managed by subsets
March 18, 2012 Prof. Asha Ambhaikar, RCET Bhilai.

25
To summarize ...
OLTP Systems are used to “run” a business
The Data Warehouse helps to “optimize” the business
March 18, 2012 Prof. Asha Ambhaikar, RCET Bhilai.

26
OLTP vs. OLAP
OLTP OLAP users clerk, IT professional knowledge worker function day to day operations decision support DB design application-oriented subject-oriented data current, up-to-date
detailed, flat relational isolated
historical, summarized, multidimensional integrated, consolidated
usage repetitive ad-hoc access read/write
index/hash on prim. key lots of scans
unit of work short, simple transaction complex query # records accessed tens millions #users thousands hundreds DB size 100MB-GB 100GB-TB metric transaction throughput query throughput, response
March 18, 2012 Prof. Asha Ambhaikar, RCET Bhilai.
The Goals of a Data Warehouse
27March 18, 2012 Prof. Asha Ambhaikar, RCET Bhilai.
Goals of Data Warehouse
Makes an organization’s information accessible.
Makes the organization’s information consistent.
Is an adaptive and durable source of information
Is a secure support that protects the organization’s information asset.
Is the foundation for decision making
28March 18, 2012 Prof. Asha Ambhaikar, RCET Bhilai.
Needs for Data Warehousing
29March 18, 2012 Prof. Asha Ambhaikar, RCET Bhilai.

30
Why We need Separate Data Warehouse?
missing data: Decision support requireshistorical data which operational DBs do nottypically maintain
data consolidation: Decision Support requiresconsolidation (aggregation, summarization) ofdata from heterogeneous sources
data quality: different sources typically useinconsistent data representations, codes andformats which have to be reconciled
March 18, 2012 Prof. Asha Ambhaikar, RCET Bhilai.

Trends in Data Warehouse
31March 18, 2012 Prof. Asha Ambhaikar, RCET Bhilai.

Three Complementary Trends
Data Warehousing_ Consolidate data from many sources in one large repository.– Loading, periodic synchronization of replicas.– Semantic integration. OLAP:– Complex SQL queries and views.– Queries based on spreadsheet-style operations and
multidimensional” view of data. – Interactive and “online” queries. Data Mining_ Exploratory search for interesting
trends and anomalies.
32March 18, 2012 Prof. Asha Ambhaikar, RCET Bhilai.

Architecture and Infrastructure
33March 18, 2012 Prof. Asha Ambhaikar, RCET Bhilai.

34
Design of a Data Warehouse: A Business Analysis Framework
Four views regarding the design of a data warehouse
Top-down view allows selection of the relevant information necessary for the
data warehouse
Data source view exposes the information being captured, stored, and
managed by operational systems
Data warehouse view consists of fact tables and dimension tables
Business query view sees the perspectives of data in the warehouse from the view
of end-userMarch 18, 2012 Prof. Asha Ambhaikar, RCET Bhilai.

Basic Elements of Data Warehouse
35March 18, 2012 Prof. Asha Ambhaikar, RCET Bhilai.

Basic Elements of a Data Warehouse
Source System Staging Area Presentation Area End User Data Access Tools Metadata
36March 18, 2012 Prof. Asha Ambhaikar, RCET Bhilai.

Basic Elements of Data Warehouse
RelationalDatabases
LegacyData
Purchased Data
Data Warehouse Engine
Optimized LoaderExtractionTransformCleansing
AnalyzeQuery
Reporting &Data Mining
Tools
Metadata Repository37March 18, 2012 Prof. Asha Ambhaikar, RCET Bhilai.

38
Data Warehouse ArchitectureData Warehouse Architecture
DataWarehouse
ExtractTransformLoadRefresh
Middle Layer
OLAP Engine
Analysis toolsQuery &Reporting toolsandData mining
tools
Monitor&
IntegratorMetadata
Data SourcesTop Layer
Front-End Tools
Serve
Data Marts
Bottom Layer
OperationalDBs
othersources
Data Storage
OLAP Server
March 18, 2012 Prof. Asha Ambhaikar, RCET Bhilai.

39
Working of Data Warehouse
Bottom Layer:
The bottom layer is a DW database servers that is almost always a relational database system
Data from operational databases and external sources are extracted using application program interfaces known as gateways
It is supported by primary system
March 18, 2012 Prof. Asha Ambhaikar, RCET Bhilai.
40
cont….
It has repository that is metadata (data about data)
Which is responsible for extracting the information from DW according to the queries given by the end users
Metadata is the bridge between DW and the DSS It provides logical linkage between data and
application Metadata can pinpoint access to information across
the entire DW.
March 18, 2012 Prof. Asha Ambhaikar, RCET Bhilai.

41
Middle Layer:
The middle layer consists of OLAP server OLAP means On Line Analytical
Processing It is used to perform analysis on data
and transform it in to useful information for decision making
OLAP is a continuously iterative process
OLAP servers are implemented by either ROLAP,MOLAP or HOLAP
March 18, 2012 Prof. Asha Ambhaikar, RCET Bhilai.

42
Cont..
TOP Layer:
The top layer is a client That is the end user It consists of
1.query and reporting tools
2.Analysis tools and
3. Data Mining Tools
It acts as an interface between the userand the server
March 18, 2012 Prof. Asha Ambhaikar, RCET Bhilai.
43
Cont..
This layer takes queries from the users
And then send it to the servers
Receiving information records back and
Gives them as output to the end users.
Eg. Analysis of weather forecasting, predictions and so on.
March 18, 2012 Prof. Asha Ambhaikar, RCET Bhilai.
Principles of Dimensional Modeling
44March 18, 2012 Prof. Asha Ambhaikar, RCET Bhilai.

Multidimensional Data Model
Collection of numeric measures, which depend on a set of dimensions.
– E.g., measure Sales, dimensionsProduct (key: pid), Location (locid)and Time (timeid).
45March 18, 2012 Prof. Asha Ambhaikar, RCET Bhilai.
46
Multidimensional Data Models
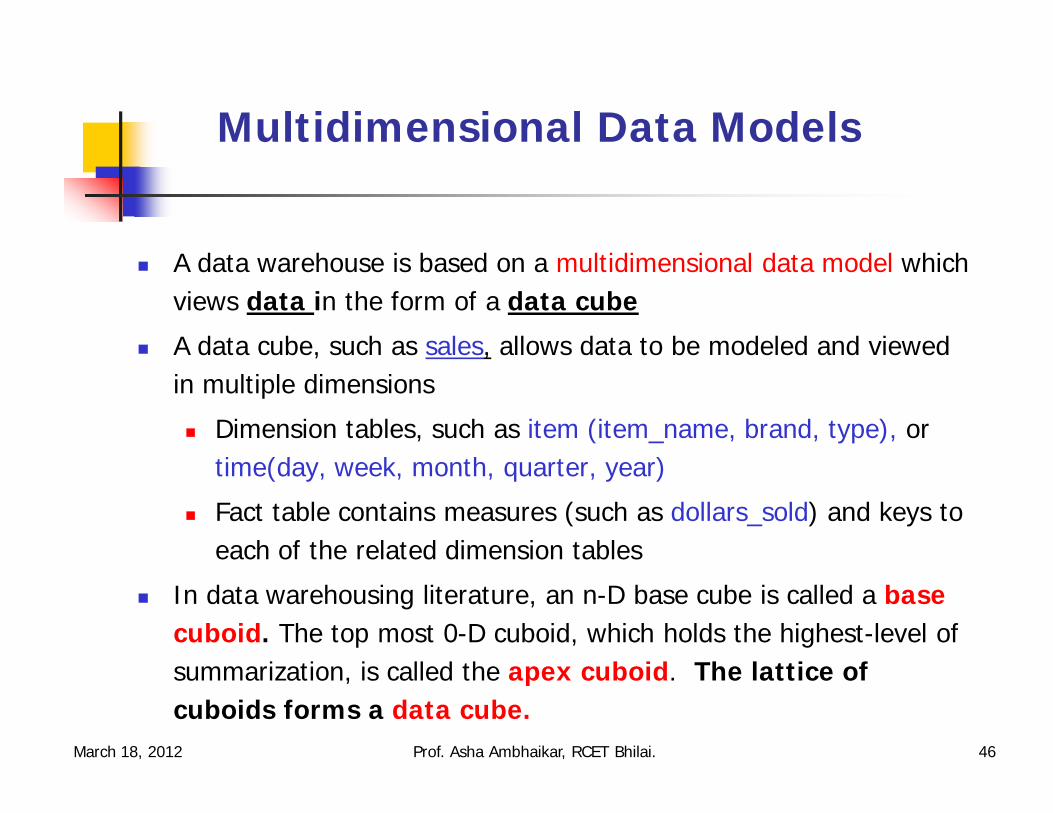
A data warehouse is based on a multidimensional data model which views data in the form of a data cube
A data cube, such as sales, allows data to be modeled and viewed in multiple dimensions
Dimension tables, such as item (item_name, brand, type), ortime(day, week, month, quarter, year)
Fact table contains measures (such as dollars_sold) and keys to each of the related dimension tables
In data warehousing literature, an n-D base cube is called a base cuboid. The top most 0-D cuboid, which holds the highest-level of summarization, is called the apex cuboid. The lattice of cuboids forms a data cube.
March 18, 2012 Prof. Asha Ambhaikar, RCET Bhilai.

47
Cuboids Corresponding to the Cube
all
product date country
product,date product,country date, country
product, date, country
0-D(apex) cuboid
1-D cuboids
2-D cuboids
3-D(base) cuboid
March 18, 2012 Prof. Asha Ambhaikar, RCET Bhilai.

48
Multidimensionality
3-D + Spreadsheets (OLAP has this) Data can be organized the way managers like to see
them, rather than the way that the system analysts do Different presentations of the same data can be
arranged easily and quickly
Dimensions: products, salespeople, market segments, business units, geographical locations, distribution channels, country, or industry
Measures: money, sales volume, head count, inventory profit, actual versus forecast
Time: daily, weekly, monthly, quarterly, or yearly
March 18, 2012 Prof. Asha Ambhaikar, RCET Bhilai.

49
Multidimensional Data
Sales volume as a function of product, month, and region
Prod
uct
Month
Dimensions: Product, Location, TimeHierarchical summarization paths
Industry Region Year
Category Country Quarter
Product City Month Week
Office Day
March 18, 2012 Prof. Asha Ambhaikar, RCET Bhilai.

50
A Sample Data CubeTotal annual salesof TV in U.S.A.Date
Cou
ntrysum
sumTV
VCRPC
1Qtr 2Qtr 3Qtr 4QtrU.S.A
Canada
Mexico
sum
March 18, 2012 Prof. Asha Ambhaikar, RCET Bhilai.

51
Browsing a Data Cube
Visualization OLAP capabilities Interactive manipulation
March 18, 2012 Prof. Asha Ambhaikar, RCET Bhilai.

OLAP Operations
OLAP means On Line Analytical Processing. It is used to perform analysis on data and
transform it into information for decision making purpose.
OLAP is a continuous iterative process. A common operation is to aggregate a measure
over one or more dimensions.– Find total sales.– Find total sales for each city, or for each state.– Find top five products ranked by total sales.
52March 18, 2012 Prof. Asha Ambhaikar, RCET Bhilai.
53
Typical OLAP Operations
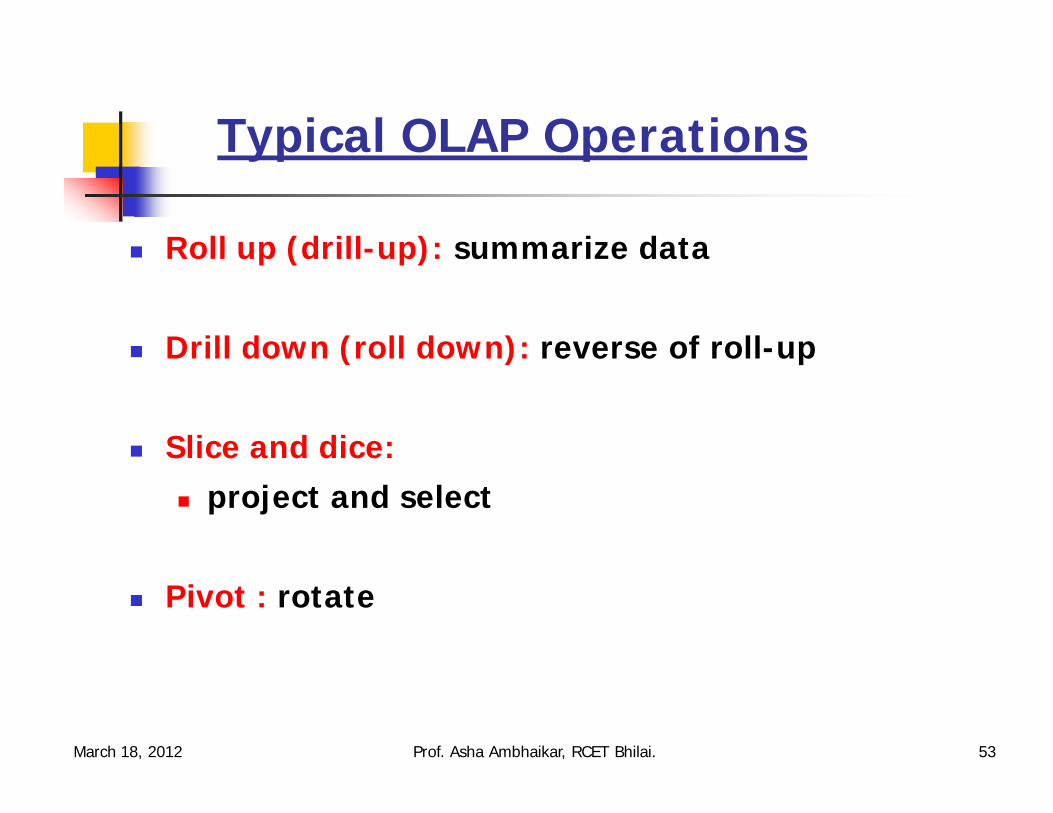
Roll up (drill-up): summarize data
Drill down (roll down): reverse of roll-up
Slice and dice: project and select
Pivot : rotate
March 18, 2012 Prof. Asha Ambhaikar, RCET Bhilai.

54
Roll-up and Drill Down
Sales Channel Region Country State Location Address Sales Representative
Higher Level ofAggregation
Low-levelDetails
Prof. Asha Ambhaikar, RCET Bhilai.

55
Slicing and Dicing
Product
Sales ChannelRetail Direct Special
Household
Telecomm
Video
Audio IndiaFar East
Europe
The Telecomm Slice
March 18, 2012 Prof. Asha Ambhaikar, RCET Bhilai.

56
A Visual Operation: Pivot (Rotate)
1010
4747
30301212
JuiceJuiceColaColaMilk Milk CreaCreamm
3/1 3/2 3/3 3/43/1 3/2 3/3 3/4DateDate
ProductProduct
March 18, 2012 Prof. Asha Ambhaikar, RCET Bhilai.

57
Typical OLAP Operations
Roll up (drill-up): summarize data
by climbing up hierarchy or by dimension reduction
This operation performs aggregation on the data cube,either by climbing up a concept of hierarchy for a dimension or by dimension reduction.
When roll up is performed by dimension reduction, one or more dimensions are removed from the given cube.
Drill down (roll down): reverse of roll-up
from higher level summary to lower level summary or detailed data, or introducing new dimensions
It navigates from less detailed data to more detailed data.
This can be realized by either stepping down a concept hierarchy for a dimension or introducing additional dimensions.
March 18, 2012 Prof. Asha Ambhaikar, RCET Bhilai.
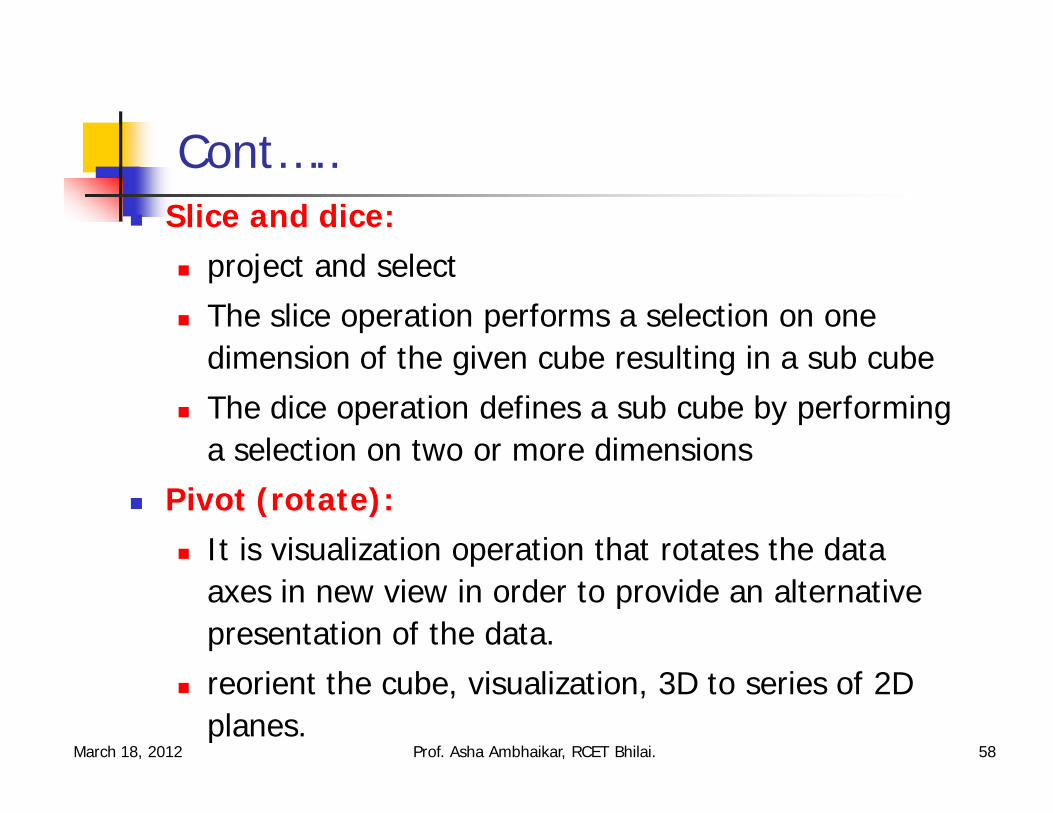
Cont….. Slice and dice:
project and select
The slice operation performs a selection on one dimension of the given cube resulting in a sub cube
The dice operation defines a sub cube by performing a selection on two or more dimensions
Pivot (rotate): It is visualization operation that rotates the data
axes in new view in order to provide an alternative presentation of the data.
reorient the cube, visualization, 3D to series of 2D planes.
58March 18, 2012 Prof. Asha Ambhaikar, RCET Bhilai.

Cont…..
Other operations
drill across: Executes queries involving (across) more than one fact table
drill through: Operation uses relational SQL facilities to drill through the bottom level of the data cube to its back-end relational tables
59March 18, 2012 Prof. Asha Ambhaikar, RCET Bhilai.

Physical Design Process
60March 18, 2012 Prof. Asha Ambhaikar, RCET Bhilai.

61
Stars, Snowflakes & fact Constellations:
Multidimensional model can exit in the form of a star schema, a Snowflake schema or a fact Constellation Schema
Star schema: In star schema a data warehouse contains:
A large central table (fact table) containing the bulk of the data with no redundancy
a set of dimension tables one for each dimensions
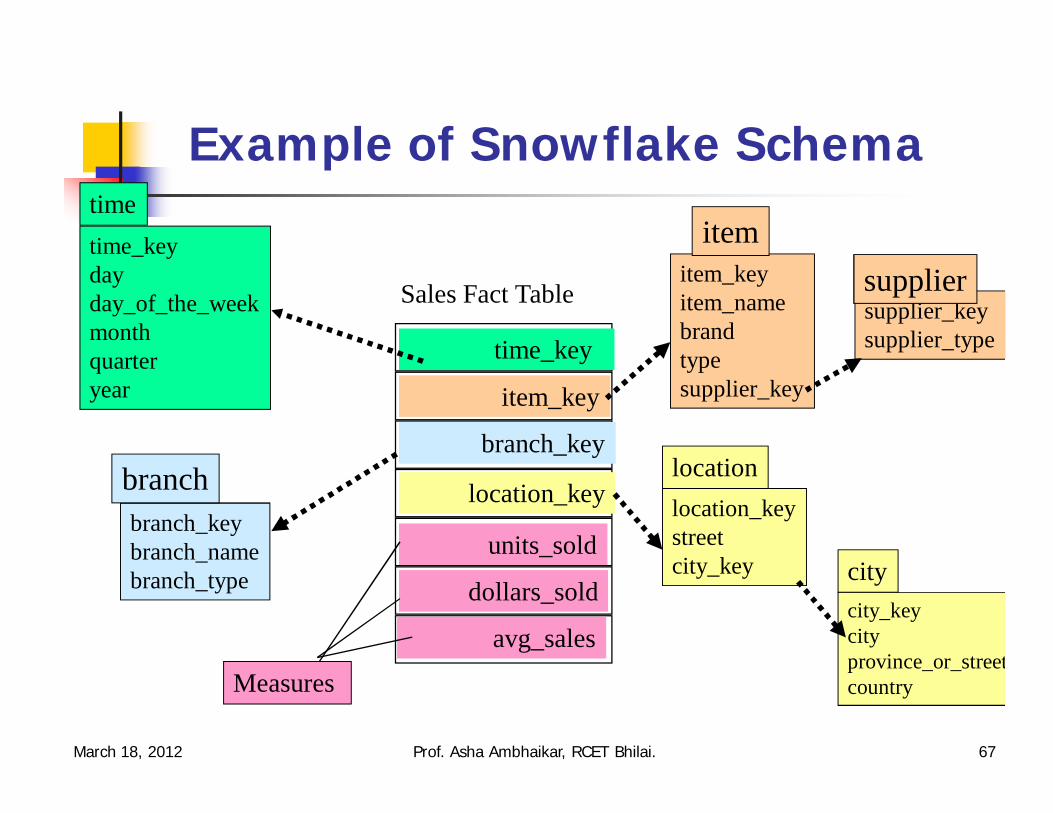
Snowflake schema: A snowflake schema is a refinement of the star schema, where some dimension tables are normalized by splitting the data into additional tables.
March 18, 2012 Prof. Asha Ambhaikar, RCET Bhilai.

Cont….
The difference between the snowflake and star schema model is that the dimension tables of the snowflake model can be kept in a normalized form to reduce redundancy.
Fact constellations: Multiple fact tables share dimension tables, viewed as a collection of stars, therefore
called galaxy schema or fact constellation
62March 18, 2012 Prof. Asha Ambhaikar, RCET Bhilai.

63
Fact Table
Central table mostly raw numeric items narrow rows, a few columns at most large number of rows (millions to a billion) Access via dimensions
March 18, 2012 Prof. Asha Ambhaikar, RCET Bhilai.

64
Star Schema
A single fact table and for each dimension one dimension table
Does not capture hierarchies directly
Time
prod
cust
city
fact
date, custno, prodno, cityname, ...
March 18, 2012 Prof. Asha Ambhaikar, RCET Bhilai.

65
Snowflake schema
Represent dimensional hierarchy directly by normalizing tables.
Easy to maintain and saves storage
fact
date, custno, prodno, cityname, ...
T i m e
C u s t
P r o d
c i t y Region
March 18, 2012 Prof. Asha Ambhaikar, RCET Bhilai.

66
Example of Star Schema
time_keydayday_of_the_weekmonthquarteryear
time
location_keystreetcityprovince_or_streetcountry
location
Sales Fact Table
time_key
item_key
branch_key
location_key
units_sold
dollars_sold
avg_salesMeasures
item_keyitem_namebrandtypesupplier_type
item
branch_keybranch_namebranch_type
branch
March 18, 2012 Prof. Asha Ambhaikar, RCET Bhilai.
67
Example of Snowflake Schema
time_keydayday_of_the_weekmonthquarteryear
time
location_keystreetcity_key
location
Sales Fact Table
time_key
item_key
branch_key
location_key
units_sold
dollars_sold
avg_sales
Measures
item_keyitem_namebrandtypesupplier_key
item
branch_keybranch_namebranch_type
branch
supplier_keysupplier_type
supplier
city_keycityprovince_or_streetcountry
city
March 18, 2012 Prof. Asha Ambhaikar, RCET Bhilai.

68
Example of Fact constellation
time_keydayday_of_the_weekmonthquarteryear
time
location_keystreetcityprovince_or_streetcountry
location
Sales Fact Table
time_key
item_key
branch_key
location_key
units_sold
dollars_sold
avg_salesMeasures
item_keyitem_namebrandtypesupplier_type
item
branch_keybranch_namebranch_type
branch
Shipping Fact Table
time_key
item_key
shipper_key
from_location
to_location
dollars_cost
units_shipped
shipper_keyshipper_namelocation_keyshipper_type
shipper
March 18, 2012 Prof. Asha Ambhaikar, RCET Bhilai.

69
A Concept Hierarchy: Dimension (location)
all
Europe North_America
MexicoCanadaSpainGermany
Vancouver
M. WindL. Chan
...
......
... ...
...
all
region
office
country
TorontoFrankfurtcity
March 18, 2012 Prof. Asha Ambhaikar, RCET Bhilai.

70
OLAP Is FASMI
Fast Analysis to Share Multidimensional Information
March 18, 2012 Prof. Asha Ambhaikar, RCET Bhilai.

Types of OLAP Servers
ROLAP SERVERS: Relational On Line Analytical Processing are
intermediate servers which lies between a relational back end server and client front end tools.
They uses a relational DBMS to storage and manage data
ROLAP servers support multidimensional views of data
71March 18, 2012 Prof. Asha Ambhaikar, RCET Bhilai.

72
Cont…
Multidimensional OLAP (MOLAP) Servers These servers support multidimensional views of data Array-based multidimensional storage engine fast indexing to pre-computed summarized data
Hybrid OLAP (HOLAP) HOLAP is a combination of ROLAP and MOLAP It for User flexibility, e.g., low level: relational, high-
level: array Specialized SQL servers
specialized support for SQL queries over star/snowflake schemas
March 18, 2012 Prof. Asha Ambhaikar, RCET Bhilai.

73
From the Data Warehouse to Data Marts
DepartmentallyStructured
IndividuallyStructured
Data WarehouseOrganizationallyStructured
Less
More
HistoryNormalizedDetailed
Data
Information
March 18, 2012 Prof. Asha Ambhaikar, RCET Bhilai.

74
Data Warehouse and Data Marts
Data Warehouse
Data MartOLAPData MartLightly summarizedDepartmentally structured
Organizationally structuredAtomicDetailed Data Warehouse Data
March 18, 2012 Prof. Asha Ambhaikar, RCET Bhilai.

75
Characteristics of the Departmental Data Mart
Data Warehouse
Data Mart Data Marts are the subset of
DW. Data marts has OLAP It is smaller than data
warehouse It contains information from a
single department of a business or organization
It is Flexible Customized by Department Source is departmentally
structured data warehouseProf. Asha Ambhaikar, RCET Bhilai.

76
True Warehouse
Data Marts
Data Sources
Data Warehouse
March 18, 2012 Prof. Asha Ambhaikar, RCET Bhilai.

77
Data Warehouse Back-End Tools and Utilities (ETL Tool)
Data extraction: get data from multiple, heterogeneous, and external
sources Data cleaning:
detect errors in the data and rectify them when possible
Data transformation: convert data from legacy or host format to warehouse
format Load:
sort, summarize, consolidate, compute views, check integrity, and build indices and partitions
Refresh propagate the updates from the data sources to the
warehouse
March 18, 2012 Prof. Asha Ambhaikar, RCET Bhilai.

Components of Data Warehouse
78
Operational Data source
OperationalData Source
OperationalData Source
OperationalData Source
Archive/backup data
LightlySummarizeddata
Detailed data
LightlySummarized Data
Meta Data
Operational Data Store(OSD)
Data Mining End-UsersTool
OLAP tool
Reporting, query,EIS
March 18, 2012 Prof. Asha Ambhaikar, RCET Bhilai.

79
Data Warehouse Components
Operational Data Sources Operational Data Store (ODS ) Load Manager Warehouse Manager Query Manager
March 18, 2012 Prof. Asha Ambhaikar, RCET Bhilai.
1.Operational Data Sources
Operational Data sources for the DW is supplies from mainframe.
Operational data held is first generation, hierarchical and network database.
departmental data, private data from workstations, servers and external system such as internet.
commercially available DB or DB associated with the organizations, suppliers or customers.
80March 18, 2012 Prof. Asha Ambhaikar, RCET Bhilai.
2. Operational Data Stores (ODS)
Operational Data Store is a repository of current and integrated operational data used for analysis.
It is often structured and supplied with data in the same way as the data warehouse.
But in fact it simply act as a staging area for data to be moved in to warehouse.
81March 18, 2012 Prof. Asha Ambhaikar, RCET Bhilai.

3. Load Manager
Load Manager is called the backend component It performs all the operations associated with
the extraction and loading of the data in to the warehouse.
These operation includes simple transformation of the data to prepare the data for entry in to warehouse.
82March 18, 2012 Prof. Asha Ambhaikar, RCET Bhilai.

4. Warehouse Manager
Warehouse Manager performs all the operations associated with the management of the data in the warehouse.
The operation performed by the component includes Analysis of the data to ensure consistency Transformation and merging of source data Creation of indexes and views Archiving and backing-up of data
83March 18, 2012 Prof. Asha Ambhaikar, RCET Bhilai.

5. Query Manager
Query Manager is also called front end tool It performs all the operation associated with
the management of user queries. The operation performed by this component
includes… directing queries to the appropriate tables
and scheduling the execution of queries. Detailed, lightly and highly summarized data,
archive/backup data.
84March 18, 2012 Prof. Asha Ambhaikar, RCET Bhilai.
Cont…
Metadata End-user access tools:
It can be categories in to five main groups1. Data reporting and query tools2. Application development tools3. Executive information System(EIS) tools4. Online Analytical Processing(OLAP) tools &5. Data Mining Tools
85March 18, 2012 Prof. Asha Ambhaikar, RCET Bhilai.
Data Flow
Inflow: It is the process associated with the extraction, cleaning and loading of the data from the source systems in to the warehouse.
Up flow: The process associated with adding value to the data in the warehouse through summarizing, packaging and backing up of data in the warehouse.
86March 18, 2012 Prof. Asha Ambhaikar, RCET Bhilai.

Cont…
Down Flow: The process associated with archiving and backing up of data in the warehouse.
Out Flow: The process associated with making the data available to the end-users.
Meta Flow: The process associated with the management of the metadata.
87March 18, 2012 Prof. Asha Ambhaikar, RCET Bhilai.
Detailed Data
It stores all the detailed data in the database schema.
In most cases, the detailed data is not stored online but aggregated to the next level of detail.
On regular basis, detailed data is added to the warehouse to supplement the aggregated data.
88March 18, 2012 Prof. Asha Ambhaikar, RCET Bhilai.

Lightly and Highly Summarized Data It stores all the pre defined lightly and highly
aggregated data generated by the warehouse manager. Transient as it will be subject to change on a ongoing
basis in order to respond to changing query profiles.
The purpose of summary information is to…. Speed up the performance of queries. Removes the requirement to continuously perform
summary operations such as sort or group by in answering user queries.
The summary data is updated continuously as new data is loaded in to warehouse.
89March 18, 2012 Prof. Asha Ambhaikar, RCET Bhilai.

Archive/Backup Data
It stores detailed and summarized data for the purpose of archiving and backup. May be necessary to backup online summary of
data, if this data is kept beyond the retention period for detailed data. The data is transferred to storage archives such
as magnetic tape or optical disk.
90March 18, 2012 Prof. Asha Ambhaikar, RCET Bhilai.
Meta data The area of the warehouse stores all the metadata(data
about data) definitions used by all the processes in the warehouse.
It is used for variety of purposes…. Extraction and loading process: Meta data is
used to map data sources to common view of information with in the warehouse.
Warehouse management process: Meta data is used to automate the production of summary tables.
Query management process: Meta data is used to direct a query to the most appropriate data source.
91March 18, 2012 Prof. Asha Ambhaikar, RCET Bhilai.
End User Access Tools
High performance is achieved by pre-planning the requirements for joins, summarizations and periodic reports by end-users.
There are five main groups of access tools…. Data reporting and query tools Application development tool Executive Information System Tools On line Analytical System(OLAP) Tools Data Mining Tools.
92March 18, 2012 Prof. Asha Ambhaikar, RCET Bhilai.

Tools used for Data Warehouse
Most popular tools of DW are Informatica Tool Cognos Tool Business Intelligence Tool
EIS DSS OLAP Multidimensional Analysis Tool
93March 18, 2012 Prof. Asha Ambhaikar, RCET Bhilai.

Client/Server Architecture
94March 18, 2012 Prof. Asha Ambhaikar, RCET Bhilai.

Most of the Application Programs have Three Major Layers
1. Presentation Layer2. Application or Business logic Layer3. Services layer Presentation Layer: The topmost layer is the Presentation
Layer. It provides human/machine interaction( the
user interface) It handles input from the keyboard, mouse
or other device and Output from screen display. 95March 18, 2012 Prof. Asha Ambhaikar, RCET Bhilai.

Application or Business Logic Layer
The middle layer is the Application or business logic layer.
Application logic makes the difference between an order entry system and an inventory control system.
It is often called business logic layer because it contains the business rules that drive a given enterprise.
96March 18, 2012 Prof. Asha Ambhaikar, RCET Bhilai.

Services layer
The bottom layer is the Services Layer. This layer provides the generalized services
needed by the other layers. Such as file services, print services,
communication services and most important database services.
97March 18, 2012 Prof. Asha Ambhaikar, RCET Bhilai.

Architecture Models
As a result of the limitations of file sharing architecture, the client/server architecture emerged as One-tire Two tier Three tier and n- tier
98March 18, 2012 Prof. Asha Ambhaikar, RCET Bhilai.

Cont…
Architecture Model of data warehouse consist of three programming layers
1. Presentation layer2. Business logic layer &3. Services layer(such as databases) The number of tiers in a client/server
application is determined by how tightly or loosely the three program layers are integrated.
99March 18, 2012 Prof. Asha Ambhaikar, RCET Bhilai.

One Tier Architecture
A One Tier application is one in which three program layers are tightly connected.
In One tier application the presentation layer, business logic and services are tightly integrated with in the single program.
In this, the presentation layer has intimate and detailed knowledge of the database structure.
The application layer is often interwoven with both the presentation and services layer
All three layers, including the database engine, almost always run on the same computer.
100March 18, 2012 Prof. Asha Ambhaikar, RCET Bhilai.

Fig.1 In one tier application the presentation layer, business logicand services are tightly integrated with in a single program
One Tier Data warehouse
101
Application orBusiness Logic Layer
P Presentation Layer
Services Layer
March 18, 2012 Prof. Asha Ambhaikar, RCET Bhilai.

Cont…
The most tools provides database engines that can handle one-tier designs such as Jet engines used with Access and VB.
102March 18, 2012 Prof. Asha Ambhaikar, RCET Bhilai.

Fig.1 In two tier application when services detached from applicationor business logic , so that they can run independently
Two Tier Architecture
103
Business Logic
P Presentation Layer
Services
March 18, 2012 Prof. Asha Ambhaikar, RCET Bhilai.

Two Tier Architecture
When services are detached from an application or business logic layer, then the application becomes two tier.
That means database services are separated from the application in two tier design.
In this the presentation and business logic layer remains as it is i.e. combined and both continue to have intimate knowledge of database.
104March 18, 2012 Prof. Asha Ambhaikar, RCET Bhilai.

Cont…
The two tier design allocates the user system interface exclusively to the client.
It places database management on the server and splits the processing management between client and server creating two layers.
Two-tier application requires separate database products such as Oracle, IB2, Sybase or Microsoft SQL Servers.
105March 18, 2012 Prof. Asha Ambhaikar, RCET Bhilai.

Cont…
In two-tier client/server architecture ,the user system interface is located in the users desktop environment and the database management services are usually in server that is most powerful m/c that services many clients.
106March 18, 2012 Prof. Asha Ambhaikar, RCET Bhilai.

Benefits
The two tier architecture improves flexibility and scalability by allocating the two tier over the computer network.
Two tier improves usability because it makes it easier to provide a customized user system interface.
The two tier client server architecture is a good solution for distributed computing when work groups are dozens to 100 people interfacing on a LAN simulteneously.
107March 18, 2012 Prof. Asha Ambhaikar, RCET Bhilai.

Limitations
When the number of users exceeds 100, performance begins to deteriorate.
There is limited flexibility in moving (repartitioning) program functionality from one server to another
108March 18, 2012 Prof. Asha Ambhaikar, RCET Bhilai.

Fig.1 In three tier application when business logic layer becomesindependent of the presentation layer and services
Three Tier Architecture
109
Business Logic
P Presentation Layer
Services
March 18, 2012 Prof. Asha Ambhaikar, RCET Bhilai.

Cont…
The three-tier software architecture introduced in 1990s to overcome the limitations of the two tier architecture.
The third tier (middle tier server) is between the user interface (client) and the data management (server) components.
In three-tier designs, the business logic itself becomes a service.
And that service can also be run on its own computer and is called as application server.
110March 18, 2012 Prof. Asha Ambhaikar, RCET Bhilai.
Cont…
There are variety of ways for implementing this middle tier, such as transaction processing monitors, message server or application server.
This middle tier can perform Queuing Application execution and Database staging
In three-tier presentation layer usually does not have intimate knowledge of the database .
Hence presentation layer communicates with its application server using a predefined message strategy.
111March 18, 2012 Prof. Asha Ambhaikar, RCET Bhilai.

Cont… The three tier architecture is introduced to
improve performance for groups with a large number of users (in the thousands) and improves flexibility as compared to two-tier.
The three tier architecture is used when an effective distributed client/server designis needed that provides increased performance, flexibility, maintainability, reusability and scalability while hiding the complexity of distributed processing from user.
These characteristics have made three-tier architectures a popular choice for Internet application.
112March 18, 2012 Prof. Asha Ambhaikar, RCET Bhilai.

113
Data Warehouse Usage
Three kinds of data warehouse applications
Information processing supports querying, basic statistical analysis, and
reporting using crosstabs, tables, charts and graphs Analytical processing
multidimensional analysis of data warehouse data supports basic OLAP operations, slice-dice, drilling, pivoting
Data mining knowledge discovery from hidden patterns supports associations, constructing analytical models,
performing classification and prediction, and presenting the mining results using visualization tools.
March 18, 2012 Prof. Asha Ambhaikar, RCET Bhilai.

114
Summary
Data warehouse A subject-oriented, integrated, time-variant, and nonvolatile
collection of data in support of management’s decision-making process
A multi-dimensional model of a data warehouse Star schema, snowflake schema, fact constellations
A data cube consists of dimensions & measures
OLAP operations: drilling, rolling, slicing, dicing and pivoting OLAP servers: ROLAP, MOLAP, HOLAP
March 18, 2012 Prof. Asha Ambhaikar, RCET Bhilai.

Important Questions on DW What is Data Warehouse? Explain in detail. Draw and explain the Data Warehouse
Architecture. Explain Data warehouse component with
suitable diagram. What is OLAP? Explain OLAP operations along
with its types. Explain Star Schema and snowflake Schema. What is multidimensional data model? Explain
with neat diagram. Compare the OLTP and OLAP.
115March 18, 2012 Prof. Asha Ambhaikar, RCET Bhilai.