databrief - essential hospitals
TRANSCRIPT

national association of public hospitals and health systems JUNE 2011 1
1301 Pennsylvania Avenue, NW, Suite 950 Washington, DC 20004202 585 0100 tel / 202 585 0101 fax
www.naph.org
Larry S. Gage president
Bruce Siegel, MD, MPH chief executive officer
Transforming American Health Care
JUNE 2011
DataBrief
Prioritizing Readmissions
■ Survey data indicated that executive leaders in 86% of the responding NAPH member hospitals have made reducing readmissions a priority as of October 2010. At that time, 73% of those same members had established readmissions as a priority within the past 18 months (chart 1).
■ When asked who the hospital’s executive leadership designated with primary responsibility for reducing readmissions, most respondents indicated that multiple groups of people were tasked with this responsibility. However, the quality/performance improvement department was named most frequently (chart 2).
■ 78% of responding hospitals have established interdisciplinary teams to target reducing readmissions. The quality/performance improvement department, case managers, and physicians were most likely to be part of those teams (chart 3).
In late 2010, NAPH administered an online survey to quality directors (or their designee) at 101 NAPH member organizations to gather information about their ongoing activities to reduce readmissions. Respondents from 51 safety net facilities completed the survey, a group that is representative of all NAPH members on characteristics like bed size, geographic location, margin, and performance on publicly-reported readmission rates. However, compared to the average NAPH member the respondents are more likely to be academic medical centers and have slightly more inpatient discharges for patients covered by commercial insurance. The survey asked quality directors to describe how they are focusing their efforts to reduce readmissions, barriers to doing so, and strategies for success. The survey’s findings presented in this data brief reflect safety net hospital commitment and allocation of scarce resources toward addressing readmissions for complex patient populations.
NAPH Members Focus on Reducing Readmissions
VISION STATEMENT
NAPH will be the nation’s leading voice for safety net hospitals and health systems and the patients and communities they serve. NAPH’s efforts will directly and substantially contribute to the ability of its members to meet the needs of the present and the challenges of the future, and to provide access for all to high-quality health care. To support the continued transformation of safety net systems into industry leaders in access and quality of care, NAPH publishes data briefs with key facts and information describing member achievements and progress.

JUNE 2011 2national association of public hospitals and health systems
“OTHER” RESPONSES
� Nursing support staff
� Chief utilization officer
� Transition care team
� Chief of utilization management
� Chair of internal medicine and core measures multidisciplinary team
� Pharmacy, medical staff, and nursing
� Risk-assessment committee
� Chairmen of medicine, pediatrics, psychiatry, surgery, and obstetrics
� Social worker manager
� Director of case management and steering team
■ 59% have established goals for reducing readmissions. Of the members that have established goals, the majority benchmark
themselves against a national average or state average rate, while 67% of them have specific internal goals (chart 4).
Executive leaders in 86% of the 51 NAPH member hospitals that answered the survey have made reducing readmissions a priority.
CHART 1
How long ago did executive leadership prioritize reducing readmissions? (as of October 2010)
0% 20% 40% 60% 80% 100%
0-6 Months
7-12 Months
13-18 Months
19-24 Months
25-32 Months
33+ Months
25%
23%
25%
16%
2%
9%
CHART 2
Who did executive leadership appoint with primary responsibility for reducing readmissions?
0% 20% 40% 60% 80% 100%
Executive TeamMember
Quality/PerformanceImprovement Department
Chief Medical Officer/Medical Director
Case Managers
Chief Quality Officer
Chief NursingOfficer/Director
Other
43%
34%
32%
30%
25%
18%
23%

JUNE 2011 3national association of public hospitals and health systems
CHART 3
Who is part of your interdisciplinary team working to reduce readmissions?
Executive TeamMember
Case Managers
Physicians
NPs, PAs, or RNs
Quality/PerformanceImprovement Department
Chief Medical Officer
Chief NursingOfficer/Director
Chief Quality Officer
Pharmacists
Patients/Families
Social Workers
Other
0% 20% 40% 60% 80% 100%
90%
80%
80%
63%
59%
56%
51%
39%
37%
24%
10%
32%
EXAMPLES OF SPECIFIC GOALS
� To be among the top 10% of hospitals in the nation
� Reduce heart failure readmissions by 50%
� Reduce 30-day readmissions by 30% and 90- and 180-day readmissions by 13%
� Within 18 months, reduce heart failure readmissions and readmissions for patients with short length of stay (i.e., 1 to 2 days) by 20%
� Reduce readmission rates to less than 10% by the end of 2011
“OTHER” RESPONSES
� Discharge specialist RNs
� Staff nurses
� Patient safety officer, analysts, and interpreter services
� Heart failure educator
� Senior planning director and chief of staff
� Risk-assessment committee
� Research team
� Community-based care managers
� Senior services, medical director, case management, nutrition, physical therapy, and government affairs
� Utilization management
� Nurse educators, nurse program managers, performance improvement specialists, pharmacy representative called in as needed, creation of heart failure nurse position, and home visit physician
� Decision support department and finance
CHART 4 Which type of benchmarks/goals have you selected?
0% 20% 40% 60% 80% 100%
Specific Goals
National AverageReadmission Rates
State AverageReadmission Rates
Academic MedicalCenter Average
Readmission Rates
Readmission Rates ofOther NAPH Members
Readmission Ratesof other Hospitals
in the Community
Other
70%
67%
57%
30%
20%
20%
7%

JUNE 2011 4national association of public hospitals and health systems
CHART 5
If you have a standard method of determining which readmissions are avoidable, which methodology does your organization use?
Staff defines it based on review of patient’s chart or interview with them 35%
3M’s Potentially Preventable Readmission (PPR) methodology 19%
Hospitalizations that occur as a result of one of 15 AHRQ ambulatory care sensitive conditions 15%
Other 31%
Staff defines it based on review of patient’s chart or interview with them
Other
Hospitalizations that occur as a result of one of 15 AHRQ ambulatory care sensitive conditions
3M’s Potentially Preventable Readmission (PPR) methodology
Data Collection Methods
■ 51% of responding hospitals have a mechanism (such as a standard process or a designated individual) to determine which readmissions are avoidable or potentially preventable as opposed to unavoidable (see chart
5 for more detail on methods used by the hospitals).
■ 46% track only retrospective readmis-sions data; 34% track both prospective and retrospective data; and 18% track only prospective data (chart 7).
■ 75% track length of stay; 71% track mortality; and 55% track ED visits
following hospitalization data in con-junction with readmissions data to support their investigation of the issue.
■ 73% include readmission measures on a departmental or organizational wide dashboard or scorecard.
■ 33% provide feedback to individual hospital-based providers about their patient specific readmission rates to encourage improvement efforts.
“OTHER” RESPONSES
� Thomson Reuters*
� Milliman & Robertson *
� Hospital readmission index developed by Canopy Systems Inc.*
� Criteria developed by California Safety Net Institute
� Institute for Clinical Systems Improvement (ICSI) methodology*
� Staff developed a scantron form to concurrently track and trend readmissions, which includes a chart review and patient interview portion to determine reasons for readmissions
� Criteria developed by the University HealthSystem Consortium
*External consultant to the hospitalCHART 6 What system do you use to collect readmission data?
0% 20% 40% 60% 80% 100%
ElectronicallyThrough HIT
Manually ThroughPaper Records
Outside Vendor
Don’t Know
66%
46%
41%
5%

JUNE 2011 5national association of public hospitals and health systems
CHART 8
Do you track rates for patients readmitted within these time periods following discharge?
0% 20% 40% 60% 80% 100%
7 Days
14 Days
30 Days
60 Days
90 Days
Other
43%
45%
94%
2%
2%
10%
CHART 7
Do you collect readmissions data retrospectively or prospectively?
Prospectively only 11%
Retrospectively only 46%
Both prospectively and retrospectively 34%
Don’t know 9%
Don’t know Prospectively only
Retrospectively only
Both prospectively and retrospectively
CHART 9 With whom do you share your organization’s readmissions data?
0% 20% 40% 60% 80% 100%
Hospital’s ExecutiveLeadership
Hospital Boardof Directors
PhysicianLeadership
Hospital-basedPhysicians
All Staff
The Public throughOrganization’s Website
Do Not Share Data
Other
65%
88%
80%
63%
35%
18%
16%
8%

JUNE 2011 6national association of public hospitals and health systems
Causes of Readmissions
The survey asked NAPH members to describe in detail the patient populations that are most at risk for readmissions in their organizations. After sorting their responses into categories to determine the most common populations at higher risk for readmission, we found that heart failure patients were the most susceptible (see chart 10 and table 1). While there are common patient risk factors across safety net hospitals, there are also specific, targeted high-risk patient populations within each hospital.
TABLE 1
Examples of specific patient populations at high-risk for readmission in NAPH member hospitals
Elderly populations with multiple comorbidities who are not able to practice self management
Homeless patients with cellulitis
Heart failure patients younger than Medicare age with significant social, emotional, and/or mental illness issues
Young males with heart failure and comorbidities of drug abuse and/or morbid obesity
Renal patients requiring dialysis who are unable to receive it due to their immigration status and return to the hospital requiring readmission
Patients 50 to 60 years of age with heart failure and no health insurance
Patients with chronic medical conditions with co-occurring mental illness, substance abuse issues, and/or are homeless
Heart failure patients with underlying respiratory issues
CHART 10
Which patient populations have you found to be at higher risk for readmission?
Terminal Patient NotReady to go to Hospice
Pneumonia
Coagulation
AdvancedDisease State
Polypharmacy
Patient RefusesHome Care Services
Sickle Cell Disease
Obesity
Refuse HigherLevel of Care
Hispanic
Southeast Asian
Cellulitis
Behavioral/MentalHealth Issues
Multiple Comorbidities
SubstanceAbuse Issues
Homeless
Heart Failure
Uninsured, Indigent,or Low-income
Elderly
Diabetes
Non-elderly
Non-compliant
Chronic ObstructivePulmonary Disease
End Stage Renal Disease
Social Issues
Asthma
No PCP or Accessto Primary Care
Health Literacy/Educational Issues
0% 10% 20% 30% 40% 50%
47%
29%
22%
20%
14%
12%
12%
12%
8%
8%
6%
6%
6%
6%
4%
2%
2%
4%
2%
2%
4%
2%
2%
2%
4%
2%
2%
2%

JUNE 2011 7national association of public hospitals and health systems
Few respondents analyze and compare readmission rates of specific patient populations to discover disparities. However, 43% of respondents track readmission rates by patient discharge location; 35% by presence of comorbidities; and 35% by
payor status. Of the hospitals that track readmissions by patients with comorbidities compared to patients with none, 67% have found disparities. Of those that track readmissions by payor type, 61% found disparities (chart 11 and table 2).
TABLE 2
Examples of readmission rate disparities members have found
Medicaid patients have higher readmission rates.
Indigent are more likely to return.
Patients are unable to pay for medications.
Uninsured and underinsured patients miss appointments and are less likely to follow medication.
Discharging patients to a homeless shelter leads to higher readmission rates.
Patients with little social support at home have higher readmission rates.
Patients discharged to a SNF have higher readmission rates.
Patients discharged to a home health agency have higher readmission rates.
Older population is less likely to practice self management.
The average age of readmitted patients is 54.9, lower than the expected age 60 or higher.
Hispanics have 50% fewer readmissions.
Heart failure patients with a behavioral health secondary diagnosis have higher readmission rates.
Patients with more comorbidities have higher readmission rates.
Younger patients with more chronic diseases have higher readmission rates.
CHART 11
Do you track readmission rates for disparities, and if so, have you found disparities in your readmission rates?
Payor Status
Discharge Location
Presence ofComorbidities
Age
Gender
Health Literacy Status
Race
Primary Language
Educational Level
Ethnicity
0% 20% 40% 60% 80% 100%
Tracks readmission rates for disparities
If track for disparities, have found them
43%
35%
35%
20%
18%
12%
12%
10%
8%
8%
36%
67%
61%
40%
11%
50%
2%
0%
25%
0%

JUNE 2011 8national association of public hospitals and health systems
73% of respondents identified patient issues with drug and alcohol abuse to be a significant contributor of readmissions, closely followed by patients not following up with appointments (63% of respondents) and homelessness (55%).
Strategies to Reduce Readmissions
■ 38% assign discharge responsibilities to residents and 33% assign them to attending physicians (chart 13).
■ 65% of respondents provide both an interpreter for oral discharge instructions and translated written instructions for limited English proficient (LEP) patients (chart 13).
■ 71% follow up (by phone, email, or sharing of patient’s electronic medical record) with skilled nursing facilities, 67% with rehab facilities, 65% with home health agencies, and 45% with patient’s primary care physician (chart 15).
■ 28% of respondents have created new positions within their organizations to facilitate the discharge process (table 3).
CHART 12
To what degree do you believe these issues contribute to readmissions in your organization?
Patients Not FillingPrescriptions
Issues of Drug/Alcohol Abuse
Patients Not Followingup With Appointments
Lack of Access toAppropriate Specialty
Care Follow-up
Homelessness
Lack of Access to PrimaryCare Follow-up
Lack of Family Support
Low Health Literacy
Lack of Community SupportServices for PatientsWith Special Needs
End of LifeCare Readmissions
Nursing Home“Bounce-backs”/
Readmissions
Language Barriers
0% 20% 40% 60% 80% 100%
Significant Contributor
Sometimes a Contributor
Not a Contributor
Did Not Answer
73%
63%
55%
49%
45%
45%
40%
31%
30%
20%
12%
10%
31%
43%
39%
39%
49%
63%
53%
55%
67%
61%
26%
35%
12%
4%
10%
10%
4%
4%
12%
20%
14%
20%

JUNE 2011 9national association of public hospitals and health systems
CHART 14
Do you have the following discharge processes in place for Limited English Proficient (LEP) patients?
Provide Written Discharge Instructions in Patient’s Preferred Language Only 10%
Provide Oral Discharge Instructions With the Use of an Interpreter Only 18%
Both 65%
Neither 6%
Other 2%
Provide Oral Discharge Instructions With the Use of an Interpreter Only
Provide Written Discharge Instructions in Patient’s Preferred Language OnlyOtherNeither
Both
CHART 13
Who has primary responsibility for discharging patients?
Residents 38%
Hospitalists 17%
Attending Physicians 33%
Patient’s Private Physician 4%
Other 7%
NPs/PAs 2%
NPs/PAs
Residents
Hospitalists
Attending Physicians
Patient’s Private Physician
Other
CHART 15
Which modes of communication do you employ to communicate with patients’ community providers?
Rehab
Skilled Nursing Facility
Home Health
PCP
0% 20% 40% 60% 80% 100%
69%
63%
61%
18%
24%
22%
24%
26%
6%
8%
10%
18%
29%
33%
35%
55%
Phone Calls Emails
EMRs None
JUNE 2011 10national association of public hospitals and health systems
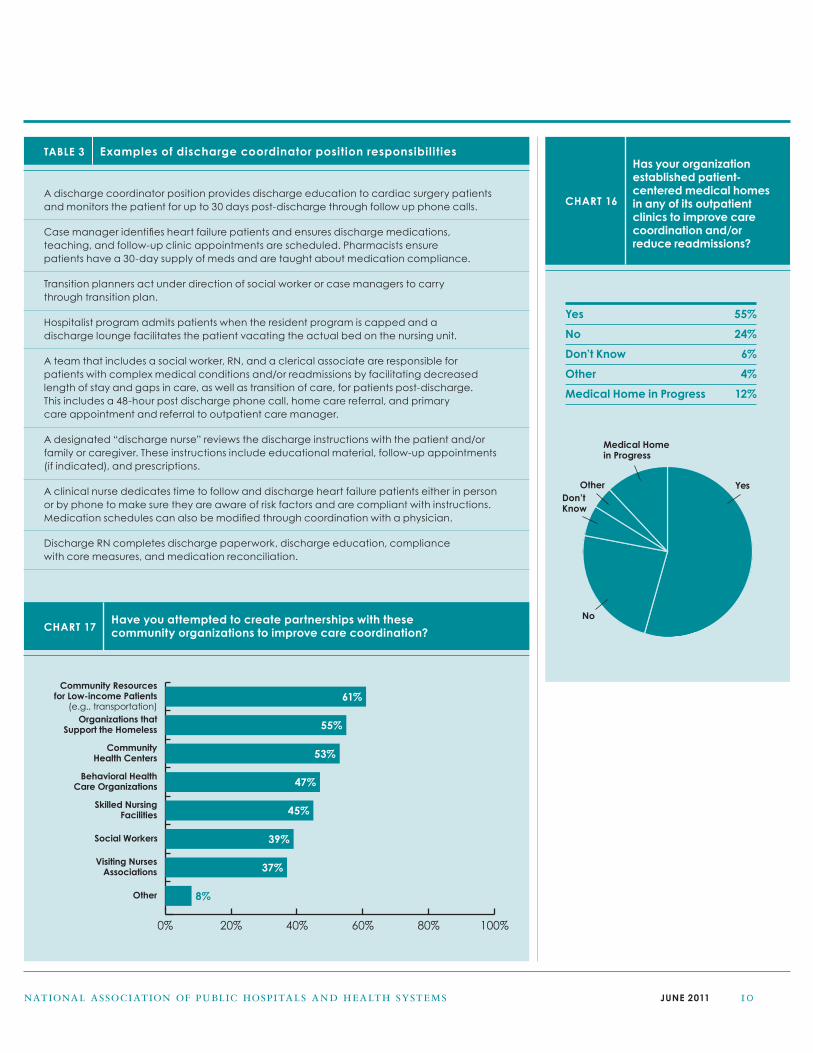
TABLE 3 Examples of discharge coordinator position responsibilities
A discharge coordinator position provides discharge education to cardiac surgery patients and monitors the patient for up to 30 days post-discharge through follow up phone calls.
Case manager identifies heart failure patients and ensures discharge medications, teaching, and follow-up clinic appointments are scheduled. Pharmacists ensure patients have a 30-day supply of meds and are taught about medication compliance.
Transition planners act under direction of social worker or case managers to carry through transition plan.
Hospitalist program admits patients when the resident program is capped and a discharge lounge facilitates the patient vacating the actual bed on the nursing unit.
A team that includes a social worker, RN, and a clerical associate are responsible for patients with complex medical conditions and/or readmissions by facilitating decreased length of stay and gaps in care, as well as transition of care, for patients post-discharge. This includes a 48-hour post discharge phone call, home care referral, and primary care appointment and referral to outpatient care manager.
A designated “discharge nurse” reviews the discharge instructions with the patient and/or family or caregiver. These instructions include educational material, follow-up appointments (if indicated), and prescriptions.
A clinical nurse dedicates time to follow and discharge heart failure patients either in person or by phone to make sure they are aware of risk factors and are compliant with instructions. Medication schedules can also be modified through coordination with a physician.
Discharge RN completes discharge paperwork, discharge education, compliance with core measures, and medication reconciliation.
CHART 16
Has your organization established patient-centered medical homes in any of its outpatient clinics to improve care coordination and/or reduce readmissions?
Yes 55%
No 24%
Don’t Know 6%
Other 4%
Medical Home in Progress 12%
Medical Home in Progress
OtherDon’t Know
Yes
NoCHART 17
Have you attempted to create partnerships with these community organizations to improve care coordination?
0% 20% 40% 60% 80% 100%
Organizations thatSupport the Homeless
Community Resourcesfor Low-income Patients
(e.g., transportation)
CommunityHealth Centers
Behavioral HealthCare Organizations
Skilled NursingFacilities
Social Workers
Other
Visiting NursesAssociations
61%
55%
53%
47%
45%
39%
37%
8%

JUNE 2011 11national association of public hospitals and health systems
NAPH based a group of survey questions on a document published by the Health Research and Education Trust (HRET) called the Health Care Leader Action Guide to Reduce Avoidable Readmissions.1 This action guide provides strategies for hospitals to follow at different stages of the discharge continuum to reduce avoidable readmissions: pre-discharge, during discharge, and post-discharge. The survey asked respondents to identify which strategies they use as standard practice during these three key time periods (see charts 18, 19, and 20).
CHART 18
Have you implemented any of the following processes as standard practice during hospitalization to prepare patients for discharge?
Use EHRs to SupportCare Coordination
Establish CommunicationWith Patient’s PCP
Proactively Determine andRespond to Patient Risks
for Readmission
Use Transitional CareNurse (or Similar Role)
to Coordinate Care
Other
Use InterdisciplinaryClinical Team
Identify and Respond toPatient Needs for EarlyAmbulation, NutritionalInterventions, PhysicianTherapy, or Social Work
Discuss Terminal orPalliative Care PlansWith the Patient and
Their Family
Use “Teach Back” toEducate Patient About
Diagnosis and CareDuring Hospitalization
Inform Family or HomeCare Agency of Patient
Care Process and Progress
Use Interdisciplinary TeamWith Bilingual Staff or
Interpreters for LEP Patients
Tailor Patient Care,Evidence-based Practice,
Clinical Guidelines,or Care Paths
0% 20% 40% 60% 80% 100%
82%
82%
75%
69%
65%
59%
57%
57%
43%
35%
24%
2%
JUNE 2011 12national association of public hospitals and health systems
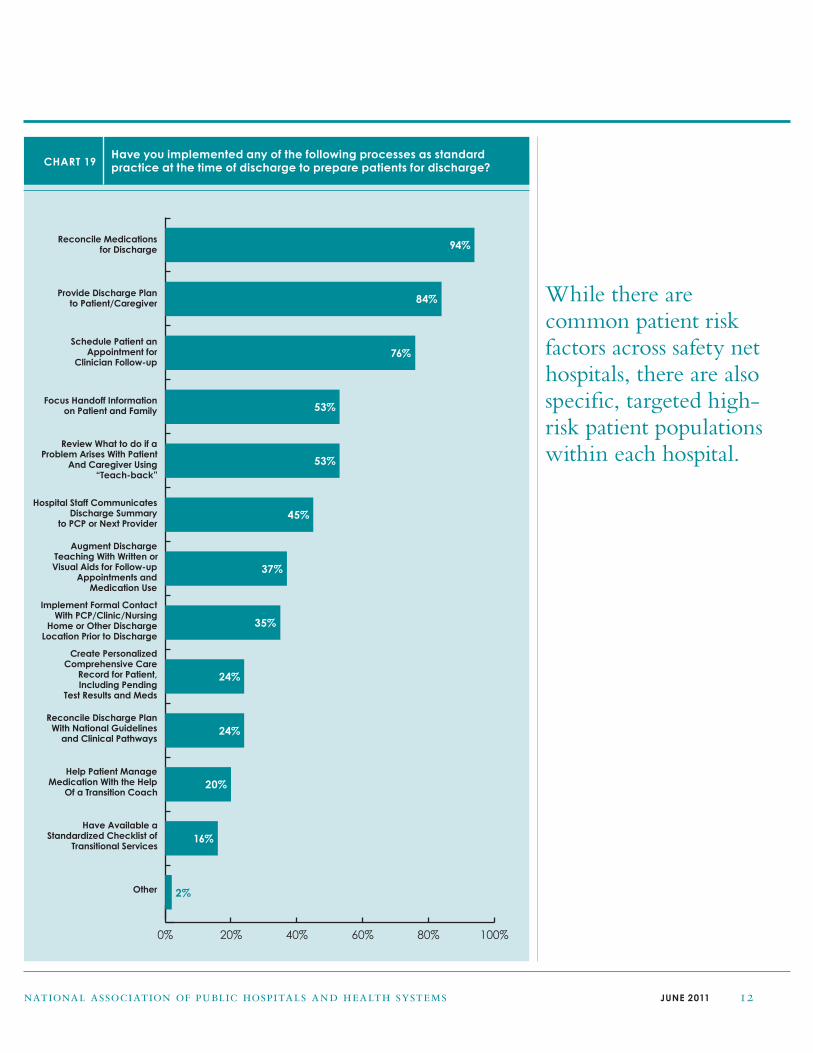
CHART 19
Have you implemented any of the following processes as standard practice at the time of discharge to prepare patients for discharge?
Implement Formal ContactWith PCP/Clinic/Nursing
Home or Other DischargeLocation Prior to Discharge
Create PersonalizedComprehensive Care
Record for Patient,Including Pending
Test Results and Meds
Reconcile Discharge PlanWith National Guidelines
and Clinical Pathways
Help Patient ManageMedication With the Help
Of a Transition Coach
Have Available aStandardized Checklist of
Transitional Services
Other
Provide Discharge Planto Patient/Caregiver
Reconcile Medicationsfor Discharge
Schedule Patient anAppointment for
Clinician Follow-up
Focus Handoff Informationon Patient and Family
Review What to do if aProblem Arises With Patient
And Caregiver Using“Teach-back”
Hospital Staff CommunicatesDischarge Summary
to PCP or Next Provider
Augment DischargeTeaching With Written orVisual Aids for Follow-up
Appointments and Medication Use
0% 20% 40% 60% 80% 100%
94%
84%
76%
53%
53%
45%
37%
35%
24%
24%
20%
16%
2%
While there are common patient risk factors across safety net hospitals, there are also specific, targeted high-risk patient populations within each hospital.

JUNE 2011 13national association of public hospitals and health systems
CHART 20
Have you implemented any of the following processes as standard practice post-discharge?
Other
Provide Post-DischargeFollow-up Call to Supportand Reinforce Discharge
Plan and SupportProblem Solving
Develop Public/Private Partnerships
With Nursing Homes,Correctional Facilities,
Homeless Shelters, etc.,to Meet Patients’ Needs
Promote PatientSelf-Managementby Implementing
Tools to Help PatientManage Care
Plan After Discharge
Conduct Home andNursing Home Visits
Immediately AfterDischarge and
Regularly After That
Support PatientsUsing Personal Health
Records to ManagePatient Information
Use Telehealth to Monitorand Support Patient Care
Use Technologies Suchas Mobile Phones and
Internet to Support PatientSelf-Management
0% 20% 40% 60% 80% 100%
84%
53%
33%
24%
20%
16%
6%
4%
NAPH members are forming partnerships with community organizations to improve care transitions.

JUNE 2011 14national association of public hospitals and health systems
Category (55 Total Strategies) Example of Strategies
Increased support & Nurse and social worker teams provide wrap-around support
communication with Purchased scales for all patients discharged with heart failure
patients/family Provide telehealth for heart failure patients
(14 strategies) Heart failure team has been addressing readmissions with discharge teaching by RN
Nurse managers call patients to assess understanding of instructions and follow up reminders
Advanced practice RN for cardiology visits patients in house prior to discharge, calls patient to remind of
follow up appointment, and assesses level of compliance to plan
Focused on the discharge process and educational information given to patients to reduce children’s asthma readmissions
The nurse on duty the night prior to discharge discusses discharge plan with patient
Find group homes for homeless
Implemented intensive case management and follow up with patients at home by phone
Improved processes Internal medicine residents have reduced heart failure readmissions through 100% compliance with core measures
care delivery Physicians adopted a team approach to discharge
(11 strategies) Unit nurses changed process for daily weights instead of using bed scales
Implemented disease-specific pathways and review of evidence-based measures and standardized order sets
Made enhancements to electronic medical record
Brought together a multidisciplinary group from across the organization (hospital, clinics, long-term care)
Created discharge standards for skilled nursing facility discharges to avoid rushing paper work
Increased Referred appropriate heart failure patients to inpatient medical detox unit and outpatient substance abuse referrals
communication Ensure heart failure patients have follow up appointments in hand
between inpatient Partner with hospice
providers & Partner with county health department to serve as medical home
other providers Systematic hand-off communication via comprehensive care plan that goes home with patient and is referred
(9 strategies) to by primary care and follow up providers
Have a designated nursing home in the community
Focused process for skilled nursing patients to ensure a smooth transition of care
Addressed Fill prescriptions prior to discharge
medication needs Decreased readmissions in newborns by implementing bilirubin protocol
(8 strategies) Give patients a list of local pharmacies
Pharmacist calls patient ready to be discharged to ensure understanding of medication instructions
Social workers identify and assist high risk population for readmissions by helping them enroll in hospital’s
pharmacy discount program
Modulate medication dosages in the outpatient setting
TABLE 4 What strategies have you implemented that have reduced readmissions in your organization?
Respondents were asked to identify strategies they implemented that had an impact on reducing readmissions
within their organizations and reported 55 total strategies, which we grouped into seven categories (see table 4).

JUNE 2011 15national association of public hospitals and health systems
improvement in readmission rates even more crucial for safety net hospitals. Implementing, measuring, and analyzing evidence-based or innovative strategies within safety net hospitals and sharing success stories with colleagues can help to address the issue. NAPH offers multiple resources for members that facilitate the exchange of successful strategies, such as webinars, conference presentations, and publications. The
NAPH website highlights innovations developed by members, as well as other evidence-based tools and programs for reducing readmissions (http://naph.org/Main-Menu-Category/Our-Work/Quality-Overview/Reducing-Readmissions.aspx).To display an innovation related to readmissions from your hospital, please contact Katie Reid, Research Associate at NAPH ([email protected]).
Conclusion
Although safety net hospitals have focused on reducing readmissions for the past several years, the problems associated with readmissions are complex. A national policy that will require hospitals to meet specific hospital readmission rates or face financial penalties will soon be implemented, making sustained
Notes
1. Osei-Anto A, Joshi M, Audet AM, Berman A, Jencks S, Health Care Leader Action Guide to Reduce
Avoidable Readmissions. Health Research & Educational Trust, Chicago, IL. January 2010.
Implemented a Implemented a disease management program
specific improvement Currently working on heart failure readmission rate through the development of a chronic care model
model (6 strategies) coordinated with hospital care
The patients that are currently being seen for Project Red have had a very successful low readmission rate for heart failure
Heart failure readmissions implemented best practices from American College of Cardiology Hospital 2 Home initiative
Interventions implemented as a result of the Readmission Value Stream Breakthrough Events (LEAN) has produced
a 10% decrease in readmissions
Lean Kaizen methodology
Identified high-risk Collect information prospectively on the causes of each readmission
patients/contributing Produce a daily report of all readmissions with case review to identify contributing factors
factors to readmission Cardiology PCC visits patient to assess risk for readmission
(4 strategies) Unit discharge facilitators conduct assessment if patient is a readmission, patients are readmitted back to discharging unit
Developed a Developed a chest pain unit to address patients who frequently go to the ED because they were unable
heart failure unit to get into hospital’s primary care system.
(3 strategies) Chest pain admissions and readmissions using an “observation unit” based on the Australian Model
TABLE 4 What strategies have you implemented that have reduced readmissions in your organization? (continued)