data.daff.gov.audata.daff.gov.au/.../pb_regnrd9aa__2015032hume_v4.0.0.docx · web viewthe hume...
TRANSCRIPT

Agriculture and Forestry in the Hume region of Victoria, 2015
Research by the Australian Bureau of Agriculturaland Resource Economics and Sciences
About my region 15.19March 2015
Agriculture and Forestry in the Hume region of Victoria, 2015 ABARES
© Commonwealth of Australia 2015
Ownership of intellectual property rights
Unless otherwise noted, copyright (and any other intellectual property rights, if any) in this publication is owned by the Commonwealth of Australia (referred to as the Commonwealth).
Creative Commons licence
All material in this publication is licensed under a Creative Commons Attribution 3.0 Australia Licence, save for content supplied by third parties, logos and the Commonwealth Coat of Arms.
Creative Commons Attribution 3.0 Australia Licence is a standard form licence agreement that allows you to copy, distribute, transmit and adapt this publication provided you attribute the work. A summary of the licence terms is available from creativecommons.org/licenses/by/3.0/au/deed.en. The full licence terms are available from creativecommons.org/licenses/by/3.0/au/legalcode.
Cataloguing data
ABARES 2015, Agriculture and Forestry in the Hume region of Victoria, 2015, About my region 15.19, Canberra, March. CC BY 3.0.
ISBN 978-1-74323-076-3ABARES project 43009
Internet
Agriculture and Forestry in the Hume region of Victoria 2015 is available at agriculture.gov.au/abares.
Australian Bureau of Agricultural and Resource Economics and Sciences (ABARES)
Postal address GPO Box 858 Canberra ACT 2601Switchboard +61 2 6272 3933Facsimile +61 2 6272 2001Email [email protected] agriculture.gov.au/abares
Inquiries about the licence and any use of this document should be sent to [email protected].
The Australian Government acting through the Department of Agriculture, represented by the Australian Bureau of Agricultural and Resource Economics and Sciences, has exercised due care and skill in preparing and compiling the information and data in this publication. Notwithstanding, the Department of Agriculture, ABARES, its employees and advisers disclaim all liability, including for negligence and for any loss, damage, injury, expense or cost incurred by any person as a result of accessing, using or relying upon information or data in this publication to the maximum extent permitted by law.
Acknowledgements
ABARES relies on the voluntary cooperation of farmers participating in the annual Australian Agricultural and Grazing Industries Survey, Australian Dairy Industry Survey, and Australian Vegetable Growing Farms Survey to provide data used in the preparation of this report. Without their help, these surveys would not be possible. ABARES farm survey staff collected most of the information presented in this report through on-farm interviews with farmers.
This regional profile was updated by Therese Thompson, Haydn Valle, Timothy Connolly, Lucy Randall and Sharan Singh.

Agriculture and Forestry in the Hume region of Victoria, 2015 ABARES
Contents1 Regional overview.................................................................................................................................. 1
Employment.............................................................................................................................................. 22 Agriculture sector................................................................................................................................... 4
Value of agricultural production......................................................................................................4Number and type of farms.................................................................................................................. 4Farm financial performance—Victoria..........................................................................................6
3 Forestry sector.......................................................................................................................................13
References........................................................................................................................................................... 14
TablesTable 1 Number of farms, by industry classification, 2012–13......................................................5
Table 2 Financial performance, Victoria broadacre industries, 2011–12 to 2013–14, average per farm..................................................................................................................................... 7
Table 3 Farm cash income of Victoria broadacre farms, by region, 2012–13 to 2013–14, average per farm..................................................................................................................................... 7
Table 4 Financial performance, Victoria dairy industry, 2011–12 to 2013–14, average per farm.................................................................................................................................................... 11
Table 5 Physical and financial performance, vegetable growing farm businesses, Victoria, 2012–13 and 2013–14.......................................................................................................................12
FiguresFigure 1 Employment profile, Hume region, November 2014.......................................................3
Figure 2 Value of agricultural production, Hume region, Victoria, 2012–13...........................4
Figure 3 Distribution of farms by estimated value of agricultural operations, Hume region, Victoria, 2012–13.................................................................................................................... 5
Figure 4 Real farm cash income, broadacre industries, average per farm................................7
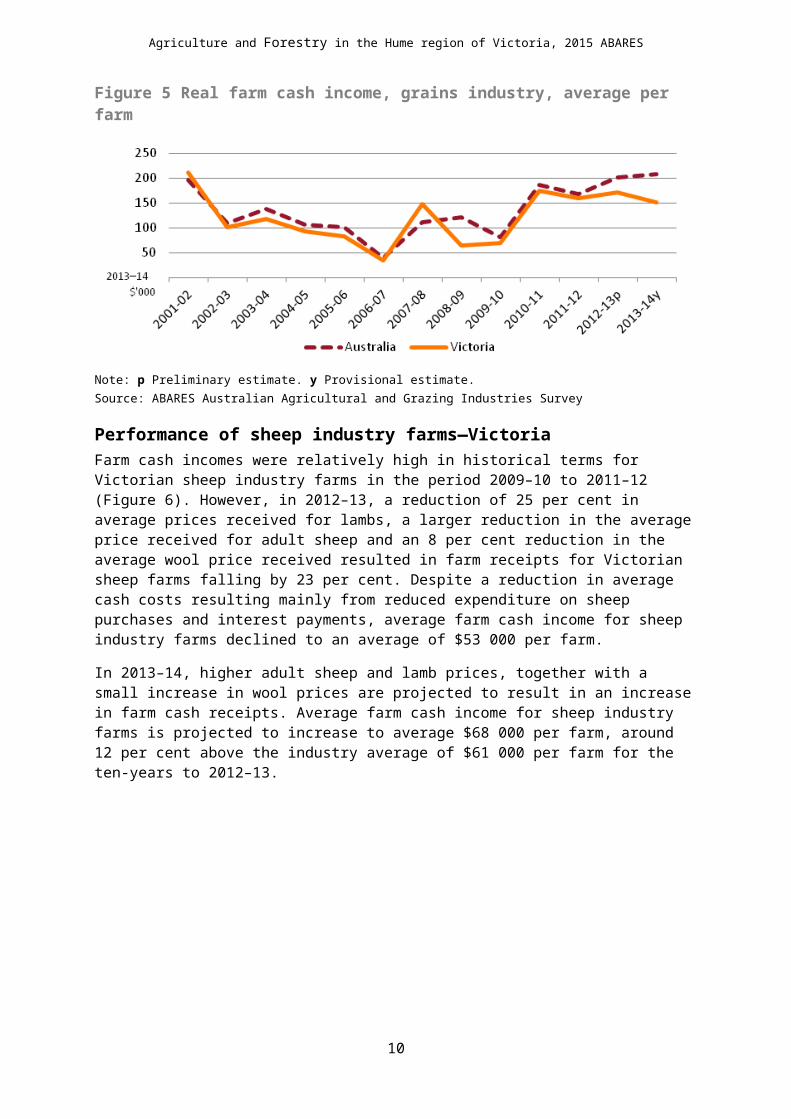
Figure 5 Real farm cash income, grains industry, average per farm............................................8
Figure 6 Real farm cash income, sheep industry, average per farm............................................9
Figure 7 Real farm cash income, beef industry, average per farm................................................9
Figure 8 Real farm cash income, dairy industry, average per farm...........................................10
Figure 9 Real farm cash income, vegetable growing farm businesses, Victoria, 2005–06 to 2013–14........................................................................................................................................ 12
Figure 10 Area of native forest, by tenure............................................................................................13
MapsMap 1 Broad agricultural land use of the Hume region of Victoria..............................................1
Map 2 Agricultural industries of the Hume region of Victoria.......................................................2

Agriculture and Forestry in the Hume region of Victoria, 2015 ABARES

Agriculture and Forestry in the Hume region of Victoria, 2015 ABARES
1 Regional overviewThe Hume region of Victoria is located in the north-east of the state (Map 1). The region comprises the 10 local government areas of Alpine, Benalla, Indigo, Mansfield, Mitchell, Murrindindi, Strathbogie, Towong, Wangaratta, Wodonga, and parts of Greater Shepparton and Yarra Ranges. The Hume region includes the major regional towns of Wangaratta and Wodonga. The region covers a total area of around 34 000 square kilometres or 15 per cent of Victoria’s total area and is home to approximately 159 300 people (ABS 2011).
Agricultural land in the Hume region occupies 14 450 square kilometres, or 43 per cent of the region. Areas classified as conservation and natural environments (nature conservation, protected areas and minimal use) occupy 7810 square kilometres, or 23 per cent of the region. The most common land use by area is grazing modified pasture, which occupies 12 200 square kilometres or 36 per cent of the Hume region.
Map 1 Broad agricultural land use of the Hume region of Victoria
Source: Catchment scale land use of Australia – update March 2014 (ABARES, 2014)
1
Agriculture and Forestry in the Hume region of Victoria, 2015 ABARES
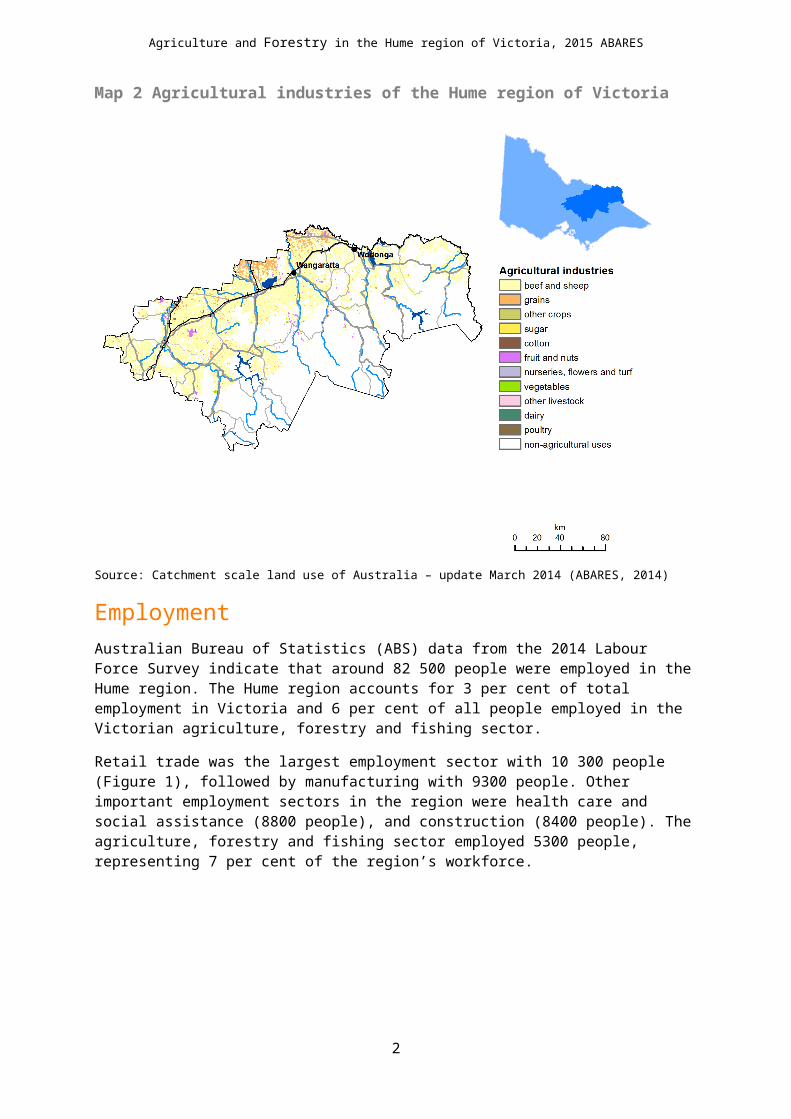
Map 2 Agricultural industries of the Hume region of Victoria
Source: Catchment scale land use of Australia – update March 2014 (ABARES, 2014)
EmploymentAustralian Bureau of Statistics (ABS) data from the 2014 Labour Force Survey indicate that around 82 500 people were employed in the Hume region. The Hume region accounts for 3 per cent of total employment in Victoria and 6 per cent of all people employed in the Victorian agriculture, forestry and fishing sector.
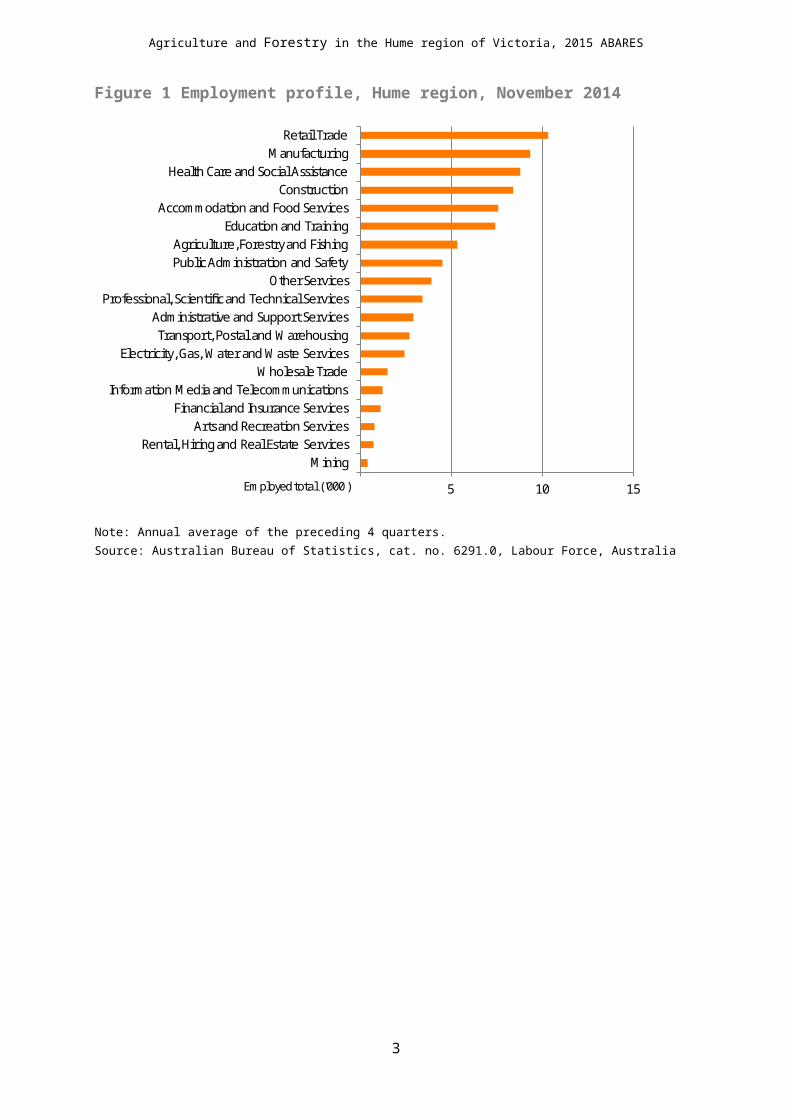
Retail trade was the largest employment sector with 10 300 people (Figure 1), followed by manufacturing with 9300 people. Other important employment sectors in the region were health care and social assistance (8800 people), and construction (8400 people). The agriculture, forestry and fishing sector employed 5300 people, representing 7 per cent of the region’s workforce.
2

Agriculture and Forestry in the Hume region of Victoria, 2015 ABARES
Figure 1 Employment profile, Hume region, November 2014
- 5 10 15
MiningRental, Hiring and Real Estate Services
Arts and Recreation ServicesFinancial and Insurance Services
Information Media and TelecommunicationsWholesale Trade
Electricity, Gas, Water and Waste ServicesTransport, Postal and Warehousing
Administrative and Support ServicesProfessional, Scientific and Technical Services
Other ServicesPublic Administration and SafetyAgriculture, Forestry and Fishing
Education and TrainingAccommodation and Food Services
ConstructionHealth Care and Social Assistance
ManufacturingRetail Trade
Employed total ('000 )
Note: Annual average of the preceding 4 quarters.Source: Australian Bureau of Statistics, cat. no. 6291.0, Labour Force, Australia
3
Agriculture and Forestry in the Hume region of Victoria, 2015 ABARES
2 Agriculture sectorValue of agricultural productionIn 2012–13, the gross value of agricultural production (GVAP) in the Hume region was $654 million, which was 6 per cent of the total gross value of agricultural production in Victoria ($11.6 billion). This is the most recent year for which ABS data are available.
The Hume region has a diverse and important agricultural sector. The most important commodity in the Hume region based on the gross value of agricultural production was cattle and calves (Figure 2). In 2012–13, cattle and calves contributed 32 per cent ($212 million) to the value of agricultural production in the region. Milk accounted for 13 per cent ($85 million), sheep and lambs accounted for 12 per cent ($78 million), wool accounted for 8 per cent (52 million), and fruit and nuts (excluding grapes) contributed 7 per cent ($44 million).
In 2012–13, the Hume region accounted for around 100 per cent of the total value of Victorian rice production and 52 per cent of the total value of cherry production.
Figure 2 Value of agricultural production, Hume region, Victoria, 2012–13
$m 50 100 150 200 250
Other
Eggs
Pigs
Wine grapes
Nurseries, cut flowers and turf
Canola
Vegetables
Hay
Wheat
Fruit and nuts (excluding grapes)
Wool
Sheep and lambs
Milk
Cattle and calves
Source: Australian Bureau of Statistics, cat. no. 7503.0, Value of agricultural commodities produced, Australia
Number and type of farmsABS data indicate that in 2012–13 there were 4671 farms in the Hume region with an estimated value of agricultural operations of more than $5000 (Table 1). The region contains 14 per cent of all farm businesses in Victoria.
4
Agriculture and Forestry in the Hume region of Victoria, 2015 ABARES
Table 1 Number of farms, by industry classification, 2012–13Industry Classification Hume region Victoria
no. % no. %
Beef Cattle 1 976 44 8 219 27
Sheep 520 12 3 774 12
Mixed livestock 310 7 1 395 5
Fruit and nuts 279 6 2 275 7
Dairy 233 5 4 733 15
Mixed grains and livestock 197 4 2 224 7
Other livestock 193 4 918 3
Other Crop growing 81 2 358 1
Grain growing 77 2 2 388 8
Vegetable 29 1 691 2
Other 533 12 3 285 11
Total Agriculture 4 458 100 30 884 100
Note: Estimated value of agricultural operations greater than $5000.Source: Australian Bureau of Statistics
Farms are classified in Table 1 according to the activities that generate most of their value of production. Beef cattle farms (2109 farms) were the most common, accounting for 45 per cent of all farms in the Hume region, and 26 per cent of all beef cattle farms in Victoria.
There is a large percentage of small farms in the region in terms of their value of agricultural output. Estimated value of agricultural operations (EVAO) is a measure of the value of production from farms and a measure of their business size. Around 43 per cent of farms in the Hume region had an EVAO of less than $50 000 (Figure 3). These farms accounted for only 6 per cent of the total value of agricultural operations in 2012–13. In comparison, 12 per cent of farms in the region had an EVAO of more than $350 000 and accounted for an estimated 54 per cent of the total value of agricultural operations in the region.
Figure 3 Distribution of farms by estimated value of agricultural operations, Hume region, Victoria, 2012–13
%
10
20
30
40
50
< $50k $50k to $150k $150k to $350k $350k to $500k $500k to $1 m > $1 m
Share of farms Share of value of agricultural operations
Source: Australian Bureau of Statistics
5

Agriculture and Forestry in the Hume region of Victoria, 2015 ABARES
Farm financial performance—VictoriaEach year, ABARES interviews Australian broadacre, dairy and vegetable producers as part of its annual survey program. Broadacre industries covered in this survey include the grains, grains–livestock, sheep, beef and sheep–beef industries. The information collected is a basis for analysing the current financial position of farms in these industries and expected changes in the short term. This paper uses data from the ABARES Australian agriculture and grazing industries survey (AAGIS), Australian dairy industry survey (ADIS), and Australian vegetable growing industry survey to report estimates of financial performance indicators (Box 1) for broadacre, dairy and vegetable farms in Victoria.
Box 1 DefinitionsMajor financial performance indicators Total cash receipts: total revenues received by the business during the financial year. Total cash costs: payments made by the business for materials and services and for permanent and casual hired
labour (excluding owner manager, partner and family labour). Farm cash income: total cash receipts – total cash costs Farm business profit: farm cash income + changes in trading stocks – depreciation – imputed labour costs Profit at full equity: return produced by all the resources used in the business, farm business profit + rent +
interest + finance lease payments – depreciation on leased items Rate of return: return to all capital used, profit at full equity * 100 / total opening capital Equity ratio: Farm capital minus farm debt expressed as a percentage of farm capitalIndustry types Grains: farms mainly engaged in producing broadacre crops such as wheat, coarse grains, oilseeds and pulses, and
including farms running sheep and/or beef cattle in conjunction with substantial broadacre crop activity. Sheep: farms mainly engaged in running sheep. Beef: farms mainly engaged in running beef cattle. Dairy: farms mainly engaged in milk production. Vegetable: farms mainly engaged in growing vegetables.
Performance of broadacre farms—VictoriaFarm cash income for Victorian broadacre farms declined from an estimated average of $92 310 per farm in 2011–12 to an average of $85 600 per farm in 2012–13, mainly as a result of lower livestock prices and reduced grain production (Table 2).
In 2013–14, receipts from sheep, lambs and wool are projected to increase as a result of higher prices. However, despite increased turnoff of beef cattle, lower saleyard prices are projected to result in little change in beef cattle receipts. Receipts from cropping are projected to remain similar to 2012-13, with only a small increase in winter crop production and lower prices for canola, barley and some grain legumes. On average, farm cash income for broadacre farms in Victoria is projected to decline slightly to $82 000 per farm in 2013–14, around 12 per cent above the ten-year average to 2012–13 of $73 000 per farm.
Overall, farm cash incomes are projected to increase in the Mallee region, although farm cash incomes vary greatly within this region. Farm cash income is projected to decline slightly in the Wimmera mainly as a result of lower prices for some grains and a larger decline is projected in the Central North due to the additional impact of lower beef cattle prices. In southern and eastern Victoria, increased cattle turn-off together with higher sheep, lamb and wool prices are projected to result in a small increase in average farm cash income (Table 3).
6

Agriculture and Forestry in the Hume region of Victoria, 2015 ABARES
Figure 4 Real farm cash income, broadacre industries, average per farm
Note: p Preliminary estimate. y Provisional estimate.Source: ABARES Australian Agricultural and Grazing Industries Survey
Table 2 Financial performance, Victoria broadacre industries, 2011–12 to 2013–14, average per farm
Performance indicatorunit
s 2011–12 2012–13p RSE 2013–
14yTotal cash receipts $ 303 990 279 700 (9) 278 000Total cash costs $ 211 680 194 200 (10) 196 000Farm cash income $ 92 310 85 600 (11) 82 000Farms with negative farm cash income % 20 25 (18) 28Farm business profit $ 8 530 12 400 (68) –2 000Profit at full equity excluding capital appreciation $ 36 060 37 200 (27) 22 000Farm capital at 30 June a $ 2 902 350 2 820 700 (10) naFarm debt at 30 June b $ 278 170 252 400 (15) 255 000Equity ratio b % 90 91 (1) naRate of return excluding capital appreciation c % 1.3 1.3 (22) 0.8Off-farm income of owner manager and spouse b $ 37 960 32 200 (14) na
Note: a Excludes leased plant and equipment. b Average per responding farm. c Rate of return to farm capital at 1 July. p ABARES preliminary estimates. y ABARES provisional estimates. na Not available. RSE Relative standard errors, expressed as a percentage of the estimate provided.Source: ABARES Australian Agricultural and Grazing Industries Survey
7

Agriculture and Forestry in the Hume region of Victoria, 2015 ABARES
Table 3 Farm cash income of Victoria broadacre farms, by region, 2012–13 to 2013–14, average per farm
Region units 2012–13p RSE 2013–14yMallee $ 126 100 (26) 165 000Wimmera $ 157 400 (14) 150 000Central North $ 93 100 (15) 50 000Southern and Eastern Victoria $ 55 000 (26) 59 000
Note: p ABARES preliminary estimates. y ABARES provisional estimates. na Not available. Figures in parentheses are standard errors, expressed as a percentage of the estimate provided.Source: ABARES Australian Agricultural and Grazing Industries Survey
Performance of grains industry farms—VictoriaIn 2012–13, crop receipts increased for Victorian grains farms compared to those recorded in 2011–12, as higher crop prices offset reductions in crop production resulting from drier conditions through winter and spring. Farm cash income for Victorian grains industry farms averaged $171 000 a farm in 2012–13 (Figure 5).
Overall, in 2013–14, crop receipts for Victorian grains farms are projected to remain similar to those recorded in 2012–13, lower prices for canola, barley and some grain legumes mostly offsetting small increases in overall grain production.
Farm cash income for Victorian grains industry farms is projected to average $151 000 a farm in 2013–14, around 35 per cent above the industry average for the previous 10 years (Figure 5). However, farm cash incomes for Victorian grains industry farms were reduced by dry conditions throughout much of this period.
Figure 5 Real farm cash income, grains industry, average per farm
Note: p Preliminary estimate. y Provisional estimate.Source: ABARES Australian Agricultural and Grazing Industries Survey
Performance of sheep industry farms—VictoriaFarm cash incomes were relatively high in historical terms for Victorian sheep industry farms in the period 2009–10 to 2011–12 (Figure 6). However, in 2012–13, a reduction of 25 per cent in average prices received for lambs, a larger reduction in the average price received for adult sheep and an 8 per cent reduction in the average wool price received resulted in farm receipts for Victorian sheep farms falling by 23 per cent. Despite a reduction in average cash costs
8

Agriculture and Forestry in the Hume region of Victoria, 2015 ABARES
resulting mainly from reduced expenditure on sheep purchases and interest payments, average farm cash income for sheep industry farms declined to an average of $53 000 per farm.
In 2013–14, higher adult sheep and lamb prices, together with a small increase in wool prices are projected to result in an increase in farm cash receipts. Average farm cash income for sheep industry farms is projected to increase to average $68 000 per farm, around 12 per cent above the industry average of $61 000 per farm for the ten-years to 2012–13.
Figure 6 Real farm cash income, sheep industry, average per farm
Note: p Preliminary estimate. y Provisional estimate.Source: ABARES Australian Agricultural and Grazing Industries Survey
Performance of beef industry farms—VictoriaA much smaller average herd size for Victorian beef industry farms, compared with the Australian average, results in average farm cash income for Victorian beef industry farms typically being well below the national average (Figure 7).
In 2012–13, a reduction of 15 per cent in the average price received for beef cattle sold reduced farm cash receipts and despite a further reduction in expenditure on beef cattle purchases average farm cash income for Victorian beef industry farms declined to average $18 000 per farm in 2012–13 (Figure 7).
In 2013–14, a further reduction in the average price received for beef cattle sold is projected to result in average farm cash income for Victorian beef industry farms declining further to average $11 000 per farm in 2013–14, less than half the industry average of $36 000 per farm for the ten-years to 2012–13 (Figure 7).
9

Agriculture and Forestry in the Hume region of Victoria, 2015 ABARES
Figure 7 Real farm cash income, beef industry, average per farm
Note: p Preliminary estimate. y Provisional estimate.Source: ABARES Australian Agricultural and Grazing Industries Survey
Performance of dairy industry farms— VictoriaIn 2012–13, a reduction in farmgate milk prices averaging 7 per cent and a reduction of 3 per cent in average milk production in Victoria, together with an increase in average cash costs of 11 per cent driven mainly by a rise in expenditure on fodder and interest payments, resulted in farm cash incomes for Victorian dairy farms declining from $141 790 in 2011–12 to just $31 500 in 2012–13. An estimated 38 per cent of Victorian dairy farms recorded negative farm cash incomes and farm business profit declined to an average loss of $40 100 per farm (Table 4).
In 2013–14 average farm cash incomes are projected to rebound strongly with an increase in farmgate milk prices of around 20 per cent. Despite a projected reduction in milk production and an increase in total cash costs, resulting mainly from higher fodder expenditure, farm cash income for Victorian dairy farms is projected to increase to an average of $127 000 per farm. If achieved, this would be around 39 per cent above the average for the ten-years to 2012–13, in real terms. However, average farm cash income for Victorian dairy farms was low in many years during this period due to drought and reduced availability of irrigation water (Figure 8).
Figure 8 Real farm cash income, dairy industry, average per farm
10

Agriculture and Forestry in the Hume region of Victoria, 2015 ABARES
Note: p Preliminary estimate. y Provisional estimate.Source: ABARES Australian Agricultural and Grazing Industries Survey
11
Agriculture and Forestry in the Hume region of Victoria, 2015 ABARES
Table 4 Financial performance, Victoria dairy industry, 2011–12 to 2013–14, average per farm
Performance indicator units 2011–12 2012–13p RSE 2013–14yTotal cash receipts $ 583 330 523 500 (14) 629 000Total cash costs $ 441 540 492 000 (15) 502 000Farm cash income $ 141 790 31 500 (52) 127 000Farms with negative farm cash income % 16 38 (29) 14Farm business profit $ 67 030 –40 100 (32) 51 000Profit at full equity excluding capital appreciation $ 130 310 27 100 (58) 115 000Farm capital at 30 June a $ 2 988 710 3 371 100 (11) naFarm debt at 30 June b $ 644 610 747 800 (10) 754 000Equity ratio b % 79 78 (3) naRate of return excluding capital appreciation c % 4.3 0.8 (54) 3.5Off-farm income of owner manager and spouse b $ 20 020 22 800 (20) na
Note: a Excludes leased plant and equipment. b Average per responding farm. c Rate of return to farm capital at 1 July. p ABARES preliminary estimates. y ABARES provisional estimates. na Not available. RSE Relative standard errors, expressed as a percentage of the estimate provided.Source: ABARES Australian Agricultural and Grazing Industries Survey
Performance of vegetable industry farms—VictoriaNationally in 2013–14, average farm cash income is estimated to have declined to $156 000, 4 per cent lower than in 2012–13. Average to above average seasonal conditions helped growers to maintain the high yields of 2012–13. Overall vegetable production was also higher because the average area planted to vegetable crops increased. However, the resulting increase in vegetable cash receipts was partially offset by lower vegetable prices.
In 2012–13 farm cash income in Victoria is estimated to have increased to an average of $218 900 (Table 5), 10 per cent higher than the estimated farm cash income (in real terms) over the eight years to 2012–13 (Figure 9). Average area planted and crop yields were both higher, particularly for less commonly produced vegetables such as carrots, onions, lettuce, cauliflower and cabbages. Although prices for potatoes, carrots and tomatoes were higher, there were large decreases in the prices received for other vegetables. Nevertheless, estimated average vegetable cash receipts increased more than the increase in average cash costs.
Above average yields and higher prices for most vegetable crops are estimated to have resulted in increased average farm cash income in 2013–14 to $314 000 (Table 5), 32 per cent higher than the average farm cash income (in real terms) estimated for Victoria over the nine years to 2013–14 (Figure 9). The area planted to vegetables increased and yields were above average, resulting in increased vegetable production. Vegetable prices were higher for the main vegetable types grown, resulting in higher vegetable cash receipts. Reduced expenditure on repairs and maintenance, interest and plant hire offset higher expenditure on most other inputs.
12

Agriculture and Forestry in the Hume region of Victoria, 2015 ABARES
Table 5 Physical and financial performance, vegetable growing farm businesses,Victoria, 2012–13 and 2013–14
average per farmSelected estimates units 2012–13 p RSE % Change
from 2011–122013–14 y RSE % Change
from 2012–13Vegetable cash receipts $ 1 083 100 (11) 23 1 179 000 (24) 9Area sown to vegetables ha 55.7 (12) 13 56.3 (26) 1Quantity of vegetables produced t 1 460 (13) 27 1 508 (26) 3Farm cash income $ 218 900 (22) 105 314 000 (29) 47
Note: p Preliminary estimate. y Provisional estimate. RSE Relative standard errors, expressed as a percentage of the estimate. Updated data for vegetable farm businesses will be available November 2015.Source: ABARES Australian vegetable growing farms survey
Figure 9 Real farm cash income, vegetable growing farm businesses,Victoria, 2005–06 to 2013–14
average per farm
0
50
100
150
200
250
300
350
2005
–06
2006
–07
2007
–08
2008
–09
2009
–10
2010
–11
2011
–12
2012
–13
p
2013
–14
y
$'0002013–14
Note: p Preliminary estimate. y Provisional estimate.Source: ABARES Australian vegetable growing farms survey
13

Leasehold forest (400 ha—0.02%)
Multiple-use public forest (958 700 ha—53.8%)
Nature conservation reserve (494 500 ha—27.8%)
Other Crown land (33 200 ha—1.9%)
Private land (including Indigenous) (293 500 ha—16.5%)
Unresolved tenure (300 ha—0.02%)
Agriculture and Forestry in the Hume region of Victoria, 2015 ABARES
3 Forestry sectorIn 2010–11, the total plantation area in the Hume region was approximately 66 000 hectares, comprised of approximately 6000 hectares of hardwood plantations and 60 000 hectares of softwood plantations. The main hardwood species planted is blue gum (Eucalyptus globulus) and the main softwood species planted is radiata pine (Pinus radiata).
In 2011, there were approximately 1.8 million hectares of native forests in the Hume region, comprised mainly of Eucalypt medium open (999 000 hectares), Eucalypt tall open (486 800 hectares) and Eucalypt medium woodland (161 600 hectares) forest types. The majority of the native forests are multiple-use public forest available for timber production (958 700 hectares), approximately 494 500 hectares are in nature conservation reserves, and approximately 293 500 hectares are privately managed (Figure 10). Major sawmills are located at Benalla, while wood-based panel mills are located at Myrtleford and Wangaratta.
Figure 10 Area of native forest, by tenure
Source: ABARES Australia’s State of the Forests Report 2013
Total sales and service income in the Victorian forest and wood product industry was estimated at approximately $6.6 billion in 2012–13, of which $2.6 billion was from the sale of paper and paper products, and the remaining $4.08 billion was generated from other wood product sales. Victoria is also the third largest exporter of woodchips in Australia, exporting approximately 1.1 million bone-dry tonnes in 2010–11, valued at $197 million. In 2011–12, both the volume and value of woodchip exports increased, to 1.5 million tonnes and $271 million respectively. Victoria is the only state that reported an increase in woodchip exports between 2010–11 and 2011–12. In 2011, the Victorian forestry sector employed 21 826 workers (0.9 per cent of the total employed workforce in Victoria) compared with 23 672 (1.1 per cent) in 2006 (number of people employed includes forestry support services and timber wholesaling).
14

Agriculture and Forestry in the Hume region of Victoria, 2015 ABARES
ReferencesABS 2011, Census of Population and Housing, Australian Bureau of Statistics, Canberra.
ABS 2014a, Agricultural Commodities, Australia, 2012–2013, cat. no. 7121.0, Australian Bureau Statistics, Canberra.
ABS 2014b, Labour Force, Australia, Detailed, Quarterly, Nov 2014, cat. no. 6291.0.55.003, Australian Bureau Statistics, Canberra.
ABS 2014c, Value of Agricultural Commodities Produced, Australia, 2012–13, cat. no. 7503.0, Australian Bureau Statistics, Canberra.
Australian Bureau of Agricultural and Resource Economics-Bureau of Rural Sciences 2010, Land use of Australia 2005-06, Version 4, Department of Agriculture, Fisheries and Forestry, Canberra.
ABARES 2014, Catchment scale land use of Australia – update March 2014. Department of Agriculture. http://data.daff.gov.au/anrdl/metadata_files/pb_luausg9abll20140506_11a.xml
Australian Bureau of Agricultural and Resource Economics and Sciences 2014, Australian forest and wood products statistics: March and June quarters 2014, Australian Bureau of Agricultural and Resource Economics and Sciences, Canberra.
Montreal Process Implementation Group for Australia and National Forest Inventory Steering Committee 2013, Australia’s State of the Forests Report 2013, Australian Bureau of Agricultural and Resource Economics and Sciences, Canberra.
15