datadog solution brief hybrid cloud monitoring...hybrid cloud monitoring datadog.com in hybrid or...
TRANSCRIPT
Hybrid Cloud Monitoring datadog.com
Datadog Solution Brief
Hybrid Cloud Monitoring
Understand, Compare and Correlate the Performance of Multiple Cloud and On-Premise Environments
The benefits of a hybrid and multi-cloud approach are best realized when engineering and operations teams have deep visibility into the health and performance of their applications and environments. However, gaining this holistic visibility can be challenging. Legacy on-premise monitoring tools are often not well-suited to the cloud, and native cloud monitoring services or projects tailored for monitoring the cloud are not compatible with applications and other enabling technologies running on premise. Thus, multiple monitoring tools are required to gain visibility into all environments that are being used. Engineering teams must then “eyeball” multiple screens to understand how services are working together, or, how the performance of separate platforms differ. These teams risk missing important insights because of a lack of context between systems, or due to blind spots that arise when data from multiple platforms does not match up. Monitoring and alerting all environments that are working together from a single platform is key to running high-performing, highly reliable applications on multiple environments.
Datadog allows for organizations to effortlessly monitor multiple environments running on-premises or on cloud platforms in a single pane of glass. All metrics, logs and application traces
Thousands of customers love & trust Datadog
Hybrid Cloud Monitoring datadog.com
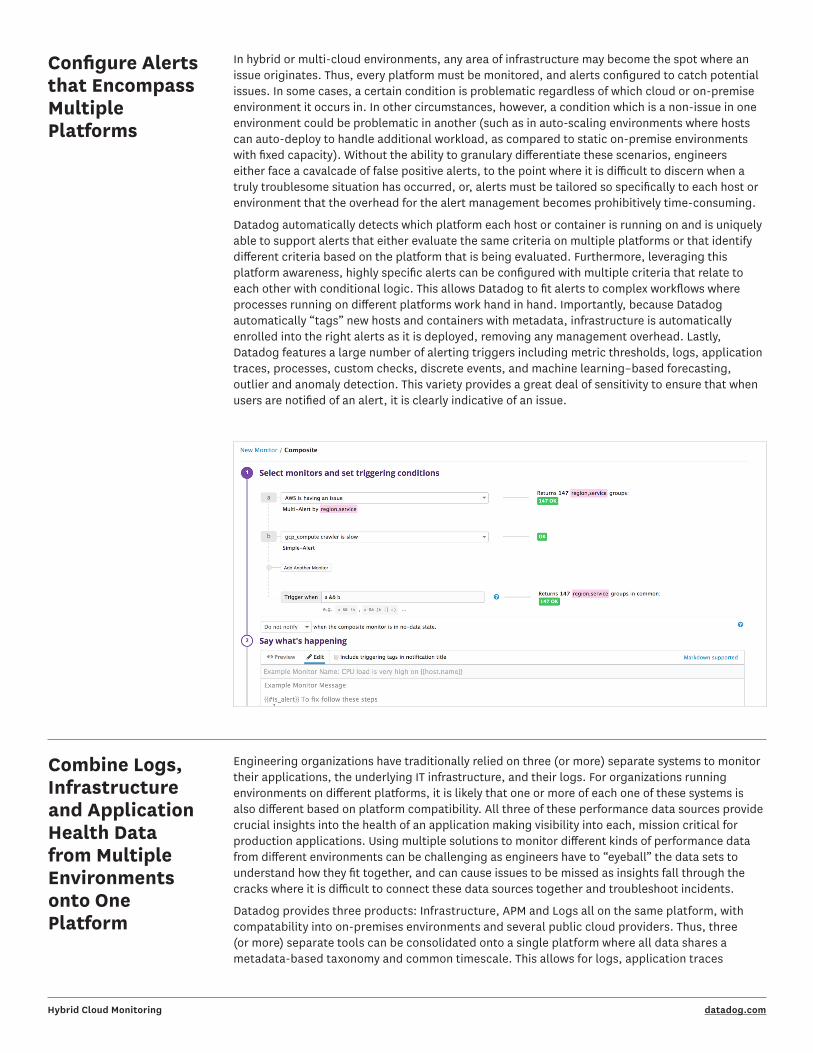
Simultaneously Observe Environments Running on Different Platforms
Instrumentation and tooling for on-premises infrastructure often does not have the capabilities to constantly sync and aggregate new and deleted hosts and containers from dynamic public cloud environments. At the same time, tools and services that are native to collecting performance data from cloud environments do not always have robust support for legacy platforms run on-premises. Thus, many engineering teams find it necessary to run separate tooling for their on-premises and cloud environments. This can be problematic however, when components from public cloud and on-premise environments depend on one another - “eyeball” comparisons are tedious and can lead to false insights as performance data may not totally match up. The potential for mismatched data is exacerbated if multiple public clouds are in use.
Datadog provides robust integration into a number of commonly used public clouds and virtualization platforms used on-premise, and can also be run on bare metal on-premises servers. Data is normalized against a universal timescale and tagged with metadata from a common taxonomy, allowing infrastructure metrics, application traces, logs and discrete events from multiple public clouds and on-premises environments to be ingested, queried and analyzed together on the same platform.
from these separate environments can be ingested into the same monitoring and analytics platform. Datadog then “tags” this data with metadata from a uniform taxonomy, and normalizes the data to be set on the same timescale. From here, data from across monitoring disciplines (logging, infrastructure monitoring and APM) as well as from multiple platforms and multiple regions in public clouds is available for dashboarding and alerting. Data from these separate sources can be jointly queried, combined, compared and correlated.
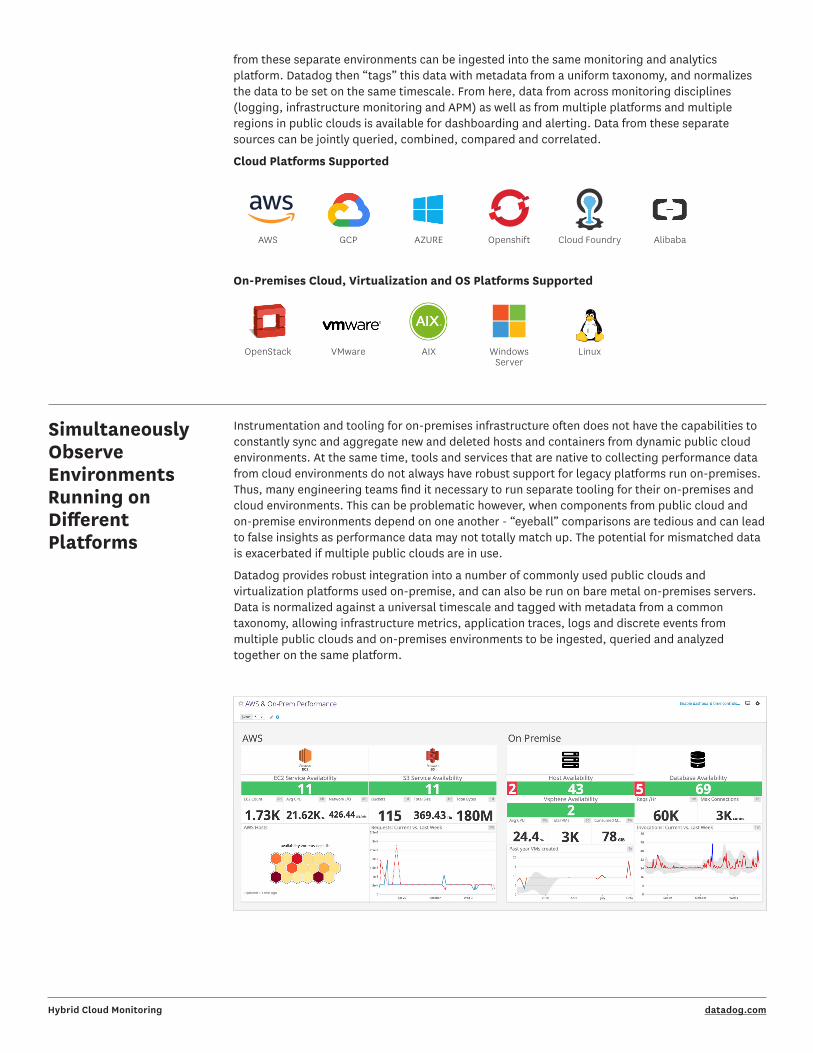
Cloud Platforms Supported
On-Premises Cloud, Virtualization and OS Platforms Supported
AWS GCP AZURE Openshift Cloud Foundry Alibaba
OpenStack VMware AIX Windows Server
Linux
Combine Logs, Infrastructure and Application Health Data from Multiple Environments onto One Platform
Engineering organizations have traditionally relied on three (or more) separate systems to monitor their applications, the underlying IT infrastructure, and their logs. For organizations running environments on different platforms, it is likely that one or more of each one of these systems is also different based on platform compatibility. All three of these performance data sources provide crucial insights into the health of an application making visibility into each, mission critical for production applications. Using multiple solutions to monitor different kinds of performance data from different environments can be challenging as engineers have to “eyeball” the data sets to understand how they fit together, and can cause issues to be missed as insights fall through the cracks where it is difficult to connect these data sources together and troubleshoot incidents.
Datadog provides three products: Infrastructure, APM and Logs all on the same platform, with compatability into on-premises environments and several public cloud providers. Thus, three (or more) separate tools can be consolidated onto a single platform where all data shares a metadata-based taxonomy and common timescale. This allows for logs, application traces
Configure Alerts that Encompass Multiple Platforms
Hybrid Cloud Monitoring datadog.com
In hybrid or multi-cloud environments, any area of infrastructure may become the spot where an issue originates. Thus, every platform must be monitored, and alerts configured to catch potential issues. In some cases, a certain condition is problematic regardless of which cloud or on-premise environment it occurs in. In other circumstances, however, a condition which is a non-issue in one environment could be problematic in another (such as in auto-scaling environments where hosts can auto-deploy to handle additional workload, as compared to static on-premise environments with fixed capacity). Without the ability to granulary differentiate these scenarios, engineers either face a cavalcade of false positive alerts, to the point where it is difficult to discern when a truly troublesome situation has occurred, or, alerts must be tailored so specifically to each host or environment that the overhead for the alert management becomes prohibitively time-consuming.
Datadog automatically detects which platform each host or container is running on and is uniquely able to support alerts that either evaluate the same criteria on multiple platforms or that identify different criteria based on the platform that is being evaluated. Furthermore, leveraging this platform awareness, highly specific alerts can be configured with multiple criteria that relate to each other with conditional logic. This allows Datadog to fit alerts to complex workflows where processes running on different platforms work hand in hand. Importantly, because Datadog automatically “tags” new hosts and containers with metadata, infrastructure is automatically enrolled into the right alerts as it is deployed, removing any management overhead. Lastly, Datadog features a large number of alerting triggers including metric thresholds, logs, application traces, processes, custom checks, discrete events, and machine learning–based forecasting, outlier and anomaly detection. This variety provides a great deal of sensitivity to ensure that when users are notified of an alert, it is clearly indicative of an issue.

and infrastructure metrics from multiple environments to be compared and correlated together in dashboards and alerts.
Robust Kubernetes, Mesos and Related Ecosystem Support for Multi-Platform and Multi-Region CI/CD
Route Alerts and Notifications to the Right Teams
For companies that have decided to replicate versions of an application across multiple platforms or regions of a public cloud with Kubernetes or Mesos, Datadog offers robust vendor-supported integrations to these open source projects, and multiple enabling technologies such as Docker, Consul, Marathon, Terraform, etcD and cloud-hosted services for these container orchestrators. Ultimately, engineering departments can monitor each platform, compare the performance of multiple platforms, and keep an eye on the CI/CD processes that are working to deploy changes and other commands uniformly across multiple, synchronized environments.
Companies that use multiple infrastructure platforms will either choose to run “bimodally”, with teams specifically dedicated to each platform, or will be dedicated per “service”, where a team is responsible for a component regardless of where it is running. Thus, alerts that are triggered on a component of an application or a specific piece of infrastructure need to be routed to the team or person that is uniquely responsible for that area. Datadog features robust notification tools that allow for each alert to go to the right person or people. These include:
Hybrid Cloud Monitoring datadog.com
Metrics
3 Pillars of observability
Traces
Hybrid Cloud Monitoring datadog.com
Effortlessly Disseminate Multi-Environment Changes to Dashboards and Alerts with Monitoring as Code
Changes such as configuration adjustments or upgrades to new versions can occur frequently in any platform. However, when multiple platforms are being used by an engineering department, changes are likely to come up much more frequently. A change in an environment can also require changes or additions to monitoring objects such as dashboards as alerts. Depending on the number of monitoring objects involved and the magnitude of the environmental changes, the adjustments that must be made in the monitoring system can become significant and time-consuming. With frequent changes, engineering teams can fall behind in making the needed adjustments, essentially creating monitoring blind spots where the changes are not made.
Datadog allows for changes to be made across large environments, with significant numbers of alerts and dashboards connected to those environment areas, with minimal effort. Datadog features a robust API whereby alerts and dashboards can be created programmatically. Thus, an entire monitoring setup can be housed as “code”, with adjustments made once to the code, and then disseminated widely in an instant via API.
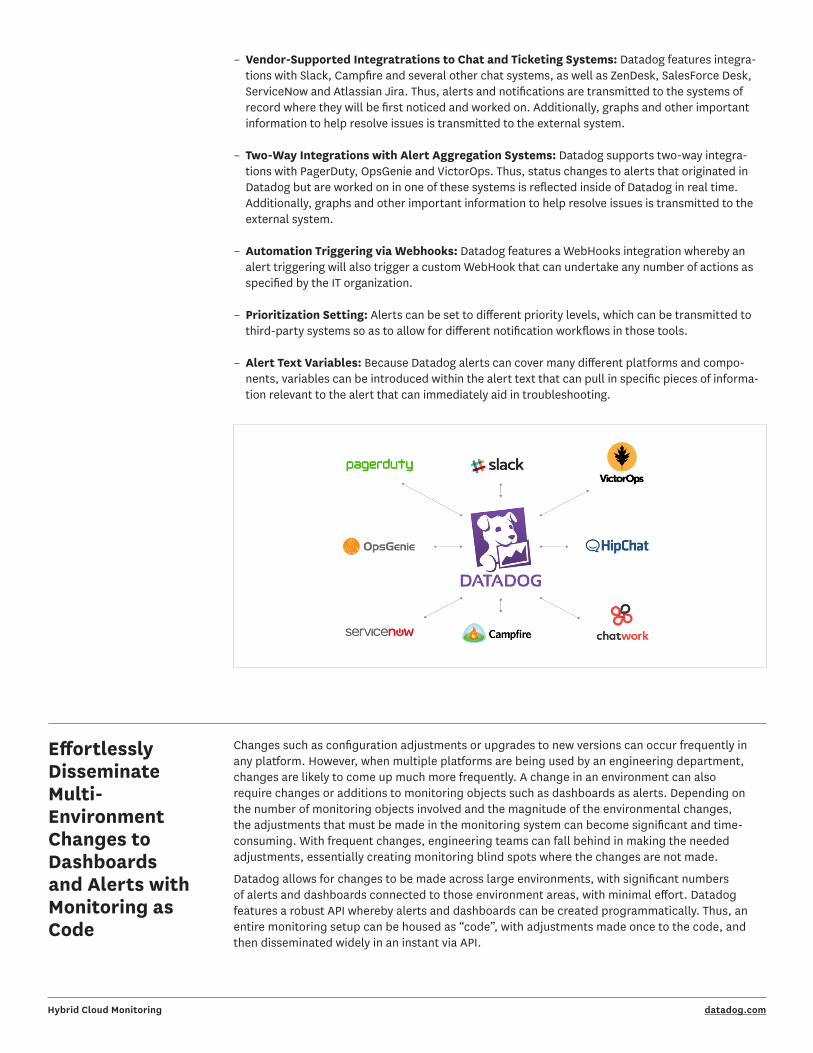
– Vendor-Supported Integratrations to Chat and Ticketing Systems: Datadog features integra-tions with Slack, Campfire and several other chat systems, as well as ZenDesk, SalesForce Desk, ServiceNow and Atlassian Jira. Thus, alerts and notifications are transmitted to the systems of record where they will be first noticed and worked on. Additionally, graphs and other important information to help resolve issues is transmitted to the external system.
– Two-Way Integrations with Alert Aggregation Systems: Datadog supports two-way integra-tions with PagerDuty, OpsGenie and VictorOps. Thus, status changes to alerts that originated in Datadog but are worked on in one of these systems is reflected inside of Datadog in real time. Additionally, graphs and other important information to help resolve issues is transmitted to the external system.
– Automation Triggering via Webhooks: Datadog features a WebHooks integration whereby an alert triggering will also trigger a custom WebHook that can undertake any number of actions as specified by the IT organization.
– Prioritization Setting: Alerts can be set to different priority levels, which can be transmitted to third-party systems so as to allow for different notification workflows in those tools.
– Alert Text Variables: Because Datadog alerts can cover many different platforms and compo-nents, variables can be introduced within the alert text that can pull in specific pieces of informa-tion relevant to the alert that can immediately aid in troubleshooting.
Hybrid Cloud Monitoring datadog.com
Benchmark Environments against Each Other or against Historical Performance
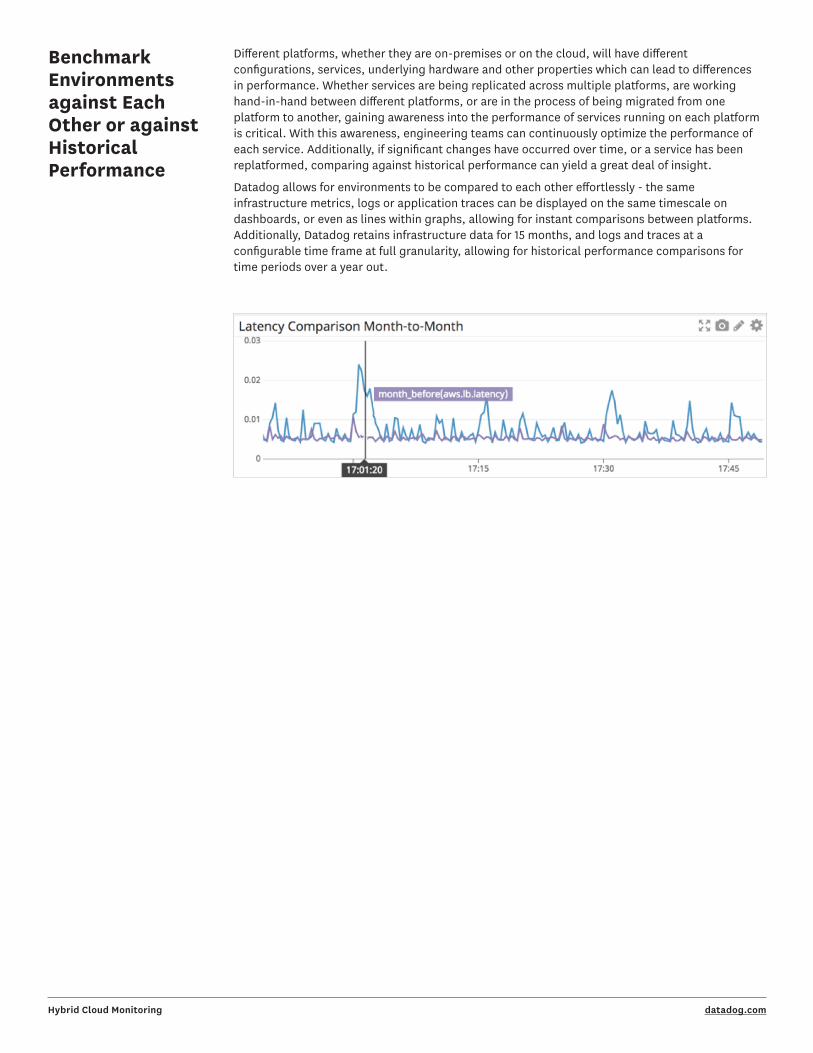
Different platforms, whether they are on-premises or on the cloud, will have different configurations, services, underlying hardware and other properties which can lead to differences in performance. Whether services are being replicated across multiple platforms, are working hand-in-hand between different platforms, or are in the process of being migrated from one platform to another, gaining awareness into the performance of services running on each platform is critical. With this awareness, engineering teams can continuously optimize the performance of each service. Additionally, if significant changes have occurred over time, or a service has been replatformed, comparing against historical performance can yield a great deal of insight.
Datadog allows for environments to be compared to each other effortlessly - the same infrastructure metrics, logs or application traces can be displayed on the same timescale on dashboards, or even as lines within graphs, allowing for instant comparisons between platforms. Additionally, Datadog retains infrastructure data for 15 months, and logs and traces at a configurable time frame at full granularity, allowing for historical performance comparisons for time periods over a year out.