date china autos -...
TRANSCRIPT

Deutsche Bank Markets Research
Industry
China Autos
Date
18 May 2016
Asia
China
Automobiles & Components
F.I.T.T. for investors
What you should know about China's new energy vehicle (NEV) market
Many players, but only a few are making meaningful earnings contributions
One can question China’s target to put 5m New Energy Vehicles on the road by 2020, or its ambition to prove itself a technology leader in the field, but the surge in demand with 171k vehicles sold in 4Q15 cannot be denied. Policy imperatives and government support could ensure three-fold volume growth by 2020, which would make China half of this developing global market. New entrants are proliferating, with few clear winners as yet, but we conclude that Yutong and BYD have the scale of NEV sales today to support Buy ratings.
Vincent Ha, CFA
Research Analyst
(+852 ) 2203 6247
Fei Sun, CFA
Research Analyst
(+852 ) 2203 6130
________________________________________________________________________________________________________________
Deutsche Bank AG/Hong Kong
Deutsche Bank does and seeks to do business with companies covered in its research reports. Thus, investors should be aware that the firm may have a conflict of interest that could affect the objectivity of this report. Investors should consider this report as only a single factor in making their investment decision. DISCLOSURES AND ANALYST CERTIFICATIONS ARE LOCATED IN APPENDIX 1. MCI (P) 057/04/2016.


Deutsche Bank Markets Research
Asia
China
Automobiles & Components
Industry
China Autos
Date
18 May 2016
FITT Research
What you should know about China's new energy vehicle (NEV) market
Many players, but only a few are making meaningful earnings contributions
________________________________________________________________________________________________________________
Deutsche Bank AG/Hong Kong
Deutsche Bank does and seeks to do business with companies covered in its research reports. Thus, investors should be aware that the firm may have a conflict of interest that could affect the objectivity of this report. Investors should consider this report as only a single factor in making their investment decision. DISCLOSURES AND ANALYST CERTIFICATIONS ARE LOCATED IN APPENDIX 1. MCI (P) 057/04/2016.
Vincent Ha, CFA
Research Analyst
(+852 ) 2203 6247
Fei Sun, CFA
Research Analyst
(+852 ) 2203 6130
Key Changes
Company Target Price Rating
1211.HK 47.00 to 50.80(HKD)
Hold to Buy
600066.SS – to 25.90(CNY) NR to Buy
002594.SZ 39.50 to 42.60(CNY)
-
Source: Deutsche Bank
Top picks
Yutong Bus (600066.SS),CNY21.66 Buy
Source: Deutsche Bank
Companies Featured
BYD (1211.HK),HKD42.15 Buy
2015A 2016E 2017E
P/E (x) 28.7 25.4 18.4
EV/EBITDA (x) 12.1 9.7 8.0
Price/book (x) 2.7 2.5 2.2
BAIC Motor (1958.HK),HKD5.40 Buy
2015A 2016E 2017E
P/E (x) 15.5 7.7 6.5
EV/EBITDA (x) 6.6 3.3 2.6
Price/book (x) 1.4 0.9 0.8
SAIC Motor (600104.SS),CNY19.81 Buy
2015A 2016E 2017E
P/E (x) 8.6 6.7 6.1
EV/EBITDA (x) 5.2 3.2 2.5
Price/book (x) 1.3 1.1 1.0
Yutong Bus (600066.SS),CNY21.66 Buy
2015A 2016E 2017E
P/E (x) 13.6 13.1 11.8
EV/EBITDA (x) 7.7 7.3 6.4
Price/book (x) 3.9 3.6 3.0
BYD-A (002594.SZ),CNY58.56 Sell
2015A 2016E 2017E
P/E (x) 50.4 41.9 30.4
EV/EBITDA (x) 18.5 14.1 11.7
Price/book (x) 4.9 4.1 3.6
Source: Deutsche Bank
One can question China’s target to put 5m New Energy Vehicles on the road by 2020, or its ambition to prove itself a technology leader in the field, but the surge in demand with 171k vehicles sold in 4Q15 cannot be denied. Policy imperatives and government support could ensure three-fold volume growth by 2020, which would make China half of this developing global market. New entrants are proliferating, with few clear winners as yet, but we conclude that Yutong and BYD have the scale of NEV sales today to support Buy ratings.
Clear intentions by the government and OEMs to drive up NEV ownership At a national level, by promoting the NEV industry, China can 1) reduce air pollution, 2) import less oil, and 3) compete globally for the latest auto technologies. Long-term, China could go a long way to achieve self-sufficiency along the whole industry supply chain. For auto manufacturers, NEV adoption is also vital to achieve their mandated fuel economy targets by 2020.
Most barriers are being tackled by monetary and regulatory initiatives A lack of infrastructure support and the price premium of NEVs are the most obvious barriers to stimulating real demand – their current premium is as much as 90-175%. Government policy and existing subsidy support are critical to stimulate demand currently but falling battery costs will narrow the price gap in the medium to long run. DB estimates powertrain costs could be cut 33% by 2020 (from the 2014 level). Nonetheless, we have concerns over the financial burden that subsidies place on local governments, and we think that an emission credit trading system could be a viable long-term solution beyond 2020.
China requires a 33% NEV volume CAGR to reach 2020 ownership target Sales have surged, with a 4-year increase of 40x in 2011-15 and 4Q15 growth of 4.4x, before a slowdown recently as subsidy cuts took effect, and while a subsidy cheating investigation is taking place. We project a 5-year sales CAGR of 33%, with China accounting for half of global EV/PHEV demand by 2020E. In our opinion, the constraints surrounding infrastructure (charging stations and poles) and production capacity can be resolved to enable this growth.
An increasingly crowded sector with limited almost-pure plays Among major auto manufacturers, BYD and Yutong have the largest NEV sales contributions in absolute and percentage terms vs. peers. The countless other traditional/non-traditional auto manufacturers/suppliers in the market are unlikely to record crucial NEV-related earnings contributions in the near future. In the upstream segment, strong China NEV sales should stimulate demand for lithium, and our Metals & Mining team rates Ganfeng a Buy (70.46 CNY).
Yutong is our top pick for NEV bus leadership and low valuation as NEV play We initiate coverage on Yutong with a Buy rating, based on its leadership in the bus segment (26% share of NEV sales) and an undemanding valuation of 12x. We upgrade BYD-H to Buy on its enhanced earnings outlook as the scale of NEV sales begins to materially drive earnings. We also highlight SAIC Motor and BAIC Motor, which have been adding weight to their NEV business. We therefore envision higher sales with new products and favorable local government policies for these two names. Key sector upside risks are incremental policy support and falling NEV costs. Key sector downside risks are lower subsidies, technology replacement, and over-competition.
In this report we change ratings,
target prices and estimates for
several companies under coverage.
Please refer to the company
specific sections for further details.
18 May 2016
Automobiles & Components
China Autos
Page 2 Deutsche Bank AG/Hong Kong
Table Of Contents
Executive summary ............................................................. 3
The big picture ..................................................................... 5
The challenges ................................................................... 12
The solution…? .................................................................. 19
The growth outlook ........................................................... 29
The supply chain ............................................................... 34
Stock implications ............................................................. 43
Sector risks ........................................................................ 48
Yutong Bus ........................................................................ 49
Investment thesis ............................................................................ 51
Valuation ......................................................................................... 52
Riding on the new energy drive ...................................................... 56
Financials ......................................................................................... 66
Risks ................................................................................................ 72
Company background ..................................................................... 73

18 May 2016
Automobiles & Components
China Autos
Deutsche Bank AG/Hong Kong Page 3
Executive summary
Stimulating NEV sales on all fronts in China
The development of China’s new energy vehicle (NEV) market has been in the
limelight since the early part of this decade, with obvious government
initiatives to: 1) tighten emission standards to close the gap with developed
regions; 2) contain overall fuel consumption to alleviate reliance on imported
oils; and above all, 3) gain ownership of the latest vehicle drivetrain
technologies, in particular those for electric vehicles (EV) and plug-in electric
vehicles (PHEV), so as to be competitive with global peers in the long run.
With battery costs still high, a significant price gap exists between China’s
NEVs and its comparable internal combustion engine (ICE) vehicles. To address
insufficient charging facilities, the central and local governments are now
heavily subsidizing NEV purchases and the cost of setup of charging networks.
Such efforts are augmented by local governments’ favorable policies on NEV
usage, like free license plates in Shanghai. That led to a surge in NEV sales
volume in 2014-15, especially in Beijing and Shanghai, where about 70% of
China’s NEVs were sold in 2015, by our estimates.
Yet, with such a rapid increase in NEV sales, we are concerned about the
implied financial burden on the government, especially at the local level.
Already, there are plans to scale back subsidies over the next five years and we
believe the government should follow up with a new NEV credit trading
system.
The public transportation market will be equally as important as supporting
demand from private car owners. In fact, the ability to quickly change emission
levels by overhauling the public bus transport system is already recognized by
government targets to have 200,000 public NEV buses by 2020. This has had
an immediate effect on demand, with about 60% of all commercial NEV sales
going to public bus companies, by our estimates.
We envision 33% demand CAGR in 2016-20E
Considering the government’s target of 5m units of NEVs on the road by
2020E, along with accompanying charging infrastructure, we expect China’s
NEV sales to have a 33% CAGR in 2015-20E. Our 2020 sales forecast of 1.36m
units implies China’s NEV sales will account for about 4.5% of the country’s
vehicle sales and 50% of global EV/PHEV sales.
The market will likely get crowded
With a rapid sales growth trajectory and the incentive of government support,
the China NEV sector has attracted numerous participants along the supply
chain, including even non-traditional entrants, e.g. internet companies.
However, among the NEV manufacturers in Hong Kong/China, we think that
Yutong and BYD (H-shares) make the best investments for their meaningful
NEV contributions.
Figure 1: China NEV sales volume
8,159 12,791 17,642
78,499
331,092
0%
50%
100%
150%
200%
250%
300%
350%
400%
0
50,000
100,000
150,000
200,000
250,000
300,000
350,000
2011 2012 2013 2014 2015
China NEV sales (units) YoY (RHS)(units) (YoY)
2011-15 volume CAGR: 152%
Source: China Association of Automobile Manufacturers (CAAM), Deutsche Bank

18 May 2016
Automobiles & Components
China Autos
Page 4 Deutsche Bank AG/Hong Kong
Yutong is the leader in the new energy bus segment, with a comprehensive
new energy bus model portfolio. We estimate the company will deliver a
35.4% new energy bus sales volume CAGR in 2015-18 and an 11.1% FY15-18E
three-year earnings CAGR. We initiate coverage on Yutong with a Buy
recommendation.
BYD’s conventional auto sales figures have been weak, with total house-brand
PV volume falling 12.6% YoY in 4M16, but demand for its house-brand
passenger NEVs and commercial NEVs (sales up 121.3% and 34.4% YoY
growth during the same period) has more than overshadowed ICE car sales
weakness. The company is also showing a significant margin lift in these NEV
products. We thus raise our earnings forecast for FY16-18E by 18.3-20.0%.
With this increased earnings outlook, we upgrade its H-shares to Buy.
Our Metals & Mining team also has a Buy recommendation on Ganfeng
Lithium (002460.SZ).
Figure 2: Zhengzhou Yutong Bus and BYD – valuation comparison as of 17 May 2016
Name Ticker Rating TP Price Mkt cap P/E (x) EPS growth (%) P/BV (x) EV/EBITDA (x) ROE (%)
(Local currency)
(Local currency)
(USDm) 2016E 2017E 2016E 2017E 2016E 2017E 2016E 2017E 2016E 2017E
Zhengzhou Yutong Bus
600066.SS Buy 25.9 21.58 7,324 13.1 11.8 12.5 11.1 3.57 3.02 7.3 6.4 29.3 29.9
BYD H-shares 1211.HK Buy 50.8 42.80 13,651 25.8 18.7 22.4 37.8 2.49 2.20 9.8 8.1 10.2 12.5
Source: Company data, Reuters, Deutsche Bank estimates
Figure 3: Key operating and financial metrics of BYD and Yutong’s NEV business
BYD Yutong
2015 house brand NEV sales 62,893 units (up 2.0x YoY) 2015 NEV sales 20,445 units (up 1.8x YoY)
2015 NEV sales volume as % of total sales volume
14.1% 2015 NEV sales volume as % of total sales volume
30.5%
2015 sales volume market share* 19.0% 2015 sales volume market share** 23.6%
2015 NEV sales revenue RMB19.0bn (up 1.6x YoY) 2015 NEV sales revenue RMB14.0bn (up 1.5x YoY)
2015 NEV revenue as % of total revenue 24.4% 2015 NEV revenue as % of total revenue 44.8% * Amongst all NEV sales; ** Amongst commercial NEV sales Source: Company data, CAAM, Deutsche Bank
Risks
Key sector upside risks are incremental policy support and falling NEV costs.
Key sector downside risks are sliding subsidy levels, technology replacement,
and over-competition.
18 May 2016
Automobiles & Components
China Autos
Deutsche Bank AG/Hong Kong Page 5
The big picture
Key points
We identify three key incentives for the Chinese government to
promote the NEV market: 1) environmental concerns; 2) less oil import
reliance; and 3) ownership of the latest auto technologies.
Auto manufacturers are increasingly keen on NEV adoption, as it is a
crucial means to achieve compliance with mandated 2020 fuel
economy limits, while we also see opportunities in conventional hybrid
technologies.
Domestic Chinese auto manufacturers have a wide conventional
engine technology gap vs. global peers; excelling in NEV technologies
will help them close the gap for future auto drivetrain technology, in
our view.
Why push for NEV consumption?
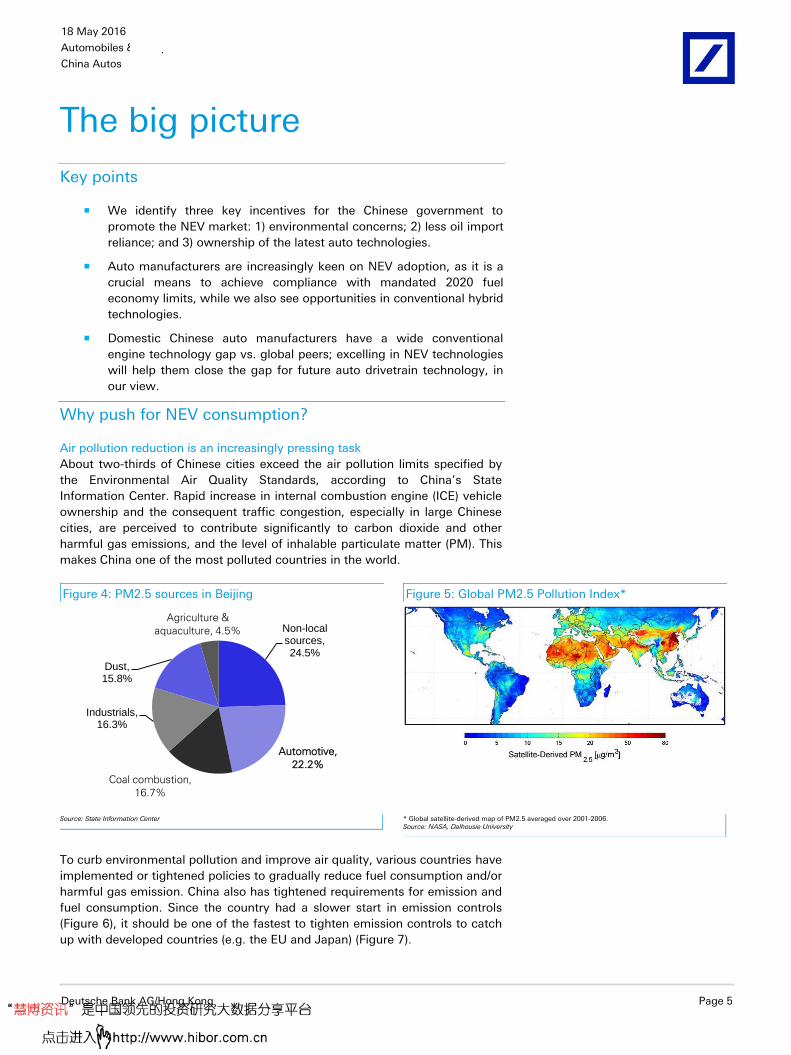
Air pollution reduction is an increasingly pressing task
About two-thirds of Chinese cities exceed the air pollution limits specified by
the Environmental Air Quality Standards, according to China’s State
Information Center. Rapid increase in internal combustion engine (ICE) vehicle
ownership and the consequent traffic congestion, especially in large Chinese
cities, are perceived to contribute significantly to carbon dioxide and other
harmful gas emissions, and the level of inhalable particulate matter (PM). This
makes China one of the most polluted countries in the world.
Figure 4: PM2.5 sources in Beijing Figure 5: Global PM2.5 Pollution Index*
Non-local sources, 24.5%
Industrials, 16.3%
Dust, 15.8%
Automotive,
22.2%
Coal combustion,
16.7%
Agriculture &
aquaculture, 4.5%
Source: State Information Center
* Global satellite-derived map of PM2.5 averaged over 2001-2006. Source: NASA, Dalhousie University
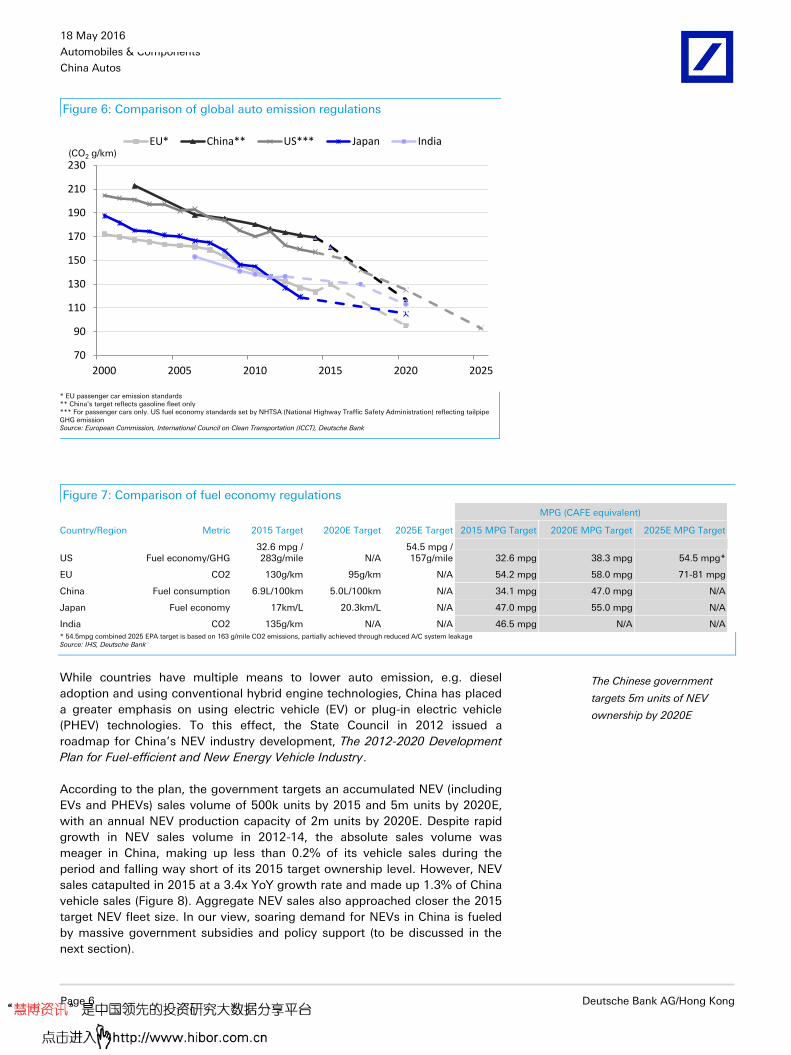
To curb environmental pollution and improve air quality, various countries have
implemented or tightened policies to gradually reduce fuel consumption and/or
harmful gas emission. China also has tightened requirements for emission and
fuel consumption. Since the country had a slower start in emission controls
(Figure 6), it should be one of the fastest to tighten emission controls to catch
up with developed countries (e.g. the EU and Japan) (Figure 7).
18 May 2016
Automobiles & Components
China Autos
Page 6 Deutsche Bank AG/Hong Kong
Figure 6: Comparison of global auto emission regulations
70
90
110
130
150
170
190
210
230
2000 2005 2010 2015 2020 2025
EU* China** US*** Japan India(CO2 g/km)
* EU passenger car emission standards ** China's target reflects gasoline fleet only *** For passenger cars only. US fuel economy standards set by NHTSA (National Highway Traffic Safety Administration) reflecting tailpipe GHG emission Source: European Commission, International Council on Clean Transportation (ICCT), Deutsche Bank
Figure 7: Comparison of fuel economy regulations
MPG (CAFE equivalent)
Country/Region Metric 2015 Target 2020E Target 2025E Target 2015 MPG Target 2020E MPG Target 2025E MPG Target
US Fuel economy/GHG 32.6 mpg / 283g/mile N/A
54.5 mpg / 157g/mile 32.6 mpg 38.3 mpg 54.5 mpg*
EU CO2 130g/km 95g/km N/A 54.2 mpg 58.0 mpg 71-81 mpg
China Fuel consumption 6.9L/100km 5.0L/100km N/A 34.1 mpg 47.0 mpg N/A
Japan Fuel economy 17km/L 20.3km/L N/A 47.0 mpg 55.0 mpg N/A
India CO2 135g/km N/A N/A 46.5 mpg N/A N/A * 54.5mpg combined 2025 EPA target is based on 163 g/mile CO2 emissions, partially achieved through reduced A/C system leakage Source: IHS, Deutsche Bank
While countries have multiple means to lower auto emission, e.g. diesel
adoption and using conventional hybrid engine technologies, China has placed
a greater emphasis on using electric vehicle (EV) or plug-in electric vehicle
(PHEV) technologies. To this effect, the State Council in 2012 issued a
roadmap for China’s NEV industry development, The 2012-2020 Development
Plan for Fuel-efficient and New Energy Vehicle Industry.
According to the plan, the government targets an accumulated NEV (including
EVs and PHEVs) sales volume of 500k units by 2015 and 5m units by 2020E,
with an annual NEV production capacity of 2m units by 2020E. Despite rapid
growth in NEV sales volume in 2012-14, the absolute sales volume was
meager in China, making up less than 0.2% of its vehicle sales during the
period and falling way short of its 2015 target ownership level. However, NEV
sales catapulted in 2015 at a 3.4x YoY growth rate and made up 1.3% of China
vehicle sales (Figure 8). Aggregate NEV sales also approached closer the 2015
target NEV fleet size. In our view, soaring demand for NEVs in China is fueled
by massive government subsidies and policy support (to be discussed in the
next section).
The Chinese government
targets 5m units of NEV
ownership by 2020E

18 May 2016
Automobiles & Components
China Autos
Deutsche Bank AG/Hong Kong Page 7
Figure 8: China annual NEV sales volume and growth trend
8,159 12,791 17,642
78,499
331,092
0%
50%
100%
150%
200%
250%
300%
350%
400%
0
50,000
100,000
150,000
200,000
250,000
300,000
350,000
2011 2012 2013 2014 2015
China NEV sales (units) YoY (RHS)(units) (YoY)
2011-15 volume CAGR: 152%2020E target: 5m units ownership
Source: CAAM, Deutsche Bank
China reduces reliance on crude oil imports
Together with the development of the Chinese economy, growth of automotive
ownership in China has resulted in a rapid increase in oil consumption. To
elaborate, vehicle ownership grew from 5.5m units in 1990 to 146.0m units in
2014 (representing a 24-year CAGR of 14.6%), while crude oil consumption
increased from 117.6m tons in 1990 to 544.3m tons in 2015 (at a 25-year
CAGR of 6.3%).
According to the National Bureau of Statistics, China imported about 330m
tons of crude oil in 2015, accounting for about 61% of the country’s total crude
consumption. The nation is increasingly dependent on global crude supply to
fuel its economic development and expanding vehicle fleet size. We think the
Chinese government is uncomfortable about such high oil import reliance and
hence would make efforts to lower that, i.e. by improving ICE fuel efficiency
and to popularize NEV usage.
Figure 9: China vehicle ownership Figure 10: Crude oil output and import volume
0
20,000
40,000
60,000
80,000
100,000
120,000
140,000
160,000
1990
1992
1994
1996
1998
2000
2002
2004
2006
2008
2010
2012
2014
PV ownership CV ownership(th units)
Total vehicle ownership 14.6% CAGR in 1990-2014
0
100
200
300
400
500
600
1990
1992
1994
1996
1998
2000
2002
2004
2006
2008
2010
2012
2014
Domestic production Imports(mn tons)
Total crude consumption 6.3% CAGR in 1990-2015Crude imports 20.8% CAGR in 1990-2015
Source: CEIC
Source: National Bureau of Statistics

18 May 2016
Automobiles & Components
China Autos
Page 8 Deutsche Bank AG/Hong Kong
Figure 11: Vehicle ownership growth vs. crude oil consumption
0%
10%
20%
30%
40%
50%
60%
70%
0
20,000
40,000
60,000
80,000
100,000
120,000
140,000
160,0001990
1992
1994
1996
1998
2000
2002
2004
2006
2008
2010
2012
2014
Total vehicle ownership (LHS)
Crude imports as % of total consumption (RHS)
(th units) (%)
Source: CEIC, National Bureau of Statistics
A crucial means for OEMs to achieve fuel efficiency targets
As mentioned earlier, China’s Ministry of Industry and Information Technology
(MIIT) has asked the country’s auto manufacturers to comply with the volume-
based weighted-average fuel consumption limit of 6.9L/100km by 2015 and
5.0L/100km by 2020. For auto groups that fail to achieve the targets, MIIT will
block their new model registrations and new capacity expansion plans, if any.
Besides these, manufacturers could be subjected to heavy fines if they
continue to breach the 5L/100km limit beyond 2020E.
In June 2015, MIIT released an update on fuel consumption requirements for
passenger cars and reiterated the consumption target for 2014. Among the
116 auto manufacturers that MIIT examined, 38 failed to comply with the
respective targets set for 2014, according to the announcement (Figure 12).
We do not think the 2015 target is hard to achieve. Most manufacturers can
probably comply by cutting old fuel-insufficient models, utilizing more compact
turbo-charged engines, introducing newer fuel-saving technologies such as
engine start-stop function, and launching NEVs. Yet, we foresee that OEMs,
especially high-fuel-consuming SUV and/or premium-focused manufacturers,
will be more incentivized to launch more NEVs to lower their average
consumption level.
That being said, even if one assumes 2020E ICE vehicles could achieve
average fuel efficiency of 5.5L/100km, a 10% EV sales penetration will still be
required theoretically. This equation appears to be impossible (more discussion
on this in the sections ahead), and hence we think a window of opportunity
still exists for conventional hybrid vehicles, like those pioneered by Toyota
(7203.T) to help lower fuel consumption.
Fuel consumption target:
5.0L/100km by 2020E

18 May 2016
Automobiles & Components
China Autos
Deutsche Bank AG/Hong Kong Page 9
Figure 12: China – a sample of major auto entities’ average fuel consumption
2014 production
(units)
Avg. fuel consumption (L/100km)
Complied Local auto production entity 2014 target 2014 actual
BYD (partial) 210,269 7.29 6.24 Yes
Dongfeng Honda 320,293 8.16 7.75 Yes
Dongfeng Nissan 936,133 7.42 6.78 Yes
Dongfeng Yueda Kia 644,166 7.28 7.00 Yes
Guangqi Honda 511,191 7.67 6.89 Yes
GAC Toyota 379,923 8.10 7.89 Yes
Brilliance BMW 287,340 8.85 7.06 Yes
Chery 323,486 7.44 7.15 Yes
SAIC Roewe 170,165 7.50 7.22 Yes
Shanghai GM (Shenyang) 385,448 8.13 8.01 Yes
Shanghai GM Dongyue 636,884 7.34 6.82 Yes
Shanghai GM 658,844 8.13 7.86 Yes
Shanghai GM Wuling 1,545,177 7.14 7.08 Yes
Shanghai Volkswagen 1,718,438 7.53 6.86 Yes
Dongfeng PSA 716,032 7.61 7.32 Yes
Chang'an Ford 749,333 8.00 7.16 Yes
Great Wall Motor 579,628 7.93 7.11 Yes
Zhejiang Haoqing (part of Geely) 201,355 7.25 7.06 Yes
Zhejiang Geely 155,228 7.13 6.16 Yes
Chang'an own brand 927,955 7.13 6.66 Yes
Tianjin FAW Toyota 441,876 7.20 6.40 Yes
FAW Besturn/Mazda/Red Flag 296,366 8.05 8.18 No
GAC Trumpchi 136,546 8.33 8.55 No
BAIC Group Yinxiang 162,954 7.15 7.34 No
Imports
Mercedes Benz 146,204 9.64 8.15 Yes
BMW 193,131 9.31 7.95 Yes
FAW Import (Audi) 84,197 9.75 8.59 Yes
Toyota 100,247 9.29 8.51 Yes
Jaguar Land Rover 127,210 10.35 9.38 Yes
Chrysler 128,052 9.37 9.43 No
Source: Ministry of Industry and Information (MIIT), Deutsche Bank
Why promote mainly EVs and PHEVs, not hybrids?
Diesel adoption and conventional hybrid technologies are mainstream routes
by which to lower fuel consumption and emission. Thus, the market may
wonder why the Chinese government is aggressively pushing the adoption of
EVs and PHEVs to combat environment pollution, rather than using
conventional hybrid cars and ICE efficiency improvement as a transitional
measure first.
To begin with, we believe EV and PHEV are the most direct technology
measures to achieve low fuel economy. We think improving the efficiency of
ICEs will become more and more costly to do, despite their low combustion
efficiency (i.e. power conversion ratio), and the marginal cost of improving a
traditional ICE will keep increasing.
Costly to comply with China’s
2020E emission target
through the efficiency
improvement of ICE vehicles
18 May 2016
Automobiles & Components
China Autos
Page 10 Deutsche Bank AG/Hong Kong
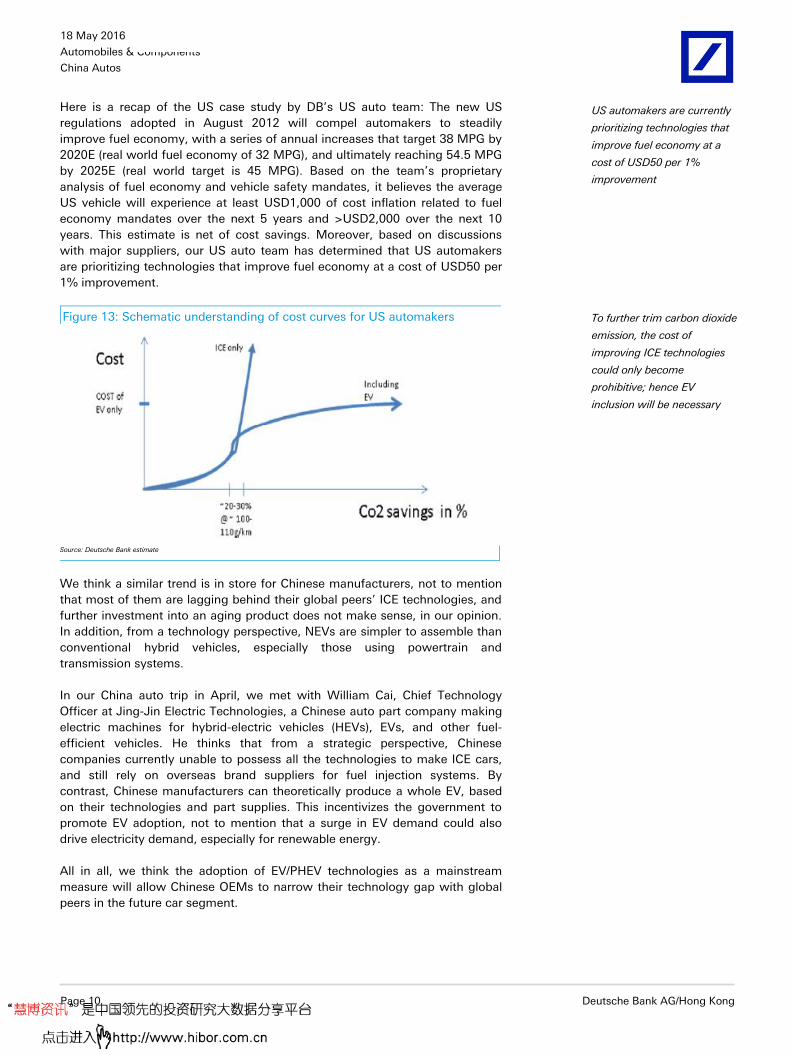
Here is a recap of the US case study by DB’s US auto team: The new US
regulations adopted in August 2012 will compel automakers to steadily
improve fuel economy, with a series of annual increases that target 38 MPG by
2020E (real world fuel economy of 32 MPG), and ultimately reaching 54.5 MPG
by 2025E (real world target is 45 MPG). Based on the team’s proprietary
analysis of fuel economy and vehicle safety mandates, it believes the average
US vehicle will experience at least USD1,000 of cost inflation related to fuel
economy mandates over the next 5 years and >USD2,000 over the next 10
years. This estimate is net of cost savings. Moreover, based on discussions
with major suppliers, our US auto team has determined that US automakers
are prioritizing technologies that improve fuel economy at a cost of USD50 per
1% improvement.
Figure 13: Schematic understanding of cost curves for US automakers
Source: Deutsche Bank estimate
We think a similar trend is in store for Chinese manufacturers, not to mention
that most of them are lagging behind their global peers’ ICE technologies, and
further investment into an aging product does not make sense, in our opinion.
In addition, from a technology perspective, NEVs are simpler to assemble than
conventional hybrid vehicles, especially those using powertrain and
transmission systems.
In our China auto trip in April, we met with William Cai, Chief Technology
Officer at Jing-Jin Electric Technologies, a Chinese auto part company making
electric machines for hybrid-electric vehicles (HEVs), EVs, and other fuel-
efficient vehicles. He thinks that from a strategic perspective, Chinese
companies currently unable to possess all the technologies to make ICE cars,
and still rely on overseas brand suppliers for fuel injection systems. By
contrast, Chinese manufacturers can theoretically produce a whole EV, based
on their technologies and part supplies. This incentivizes the government to
promote EV adoption, not to mention that a surge in EV demand could also
drive electricity demand, especially for renewable energy.
All in all, we think the adoption of EV/PHEV technologies as a mainstream
measure will allow Chinese OEMs to narrow their technology gap with global
peers in the future car segment.
US automakers are currently
prioritizing technologies that
improve fuel economy at a
cost of USD50 per 1%
improvement
To further trim carbon dioxide
emission, the cost of
improving ICE technologies
could only become
prohibitive; hence EV
inclusion will be necessary

18 May 2016
Automobiles & Components
China Autos
Deutsche Bank AG/Hong Kong Page 11
Figure 14: Basic EV architecture Figure 15: Basic PHEV architecture (parallel system)
MotorMotor
controllerBattery
BMS
Mechanical
Electrical
MotorMotor
controllerBattery
BMS
Mechanical
Electrical
Torquecoupler
Engine
EMS
BMS – Battery management system Source: Deutsche Bank
EMS – Engine management system Source: Deutsche Bank

18 May 2016
Automobiles & Components
China Autos
Page 12 Deutsche Bank AG/Hong Kong
The challenges
Key points
We identify three key challenges for the current NEV market:
1) insufficient infrastructure support; 2) the NEV price premium; and 3)
an increasing number of industry participants.
On infrastructure and product pricing concerns, the government’s
policy push and subsidy support should help spur NEW demand while
declining battery cost would help to narrow the price gap.
Meanwhile, market expectation of a much bigger NEV fleet in the
future has attracted non-traditional auto/part companies to enter the
industry, raising the risk of more intensive future competition.
Infrastructure, a mental barrier to be removed gradually
One common concern that holds back individual NEV consumption is the
limited availability of charging networks, in our view. In a proprietary survey of
Chinese car owners conducted by Deutsche Bank in late 2014, we found that
inadequate charging infrastructure build-out appeared to be the largest
concern for potential buyers (Figure 16). For detailed survey results, please
refer to our FITT report, “What do the upgraders say?” dated 18 Nov 2014.
Figure 16: Car owners’ reasons for not considering NEVs
3%
8%
15%
17%
23%
33%
0% 10% 20% 30% 40%
Other
Government incentives not sufficient
Price too high
Short driving range
Limited available models
Limited charging infrastructure
Source: China Auto Market, Deutsche Bank
In our view, the lack of existing infrastructure networks is due to 1) a lack of
space, in particularly around older residential communities, to set up charging
poles, and 2) limited potential financial return to make it worthwhile to
establish charging networks, especially high-voltage fast-charging stations.

18 May 2016
Automobiles & Components
China Autos
Deutsche Bank AG/Hong Kong Page 13
Figure 17: Construction cost estimate for charging poles and charging
stations in China
Charging time Construction cost (RMB)
Slow charging pole 5-8 hours to full charge ~20,000
Fast charging pole 1 hour to full charge 100,000-200,000
Charging station* NA Several millions to 1bn+ * The construction cost of a charging station with 10+ charging poles, include the infrastructure, power distribution, and operation costs, but excludes land use fees Source: Sohu news, Sina news, Liao Wang Institution, Deutsche Bank
Nevertheless, we notice that the Chinese government has issued three major
policies in the past three years to promote the construction and commercial
operations of NEV charging infrastructure (Figure 18).
Figure 18: List of major NEV charging infrastructure policies
Date Policy Brief comments
July 2014 Guidelines to Promote the Adoption of New Energy Vehicles
国务院办公厅关于加快新能源汽车推广应用的
指导意见
1) Encouraging private capital to invest in infrastructure construction;
2) Granting admission to the commercial operations of charging stations
September 2015 Guidelines to Promote the Construction of Charging Infrastructure for New Energy Vehicles
国务院办公厅关于加快电动汽车充电基础设施
建设的指导意见
1) Targeting sufficient charging capacity installed to satisfy charging needs for at least 5m NEVs by 2020;
2) Continuing to encourage private capital investment and commercialized operations of charging stations;
3) Requiring newly-constructed residential properties to equip all parking lots with charging facilities or upgrade capacity to accommodate charging poles in future;
4) Requiring large-scale commercial buildings and public parking places to have at least 10% of their parking bays equipped with charging facilities;
5) Requiring local governments to build at least one public charging station for every 2,000 units of NEV ownership;
6) Applying preferential tariffs to commercial electric charging stations
January 2016 Notice of Incentive Policy on Charging Infrastructure for New Energy Vehicles in the 13th Five-Year Plan
关于“十三五”新能源汽车充电基础设施奖励政
策及加强新能源汽车推广应用的通知
1) Central government to allocate dedicated fiscal funds to subsidize charging infrastructure construction and operations during 2016-20;
2) Local governments are required to establish detailed local NEV promotion plans and eliminate local protectionism in NEV subsidies and charging facility operations
Source: China’s State Council, Ministry of Finance (MOF), Ministry of Science and Technology (MOST), MIIT, National Development and Reform Commission (NDRC), National Energy Administration (NEA), Deutsche Bank
In the State Council’s July 2014 document, Guidelines to Promote the Adoption
of New Energy Vehicles, the council called to accelerate the construction of
charging facilities by:
Formulating development plans for charging infrastructure and
industry technology standards;
Incorporating adequate capacity of charging facilities in city planning,
including public parking lots and commodity buildings;
Establishing relevant policies on price schemes for vehicle charging;
Encouraging private capital to invest in infrastructure construction;
Granting admission to commercial operations of charging stations;
Promoting R&D on key charging technologies, etc.
In line with the government’s push, China’s State Grid announced in May 2014
that it would open up charging pole infrastructure construction for NEVs to
private investment. NEV owners can also have charging poles built for their
own use at their own designated parking bays.
18 May 2016
Automobiles & Components
China Autos
Page 14 Deutsche Bank AG/Hong Kong
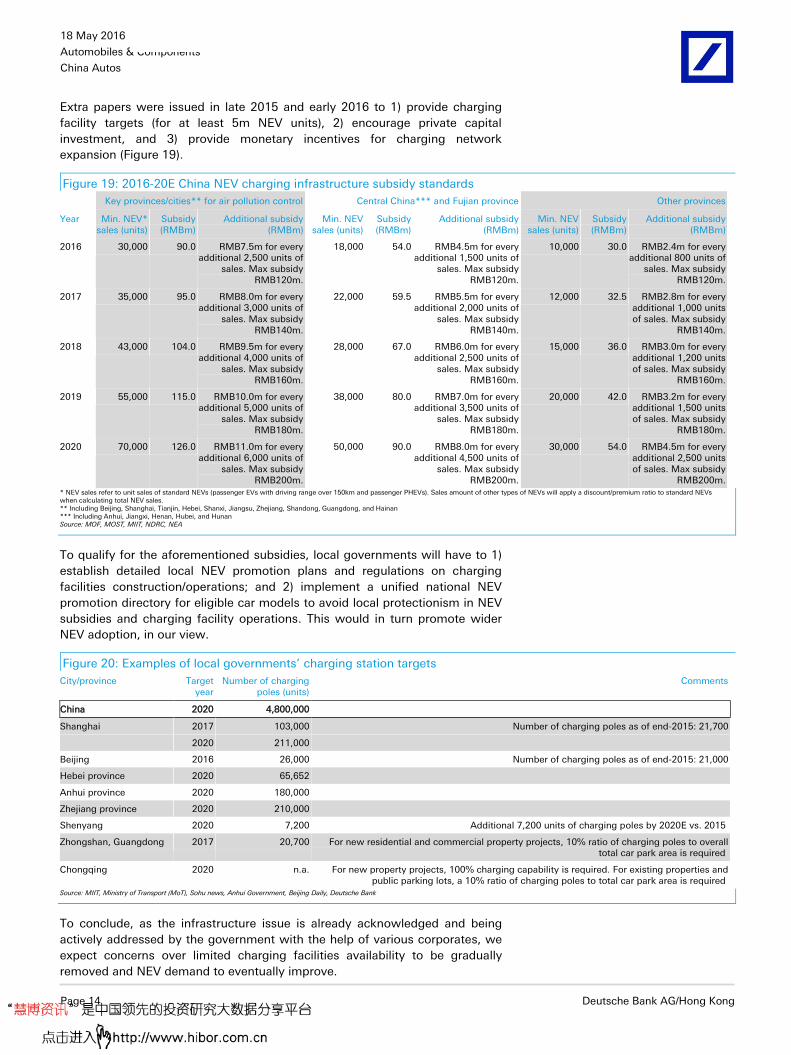
Extra papers were issued in late 2015 and early 2016 to 1) provide charging
facility targets (for at least 5m NEV units), 2) encourage private capital
investment, and 3) provide monetary incentives for charging network
expansion (Figure 19).
Figure 19: 2016-20E China NEV charging infrastructure subsidy standards
Key provinces/cities** for air pollution control Central China*** and Fujian province Other provinces
Year Min. NEV* sales (units)
Subsidy (RMBm)
Additional subsidy (RMBm)
Min. NEV sales (units)
Subsidy (RMBm)
Additional subsidy (RMBm)
Min. NEV sales (units)
Subsidy (RMBm)
Additional subsidy (RMBm)
2016 30,000 90.0 RMB7.5m for every additional 2,500 units of
sales. Max subsidy RMB120m.
18,000 54.0 RMB4.5m for every additional 1,500 units of
sales. Max subsidy RMB120m.
10,000 30.0 RMB2.4m for every additional 800 units of
sales. Max subsidy RMB120m.
2017 35,000 95.0 RMB8.0m for every additional 3,000 units of
sales. Max subsidy RMB140m.
22,000 59.5 RMB5.5m for every additional 2,000 units of
sales. Max subsidy RMB140m.
12,000 32.5 RMB2.8m for every additional 1,000 units of sales. Max subsidy
RMB140m.
2018 43,000 104.0 RMB9.5m for every additional 4,000 units of
sales. Max subsidy RMB160m.
28,000 67.0 RMB6.0m for every additional 2,500 units of
sales. Max subsidy RMB160m.
15,000 36.0 RMB3.0m for every additional 1,200 units of sales. Max subsidy
RMB160m.
2019 55,000 115.0 RMB10.0m for every additional 5,000 units of
sales. Max subsidy RMB180m.
38,000 80.0 RMB7.0m for every additional 3,500 units of
sales. Max subsidy RMB180m.
20,000 42.0 RMB3.2m for every additional 1,500 units of sales. Max subsidy
RMB180m.
2020 70,000 126.0 RMB11.0m for every additional 6,000 units of
sales. Max subsidy RMB200m.
50,000 90.0 RMB8.0m for every additional 4,500 units of
sales. Max subsidy RMB200m.
30,000 54.0 RMB4.5m for every additional 2,500 units of sales. Max subsidy
RMB200m. * NEV sales refer to unit sales of standard NEVs (passenger EVs with driving range over 150km and passenger PHEVs). Sales amount of other types of NEVs will apply a discount/premium ratio to standard NEVs when calculating total NEV sales. ** Including Beijing, Shanghai, Tianjin, Hebei, Shanxi, Jiangsu, Zhejiang, Shandong, Guangdong, and Hainan *** Including Anhui, Jiangxi, Henan, Hubei, and Hunan Source: MOF, MOST, MIIT, NDRC, NEA
To qualify for the aforementioned subsidies, local governments will have to 1)
establish detailed local NEV promotion plans and regulations on charging
facilities construction/operations; and 2) implement a unified national NEV
promotion directory for eligible car models to avoid local protectionism in NEV
subsidies and charging facility operations. This would in turn promote wider
NEV adoption, in our view.
Figure 20: Examples of local governments’ charging station targets
City/province Target year
Number of charging poles (units)
Comments
China 2020 4,800,000
Shanghai 2017 103,000 Number of charging poles as of end-2015: 21,700
2020 211,000
Beijing 2016 26,000 Number of charging poles as of end-2015: 21,000
Hebei province 2020 65,652
Anhui province 2020 180,000
Zhejiang province 2020 210,000
Shenyang 2020 7,200 Additional 7,200 units of charging poles by 2020E vs. 2015
Zhongshan, Guangdong 2017 20,700 For new residential and commercial property projects, 10% ratio of charging poles to overall total car park area is required
Chongqing 2020 n.a. For new property projects, 100% charging capability is required. For existing properties and public parking lots, a 10% ratio of charging poles to total car park area is required
Source: MIIT, Ministry of Transport (MoT), Sohu news, Anhui Government, Beijing Daily, Deutsche Bank
To conclude, as the infrastructure issue is already acknowledged and being
actively addressed by the government with the help of various corporates, we
expect concerns over limited charging facilities availability to be gradually
removed and NEV demand to eventually improve.

18 May 2016
Automobiles & Components
China Autos
Deutsche Bank AG/Hong Kong Page 15
Figure 21: Examples of corporate participation in setting up charging facilities
in China
Company Descriptions
BMW In cooperation with China Potevio, BMW plans to build 1,000 charging poles in 12 cities by the end of 2016E
Tesla Has built 3,644 charging poles and 616 charging stations around China
State Grid Plans to build 10,000 charging stations around China in 2016-20E
Potevio Plans to build 10,000 charging poles around Beijing by the end of 2018E
EV Power Plans to build not less than 5,000 charging stations around China in 2016E
BAIC BJEV Plans to build 10,000 charging poles by the end of 2016E
Source: Market news, Company press releases, Deutsche Bank
High price tags to be reduced in 10 years
Another factor that holds back NEV consumption, from consumers’ viewpoint,
is the price differential between an NEV and a conventional ICE vehicle of a
comparable size (Figure 16). On our estimates, a manufacturer’s suggested
retail price (MSRP) of an NEV, even after government subsidy, is in general
more than double the MSRP of its comparable ICE variant. The difference
would be much less if we also included extra policy support, such as a
purchase tax waiver (valued at 10% of ex-value-added-tax MSRP) and free
license plates, as in the case of Shanghai (valued at about RMB80,000-90,000).
Figure 22: Price comparison of major Chinese NEV models and their counterparts in Shanghai
Company NEV model MSRP* (RMB)
Comparable ICE model
MSRP* (RMB)
NEV premium
Company NEV model MSRP* (RMB)
Comparable ICE model
MSRP* (RMB)
NEV premium
BYD Qin PHEV 169,800 Surui 69,900 143% BAIC EV160 EV 102,800 Senova D20 48,800 111%
BYD Qin EV 174,800 Surui 69,900 150% BAIC EV200 EV 133,900 Senova D20 48,800 174%
BYD Tang PHEV 208,300 S7 106,900 95% SAIC Roewe e550 PHEV 185,800 Roewe 550 99,800 86% *All MSRPs are for lowest-end trims and their options may vary. NEV MSRPs are based on ex-subsidy MSRP – 2016 central government subsidy – 2016 Shanghai government subsidy and exclude OEM incentives. Source: Company data, Deutsche Bank
We believe the reason behind NEVs’ higher selling prices is the still-high
battery cost in electric powertrains, especially in EVs with longer driving
distances. According to the FITT report, “Pricing The Car of Tomorrow”,
published by Deutsche Bank’s global auto team in December 2014, a 47kWh
battery pack (for a 200-mile driving range) cost USD10,575 in 2014, and it
accounts for 91% of the total cost of an electric powertrain.

18 May 2016
Automobiles & Components
China Autos
Page 16 Deutsche Bank AG/Hong Kong
Figure 23: Cost trajectories of electric powertrains (USD)
Source: Deutsche Bank, Argonne National Labs, Supplier Estimates, Industry Experts
However, with technical advancements in battery cell/pack technology, the
cost of electrification is estimated to decline gradually over the next decade.
Our global auto team believes battery pack cost targets in the USD150/kWh
range are realistic over the next 5 years, and costs could decline to
USD100/kWh in less than 10 years. They project the cost of a 47kWh battery
pack will drop to USD7,050 in 2020E and USD5,546 in 2025E, resulting in a
46% decrease in the total cost of an electric powertrain by 2025E vs. 2014.
The reduction in battery cost will serve as a catalyst for significant expansion
in volume, as it will enable electrified powertrains to reach cost parity with
more advanced ICE powertrains, and in some cases lower cost (Figure 25).
While significant opportunities still exist to improve the efficiency of
conventional ICE, we expect the marginal cost of squeezing additional
efficiency from internal combustion vehicles to increase significantly, making a
more fuel-efficient ICE a less cost-effective measure.
We expect EV battery cost to
lower by almost half in the
next 10 years, making NEVs
more affordable even without
subsidies

18 May 2016
Automobiles & Components
China Autos
Deutsche Bank AG/Hong Kong Page 17
Figure 24: Average cost of ICE vehicle (USD)
Figure 25: Comparison of cost trajectories of ICE and
electric powertrains (USD)
Source: Deutsche Bank, Supplier Estimates
Source: Deutsche Bank, Argonne National Labs, Supplier Estimates, Industry Experts
For more information about lithium ion battery evolution, please refer to the
FITT report, “Lithium 101”, published by Deutsche Bank’s global metals and
mining team in May 2016.
NEV sector getting crowding with more new entrants
Various types of non-auto companies jumping in
Given 1) the simple EV architecture, 2) government EV subsidies, and 3) the
government’s acceptance of non-traditional auto manufacturers making EVs,
we have been seeing the increasing entry of more non-traditional auto
companies to EV/EV component production in China. Examples include LeTV
(300104.SZ), Tencent (0700.HK), Foxconn (2354.TW), and 3) Gree (000651.SZ).
Mr Cai sees tech and internet companies developing EVs because they
envision opportunities in future EV/smart car adoption. These resourceful
companies are able to attract traditional auto company talent to join them. In
addition, he sees traditional industrial companies like motor manufacturer
Broad Ocean (002249.SZ) participating in the EV supply chain with EV motor
products. However, given the small initial EV sales quantity, Mr Cai thinks the
segment’s development could be overheated. While government subsidies
help to sustain many weaker entities for now, some of them will eventually fall
out after the subsidy period ends.

18 May 2016
Automobiles & Components
China Autos
Page 18 Deutsche Bank AG/Hong Kong
Figure 26: Examples of non-traditional auto/part companies’ participation in NEV sector
公司名称 Company’s full name Ticker (Reuters) Key business profile NEV-related business highlights/products
Electric Motor
中信国安 CITIC Guoan Information Industry
000839.SZ The company operates cable TV and satellite telecommunication networks. It also develops real
estate properties. In addition, CITIC designs network integrated systems and application software, and
provides advertising services.
Manufactures lithium-ion battery and related products for NEVs through its
subsidiary Citic Guoan Mengguli Power Science & Technology
中国宝安 China Baoan Group 000009.SZ The company develops, leases, and manages residential and commercial real estate properties in Shenzhen, Wuhan, Hainan, and Shanghai areas. It
also produces medical products and sells its products at retail chain stores.
Manufactures driving systems for various NEVs, including buses, sedans, special vehicles, low-speed EVs; and provides
materials for power battery
金鹰股份 Zhejiang Golden Eagle 600232.SS The company manufactures a variety of textile products, including spun silk and linen.
A private share placement is to support its EV battery project
卧龙电气 Wolong Electric Group 600580.SS The company manufactures a variety of mini electric machinery.
Manufactures electric vehicle motors
江特电机 Jiangxi Special Electric Motor
002176.SZ The company manufactures specialty motors including lifting, mining, and high-voltage motors.
Manufactures lithium battery cathode materials, electric automobile drive
motors, control systems for NEVs, and produces low-speed electric vehicles
大洋电机 Zhongshan Broad Ocean Motor
002249.SZ The company manufactures AC and DC electric motors.
Manufactures the electric vehicle motors and controllers
格力电器 Gree Electric Appliances 000651.SZ The company manufactures a series of air conditioners and air purifiers.
The company announced it will acquire Zhuhai Yinlong New Energy recently and
aims to enter the NEV market.
EV-related semiconductors
株洲中车 Zhuzhou CRRC Times Electric
3898.HK The company provides train-borne electrical systems for the China railway industry. It also manufactures
train power converters, auxiliary power supply equipment, and control systems for trains for urban
rail systems.
The IGBT (Insulated Gate Bipolar Transistor) that was developed by their
semiconductor business unit can be applied to NEVs.
Autonomous driving
百度 Baidu BIDU.OQ The company operates an Internet search engine. R&D in autonomous driving vehicles and aims at mass production in 5 years
EV
乐视网 Leshi Internet Information & Technology
300104.SZ The company develops internet video and mobile networking video technology.
R&D on NEVs and cooperates with BAIC. The company aims to develop a complete
new energy eco-system
China Harmony New Energy Auto
3836.HK The company is a dealership group that deals exclusively in luxury and ultra-luxury passenger
vehicles in China.
In 2015, Harmony established an EV JV, Harmony Futeng, with Tencent and
Foxconn. This JV has a controlling stake in Green Field Motor (GFMC), which is
developing regular-speed EVs with a 150-250km driving range.
Tencent 700.HK The company provides internet and mobile value-added services (VAS), online advertising services,
and e-commerce transactions services to users globally.
Foxconn Technology 2354.TW The company manufactures and markets OEM desktop computers and color monitors.
Source: Bloomberg Financial LP, Reuters, Company data, Jiefang Daily, Deutsche Bank

18 May 2016
Automobiles & Components
China Autos
Deutsche Bank AG/Hong Kong Page 19
The solution…?
Key points
For now, the Chinese government is still highly reliant on subsidies
and other incentives to drive NEV sales.
While more than half of Chinese provinces have not yet implemented
any NEV stimulus policies, most of the major cities and provinces,
already have detailed subsidy measures in place.
Together with supportive policies such as purchase tax waiver and
free license plate (in Shanghai), cost of owning an NEV could be highly
comparable with that of a conventional car.
Apart from passenger NEV supports, various local governments also
have roadmap for replacing the public transportation fleet with EV
buses or PHEV buses.
All in all, the NEV supportive policies in China make the country
amongst the most NEV-friendly globally.
With the current NEV demand mainly driven by subsidy, in our view,
any financial strain by the government on high subsidy expenditure
and unexpected subsidy cuts/delays could risk the NEV sales.
Meanwhile, we think that an emission credit trading system between
auto manufacturers could be a viable long-term solution beyond
2020E to continually support OEMs’ push for higher NEV adoption.
Government incentives are biggest driver of NEV sales
Amid a lack of charging infrastructure and NEV price premium, we think
China’s NEV demand is heavily driven by government support. We summarize
the major policy announcements in the past few years in Figure 27. Broadly
speaking, purchasers of NEVs in China enjoy three kinds of subsidies:
Purchase tax waiver;
Central government subsidy; and
Various levels of local government subsidies.
Note that while purchase tax exemption applies to both locally produced and
imported NEVs, central and local government subsidies apply only to locally
produced NEVs, probably as a means to groom localized NEV technology, in
our view.
On top of direct monetary support, the government also supports NEV
purchases at the local government level, including free license plates in
Shanghai, standalone new license quotas for cities with ownership restrictions,
waivers of traffic restrictions on ICE cars, and minimum NEV public
transportation fleet size requirements.

18 May 2016
Automobiles & Components
China Autos
Page 20 Deutsche Bank AG/Hong Kong
Figure 27: Summary of China’s major NEV supportive policies
Date Policy and summary of major implications
May 2010 Notice of The Pilot Implementation of Private Purchases of New Energy Vehicles Subsidies
Officially initiated China’s NEV subsidy program
Started small-scale pilot testing in 6 cities in China
June 2012 The 2012-2020 Development Plan for Fuel-efficient and New Energy Vehicle Industry
Roadmap for China’s NEV industry development
Accumulated NEV (EV and PHEV) sales volume target of 500k units by 2015 and 5m units by 2020E
Annual NEV production capacity to reach 2m units by 2020E
September 2013 Notice to Continue to Promote the Usage of New Energy Vehicles
NEV purchase subsidy standards for 2013-15
Set-up of required NEV ownership targets in pilot cities
Priority given to NEVs in government procurement and public bus transit
July 2014 Notice to Waive Purchase Tax for New Energy Vehicles
Waive purchase tax for electric vehicles, plug-in electric vehicles and fuel-cell vehicles regardless of production origin until 31 December 2017
April 2015 Notice to Promote The Usage of New Energy Vehicles for 2016-20
NEV purchase subsidy standards announced for 2016-20E Source: State Council, MOF, MOST, MIIT, NDRC, Deutsche Bank
The following are the key implications of the various types of policy support:
Purchase tax waiver for all NEVs, including imports
Since the auto purchase tax rate is equivalent to 10% of a car's price
(excluding 17% value-added tax), this is practically a 10% discount on top of
other incentives applicable to NEV consumption.
Central government subsidies
According to the latest 2016-20E NEV purchase subsidy scheme, the central
government will provide various levels of subsidies (see Figure 28 and
Figure 29), ranging within RMB25,000-55,000 for passenger NEVs and a
maximum of RMB500,000 for NEV buses in 2016.
Figure 28: Central government subsidies for passenger NEVs in 2016
Battery driving range (R) (unit: km)
(RMB'000) 100<=R<150 150<=R<250 R>=250 R>=50
EV 25 45 55 n.a.
PHEV n.a. n.a. n.a. 30 Source: MOF

18 May 2016
Automobiles & Components
China Autos
Deutsche Bank AG/Hong Kong Page 21
Figure 29: Central government subsidies for NEV buses (10-12m) in 2016
Battery driving range (R) (unit: km)
(RMB'000) 6<=R<20 20<=R<50 50<=R<100 100<=R<150 150<=R<250 R>=250
EV Unit load energy consumption (E) (unit: Wh/km.kg)
E<0.25 220 260 300 350 420 500
0.25<=E<0.35 200 240 280 320 380 460
0.35<=E<0.50 180 220 240 280 340 420
0.50<=E<0.60 160 180 200 250 300 360
0.60<=E<0.70 120 140 160 200 240 300
PHEV n.a. n.a. 200 230 250 250 Note: Electric buses of 6m and below in length qualify for 20% of the above standard bus subsidy (10-12m); electric buses of 6-8m length qualify for 50% of the standard bus subsidy; electric buses of 8-10m length qualify for 80% of the standard bus subsidy; electric buses of 12m and above in length qualify for 120% of the standard bus subsidy. Source: MOF
Compared with previous years (2013-15), cash subsidies for passenger NEVs
for 2016 is on average c.6% smaller than in 2015, and have stricter qualifying
requirements (Figure 30). We also noticed a 0-2% cash subsidy increase for
passenger EVs with a battery driving range above 150km, indicating clearly the
central government’s intention to promote higher-end EVs.
Similarly for NEV bus subsidies, China implements much more stringent
qualification standards in 2016 and onwards, with detailed requirements for
unit energy consumption and the battery driving range (Figure 29), unlike in
previous years (Figure 31) when vehicle length was the only benchmark for
subsidy qualification. We think this is a move to ensure product quality.
In addition, the central government subsidy level will progressively decline in
2016-20E, except in the case of fuel cell vehicles (FCVs), which are still at the
infant development stage.
Figure 30: Comparison of central government subsidies for passenger NEVs in 2013-20E
Battery driving range (R) (unit: km) YoY change
(RMB'000) 80<=R<150 150<=R<250 R>=250 R>=50 80<=R<150 150<=R<250 R>=250 R>=50
EV
2013 35.0 50.0 60.0 -
2014 33.3 47.5 57.0 - -5% -5% -5% -
2015 31.5 45.0 54.0 - -5% -5% -5% -
2016E 25.0* 45.0 55.0 - -21% 0% 2% -
2017-18E 20.0* 36.0 44.0 - -20% -20% -20% -
2019-20E 15.0* 27.0 33.0 - -25% -25% -25% -
PHEV
2013 - - - 35.0 - - -
2014 - - - 33.3 - - - -5%
2015 - - - 31.5 - - - -5%
2016E - - - 30.0 - - - -5%
2017-18E - - - 24.0 - - - -20%
2019-20E - - - 18.0 - - - -25% * Minimum driving range for EVs to qualify for a subsidy was raised to 100km in 2016-20E from 80km previously. Source: MOF, Deutsche Bank

18 May 2016
Automobiles & Components
China Autos
Page 22 Deutsche Bank AG/Hong Kong
Figure 31: Central government subsidies for NEV buses in 2013-15
Vehicle length (L) (unit: m)
(RMB'000) 6<=L<8 8<=L<10 L>=10
EV
2013 300 400 500
2014 300 400 500
2015 300 400 500
PHEV
2013 - - 250
2014 - - 250
2015 - - 250
Source: MOF
Local governments to complement central support
In addition to the aforementioned central government financial incentives, local
governments are encouraged to provide supportive policies to stimulate NEV
consumption.
While more than half of the provinces in China have not implemented any
stimulus policies to promote NEV usage, most of the major cities and
provinces, where the majority of NEV sales come from, already have detailed
subsidy measures in place. Such stimulus plans could be in the form of 1)
monetary subsidies (on top of the subsidies given by MOF) for purchases of
NEV models included in local eligibility lists and 2) free license plates in
restricted cities such as Beijing and Shanghai. To elaborate:
Beijing government will grant free EV-specific license plates (with an
annual quota of 60,000 units) and provide monetary subsidies to EV
purchases in amounts equivalent to central government subsidy.
However, PHEV purchases will enjoy no such stimulus.
Figure 32: Beijing government passenger NEV subsidy program (2016)
Beijing EV EV EV PHEV
(RMB'000) 100<=R<150 150<=R<250 R>=250 R>=50
Central government subsidy 25 45 55 30
Local government subsidy* 25 45 55 n.a.
Free license plate** Yes Yes Yes No * Total subsidy not exceeding 60% of NEV MSRP. ** Total free license plates to be issued for NEV not exceeding 60,000. Source: Beijing Government, Deutsche Bank
The Shanghai government released an update of the city’s NEV
subsidy policy for 2016-17E in early April. While the revised subsidy
amount is a significant drop from the 2015 level, we believe the free
NEV-specific license plates (with a market auction value of roughly
RMB80,000-90,000) are the key NEV demand driver in Shanghai.
Figure 33: Shanghai government passenger NEV subsidy program (2016-17E)
Shanghai EV EV EV PHEV
(RMB'000) 100<=R<150 150<=R<250 R>=250 R>=50
Central government subsidy 25 45 55 30
Local government subsidy 10 30 30 10
Additional local subsidy* n.a. n.a. n.a. 14
Free license plate Yes Yes Yes Yes * Prerequisites: engine size below 1.6L, fuel tank size below 40L, and fuel consumption below 5.9L/100km in hybrid mode. Source: Shanghai Government, Deutsche Bank

18 May 2016
Automobiles & Components
China Autos
Deutsche Bank AG/Hong Kong Page 23
Figure 34: Shanghai government passenger NEV subsidy program (2015)
Shanghai EV EV EV PHEV
(RMB'000) 80<=R<150 150<=R<250 R>=250 R>=50
Central government subsidy 31.5 45 54 31.5
Local government subsidy 40 40 40 30
Free license plate Yes Yes Yes Yes
Source: Shanghai Government, Deutsche Bank
Moreover, PHEV customers get an additional subsidy (Figure 33) if the
model purchased meets certain extra criteria. We think such a policy
initiative is aimed at ensuring that only authentically fuel-efficient
PHEVs are eligible for subsidies. Currently, only SAIC Roewe e550
PHEV is eligible for the extra subsidy.
Figure 35: Comparison of major PHEV models (locally produced) available in Shanghai
Wheel-base
Engine Fuel tank size
Fuel consumption (hybrid mode)
Driving range
Battery capacity
MSRP Central subsidy
Shanghai subsidy
Total subsidy as % of MSRP
After-subsidy ASP
Brand Model (mm) (L) (L) (L/100km) (km) (kWh) (RMB) (RMB) (RMB) (%) (RMB)
SAIC Roewe
e550 2,705 1.5L 31 1.6 60 12 239,800-259,800
30,000 24,000 20.8-22.5% 185,800-205,800
BYD Qin 2,670 1.5T 50 1.6 70 13 209,800-219,800
30,000 10,000 18.2-19.1% 169,800-179,800
BYD Tang 2,720 2.0T 53 2.4 60-80 13 248,300-518,800
30,000 10,000 7.7-16.1% 208,300-478,800
GAC Trumpchi
GA5 PHEV
2,710 1.0L 45 2.4 50 13 199,300-219,300
30,000 10,000 18.2-20.1% 159,300-179,300
Volvo S60L T6 2,856 2.0T 68 2.1 53 8 505,900-559,900
30,000 10,000 7.1-7.9% 465,900-519,900
Brilliance BMW
530Le 3,108 2.0T 38 2.0 58 14 698,600 30,000 10,000 5.7% 658,600
Beijing Benz
C350eL* 2,920 2.0T n.a. 2.8 31 6.2 599,900 0 0 0.0% 599,900
Newly launched/To-be-launched but not available for sale yet
SAIC Roewe
e950 2,837 1.4T 37 1.7 60 12 288,800-308,800
30,000 24,000 17.5-18.7% 234,800-254,800
BYD Song 2,660 1.5T 52 2.0 70 15 280,000 30,000 10,000 14.3% 240,000
BYD Yuan* 2,535 1.5L 39 2.0 85 n.a. 209,800-249,800
0 0 0.0% 209,800-249,800
* Beijing Benz C350eL and BYD Yuan not included in the government’s new energy vehicle consumption tax waiver eligibility list yet. Source: Autohome.com, Deutsche Bank estimates
In addition, Shanghai’s local subsidy is under a progressive decline
model based on the manufacturer’s accumulated NEV sales volume in
the region. We think this highlights local government needs to more
effectively subsidize NEV market growth without over-stretching
manufacturer budgets.
Figure 36: Shanghai local subsidy based on accumulative sales
Passenger vehicle (units) *
Commercial vehicle (units) *
Special purpose vehicle (units) **
Standard subsidy amount S<=40,000 S<=1,000 TS<=3,000
50% standard subsidy 40,000<S<=60,000 1,000<S<=2,000 3,000<TS<=5,000
No subsidy S>60,000 S>2,000 TS>5,000 * Accumulative sales for NEV manufacturers in Shanghai since 1-January-2014. ** Accumulative sales for NEV manufacturers in Shanghai since 1 January 2016. Source: Deutsche Bank
Different local governments use different eligibility lists to subsidize NEV
purchases. These local lists are subsets of the national eligible NEV model list
and appear to favor local OEMs. For example, the Beijing list includes only EV

18 May 2016
Automobiles & Components
China Autos
Page 24 Deutsche Bank AG/Hong Kong
models (e.g. BAIC EV160, BYD E6 and SAIC Roewe E50), excluding PHEV
models (e.g. BYD Qin and BYD Tang), which BAIC currently does not make.
Shanghai’s list includes both eligible EV and PHEV models, but only the Roewe
e550 is eligible for the extra PHEV subsidy for now. However, we notice that
local governments were recently urged by the central government to eliminate
local protectionism in their purchase subsidies and adhere to the national
eligible list to ensure an efficient subsidy system nationwide.
Apart from laying out frameworks to popularize passenger NEVs, various local
governments also have roadmaps to replace the public transportation fleet
with EV buses or PHEV buses (Figure 37). We think this will be a crucial driver
of commercial NEV demand, not to mention that the inner-city bus market is a
sweet spot for the NEV segment with its predictable routes making logistics
arrangements easier for charging networks.
Figure 37: Examples of public bus fleet electrification targets in China
% of public bus targets to be upgraded to EV/PHEV Target amount (units)
City/Province 2016E 2017E 2018E 2019E 2016E
Beijing 50% 60% 70% 80% 2,390
Shanghai 1,500
Tianjin 1,500
Hebei 1,471
Shanxi
Linfen 200**
Taiyuan 1,000**
Jiangsu 4,614*
Changzhou 147
Zhejiang 1,000
Shandong 1,167
Jining 156**
Guangdong
Hainan
Anhui 35% 45% 55% 65%
Bengbu 200**
Jiangxi
Henan
Hubei
Hunan
Changsha 647**
Fujian
Other provinces/cities 15% 20% 25% 30% * Total incremental amount of new energy buses ** Pure electric buses only Source: MOF, 21st Century Business Herald, Gasgoo.com, Xinhua Net, MOST, Jiangsu Government, Xnyauto.com
All in all, with a web of various direct subsidies and other supportive policies,
China is among countries with the most supportive measures in NEV
development, in our view, alongside Norway, as well as the Hong Kong region,
both of which also have strong NEV sales. We also think China’s support
foundation will help the country attain its 2016-20E NEV penetration target.

18 May 2016
Automobiles & Components
China Autos
Deutsche Bank AG/Hong Kong Page 25
Figure 38: Examples of various countries’ NEV support policies
Country/Region Policy Summary Description
Japan Green Vehicle Purchasing Promotion Measure
Purchasing subsidies, tax deductions and exemptions
1) 1.6-2.7% vehicle acquisition tax reduction; 2) 50% reduction in annual automobile tax; 3) ~USD550-2,700 purchase subsidies for
green passenger cars and ~USD2,100-19,000 for commercial vehicles.
France Bonus-malus system Bonus for purchase of new cars with CO2 emissions of 60 g/km or less
Subsidy of up to EUR6,300 for electric cars, capped at 30% of the vehicle price including VAT. Subsidy for fuel-efficient cars: 1) Up
to EUR6,300 for emission level of 20g/km or less; 2) Up to EUR5,000 for 20-50g/km emission level; 3) Up to EUR3,700 for 50-
60g/km.
Germany Nationale Plattform Elektromobilität (NPE)
Targets 1m electric vehicles on German roads by 2020
No subsidies to the sales of electric cars but exempt from the annual circulation tax. Battery-powered cars are allowed onto bus
lanes, and free parking and reserved parking spaces in locations with charging points. New electric and plug-in hybrid cars subsidy
of up to EUR5,000 (USD5,500) still under discussion.
Norway Annual budget by Norwegian Parliament
Targets 50,000 zero emission vehicles by 2018 (reached on 20 April 2015)
Exempt from 1) non-recurring vehicle fees, including purchase taxes that are extremely high for ICE cars, and 25% VAT; 2) annual road tax, public parking fees and toll payments; and 3) allowed to
use bus lanes. Existing incentives will last through 2017, half of the yearly road license fee is required since 2018 and the full rate as of 2020. The value-added tax (VAT) exemption for electric cars
will end in 2018.
UK Plug-in Car Grant and other incentives
Purchase price discount at the point of purchase
1) 25% grant towards the cost of new plug-in cars capped at GBP5,000 (lowered to GBP4,500 in December 2015); 2) 20%, up to
GBP8,000, for plug-in vans. The Plug-in Car Grant program was extended to March 2018 with additional funding of GBP400m.
US Energy Improvement and Extension Act of 2008,
American Clean Energy and Security Act
Federal tax credit The federal tax credit worth of USD2,500, plus USD417 for each kWh of battery capacity over 4 kWh, capped at USD7,500. Total of
37 states established incentives and tax or fee exemptions.
California, US Clean Vehicle Rebate Project (CVRP)
Federal tax credit and purchase rebate 1.5m zero-emission vehicles (ZEVs) in California by 2025. 1) Federal tax credit of up to USD7,500 depending on battery size; 2)
rebates of up to USD2,500 per qualified light-duty vehicle.
Hong Kong Guidelines for Importation & Registration of Pure Electric
Vehicle (PEV) and Plug-in Hybrid Electric Vehicle
(PHEV)
First registration tax exemption First Registration Tax (40-115% progressive tax rate for private cars) for EVs is waived till end March 2017.
Source: Various countries’ governments, Deutsche Bank
Potential problems and risks with reliance on subsidies
While we agree direct government subsidies provide an instant boost to NEV
demand in China, as demonstrated by exponential sales growth in recent
years, we also identify a few potential concerns of such policy support:
Interestingly, policy support – central and local government subsidies,
and extra incentives, such as purchase tax waivers and free license
plates – is making it cheaper to own a PHEV than an ICE vehicle in
Shanghai (see Figure 39). This could defeat the intention of promoting
environmental friendliness, as consumers may not even charge their
PHEVs and just use them as if they are conventional cars (i.e. not
maximizing their fuel efficiency).
18 May 2016
Automobiles & Components
China Autos
Page 26 Deutsche Bank AG/Hong Kong
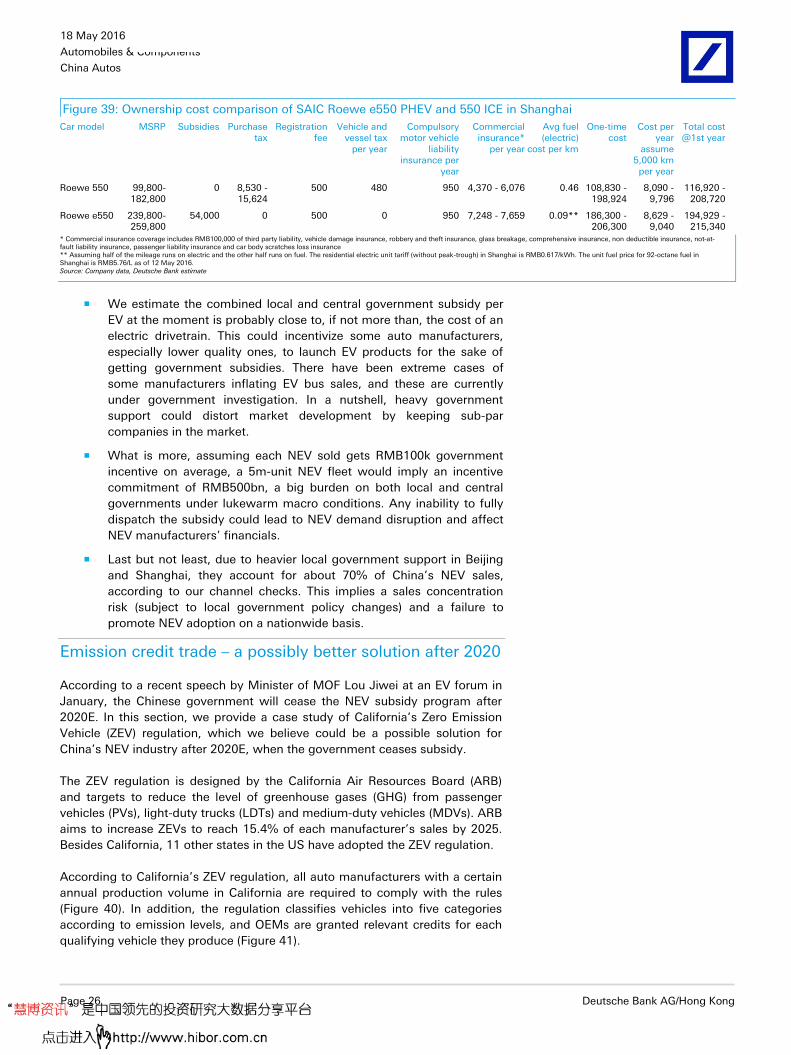
Figure 39: Ownership cost comparison of SAIC Roewe e550 PHEV and 550 ICE in Shanghai
Car model MSRP Subsidies Purchase tax
Registration fee
Vehicle and vessel tax
per year
Compulsory motor vehicle
liability insurance per
year
Commercial insurance*
per year
Avg fuel (electric)
cost per km
One-time cost
Cost per year
assume 5,000 km per year
Total cost @1st year
Roewe 550 99,800-182,800
0 8,530 - 15,624
500 480 950 4,370 - 6,076 0.46 108,830 - 198,924
8,090 - 9,796
116,920 - 208,720
Roewe e550 239,800-259,800
54,000 0 500 0 950 7,248 - 7,659 0.09** 186,300 - 206,300
8,629 - 9,040
194,929 - 215,340
* Commercial insurance coverage includes RMB100,000 of third party liability, vehicle damage insurance, robbery and theft insurance, glass breakage, comprehensive insurance, non deductible insurance, not-at-fault liability insurance, passenger liability insurance and car body scratches loss insurance ** Assuming half of the mileage runs on electric and the other half runs on fuel. The residential electric unit tariff (without peak-trough) in Shanghai is RMB0.617/kWh. The unit fuel price for 92-octane fuel in Shanghai is RMB5.76/L as of 12 May 2016. Source: Company data, Deutsche Bank estimate
We estimate the combined local and central government subsidy per
EV at the moment is probably close to, if not more than, the cost of an
electric drivetrain. This could incentivize some auto manufacturers,
especially lower quality ones, to launch EV products for the sake of
getting government subsidies. There have been extreme cases of
some manufacturers inflating EV bus sales, and these are currently
under government investigation. In a nutshell, heavy government
support could distort market development by keeping sub-par
companies in the market.
What is more, assuming each NEV sold gets RMB100k government
incentive on average, a 5m-unit NEV fleet would imply an incentive
commitment of RMB500bn, a big burden on both local and central
governments under lukewarm macro conditions. Any inability to fully
dispatch the subsidy could lead to NEV demand disruption and affect
NEV manufacturers’ financials.
Last but not least, due to heavier local government support in Beijing
and Shanghai, they account for about 70% of China’s NEV sales,
according to our channel checks. This implies a sales concentration
risk (subject to local government policy changes) and a failure to
promote NEV adoption on a nationwide basis.
Emission credit trade – a possibly better solution after 2020
According to a recent speech by Minister of MOF Lou Jiwei at an EV forum in
January, the Chinese government will cease the NEV subsidy program after
2020E. In this section, we provide a case study of California’s Zero Emission
Vehicle (ZEV) regulation, which we believe could be a possible solution for
China’s NEV industry after 2020E, when the government ceases subsidy.
The ZEV regulation is designed by the California Air Resources Board (ARB)
and targets to reduce the level of greenhouse gases (GHG) from passenger
vehicles (PVs), light-duty trucks (LDTs) and medium-duty vehicles (MDVs). ARB
aims to increase ZEVs to reach 15.4% of each manufacturer’s sales by 2025.
Besides California, 11 other states in the US have adopted the ZEV regulation.
According to California’s ZEV regulation, all auto manufacturers with a certain
annual production volume in California are required to comply with the rules
(Figure 40). In addition, the regulation classifies vehicles into five categories
according to emission levels, and OEMs are granted relevant credits for each
qualifying vehicle they produce (Figure 41).

18 May 2016
Automobiles & Components
China Autos
Deutsche Bank AG/Hong Kong Page 27
Figure 40: Zero Emission Vehicle (ZEV) compliance requirements
Average production volume in California (units)*
ZEV compliance requirement for model year (MY) 2009-2017E
ZEV compliance requirement for MY2018-2025E
> 60,000 units (decrease to 20,000 in 2018E and beyond)
Subject to regulation Subject to regulation
4,501-60,000 units (20,000 from 2018E)
Subject to regulation; but can meet all requirements with PZEVs
Subject to regulation
< 4,500 units Not subject to this regulation** Not subject to this regulation***
* Based on the average number of vehicles (new PVs, LDTs, and MDVs) produced and delivered for sale for the previous three consecutive model years (MY) ** Not required to meet the ZEV requirements, but may earn credits for the ZEVs, TZEVs, AT PZEVs, or PZEVs it produces and delivers for sale in California *** Not required to meet the ZEV requirements, but may earn, bank (save any credits that exceed ZEV requirements for future use), market, and trade credits for the ZEVs and TZEVs it produces and delivers for sale in California Source: California Air Resources Board (ARB)
Figure 41: Vehicle classifications and ZEV credits
Classification name Vehicle type Credits MY2012-2017E Credits MY2018-2025E Example vehicle(s)
ZEV (Zero Emission Vehicle) Battery electric vehicle (BEV), hydrogen fuel cell vehicle
1-9 depending on range
1-4 depending on range
Nissan LEAF, Honda Clarity
TZEV (Transitional Zero Emission Vehicle)
Plug-in hybrid (PHEV) or extended range electric vehicle (EREV), hydrogen internal combustion
engine vehicle
1-3 depending on technology
0.4-1.3 depending on range
Chevrolet Volt
NEV (Neighborhood Electric Vehicle)
Short-range, low-speed battery electric vehicle 0.3 0.15 if it meets the specifications
AT PZEV (Advanced Technology Partial Zero Emission Vehicle)
Natural gas vehicle, hybrid electric vehicle (HEV) 0.2-3 depending on technology
-
Honda Civic GX, Toyota Prius
PZEV (Partial Zero Emission Vehicle)
Extremely clean conventional vehicle* 0.2 -
Ford Focus
* Extremely clean conventional vehicle with a 15-year or 150,000-mile warranty on its emission-control components and zero evaporative emissions Source: ARB, Center for Climate and Energy Solutions
In order to comply with the regulation, OEMs must fulfill 1) total ZEV credit
requirements and 2) the minimum ZEV floor requirements (Figure 42). In other
words, they may satisfy the total ZEV requirement with TZEVs, NEVs, AT
PZEVs and AT PZEVs.
Under this regulation, excess ZEV credits may be traded and transferred
between auto manufacturers. Meanwhile, a manufacturer has additional two
years to make up for a ZEV deficit if it fails to meet the ZEV requirement.
However, if it still fails to comply after the grace period, the manufacturer is
subject to financial penalties of USD5,000 for each new vehicle that is sold but
does not meet the applicable emission standards.

18 May 2016
Automobiles & Components
China Autos
Page 28 Deutsche Bank AG/Hong Kong
Figure 42: ZEV credit requirements* from 2012 to 2025
Model year (MY)
Total ZEV credit requirement
Minimum ZEV floor
TZEVs/NEVs AT PZEVs PZEVs
2012 12.0% 0.8% 2.2% 3.0% 6.0%
2013 12.0% 0.8% 2.2% 3.0% 6.0%
2014 12.0% 0.8% 2.2% 3.0% 6.0%
2015 14.0% 3.0% 3.0% 2.0% 6.0%
2016 14.0% 3.0% 3.0% 2.0% 6.0%
2017 14.0% 3.0% 3.0% 2.0% 6.0%
2018 4.5% 2.0% 2.5% - -
2019 7.0% 4.0% 3.0% - -
2020 9.5% 6.0% 3.5% - -
2021 12.0% 8.0% 4.0% - -
2022 14.5% 10.0% 4.5% - -
2023 17.0% 12.0% 5.0% - -
2024 19.5% 14.0% 5.5% - -
2025 22.0% 16.0% 6.0% - - * ZEVs production volume as a percentage of total vehicle production volume. Source: ARB, Center for Climate and Energy Solutions
Pure electric vehicle manufacturers, such as Tesla (TSLA.OQ), earn ZEV credits
on every vehicle it produces and sells in California and other ZEV States. This
allows Tesla to trade and transfer ZEV credits to other manufacturers under a
confidential ZEV credit agreement, providing it with a source of additional
revenue by selling ZEV credits. As shown in Figure 43, Tesla’s annual credits’
revenue (including ZEV and greenhouse gas (GHG) credits) accounted for
1.3-9.8% of total revenue in 2009-15.
Figure 43: Tesla’s annual credits revenue
(USDm) 2009 2010 2011 2012 2013 2014 2015
Total revenue 111.9 116.7 204.2 413.3 2,013.5 3,198.4 4,046.0
Credits revenue 8.2 2.8 2.7 40.5 194.4 216.3 168.7
as a % of total revenue 7.3% 2.4% 1.3% 9.8% 9.7% 6.8% 4.2%
ZEV and GHG (greenhouse gas) credits revenue 8.2 2.8 2.7 32.4 129.8 152.0 112.0
as a % of total revenue 7.3% 2.4% 1.3% 7.8% 6.4% 4.8% 2.8%
Other credit revenue 0.0 0.0 0.0 8.1 64.6 64.3 56.7
Source: Company data, Deutsche Bank
We much prefer this type of incentive policy to the current subsidy program in
China for the following merits:
It incentivizes corporates to develop NEV technologies and promote
NEV sales, as this leads to a realistic revenue stream.
It provides an option for specific types of auto manufacturers, for
example those with a focus on the premium and SUV segments, to
comply with future emission/fuel economy limits.
It frees up the government from subsidizing the industry with its
precious monetary resources.
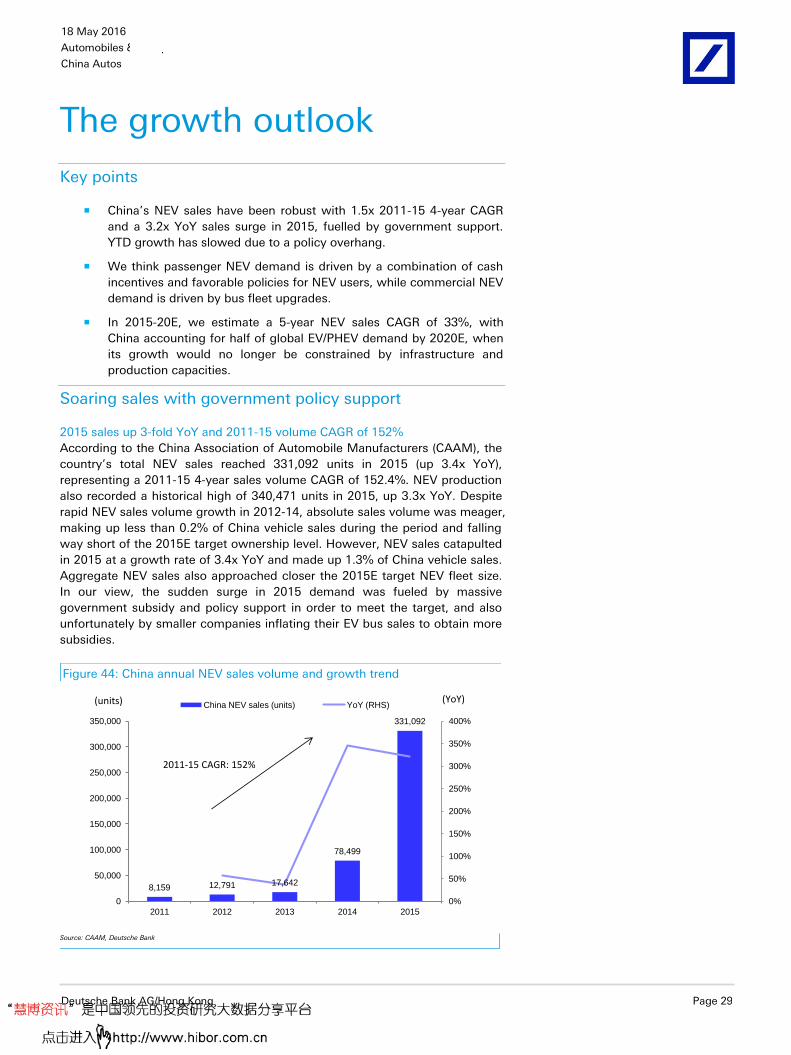
18 May 2016
Automobiles & Components
China Autos
Deutsche Bank AG/Hong Kong Page 29
The growth outlook
Key points
China’s NEV sales have been robust with 1.5x 2011-15 4-year CAGR
and a 3.2x YoY sales surge in 2015, fuelled by government support.
YTD growth has slowed due to a policy overhang.
We think passenger NEV demand is driven by a combination of cash
incentives and favorable policies for NEV users, while commercial NEV
demand is driven by bus fleet upgrades.
In 2015-20E, we estimate a 5-year NEV sales CAGR of 33%, with
China accounting for half of global EV/PHEV demand by 2020E, when
its growth would no longer be constrained by infrastructure and
production capacities.
Soaring sales with government policy support
2015 sales up 3-fold YoY and 2011-15 volume CAGR of 152%
According to the China Association of Automobile Manufacturers (CAAM), the
country’s total NEV sales reached 331,092 units in 2015 (up 3.4x YoY),
representing a 2011-15 4-year sales volume CAGR of 152.4%. NEV production
also recorded a historical high of 340,471 units in 2015, up 3.3x YoY. Despite
rapid NEV sales volume growth in 2012-14, absolute sales volume was meager,
making up less than 0.2% of China vehicle sales during the period and falling
way short of the 2015E target ownership level. However, NEV sales catapulted
in 2015 at a growth rate of 3.4x YoY and made up 1.3% of China vehicle sales.
Aggregate NEV sales also approached closer the 2015E target NEV fleet size.
In our view, the sudden surge in 2015 demand was fueled by massive
government subsidy and policy support in order to meet the target, and also
unfortunately by smaller companies inflating their EV bus sales to obtain more
subsidies.
Figure 44: China annual NEV sales volume and growth trend
8,159 12,791 17,642
78,499
331,092
0%
50%
100%
150%
200%
250%
300%
350%
400%
0
50,000
100,000
150,000
200,000
250,000
300,000
350,000
2011 2012 2013 2014 2015
China NEV sales (units) YoY (RHS)(units) (YoY)
2011-15 CAGR: 152%
Source: CAAM, Deutsche Bank

18 May 2016
Automobiles & Components
China Autos
Page 30 Deutsche Bank AG/Hong Kong
Year-to-date slowdown probably due to policy overhang
In terms of product segment, the 2015 NEV sales surge was more apparent in
the commercial vehicle (CV) segment, which grew 4.0x YoY vs. PV’s 3.0x YoY.
Once again, we attribute commercial NEVs’ outperformance mainly to massive
government subsidy and policy support in order to meet the 2015E fleet target,
and to smaller companies inflating EV bus sales to get more subsidies.
Going into 2016, there has been a market slowdown in NEV sales with 1Q16
passenger NEV and commercial NEV sales up 97.0% and 1.5x YoY
respectively, but down 66.4% and 71.8% QoQ. We attributable the slowdown
in passenger NEV sales momentum YTD to delay in local governments’ rollouts
of their 2016-20E NEV subsidy policies. Meanwhile, we think the slowdown in
commercial NEV sales momentum YTD is due to the overhang of ongoing
investigations into EV bus subsidy cheating.
Figure 45: Passenger NEV sales Figure 46: Commercial NEV sales
0%
200%
400%
600%
800%
0
20,000
40,000
60,000
80,000
Jan
-14
Ap
r-1
4
Jul-
14
Oct
-14
Jan
-15
Ap
r-1
5
Jul-
15
Oct
-15
Jan
-16
EV PHEV Total NEV YoY(units) (YoY)
-250%
0%
250%
500%
750%
1000%
1250%
0
5,000
10,000
15,000
20,000
25,000
30,000
Jan
-14
Ap
r-1
4
Jul-
14
Oct
-14
Jan
-15
Ap
r-1
5
Jul-
15
Oct
-15
Jan
-16
EV PHEV Total NEV YoY(units) (YoY)
Source: CAAM, Deutsche Bank
Source: CAAM, Deutsche Bank
EVs are still the mainstream vs. PHEVs
In 2015 and 4M16, about 70% of China’s NEV sales were for EVs, despite EVs’
generally higher prices than PHEVs and charging infrastructure constraints. In
our view, this is because of simpler technological requirements for developing
EV and hence the higher number of newly available EV products.
High subsidies and side benefits help to drive demand
In the passenger NEV segment, we think the major driver of robust demand in
China in 2015 and beyond is strong support/monetary subsidies from the
central and local governments. Based on our estimates, total monetary
incentives (from both central and local governments) could account for as high
as 35% of an EV’s MSRP and 20% of a PHEV’s MSRP.
After taking into consideration the subsidies and purchase tax waivers, we
think a NEV ends up being sold within acceptable price level, e.g. at about
RMB150,000-200,000 for a long-range EV or a PHEVs.
While buying an NEV is still more expensive at the beginning and charging it
could be inconvenient, there are extra attractive government support schemes,
such as free license plates offered to NEV buyers in Shanghai and Beijing,
where governments have implemented strict purchase restrictions on
conventional PVs. For example, Shanghai adopts an auction system for new

18 May 2016
Automobiles & Components
China Autos
Deutsche Bank AG/Hong Kong Page 31
license plate issuance and a plate cost RMB80,000-90,000 at several auctions
held recently with winning rates of low single-digits (i.e. below 5%).
Furthermore, driving an NEV subjects one to fewer traffic restrictions, e.g. car
usage controls on certain days of a month. In short, government support
makes NEVs more competitive than ICE vehicles, especially in major cities with
more traffic/ownership restrictions.
In the commercial NEV segment, the driver of growth has been and will still be
local governments’ vows to upgrade part of their public transportation fleets
with NEVs.
Fuel usage target now tops OEMs’ agenda
As discussed at the beginning of this report, the Chinese government has set
emission targets to reduce fuel usage from 6.9L/100km in 2015 to 5.0L/100km
by 2020E for all OEMs in China. As 1) it is costly to improve the efficiency of
conventional ICE vehicles and 2) the fuel consumption target is measured on
the volume-weighted average fuel consumption of all models on a group level
basis (including NEVs, which are treated as emission free), we believe OEMs
are increasingly pressured to launch more NEVs to comply with the 2020E
emission requirements.
Figure 47: Major passenger NEV models to be launched in 2016E
Brand Model Type
BAIC EU260 EV
BAIC ES210 EV
BAIC EX200 EV
BAIC EX300L EV
Beijing Hyundai Shouwang EV
Dongfeng Fengshen A60 EV EV
GAC Trumpchi GS4 EV EV
GAC Toyota Leahead i1 EV
Geely Englon C5 EV EV
Great Wall Motor C30 EV EV
JAC iEV6S EV
BYD Song PHEV
BYD Yuan PHEV
BYD Shang PHEV
Chang'an EADO plug-in PHEV
Dongfeng Fengshen AX7 PHEV
GAC Trumpchi GA3S PHEV PHEV
SAIC GM Cadillac CT6 PHEV
SAIC Roewe e950 PHEV
SAIC Roewe RX5 PHEV
Source: Market news, Company data, Deutsche Bank
We see 33% volume CAGR in 2015-20E
China to account for about half of global EV/PHEV sales by 2020E
Given continuous government policy support, we believe Chinese consumers’
NEV adoption and public transportation fleet electrification will maintain the
strong momentum. As such, we expect China NEV sales to expand at a 33% 5-
year CAGR in 2015-20, with accumulated 2011-20 NEV sales at about 4.9m

18 May 2016
Automobiles & Components
China Autos
Page 32 Deutsche Bank AG/Hong Kong
units, close to the government’s target of 5m units. By 2020, we expect
China’s NEVs to account for about 4.5% of the country’s vehicles sales and
about half of global EV/PHEV sales. Considering the gradual decline in
government subsidy before 2020E and the enlarging base effect, we expect a
faster annual sales growth rate of 27-57% in 2016-18 than the 20-25% in 2019-
20 (Figure 48).
In addition, with the increasing availability of charging infrastructure, we
foresee slightly faster growth in passenger NEVs than commercial NEVs in
2017-20E and its proportion to ramp up in the coming years, in our view
(Figure 49). Nevertheless, considering the government’s agenda to upgrade the
public transportation fleet to NEVs, we envision more predictable and
consistently strong commercial NEV sales.
What is more, given the sudden surge in 4Q15 NEV sales, which we do not
view as sustainable in the light of possible sales-inflation activities, we envision
NEV sales growth rate will fall back to 27% in 2016E vs. 3.4x in 2015 and 57%
in 2017E.
Last but not least, we also foresee an increasing adoption of passenger PHEVs
since they offer better driving flexibility, e.g. for long-haul travel and in
situations where charging facilities are not readily available. We think an
increase in PHEV models offered by major auto companies like SAIC Motor,
Dongfeng Motor (0489.HK) and Guangzhou Auto (GAC, 2238.HK) in the
upcoming years will lift passenger PHEVs’ sales contribution to about 40% of
total passenger NEV sales by 2020E from the current 30% level. Apart from
that, a decline in subsidies for shorter EV buses and improving PHEV
technology possession could lift commercial PHEVs’ sales contribution to
about the 30% level of total commercial NEV sales by 2020E from the current
20% level, in our view.
Figure 48: China NEV sales forecast Figure 49: China NEV sales forecast breakdown
0.330.42
0.66
0.90
1.13
1.36
0%
50%
100%
150%
200%
250%
300%
350%
400%
0.0
0.2
0.4
0.6
0.8
1.0
1.2
1.4
1.6
2011
2012
2013
2014
2015
2016E
2017E
2018E
2019E
2020E
China NEV sales (m units) YoY (RHS)
(m units) (YoY)
2011-15 volume CAGR: 152%
2015-20E volume CAGR: 33%
(m units) 2016E 2017E 2018E 2019E 2020E
Passenger EV 0.20 0.32 0.42 0.51 0.60
YoY% 60.0% 31.3% 21.4% 17.6%
Passenger PHEV 0.10 0.16 0.24 0.32 0.40
YoY% 60.0% 50.0% 32.5% 24.5%
Total passenger NEV 0.30 0.48 0.66 0.83 1.00
YoY% 60.0% 37.5% 25.5% 20.3%
Commercial EV 0.09 0.14 0.18 0.22 0.25
YoY% 55.6% 28.6% 22.2% 13.6%
Commercial PHEV 0.03 0.04 0.06 0.08 0.11
YoY% 33.3% 50.0% 33.3% 37.5%
Total commercial NEV 0.12 0.18 0.24 0.30 0.36
YoY% 50.0% 33.3% 25.0% 20.0%
Grand total NEV 0.42 0.66 0.90 1.13 1.36
YoY% 57.1% 36.4% 25.3% 20.2%
Source: CAAM, Deutsche Bank estimates
Source: Deutsche Bank estimates
Attainable target on supply considerations
To recap, the Chinese government targets an accumulated NEV (EV and PHEV)
sales volume of 500k units by 2015 and 5m units by 2020E, with annual NEV
production capacity of 2m units by 2020E. Based on these targets, we think
auto manufacturers’ capacity and charging network will be adequate to meet
our China NEV sales projections, not to mention that most manufacturers
produce NEVs at the same production lines for ICE cars. Meanwhile, we do not
expect 2020 NEV demand to get close to the target production capacity of 2m

18 May 2016
Automobiles & Components
China Autos
Deutsche Bank AG/Hong Kong Page 33
units, since we think ICE vehicles and conventional hybrid vehicles will remain
overwhelmingly mainstream products, due to their lower prices, longer driving
range in general, and being free from charging infrastructure/charging time
constraints.
From an EV/PHEV battery capacity perspective, we see no major bottleneck as
our global metals and mining team forecast a global lithium ion battery
capacity of about 260GWh by 2020. This considers the fact that a long range
passenger EV, like a BYD E6, has battery capacity of about 60kWh and a large
EV bus, like a BYD K9, has battery capacity of about 300kWh. This is not to
mention that PHEVs use smaller battery packs. All in all, we estimate the China
NEV sector will consume about 120 GWh of EV battery production.

18 May 2016
Automobiles & Components
China Autos
Page 34 Deutsche Bank AG/Hong Kong
The supply chain
Key points
Among major auto manufacturers, BYD and Yutong have the largest
NEV sales contributions in absolute and percentage terms vs. peers.
While other traditional/non-traditional auto manufacturers are catching
up in new launches, their NEV business is unlikely to become a crucial
earnings contributor in the near future.
In the midstream of the NEV supply chain is a plethora of companies,
but NEV-related business contribution is still small for most of them
and could stay small.
In the upstream materials sector, strong NEV sales in China are
expected to drive continuous demand for lithium. Our Metals & Mining
team has a Buy rating on Ganfeng (002460.SZ) and a Hold rating on
Tianqi (002466.SZ).
Downstream: more manufacturers than one can think of
BYD and Yutong have the most visible financial contributions from NEV sales
When investors look for China NEV sector thematic plays, the most obvious
answers are BYD and Zhengzhou Yutong Bus. BYD’s FY15 NEV sales volume
equal 14% of its FY15 total auto sales volume with close to a 20% market
share. FY15 NEV net revenue accounts for 49% of auto sales net revenue and
24% of total net revenue. According to BYD, its auto segment operating profit,
which equals 66% of FY15 operating profit, is predominantly from the NEV
business.
Yutong’s FY15 NEV sales volume equals 31% of its FY15 total bus sales
volume with close to a 25% market share. FY15 NEV gross revenue accounts
for 45% of total gross revenue.
Obviously, both BYD and Yutong are major NEV manufacturers in China, and
their NEV segment’s contributions to total financial position, in both absolute
and percentage terms, also place them among the leaders in China. Going
forward, we envision both companies will be key NEV manufacturers in China,
but with a declining market share as more manufacturers enter the NEV
market with new products.
Figure 50: Key operating and financial metrics of BYD and Yutong’s NEV business
BYD Yutong
2015 house brand NEV sales 62,893 units (up 2.0x YoY) 2015 NEV sales 20,445 units (up 1.8x YoY)
2015 NEV sales volume as % of total sales volume
14.1% 2015 NEV sales volume as % of total sales volume
30.5%
2015 sales volume market share* 19.0% 2015 sales volume market share** 23.6%
2015 NEV sales revenue RMB19.0bn (up 1.6x YoY) 2015 NEV sales revenue RMB14.0bn (up 1.5x YoY)
2015 NEV revenue as % of total revenue 24.4% 2015 NEV revenue as % of total revenue 44.8% * Amongst all NEV sales; ** Amongst commercial NEV sales Source: Company data, CAAM, Deutsche Bank

18 May 2016
Automobiles & Components
China Autos
Deutsche Bank AG/Hong Kong Page 35
Other auto OEMs catching up, but with initial small earnings contribution
Given the long-term support commitment by the government and the need to
lower their weighted average per-car fuel consumption, more mainstream
OEMs are stepping up their NEV/smart car R&D efforts with some imminent
new NEV launches. For instance, state-owned-enterprise SAIC Motor is
undergoing an RMB15bn private placement plan to beef up its NEV R&D
efforts in 2016-20E. Meanwhile, its Roewe local brand will launch the e950
PHEV sedan and PHEV version of its to-be-launched RX5 SUV in the
foreseeable future. Apart from that, BAIC Motor will utilize its existing Senova
sedan/SUV platforms (e.g. for D50 and D80 sedans as well as for X25 SUV) to
roll out several extra EVs. These two companies will also benefit from specific
supportive policies in Shanghai and Beijing, respectively, where about 70% of
China’s NEV sales are recorded, in our estimate.
For privately owned local Chinese enterprises, Geely (0175.HK) has launched
the EV version of its popular Emgrand sedan, with more conventional hybrid
and PHEV products on the way. The company has an ambitious target to have
combined conventional hybrid, EV and PHEV sales make up 90% of its total
sales volume by 2020E. For Great Wall (2333.HK), the company will develop
and launch EV/PHEV SUVs in the coming years to help lower its weighted
average per-car fuel consumption. There are also privately owned pure-play
NEV manufacturers such as Kandi (KNDI.O) and FDG (0729.HK), but their scale
is either tiny (e.g. FDG) or not mainstream (e.g. low range EVs for Kandi).
At the most recent Beijing Auto Show, almost every manufacturer was
displaying at least one EV new model or prototype in its booth. What was new
this time vs. the Guangzhou Auto Show in November 2015 was an increase in
the number of PHEV models and EV/PHEV SUVs. We think this represents
manufacturers’ response to the market preference for SUVs and PHEVs (as
well to insufficient charging facilities nationwide). Nevertheless, with the
conventional car businesses for most of these OEMs remaining scalable and
profitable, NEV initiatives are unlikely to become a meaningful earnings
contributor.
Foreign brands/JVs have been slow to the market
Since imported NEVs, such as Tesla Model S and BMW i3, will not be eligible
for government subsides, global brands can only take advantage of main
government support by producing NEVs at their Chinese JVs. However, there
are currently only a handful of JVs’ NEV models, e.g. Dongfeng Nissan
Venucia Chenfeng EV (based on Nissan Leaf), Brilliance BMW 5 series PHEV
and BYD Daimler Denza EV, none of which has significant sales volume.
In our view, the lack of models is due to 1) relatively higher price tags for JV
NEVs and 2) a concern of global OEMs about sharing their NEV technology.
However, with more JVs regarding NEVs as a volume driver besides SUVs, we
expect more new launches, for instance from major JVs such as SAIC
Volkswagen and from Tesla trying to localize its EV production. Most recently,
Dongfeng Motor announced that it will co-develop an EV platform called
e-CMP with PSA (PEUP/PA), to be available by 2019E for both companies’ EV
products.
Non-traditional auto manufacturers also at the party, but for the long term
As mentioned in the previous section, given the simple architecture of an EV vs.
a conventional car and the intention to develop smart internet cars, various
non-traditional auto companies have been pouring resources into the NEV

18 May 2016
Automobiles & Components
China Autos
Page 36 Deutsche Bank AG/Hong Kong
segment. Notable examples are LeTV’s EV and smart car concepts, which
were shown at a few China auto shows, and its investment in US-based
Faraday Future.
Harmony Auto’s partnership with Tencent and Foxconn to develop both entry-
level and high-end EVs is another example, with the entry-level version to be
available as soon as late 2016E. That being said, as these companies’ EV
development plans are for smart EV products that will be released a few years
later, we are unlikely to see positive financial contribution from their NEV
initiatives for now.
Midstream: myriad participants but limited pure plays
Many part suppliers of battery, drivetrain, and charging systems
Within the midstream space of the NEV supply chain are probably more than
40 listed companies involved in making various NEV parts, especially battery
cells, battery packs, battery management systems (BMS) and electric motors.
Meanwhile, China still mostly relies on overseas suppliers to provide industrial
semiconductors for NEVs.
In terms of regulatory environment, the government has tighter control in the
battery space, with a policy to subsidize only qualified and registered EV
battery makers. Since November 2015, 25 EV battery makers have been
qualified by the government. This includes EV battery companies under bigger
listed groups (BYD, FDG, Corun, Wanfeng and Gree), directly listed EV battery
companies (Do-Fluroide, Guoxuan and Tianneng), and other unlisted EV battery
companies. In our view, the policy goal is to filter out small, inefficient and
low-tech battery makers so as to ensure EV battery quality.
We identified at least 38 companies listed below with direct exposure or plans
in this area, along with brief business descriptions. However, investors should
note that this list is by no means comprehensive. What is more, most of these
companies do not have scalable sales from NEV related business, and/or their
NEV related business contribute only a small portion of overall sales.

18 May 2016
Automobiles & Components
China Autos
Deutsche Bank AG/Hong Kong Page 37
Figure 51: List of major A-share listed NEV part suppliers in China
公司名称 Company’s full name Ticker (Reuters) Key business profile NEV-related business highlights/products
万丰奥威 Zhejiang Wanfeng Auto Wheel
002085.SZ The company mainly manufactures aluminum alloy auto wheels.
Manufactures lithium batteries through equity investment in CENAT
宜安科技 Dongguan Eontec 300328.SZ The company manufactures aluminum and magnesium alloys, and other alloy precision die-
castings.
Manufactures magnesium and aluminum alloy parts. Key client is BYD (1211.HK)
多氟多 Do-Fluoride Chemicals 002407.SZ The company produces cryolite, aluminum fluoride, and inorganic fluoride compound
products.
Manufactures lithium batteries for NEVs and currently also manufactures new energy
minivan and logistics vehicles
成飞集成 Sichuan Chengfei Integration Technology
002190.SZ The company manufactures car molds, aircraft molds, and frames.
Manufactures lithium batteries for NEVs
*ST 金瑞 Kingray New Materials Science & Technology
600390.SS The company manufactures advanced electronic basic materials, alloy materials, and super-hard
materials.
Manufactures materials for new energy batteries
西部资源 Sichuan Western Resources
600139.SS The company operates in copper mining and trading of copper concentrations.
Manufactures materials for lithium batteries and produces new energy buses through its
subsidiaries
南洋科技 Zhejiang Nanyang Technology
002389.SZ The company manufactures capacitor film, wrapping film, and capacitors.
Manufactures lithium-ion battery separators
当升科技 Beijing Easpring Material Technology
300073.SZ The company manufactures battery chemicals. Manufactures cathode materials for lithium-ion batteries
永贵电器 Zhejiang Yonggui Electric Equipment
300351.SZ The company manufactures rail transit connectors.
Manufactures electric vehicle connectors
中科三环 Beijing Zhong Ke San Huan High-Tech
000970.SZ The company manufactures rare earth permanent magnetic materials and products.
Manufactures neodymium magnet materials applicable to NEVs
佳电股份 Harbin Electric Corp Jiamusi Electric Machine
000922.SZ The company manufactures relays, relay protection devices, automation products,
electrical mutual inductors, electric source products, and other electrical products.
Manufactures electric vehicle motors
松芝股份 Songz Automobile Air Conditioning
002454.SZ The company manufactures car air-conditioning and related products.
Manufactures air conditioning systems for new energy buses
法拉电子 Xiamen Faratronic 600563.SS The company manufactures thin film capacitors and metalized film materials.
Manufactures film capacitors for NEVs
京威股份 Beijing WKW Automotive Parts
002662.SZ The company provides passenger cars with internal and external accessories systems,
develops supporting products and provides related services.
Invested 20% stake in Changchun New Energy Limited and entered the NEV market
方正电机 Zhejiang Founder Motor 002196.SZ The company manufactures household sewing machine motors, industrial sewing machine motors and computerized automatic thread
trimming sewing machines.
Manufactures electric vehicle motors and electric vehicle controller
英威腾 Shenzhen Invt Electric 002334.SZ The company manufactures electricity voltage transformers.
Manufactures electric vehicle control systems
合康变频 Hiconics Drive Technology 300048.SZ The company manufactures high voltage transformers.
Manufactures electric vehicle controllers, core parts for new energy buses, and charging
poles
振华科技 China Zhenhua Group Science & Technology
000733.SZ The company manufactures electronic components, telecommunication equipment, and
electric machines.
Manufactures cathode materials for lithium-ion batteries and integrated circuits
正海磁材 Yantai Zhenghai Magnetic Material
300224.SZ The company manufactures high quality neodymium iron boron permanent magnets, and
provides related services.
Manufactures electric vehicle control systems
欣旺达 Sunwoda Electronic 300207.SZ The company produces li-ion battery module. The company also produces membrate switches
and precision structures.
Manufactures lithium-ion battery modules
纳川股份 Fujian Newchoice Pipe Technology
300198.SZ The company produces plastic pipes. Manufactures powertrain systems for NEVs, and has an NEV operation platform
科力远 Hunan Corun New Energy 600478.SS The company manufactures continuous nickel foam.
Manufactures nickel-metal hydride batteries for Toyota's hybrid models, and established a
hybrid powertrain R&D project in 2016 Source: Bloomberg Financial LP, Reuters, Company data, Deutsche Bank
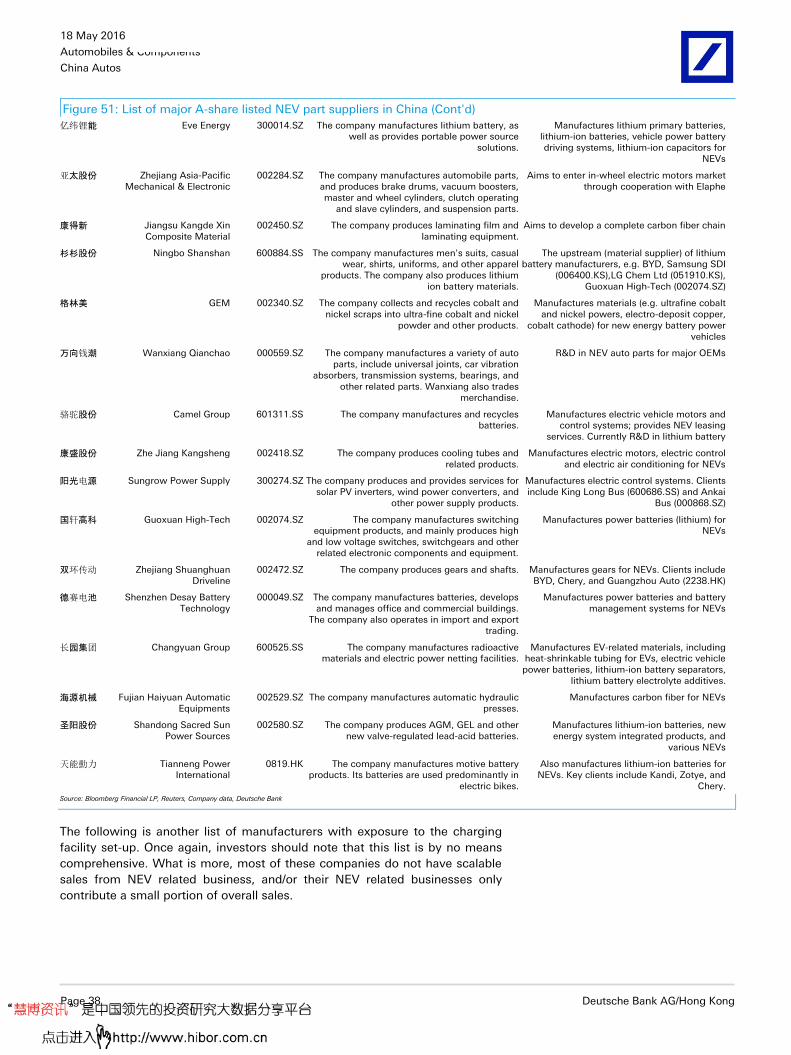
18 May 2016
Automobiles & Components
China Autos
Page 38 Deutsche Bank AG/Hong Kong
Figure 51: List of major A-share listed NEV part suppliers in China (Cont'd)
亿纬锂能 Eve Energy 300014.SZ The company manufactures lithium battery, as well as provides portable power source
solutions.
Manufactures lithium primary batteries, lithium-ion batteries, vehicle power battery driving systems, lithium-ion capacitors for
NEVs
亚太股份 Zhejiang Asia-Pacific Mechanical & Electronic
002284.SZ The company manufactures automobile parts, and produces brake drums, vacuum boosters, master and wheel cylinders, clutch operating
and slave cylinders, and suspension parts.
Aims to enter in-wheel electric motors market through cooperation with Elaphe
康得新 Jiangsu Kangde Xin Composite Material
002450.SZ The company produces laminating film and laminating equipment.
Aims to develop a complete carbon fiber chain
杉杉股份 Ningbo Shanshan 600884.SS The company manufactures men's suits, casual wear, shirts, uniforms, and other apparel
products. The company also produces lithium ion battery materials.
The upstream (material supplier) of lithium battery manufacturers, e.g. BYD, Samsung SDI
(006400.KS),LG Chem Ltd (051910.KS), Guoxuan High-Tech (002074.SZ)
格林美 GEM 002340.SZ The company collects and recycles cobalt and nickel scraps into ultra-fine cobalt and nickel
powder and other products.
Manufactures materials (e.g. ultrafine cobalt and nickel powers, electro-deposit copper,
cobalt cathode) for new energy battery power vehicles
万向钱潮 Wanxiang Qianchao 000559.SZ The company manufactures a variety of auto parts, include universal joints, car vibration
absorbers, transmission systems, bearings, and other related parts. Wanxiang also trades
merchandise.
R&D in NEV auto parts for major OEMs
骆驼股份 Camel Group 601311.SS The company manufactures and recycles batteries.
Manufactures electric vehicle motors and control systems; provides NEV leasing
services. Currently R&D in lithium battery
康盛股份 Zhe Jiang Kangsheng 002418.SZ The company produces cooling tubes and related products.
Manufactures electric motors, electric control and electric air conditioning for NEVs
阳光电源 Sungrow Power Supply 300274.SZ The company produces and provides services for solar PV inverters, wind power converters, and
other power supply products.
Manufactures electric control systems. Clients include King Long Bus (600686.SS) and Ankai
Bus (000868.SZ)
国轩高科 Guoxuan High-Tech 002074.SZ The company manufactures switching equipment products, and mainly produces high
and low voltage switches, switchgears and other related electronic components and equipment.
Manufactures power batteries (lithium) for NEVs
双环传动 Zhejiang Shuanghuan Driveline
002472.SZ The company produces gears and shafts. Manufactures gears for NEVs. Clients include BYD, Chery, and Guangzhou Auto (2238.HK)
德赛电池 Shenzhen Desay Battery Technology
000049.SZ The company manufactures batteries, develops and manages office and commercial buildings.
The company also operates in import and export trading.
Manufactures power batteries and battery management systems for NEVs
长园集团 Changyuan Group 600525.SS The company manufactures radioactive materials and electric power netting facilities.
Manufactures EV-related materials, including heat-shrinkable tubing for EVs, electric vehicle power batteries, lithium-ion battery separators,
lithium battery electrolyte additives.
海源机械 Fujian Haiyuan Automatic Equipments
002529.SZ The company manufactures automatic hydraulic presses.
Manufactures carbon fiber for NEVs
圣阳股份 Shandong Sacred Sun Power Sources
002580.SZ The company produces AGM, GEL and other new valve-regulated lead-acid batteries.
Manufactures lithium-ion batteries, new energy system integrated products, and
various NEVs
天能動力 Tianneng Power International
0819.HK The company manufactures motive battery products. Its batteries are used predominantly in
electric bikes.
Also manufactures lithium-ion batteries for NEVs. Key clients include Kandi, Zotye, and
Chery.
Source: Bloomberg Financial LP, Reuters, Company data, Deutsche Bank
The following is another list of manufacturers with exposure to the charging
facility set-up. Once again, investors should note that this list is by no means
comprehensive. What is more, most of these companies do not have scalable
sales from NEV related business, and/or their NEV related businesses only
contribute a small portion of overall sales.

18 May 2016
Automobiles & Components
China Autos
Deutsche Bank AG/Hong Kong Page 39
Figure 52: List of major A-share listed NEV charging equipment manufacturers in China
公司名称 Company’s full name Ticker (Reuters) Company profile NEV-related business highlights/products
银河电子 Jiangsu Yinhe Electronics
002519.SZ The company produces digital television receiver terminals, information and electronic
equipment structure components, and electronic components.
Provides EV charging equipment (include charging poles and mobile charging equipment)
and in-car AC systems for NEVs
德威新材 Jiangsu Dewei Advanced Materials
300325.SZ The company sells polymer materials for cables.
Manufactures new energy and charging poles' electrical cables
中兴通讯 ZTE 000063.SZ The company markets switches, access servers, videoconferencing systems, mobile
communication systems, data communication devices, and optical communication devices.
Develops proprietary intellectual rights and applies high-power wireless charging series
products in NEVs through its subsidiary ZTEV
中鼎股份 Anhui Zhongding Sealing Parts
000887.SZ The company produces rubber sealing parts, special rubber products, and compounded
rubber.
Manufactures EV charging equipment through its subsidiaries
特锐德 Qingdao TGOOD Electric 300001.SZ The company manufactures electrical transformers and provides related technical
services. The company also provides system solutions for electrical transformer substations.
Develops EV charging systems and provides construction and operation of charging station
services
万马股份 Zhejiang Wanma 002276.SZ The company produces mainly union insulating electric cables of polyethylene, insulating
electric cables of polyvinyl chloride, and other kinds of electric wire cables.
Manufactures EV charging equipment, and operates charging networks
茂硕电源 Shenzhen Moso Power Supply Technology
002660.SZ The company manufactures switching power supply products.
Subsidiaries are involved in manufacturing EV charging equipment
奥特迅 Shenzhen Auto Electric Power Plant
002227.SZ The company manufactures electric automatic power supply equipment and intelligent units.
Manufactures, constructs and operates EV charging equipment
中恒电气 Hangzhou Zhongheng Electric
002364.SZ The company supplies electrical products. Manufactures EV charging poles
森源电气 Henan Senyuan Electric 002358.SZ The company manufactures power distribution system and components.
R&D in intelligent EV charging poles and is preparing to enter the charging pole market in the
next few years
通合科技 Shijiazhuang Tonhe Electronics Technologies
300491.SZ The company specializes in power electronics and combines R&D, manufacture, sales
services for high frequency switching power supply and related products.
Manufactures high frequency switching power supply and related products. Products include EV
charging stations and on-board power
世纪星源 Shenzhen Fountain 000005.SZ The company develops, leases, and manages real estate. It also provides information
services.
Operates EV charging stations inside parking lots on their managed real estate
易事特 Guangdong East Power 300376.SZ The company manufactures UPS power electronic devices.
Manufactures various EV charging equipment
科士达 Shenzhen Kstar Science And Technology
002518.SZ The company engages in uninterruptible power supply and support services of valve-regulated
lead-acid battery research and development, production, sales and support.
Manufactures various EV charging equipment, including DC/AC charging products
和顺电气 Suzhou Industrial Park Heshun Electric
300141.SZ The company is an integrated service provider that utilizes applied power electronics in the
public power supply, distribution and electricity systems for the provision of electricity.
Manufactures various EV charging equipment, constructs charging stations, and aims to develop
more charging station operation platforms
科陆电子 Shenzhen Clou Electronics
002121.SZ The company manufactures power automation equipment and public instruments.
Manufactures, constructs, and operates EV charging stations
南洋股份 Guangdong Nan Yang Cable Group
002212.SZ The company manufactures power wires and cables, as well as PVC materials for wire and
cable making. The company operates under the brand name of NAN cables.
Invests in and constructs EV charging poles at parking lots, and manufactures EV charging
cables
上海普天 Shanghai Potevio Co Ltd 600680.SS The company manufactures and trades telecommunication equipment and electronic
products.
Through equity investment, manufactures EV charging accessory equipment
沃尔核材 Shenzhen Woer Heat-Shrinkable Material
002130.SZ The company manufactures new application electronic & electric products and equipment,
based on nuclear technology.
Through equity investment, manufactures EV charging poles and operates the charging
network
中超控股 Jiangsu Zhongchao 002471.SZ The company produces wires and cables. Manufactures EV charging cables
彩虹精化 Shenzhen Rainbow Fine Chemical Industry
002256.SZ The company manufactures aerosol products. Prefers to equity invest in NEV business, include the operation of NEV service platform
Source: Bloomberg Financial LP, Reuters, Company data, Deutsche Bank

18 May 2016
Automobiles & Components
China Autos
Page 40 Deutsche Bank AG/Hong Kong
Figure 52: List of major A-share listed NEV charging equipment manufacturers in China (Cont'd)
智慧能源 Far East Smarter Energy 600869.SS The company mainly engages in the system design, research and development,
manufacturing, marketing and services of overhead wires, electric cables, wires and
cables for electrical equipment, and special cables.
Develops the cable for EV AC/DC charging; and manufactures EV battery through its subsidiary
科华恒盛 Xiamen Kehua Hengsheng
002335.SZ The company manufactures power supply equipment (Uninterruptible Power Supply
systems).
Develops various EV charging equipments
爱康科技 Jiangsu Akcome Science & Technology
002610.SZ The company produces solar accessories. Main products include solar frames, EVA film, and
mounting brackets. Akcome also provides services to the solar industry.
Establishes EV operation platform through its subsidiary
九洲电气 Harbin Jiuzhou Electric 300040.SZ The company manufactures power transmission and conversion equipment.
Aims to develop EV charging poles
泰坦能源 China Titan Energy Technology
2188.HK The company manufactures power electronic products and equipment
The company also manufactures EV charging products comprising AC EV charging poles,
binning chargers, charging modules, and battery maintenance and management systems.
Source: Bloomberg Financial LP, Reuters, Company data, Deutsche Bank
Foreign companies also making big bets for the Chinese NEV market
Apart from local part suppliers, we also observe that key global suppliers,
especially in the battery arena, have plans to add capacities in China. For
instance, both LG Chem (051910.KS) and Panasonic (6752.T) as amongst the
EV battery market leaders, have plans to establish a battery factory in China.
Upstream: unfading demand for lithium
Our global Metals & Mining team has looked in detail at the exposure of
companies to these trends via the production of lithium and related products
essential for EV batteries. As shown in Figure 53, lithium battery upstream
players mainly provide lithium compounds used for cathode and electrolyte
manufacturing. Middle-stream players produce components of lithium
batteries, mainly including cathode, electrolyte, anode and separator, while
downstream battery producers focus on assembly and packing. Despite having
a simple industry supply chain structure, the whole industry chain could be
considered long and fragmented, as many niche players focus only on one key
activity. In the EV/battery supply chain, they believe lithium is in a sweet spot,
enjoying a tight demand/supply balance and favorable industry structure.
According to the team’s report, “Lithium 101, Welcome to the Lithium-ion Age”,
published in May 2016, the emergence of the EV and energy storage markets
is being driven by a global desire to reduce carbon emissions and break away
from traditional infrastructure networks. This shift in energy use is supported
by the improving economics of lithium-ion batteries. Global battery
consumption is set to increase 5x over the next 10 years, placing pressure on
the battery supply chain and lithium market. The team expects global lithium
demand will increase from 181kt Lithium Carbonate Equivalent (LCE) in 2015
to 535kt LCE by 2025.

18 May 2016
Automobiles & Components
China Autos
Deutsche Bank AG/Hong Kong Page 41
Figure 53: Lithium battery industry chain
Source: Deutsche Bank
Figure 54: Global lithium demand and supply balance
Source: Deutsche Bank, United States Geological Society, Company data
Figure 55: Lithium battery YoY capacity increases through the supply chain
Source: Deutsche Bank estimates, Avicenna energy, GIIB, Chyxx

18 May 2016
Automobiles & Components
China Autos
Page 42 Deutsche Bank AG/Hong Kong
Tianqi is the world’s third-largest lithium supplier, controlling c.18% of global
lithium output, and will likely be the major beneficiary of the favorable NEV
sales trend. Tianqi not only owns the world-class Greenbushes mine, but also
acquired a large, brand-new lithium carbonate processing factory in
Zhangjiagang in 2015. Thus, Tianqi appears well positioned to benefit from this
lithium up-cycle.
Figure 56: Tianqi’s lithium compounds processing capacity in China (2016)
Source: Company data, Deutsche Bank estimates (Tianqi current price as of May 17th 189.00 CNY)
Ganfeng Lithium is one of the largest lithium compound processors in China,
with a total capacity of c.30ktpa LCE in 2016E. Ganfeng is directly benefiting
from higher ASPs of lithium compounds, driven by booming EV sales and lead-
acid battery replacement. Through purchasing shares in Process Minerals
International, Ganfeng will become the largest shareholder (43.1%) of the Mt
Marion project, which should solve the problems of uncertain raw material
supply in the long term.
Figure 57: Ganfeng’s major assets in operation along the industry chain
Source: Company data, Deutsche Bank
18 May 2016
Automobiles & Components
China Autos
Deutsche Bank AG/Hong Kong Page 43
Stock implications
Key points
Among Chinese auto manufacturers with material earnings
contributions from NEV business, we view BYD and Yutong to be the
more investible names.
We initiate coverage of Yutong with a Buy rating, considering that its
NEV bus leadership makes it the prime beneficiary of public bus fleet
electrification.
For BYD-H, we upgrade the stock to Buy on its enhanced earnings
outlook. We maintain Sell on BYD-A on hefty valuation premium vs.
BYD-H.
We also highlight SAIC Motor and BAIC Motor, which have been
adding efforts in its NEV business. We envision higher sales with new
products and favorable local government policies.
Investment thesis for Yutong
Outlook: China’s leading new energy bus manufacturer
Yutong is the largest manufacturer in the new energy bus segment, with a
26.1% market share in 2015 in terms of new energy bus sales volume. The
company offers a comprehensive new energy bus model portfolio, including 1)
pure-electric bus (EV bus) and 2) plug-in hybrid bus (PHEV bus), all eligible for
the government’s new energy vehicle (NEV) subsidy.
Demand growth is still at an early stage and we forecast a 28% CAGR in
volume sales over the next five years. This is after factoring in the positives of
long term demand stimulus from government policy, the improving operating
efficiency of electric bus fleets and the negatives of changes in subsidies
starting this year, as well as the high upfront cost of electric vehicles.
The economic case, as well as the environmental arguments for the sector is
clear in our view – a new energy bus is now more cost-efficient to operate than
a conventional product with similar pay-back period of around 3.7-3.8 years.
By 2020E, we believe that as much 35% of the public bus fleet will have
switched to NEV models.
Yutong Bus has shifted from its traditional product lines and developed a range
of vehicles to supply this market which will enable the company to maintain a
leading market share. By FY18E, half of sales and over 60% of gross profit will
come from new technology products. Based on our forecasts, this will deliver
annual NEV volume growth of 35% and a net income CAGR of 11%.
Valuation
Our target price of RMB25.9 for Zhengzhou Yutong Bus is set at a target 14.0x
average FY16/17E P/E, about 30% above Yutong’s mid-cycle P/E of 10.6x to
reflect our optimism on Yutong’s increasing profit contribution from the new
energy bus segment. This is justified, in our view, since we expect the
company to deliver an 11.1% three-year earnings CAGR in FY15-18E. In
addition, while we think that the average FY16/17E P/BV implied by our target

18 May 2016
Automobiles & Components
China Autos
Page 44 Deutsche Bank AG/Hong Kong
price is 3.9x, at the higher end of the global peer group, we believe this is
justified considering Yutong’s relatively high FY17E ROE of 30%.
Risks
Key downside risks include 1) unexpected changes in the Chinese
government’s new energy bus subsidy policy, 2) weaker-than-expected new
energy bus demand, 3) Yutong’s market share loss in new energy buses, 4) an
unexpected increase in raw material prices, and 5) an inability to adopt new
technology and develop new bus models.
Investment thesis for BYD
Outlook: China’s leading new energy bus manufacturer
In April, BYD reported 1Q16 results in PRC GAAP with gross revenue growing
32.7% YoY to RMB20.3bn. Gross profit margin improved by 1.9ppt YoY
probably on higher NEV and SUV sales contribution, in our view. BYD’s 1Q16
net profit jumped 6.0x YoY to RMB850.7m.
Latest guidance from BYD points to 1H16 earnings of RMB2.3-2.5bn – that is
as much as 85% of our previous estimate for the full year. Its conventional
auto sales figures have been weak with total house-brand PV volume falling
12.6% YoY in 4M16, according to CAAM, but demand for its house-brand
passenger NEV sales and commercial NEV (sales up 121.3% and 34.4% YoY
growth during the same period) have more than overshadowed ICE car sales
weakness.
The company is also showing a significant margin lift in these NEV products
and we raise our earnings forecast for FY16-18E by 18.3-20.0%. With this
increased earnings outlook we now upgrade the share to Buy for the H-shares.
Nevertheless, our clear preference in the China NEV sector is for Yutong over
BYD-H. The principal reason is that we envisage far less competition risk from
new entrants in the bus segment than in passenger cars, where BYD will come
under threat from peers like SAIC Motor and BAIC Motor. We also reiterate
Sell on BYD-A, given its excessive valuation premium over BYD-H.
Figure 58: BYD – Deutsche Bank’s major forecast assumptions
2013 2014 2015 2016E 2017E 2018E
ICE vehicle sales (units) 503,499 419,418 384,437 358,624 370,347 392,114
YoY (%) 11.1% -16.7% -8.3% -6.7% 3.3% 5.9%
Change from old forecast (%) 10.0% 11.3% 11.6%
New energy vehicle sales (units) 3,125 20,840 62,893 104,700 142,000 168,000
YoY (%) -0.9% 566.9% 201.8% 66.5% 35.6% 18.3%
Change from old forecast (%) 7.4% 9.2% 9.4%
Net revenue (RMBm) 49,768 55,366 77,612 99,212 119,802 137,918
YoY (%) 12.1% 11.2% 40.2% 27.8% 20.8% 15.1%
Change from old forecast (%) 4.9% 5.6% 5.7%
Net profit (RMBm) 553 434 2,823 3,457 4,764 5,794
YoY (%) 579.6% -21.6% 551.3% 22.4% 37.8% 21.6%
Change from old forecast (%) 20.0% 18.3% 20.0% Source: Company data, Deutsche Bank estimates

18 May 2016
Automobiles & Components
China Autos
Deutsche Bank AG/Hong Kong Page 45
Valuation
We base our SOTP-derived target price on: 1) 0.7x FY16E PEG to capture
BYD's growth characteristics in the auto segment (87% of SOTP value); and 2)
a peer average FY16E P/E of 14x and 14x for the handset business (10% of
SOTP value) and battery business (3% of SOTP value), respectively. BYD's
implied target FY16E P/E is at 30x, which is the highest target P/E benchmark
among its local peers, and we think this is justified by a 61% FY15-18E three-
year core earnings CAGR.
Risks
Key upside risks (BYD–A) are rapid auto sales and margin improvement, driven
by successful new models, better-than-expected sales, and/or a margin
recovery in the battery and handset component businesses. Key downside
risks (BYD-H) are weaker-than-expected car sales, a slower-than-expected
margin recovery in the battery and handset component businesses, and more
capital fund raising in future years.
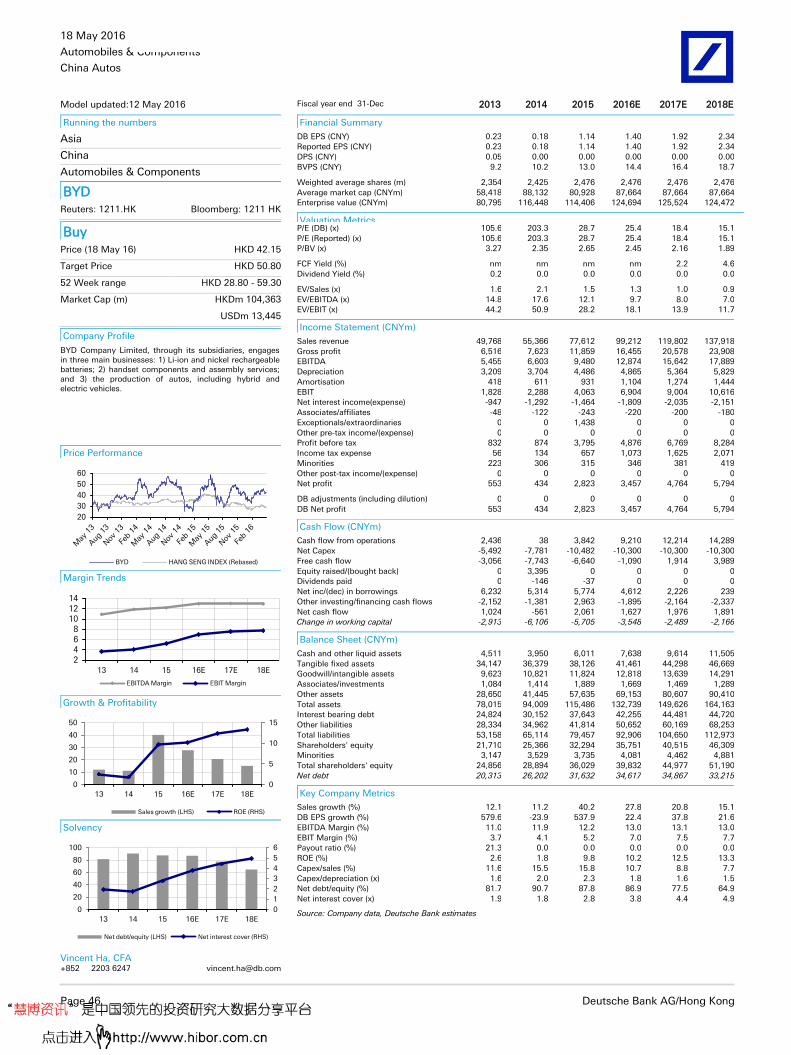
18 May 2016
Automobiles & Components
China Autos
Page 46 Deutsche Bank AG/Hong Kong
Model updated:12 May 2016
Running the numbers
Asia
China
Automobiles & Components
BYD Reuters: 1211.HK Bloomberg: 1211 HK
Buy Price (18 May 16) HKD 42.15
Target Price HKD 50.80
52 Week range HKD 28.80 - 59.30
Market Cap (m) HKDm 104,363
USDm 13,445
Company Profile
BYD Company Limited, through its subsidiaries, engages in three main businesses: 1) Li-ion and nickel rechargeable batteries; 2) handset components and assembly services; and 3) the production of autos, including hybrid and electric vehicles.
Price Performance
20
30
40
50
60
BYD HANG SENG INDEX (Rebased)
Margin Trends
2468
101214
13 14 15 16E 17E 18E
EBITDA Margin EBIT Margin
Growth & Profitability
0
5
10
15
0
10
20
30
40
50
13 14 15 16E 17E 18E
Sales growth (LHS) ROE (RHS)
Solvency
0
1
2
3
4
5
6
0
20
40
60
80
100
13 14 15 16E 17E 18E
Net debt/equity (LHS) Net interest cover (RHS)
Vincent Ha, CFA
+852 2203 6247 [email protected]
Fiscal year end 31-Dec 2013 2014 2015 2016E 2017E 2018E
Financial Summary
DB EPS (CNY) 0.23 0.18 1.14 1.40 1.92 2.34
Reported EPS (CNY) 0.23 0.18 1.14 1.40 1.92 2.34
DPS (CNY) 0.05 0.00 0.00 0.00 0.00 0.00
BVPS (CNY) 9.2 10.2 13.0 14.4 16.4 18.7
Weighted average shares (m) 2,354 2,425 2,476 2,476 2,476 2,476
Average market cap (CNYm) 58,418 88,132 80,928 87,664 87,664 87,664
Enterprise value (CNYm) 80,795 116,448 114,406 124,694 125,524 124,472
Valuation Metrics P/E (DB) (x) 105.6 203.3 28.7 25.4 18.4 15.1
P/E (Reported) (x) 105.6 203.3 28.7 25.4 18.4 15.1
P/BV (x) 3.27 2.35 2.65 2.45 2.16 1.89
FCF Yield (%) nm nm nm nm 2.2 4.6
Dividend Yield (%) 0.2 0.0 0.0 0.0 0.0 0.0
EV/Sales (x) 1.6 2.1 1.5 1.3 1.0 0.9
EV/EBITDA (x) 14.8 17.6 12.1 9.7 8.0 7.0
EV/EBIT (x) 44.2 50.9 28.2 18.1 13.9 11.7
Income Statement (CNYm)
Sales revenue 49,768 55,366 77,612 99,212 119,802 137,918
Gross profit 6,516 7,623 11,859 16,455 20,578 23,908
EBITDA 5,455 6,603 9,480 12,874 15,642 17,889
Depreciation 3,209 3,704 4,486 4,865 5,364 5,829
Amortisation 418 611 931 1,104 1,274 1,444
EBIT 1,828 2,288 4,063 6,904 9,004 10,616
Net interest income(expense) -947 -1,292 -1,464 -1,809 -2,035 -2,151
Associates/affiliates -48 -122 -243 -220 -200 -180
Exceptionals/extraordinaries 0 0 1,438 0 0 0
Other pre-tax income/(expense) 0 0 0 0 0 0
Profit before tax 832 874 3,795 4,876 6,769 8,284
Income tax expense 56 134 657 1,073 1,625 2,071
Minorities 223 306 315 346 381 419
Other post-tax income/(expense) 0 0 0 0 0 0
Net profit 553 434 2,823 3,457 4,764 5,794
DB adjustments (including dilution) 0 0 0 0 0 0
DB Net profit 553 434 2,823 3,457 4,764 5,794
Cash Flow (CNYm)
Cash flow from operations 2,436 38 3,842 9,210 12,214 14,289
Net Capex -5,492 -7,781 -10,482 -10,300 -10,300 -10,300
Free cash flow -3,056 -7,743 -6,640 -1,090 1,914 3,989
Equity raised/(bought back) 0 3,395 0 0 0 0
Dividends paid 0 -146 -37 0 0 0
Net inc/(dec) in borrowings 6,232 5,314 5,774 4,612 2,226 239
Other investing/financing cash flows -2,152 -1,381 2,963 -1,895 -2,164 -2,337
Net cash flow 1,024 -561 2,061 1,627 1,976 1,891
Change in working capital -2,913 -6,106 -5,705 -3,548 -2,489 -2,166
Balance Sheet (CNYm)
Cash and other liquid assets 4,511 3,950 6,011 7,638 9,614 11,505
Tangible fixed assets 34,147 36,379 38,126 41,461 44,298 46,669
Goodwill/intangible assets 9,623 10,821 11,824 12,818 13,639 14,291
Associates/investments 1,084 1,414 1,889 1,669 1,469 1,289
Other assets 28,650 41,445 57,635 69,153 80,607 90,410
Total assets 78,015 94,009 115,486 132,739 149,626 164,163
Interest bearing debt 24,824 30,152 37,643 42,255 44,481 44,720
Other liabilities 28,334 34,962 41,814 50,652 60,169 68,253
Total liabilities 53,158 65,114 79,457 92,906 104,650 112,973
Shareholders' equity 21,710 25,366 32,294 35,751 40,515 46,309
Minorities 3,147 3,529 3,735 4,081 4,462 4,881
Total shareholders' equity 24,856 28,894 36,029 39,832 44,977 51,190
Net debt 20,313 26,202 31,632 34,617 34,867 33,215
Key Company Metrics
Sales growth (%) 12.1 11.2 40.2 27.8 20.8 15.1
DB EPS growth (%) 579.6 -23.9 537.9 22.4 37.8 21.6
EBITDA Margin (%) 11.0 11.9 12.2 13.0 13.1 13.0
EBIT Margin (%) 3.7 4.1 5.2 7.0 7.5 7.7
Payout ratio (%) 21.3 0.0 0.0 0.0 0.0 0.0
ROE (%) 2.6 1.8 9.8 10.2 12.5 13.3
Capex/sales (%) 11.6 15.5 15.8 10.7 8.8 7.7
Capex/depreciation (x) 1.6 2.0 2.3 1.8 1.6 1.5
Net debt/equity (%) 81.7 90.7 87.8 86.9 77.5 64.9
Net interest cover (x) 1.9 1.8 2.8 3.8 4.4 4.9
Source: Company data, Deutsche Bank estimates

18 May 2016
Automobiles & Components
China Autos
Deutsche Bank AG/Hong Kong Page 47
SAIC and BAIC could become viable NEV players
In prior years, bigger Chinese auto manufacturers did not appear to be keen on
developing NEV products due to a lack of scale and consequent losses from a
high battery cost. However, substantial government subsidies, which are
payable to manufacturers, have since helped to cover the incremental cost of
making NEVs (mainly battery cost), putting paid to such concerns. Moreover,
with an imminent agenda to lower average PV fuel consumption level by
2020E, manufacturers are more incentivized to develop NEVs now.
Accordingly, we identify SAIC Motor and BAIC Motor among the pioneers in
major auto SOEs’ participation in the NEV sector.
SAIC Motor now has about 1,000 R&D personnel dedicated to NEV research
on various platforms, including conventional hybrids, PHEVs, EVs, and FCVs.
In 2015, it announced a RMB15bn private placement plan to boost NEV/smart
car R&D in 2016-20E. In products, SAIC Motor has an e50 EV, China’s first EV
available to the private market in 2012. The company also launched e550
PHEV in 2014 and will launch two extra PHEVs, namely e950 sedan and RX5
PHEV SUV, in the foreseeable future. Apart from that, NEVs will come out from
its JVs like SAIC Volkswagen. In 2015, SAIC Motor sold 11,123 passenger
NEVs, according to CAAM, accounting for merely 0.2% of its total PV sales.
However, we think that number will increase.
For BAIC Motor, its local brand currently produces EVs, with the drivetrain
system provided by its affiliate BAIC BJEV. In FY15, it sold 20,131 EVs,
accounting for 1.2% of BAIC Motor’s total PV sales. According to management,
even though BAIC BJEV has obtained its own license to make and sell NEVs
directly, that affiliate is likely to focus on the development of low-end and high-
end NEVs with distinct platforms. Meanwhile, BAIC Motor will continue to
produce NEVs that share platforms with existing ICE products. For instant, its
key EV model, EV160/EV200, is based on the Senova D20 sedan. Going
forward, BAIC Motor is launching EU260 EV, ES210 EV and EX200 EV based
on Senova D50 sedan, D80 sedan and X25 SUV, respectively.
Apart from products, another key point is that SAIC Motor and BAIC Motor are
based in Shanghai and Beijing, respectively, cities that account for about 70%
of national NEV sales, in our estimates. With the Shanghai/Beijing
governments’ relentless push for NEV adoption using subsidies and a
favorable policy for NEV users, we think SAIC Motor and BAIC Motor will
benefit the most vs. peers in those two markets.

18 May 2016
Automobiles & Components
China Autos
Page 48 Deutsche Bank AG/Hong Kong
Sector risks
Changes in government NEV subsidy scheme
It seems obvious to us that the China NEV market, whether viewed in terms of
demand or supply, is mainly driven by government subsidies and other
supportive policies. As such, any unexpected dwindling in subsidy level, for
example much lower local government subsidies amid weakened local
governments’ financial strength, could negatively affect NEV demand. One
good proof of the impact is the 1Q16 QoQ decline in NEV sales when local
governments reformulated their new subsidy scheme and with the central
government’s investigations into subsidy cheating.
On the positive side, if the government wanted to ensure NEV take-ups in the
upcoming years and beef up its policy support, NEV demand could be further
front-loaded and provide upside in the near to medium term.
Developments in new technologies to replace NEVs
We think that while NEVs are more environmentally friendly than ICE cars,
they do have shortcomings, including 1) pollution at the electricity generation
level (especially at coal-fired power plants), 2) battery disposal, 3) long
charging times, which make EV less ideal for long-haul travel. Therefore, the
auto industry has been conducting other fuel-efficient R&D, alongside NEV
R&D. This includes improving ICE efficiency efforts and FCV R&D. While these
options currently appear costly with unsolved environmental concerns (e.g.
carbon emission during hydrogen generation), any technological or cost
breakthrough could post a threat to EV/PHEV demand.
Indeed, since we think EV sales are technically unlikely to have a high
contribution to total sales before 2020E (e.g. >5%), we still see opportunities
for conventional hybrid products to thrive while OEMs need to comply with
stricter fuel efficiency and emission limits. Apart from that, electric motors
appear to be a more sustainable segment because hybrid vehicles, PHEVs,
EVs, and FCVs all need motors, while EV battery manufacturers are also
subject to technology change risks.
Over-competition could erode margins
As mentioned in the previous section, both traditional and non-traditional auto
companies are involved in the development of EVs, with even more new
products to come out from non-traditional players. As such, crowding in the
products space could lead to margin pressure before production costs are able
to come down.
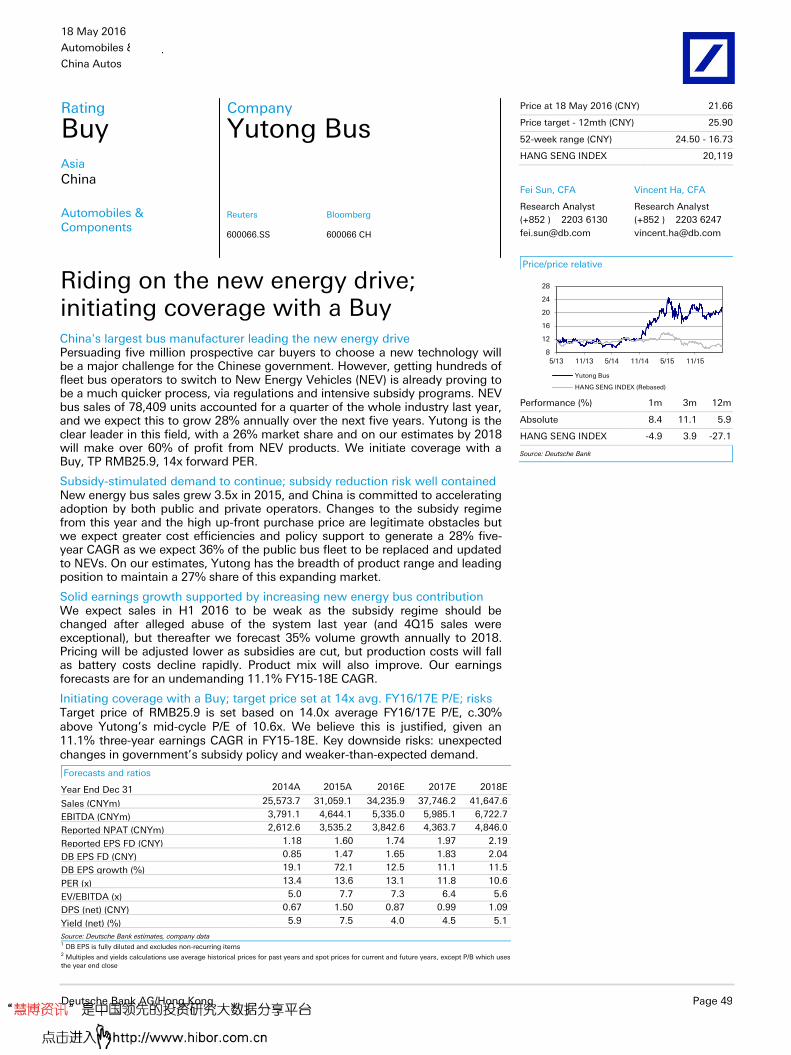
18 May 2016
Automobiles & Components
China Autos
Deutsche Bank AG/Hong Kong Page 49
Reuters Bloomberg
600066.SS 600066 CH
Forecasts and ratios
Year End Dec 31 2014A 2015A 2016E 2017E 2018E
Sales (CNYm) 25,573.7 31,059.1 34,235.9 37,746.2 41,647.6
EBITDA (CNYm) 3,791.1 4,644.1 5,335.0 5,985.1 6,722.7
Reported NPAT (CNYm) 2,612.6 3,535.2 3,842.6 4,363.7 4,846.0
Reported EPS FD (CNY) 1.18 1.60 1.74 1.97 2.19
DB EPS FD (CNY) 0.85 1.47 1.65 1.83 2.04
DB EPS growth (%) 19.1 72.1 12.5 11.1 11.5
PER (x) 13.4 13.6 13.1 11.8 10.6
EV/EBITDA (x) 5.0 7.7 7.3 6.4 5.6
DPS (net) (CNY) 0.67 1.50 0.87 0.99 1.09
Yield (net) (%) 5.9 7.5 4.0 4.5 5.1
Source: Deutsche Bank estimates, company data 1 DB EPS is fully diluted and excludes non-recurring items 2 Multiples and yields calculations use average historical prices for past years and spot prices for current and future years, except P/B which uses
the year end close
China's largest bus manufacturer leading the new energy drive Persuading five million prospective car buyers to choose a new technology will be a major challenge for the Chinese government. However, getting hundreds of fleet bus operators to switch to New Energy Vehicles (NEV) is already proving to be a much quicker process, via regulations and intensive subsidy programs. NEV bus sales of 78,409 units accounted for a quarter of the whole industry last year, and we expect this to grow 28% annually over the next five years. Yutong is the clear leader in this field, with a 26% market share and on our estimates by 2018 will make over 60% of profit from NEV products. We initiate coverage with a Buy, TP RMB25.9, 14x forward PER.
Subsidy-stimulated demand to continue; subsidy reduction risk well contained New energy bus sales grew 3.5x in 2015, and China is committed to accelerating adoption by both public and private operators. Changes to the subsidy regime from this year and the high up-front purchase price are legitimate obstacles but we expect greater cost efficiencies and policy support to generate a 28% five-year CAGR as we expect 36% of the public bus fleet to be replaced and updated to NEVs. On our estimates, Yutong has the breadth of product range and leading position to maintain a 27% share of this expanding market.
Solid earnings growth supported by increasing new energy bus contribution We expect sales in H1 2016 to be weak as the subsidy regime should be changed after alleged abuse of the system last year (and 4Q15 sales were exceptional), but thereafter we forecast 35% volume growth annually to 2018. Pricing will be adjusted lower as subsidies are cut, but production costs will fall as battery costs decline rapidly. Product mix will also improve. Our earnings forecasts are for an undemanding 11.1% FY15-18E CAGR.
Initiating coverage with a Buy; target price set at 14x avg. FY16/17E P/E; risks Target price of RMB25.9 is set based on 14.0x average FY16/17E P/E, c.30% above Yutong’s mid-cycle P/E of 10.6x. We believe this is justified, given an 11.1% three-year earnings CAGR in FY15-18E. Key downside risks: unexpected changes in government’s subsidy policy and weaker-than-expected demand.
Rating
Buy Asia
China
Automobiles & Components
Company
Yutong Bus
Riding on the new energy drive; initiating coverage with a Buy
Price at 18 May 2016 (CNY) 21.66
Price target - 12mth (CNY) 25.90
52-week range (CNY) 24.50 - 16.73
HANG SENG INDEX 20,119
Fei Sun, CFA
Research Analyst
(+852 ) 2203 6130
Vincent Ha, CFA
Research Analyst
(+852 ) 2203 6247
Price/price relative
8
12
16
20
24
28
5/13 11/13 5/14 11/14 5/15 11/15
Yutong Bus
HANG SENG INDEX (Rebased)
Performance (%) 1m 3m 12m
Absolute 8.4 11.1 5.9
HANG SENG INDEX -4.9 3.9 -27.1
Source: Deutsche Bank

18 May 2016
Automobiles & Components
China Autos
Page 50 Deutsche Bank AG/Hong Kong
Model updated:18 May 2016
Running the numbers
Asia
China
Automobiles & Components
Yutong Bus Reuters: 600066.SS Bloomberg: 600066 CH
Buy Price (18 May 16) CNY 21.66
Target Price CNY 25.90
52 Week range CNY 16.73 - 24.50
Market Cap (m) CNYm 47,954
USDm 7,355
Company Profile
Zhengzhou Yutong Bus Co., Ltd. is a large-scale modern manufacturing company specialized in the R&D, manufacturing and sales of bus products. Its main plant is located in Zhengzhou Yutong Industrial Park, Zhengzhou, Henan province, which covers an area of 1.12 million square meters.
Price Performance
81216202428
Yutong Bus HANG SENG INDEX (Rebased)
Margin Trends
11
12
14
15
17
13 14 15 16E 17E 18E
EBITDA Margin EBIT Margin
Growth & Profitability
232425262728293031
0
5
10
15
20
25
13 14 15 16E 17E 18E
Sales growth (LHS) ROE (RHS)
Solvency
-70-60-50-40-30-20-10
0
13 14 15 16E 17E 18E
Net debt/equity (LHS) Net interest cover (RHS)
Fei Sun, CFA +852 2203 6130 [email protected]
Fiscal year end 31-Dec 2013 2014 2015 2016E 2017E 2018E
Financial Summary
DB EPS (CNY) 0.71 0.85 1.47 1.65 1.83 2.04
Reported EPS (CNY) 1.02 1.18 1.60 1.74 1.97 2.19
DPS (CNY) 0.29 0.67 1.50 0.87 0.99 1.09
BVPS (CNY) 4.3 4.9 5.8 6.0 7.1 8.4
Weighted average shares (m) 2,221 2,216 2,215 2,214 2,214 2,214
Average market cap (CNYm) 23,374 25,245 44,069 47,954 47,954 47,954
Enterprise value (CNYm) 17,810 19,115 35,762 39,191 38,456 37,940
Valuation Metrics P/E (DB) (x) 14.7 13.4 13.6 13.1 11.8 10.6
P/E (Reported) (x) 10.3 9.7 12.5 12.5 11.0 9.9
P/BV (x) 2.57 2.96 3.87 3.58 3.03 2.59
FCF Yield (%) 7.1 5.1 10.7 7.9 5.6 5.7
Dividend Yield (%) 2.7 5.9 7.5 4.0 4.5 5.1
EV/Sales (x) 0.8 0.7 1.2 1.1 1.0 0.9
EV/EBITDA (x) 5.9 5.0 7.7 7.3 6.4 5.6
EV/EBIT (x) 7.5 6.1 9.2 8.9 7.9 7.0
Income Statement (CNYm)
Sales revenue 22,056 25,574 31,059 34,236 37,746 41,648
Gross profit 4,980 6,092 7,753 8,482 9,255 10,104
EBITDA 3,016 3,791 4,644 5,335 5,985 6,723
Depreciation 623 637 691 879 1,031 1,211
Amortisation 20 32 47 65 78 93
EBIT 2,372 3,122 3,906 4,391 4,876 5,419
Net interest income(expense) 3 25 142 11 13 11
Associates/affiliates 0 0 0 0 0 0
Exceptionals/extraordinaries 0 0 0 0 0 0
Other pre-tax income/(expense) 243 -96 56 55 172 191
Profit before tax 2,618 3,051 4,104 4,457 5,061 5,620
Income tax expense 328 398 517 557 633 703
Minorities 28 40 52 57 65 72
Other post-tax income/(expense) 0 0 0 0 0 0
Net profit 2,263 2,613 3,535 3,843 4,364 4,846
DB adjustments (including dilution) -675 -725 -288 -190 -304 -320
DB Net profit 1,588 1,888 3,247 3,653 4,059 4,526
Cash Flow (CNYm)
Cash flow from operations 2,802 3,205 6,010 5,445 4,624 5,017
Net Capex -1,146 -1,914 -1,294 -1,642 -1,935 -2,282
Free cash flow 1,656 1,291 4,715 3,802 2,689 2,735
Equity raised/(bought back) 47 34 0 0 0 0
Dividends paid -932 -922 -1,608 -3,321 -1,921 -2,182
Net inc/(dec) in borrowings -285 -195 -4 0 0 0
Other investing/financing cash flows 976 125 -2,293 12 13 14
Net cash flow 1,463 333 810 494 781 566
Change in working capital -113 -410 1,427 566 -940 -1,217
Balance Sheet (CNYm)
Cash and other liquid assets 5,613 6,016 6,699 7,193 7,974 8,540
Tangible fixed assets 3,874 4,586 4,657 5,125 5,672 6,310
Goodwill/intangible assets 704 940 1,464 1,723 2,034 2,406
Associates/investments 149 170 1,687 1,705 1,725 1,746
Other assets 8,276 12,111 15,633 16,945 18,328 19,889
Total assets 18,616 23,823 30,139 32,692 35,733 38,891
Interest bearing debt 165 0 0 0 0 0
Other liabilities 8,940 12,963 17,200 19,174 19,707 20,130
Total liabilities 9,104 12,963 17,200 19,174 19,707 20,130
Shareholders' equity 9,478 10,804 12,861 13,382 15,825 18,489
Minorities 33 56 79 136 200 272
Total shareholders' equity 9,511 10,861 12,939 13,518 16,025 18,761
Net debt -5,448 -6,016 -6,699 -7,193 -7,974 -8,540
Key Company Metrics
Sales growth (%) 12.3 15.9 21.4 10.2 10.3 10.3
DB EPS growth (%) -5.3 19.1 72.1 12.5 11.1 11.5
EBITDA Margin (%) 13.7 14.8 15.0 15.6 15.9 16.1
EBIT Margin (%) 10.8 12.2 12.6 12.8 12.9 13.0
Payout ratio (%) 28.2 56.5 94.0 50.0 50.0 50.0
ROE (%) 27.0 25.8 29.9 29.3 29.9 28.2
Capex/sales (%) 5.3 7.5 4.2 4.8 5.1 5.5
Capex/depreciation (x) 1.8 2.9 1.8 1.7 1.7 1.8
Net debt/equity (%) -57.3 -55.4 -51.8 -53.2 -49.8 -45.5
Net interest cover (x) nm nm nm nm nm nm
Source: Company data, Deutsche Bank estimates

18 May 2016
Automobiles & Components
China Autos
Deutsche Bank AG/Hong Kong Page 51
Investment thesis
China’s leading new energy bus manufacturer
Yutong is the largest manufacturer in the new energy bus segment, with a
26.1% market share in 2015 in terms of new energy bus sales volume. The
company offers a comprehensive new energy bus model portfolio, including 1)
pure-electric bus (EV bus) and 2) plug-in hybrid bus (PHEV bus), all eligible for
the government’s new energy vehicle (NEV) subsidy.
According to the China Association of Automobile Manufacturers (CAAM),
sales of new energy bus reached 78,409 units in 2015, up 3.5x YoY,
accounting for 90% of total new energy commercial vehicle sales and 24% of
total new energy vehicle sales.
Demand growth is still at an early stage and we forecast a 28% CAGR in
volume sales over the next five years. This is after factoring in the positives of
long term demand stimulus from government policy, the improving operating
efficiency of electric bus fleets and the negatives of changes in subsidies
starting this year, as well as the high upfront cost of electric vehicles.
The economic case, as well as the environmental arguments for the sector is
clear in our view – a new energy bus is now more cost-efficient to operate than
a conventional product with similar pay-back period of around 3.7-3.8 years.
By 2020, we believe that as much 35% of the public bus fleet will have
switched to NEV models.
Yutong Bus has shifted from its traditional product lines and developed a range
of vehicles to supply this market which will enable the company to maintain a
leading market share. By FY18E, half of sales and over 60% of gross profit will
come from new technology products. Based on our forecasts, this will deliver
annual NEV volume growth of 35% and a net income CAGR of 11%.
Valuation
Our target price of RMB25.9 for Zhengzhou Yutong Bus is set at a target 14.0x
average FY16/17E P/E, about 30% above Yutong’s mid-cycle P/E of 10.6x to
reflect our optimism on Yutong’s increasing profit contribution from the new
energy bus segment. This is justified, in our view, since we expect the
company to deliver an 11.1% three-year earnings CAGR in FY15-18E. In
addition, while we think that the average FY16/17E P/BV implied by our target
price is 3.9x, at the higher end of the global peer group, we believe this is
justified considering Yutong’s relatively high FY17E ROE of 30%.
Risks
Key downside risks include (1) unexpected changes in the Chinese
government’s new energy bus subsidy policy; (2) weaker-than-expected new
energy bus demand; (3) market share loss in new energy bus at Yutong; (4) an
unexpected increase in raw material prices; and (5) any inability to adopt new
technology and develop new bus models.
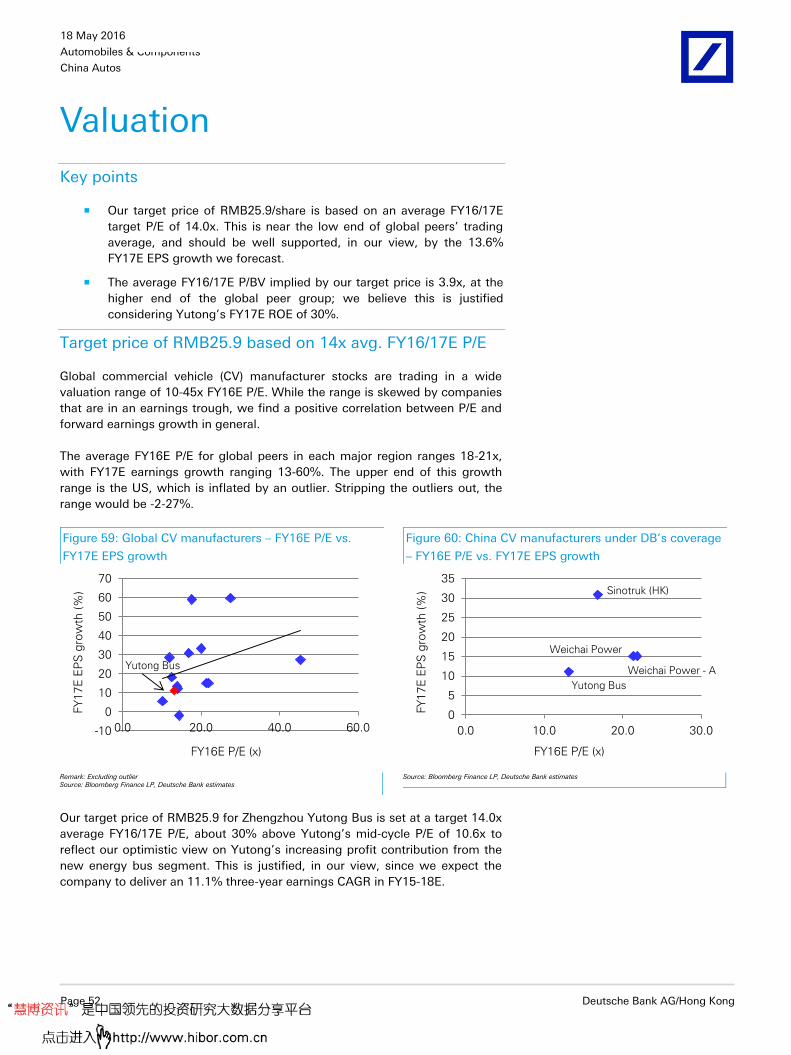
18 May 2016
Automobiles & Components
China Autos
Page 52 Deutsche Bank AG/Hong Kong
Valuation
Key points
Our target price of RMB25.9/share is based on an average FY16/17E
target P/E of 14.0x. This is near the low end of global peers’ trading
average, and should be well supported, in our view, by the 13.6%
FY17E EPS growth we forecast.
The average FY16/17E P/BV implied by our target price is 3.9x, at the
higher end of the global peer group; we believe this is justified
considering Yutong’s FY17E ROE of 30%.
Target price of RMB25.9 based on 14x avg. FY16/17E P/E
Global commercial vehicle (CV) manufacturer stocks are trading in a wide
valuation range of 10-45x FY16E P/E. While the range is skewed by companies
that are in an earnings trough, we find a positive correlation between P/E and
forward earnings growth in general.
The average FY16E P/E for global peers in each major region ranges 18-21x,
with FY17E earnings growth ranging 13-60%. The upper end of this growth
range is the US, which is inflated by an outlier. Stripping the outliers out, the
range would be -2-27%.
Figure 59: Global CV manufacturers – FY16E P/E vs.
FY17E EPS growth
Figure 60: China CV manufacturers under DB’s coverage
– FY16E P/E vs. FY17E EPS growth
-10
0
10
20
30
40
50
60
70
0.0 20.0 40.0 60.0
FY16E P/E (x)
FY
17
E E
PS
gro
wth
(%
)
Yutong Bus
0
5
10
15
20
25
30
35
0.0 10.0 20.0 30.0
FY16E P/E (x)
FY
17
E E
PS
gro
wth
(%
) Sinotruk (HK)
Yutong Bus
Weichai Power - A
Weichai Power
Remark: Excluding outlier Source: Bloomberg Finance LP, Deutsche Bank estimates
Source: Bloomberg Finance LP, Deutsche Bank estimates
Our target price of RMB25.9 for Zhengzhou Yutong Bus is set at a target 14.0x
average FY16/17E P/E, about 30% above Yutong’s mid-cycle P/E of 10.6x to
reflect our optimistic view on Yutong’s increasing profit contribution from the
new energy bus segment. This is justified, in our view, since we expect the
company to deliver an 11.1% three-year earnings CAGR in FY15-18E.

18 May 2016
Automobiles & Components
China Autos
Deutsche Bank AG/Hong Kong Page 53
Figure 61: Yutong Bus – rolling forward P/E band Figure 62: Yutong Bus – rolling forward P/BV band
0
5
10
15
20
25
30
Ju
l-0
4
Ju
l-0
5
Ju
l-0
6
Ju
l-0
7
Jul-
08
Ju
l-0
9
Jul-
10
Ju
l-1
1
Ju
l-1
2
Ju
l-1
3
Ju
l-1
4
Ju
l-1
5
Mean
-1 SD
+1 SD
(x)
0.0
1.0
2.0
3.0
4.0
5.0
6.0
7.0
8.0
Ju
l-0
4
Ju
l-0
5
Jul-
06
Ju
l-0
7
Jul-
08
Ju
l-0
9
Ju
l-1
0
Ju
l-1
1
Ju
l-1
2
Ju
l-1
3
Ju
l-1
4
Ju
l-1
5
Mean
-1 SD
+1 SD
(x)
Source: Company data, Bloomberg Finance LP, Deutsche Bank estimates
Source: Company data, Bloomberg Finance LP, Deutsche Bank estimates
Figure 63: Valuation comparison of global commercial vehicle manufacturers (as of 17 May 2016)
Ticker Company Rec Cur Price TP Mkt cap PE (x) EPS gwth (%) P/BV (x) ROAE (%) Yield (%)
(HKD) (USDm) 2016E 2017E 2016E 2017E 2016E 2017E 2016E 2017E 2016E 2017E
Europe
VOLVb.ST Volvo Not rated SEK 93.30 NA 23,984 13.8 12.2 -18.8 13.5 2.05 1.86 16.1 16.2 3.4 3.8
MANG.DE MAN Hold EUR 94.84 82.00 15,803 22.9 NA 265.1 NA 2.71 NA 12.0 NA 3.2 NA
FI.MI CNH Industrial Buy EUR 9.75 12.00 NA NA NA NA NA NA NA NA NA NA NA
Un-weighted average 18.3 12.2 123.1 13.5 2.38 1.86 16.4 16.2 3.3 3.8
US
PCAR.OQ Paccar Inc. Not rated USD 57.01 NA 19,766 14.4 14.6 -12.9 -1.9 2.83 2.40 18.9 23.1 3.7 3.3
NAV.N Navistar Not rated USD 11.55 NA 949 21.6 9.7 138.4 122.5 NA NA -1.8 -3.6 0.0 0.0
Un-weighted average 18.0 12.2 62.8 60.3 2.83 2.40 8.5 9.8 1.8 1.7
Asia excluding China A-shares
7202.T Isuzu Motors* Buy JPY 1,211.0 1,400.0 9,704 10.2 8.3 -0.7 5.5 1.28 1.06 15.2 14.0 2.3 3.3
7205.T Hino Motors* Buy JPY 1,067.0 1,400.0 6,780 12.5 8.0 -12.6 18.2 1.63 1.20 15.4 16.4 2.7 4.2
ASOK.BO Ashok Leyland* Buy INR 102.80 125.00 4,385 27.4 17.2 429.9 59.8 4.93 4.06 19.3 25.9 0.7 1.2
2338.HK Weichai Power Sell HKD 9.00 4.70 4,636 21.3 18.5 39.0 15.1 0.87 0.84 4.2 4.6 0.5 0.5
3808.HK Sinotruk (HK) Hold HKD 3.57 3.30 1,270 16.8 12.8 59.7 30.9 0.42 0.41 2.5 3.2 2.4 3.1
Un-weighted average 17.6 13.0 103.1 25.9 1.83 1.51 11.3 12.8 1.7 2.5
China A-shares
600066.SS Yutong Bus Buy CNY 21.58 25.90 7,328 13.1 11.8 12.5 11.1 3.57 3.02 29.3 29.9 4.0 4.6
000957.SZ Zhongtong Bus Not rated CNY 28.66 NA 1,248 17.6 11.0 -0.9 59.1 NA NA 30.2 28.1 0.7 0.7
600686.SS Xiamen King Long Not rated CNY 13.03 NA 1,179 11.9 9.2 10.1 28.5 2.03 2.16 17.2 19.8 1.3 2.0
600006.SS DFMC Limited Not rated CNY 6.29 NA 1,840 20.0 15.0 74.4 33.3 NA NA NA NA NA NA
600166.SS Beiqi Foton Not rated CNY 5.08 NA 2,547 45.3 35.6 -15.4 27.3 0.88 0.87 1.8 2.4 0.6 0.8
000338.SZ Weichai Power-A Sell CNY 7.74 3.90 4,745 21.8 19.0 39.0 15.1 0.89 0.86 4.2 4.6 0.5 0.5
600303.SS SG Automotive Not rated CNY 11.05 NA 999 14.0 12.5 341.2 12.0 NA NA 17.5 17.1 NA NA
Un-weighted average 20.5 16.3 65.8 26.6 1.84 1.73 16.7 17.0 1.4 1.7 * Fiscal years ended March 2017 and 2018 are referenced instead Source: Company data, Deutsche Bank estimates, Bloomberg Finance LP estimates for NR stocks

18 May 2016
Automobiles & Components
China Autos
Page 54 Deutsche Bank AG/Hong Kong
Cross check: P/BV vs. ROE
Global CV manufacturer stocks are trading at 1.8-2.8x FY16E P/BV in their
respective regions. For Yutong Bus, we think that the average FY16/17E P/BV
of 3.9x implied by our target price, at the higher end of the global trading
average, is justified considering its relatively high FY17E ROE of 30%.
Figure 64: Global CV manufacturers – FY16E P/BV vs.
FY17E ROE
Figure 65: China CV manufacturers under DB’s coverage
– FY16E P/BV vs. FY17E ROE
0
5
10
15
20
25
30
35
40
0.0 2.0 4.0 6.0
FY16E P/BV (x)
FY
17
E R
OE
(%
) Yutong Bus
0
5
10
15
20
25
30
35
0.0 1.0 2.0 3.0 4.0
FY16E P/BV (x)
FY
17
E R
OE
(%
)
Yutong Bus
Sinotruk (HK)
Weichai Power
Weichai Power - A
Remark: Excluding outlier Source: Bloomberg Finance LP, Deutsche Bank estimates
Remark: Excluding outlier Source: Bloomberg Finance LP, Deutsche Bank estimates
Cross check: discounted cash flow (DCF)
We also cross check our P/E-derived target price with a DCF model. To
elaborate, we calculate the free cash flow of Yutong for FY18E explicitly. For
FY19-26E, we assume that the EBIT growth rate will gradually decline until it
reaches a terminal growth rate of 1.0%, which is our prudent assumption of
the mature perpetual growth rate of the China auto sector after 10 years.
In deriving the discount rate (WACC), we use Deutsche Bank’s house
estimates of the China risk-free rate (3.9%) and equity risk premium (5.6%).
Besides, we apply a beta of 1.0, a 5.0% pre-tax cost of debt (4.4% after-tax
cost of debt), and 85% equity ratio.
Our DCF-derived equity value of RMB26.4 per share is in line with our P/E-
based target price of RMB25.9 for Yutong.

18 May 2016
Automobiles & Components
China Autos
Deutsche Bank AG/Hong Kong Page 55
Figure 66: Yutong Bus – DCF analysis
2017E 2018E 2019E 2020E 2021E 2022E 2023E 2024E 2025E 2026E
EBIT 4,876.1 5,418.5 5,801.8 6,071.3 6,264.8 6,409.6 6,524.2 6,620.2 6,705.2 6,772.2
YoY% 11.0% 11.1% 7.1% 4.6% 3.2% 2.3% 1.8% 1.5% 1.3% 1.0%
Less tax on EBIT (609.5) (677.3) (725.2) (758.9) (783.1) (801.2) (815.5) (827.5) (838.1) (846.5)
Effective tax rate 12.5% 12.5% 12.5% 12.5% 12.5% 12.5% 12.5% 12.5% 12.5% 12.5%
Less change in working capital 939.7 1,216.9 365.1 109.5 32.9 9.9 3.0 0.9 0.3 0.0
Add depreciation and amortization 1,109.0 1,304.2 1,382.2 1,416.6 1,437.1 1,453.5 1,468.6 1,483.4 1,498.3 1,513.3
Less Capex (1,935.4) (2,282.5) (2,475.8) (2,648.5) (2,801.6) (2,936.7) (3,055.9) (3,161.3) (3,254.8) (3,287.3)
FCF 4,380.0 4,979.8 4,348.1 4,190.1 4,150.1 4,135.0 4,124.3 4,115.7 4,110.9 4,151.7
YoY% 69.9% 13.7% -12.7% -3.6% -1.0% -0.4% -0.3% -0.2% -0.1% 1.0%
Terminal value 54,237.2
FCF + TV 4,380.0 4,979.8 4,348.1 4,190.1 4,150.1 4,135.0 4,124.3 4,115.7 4,110.9 58,388.8
Discount factor 1.09 1.18 1.29 1.40 1.52 1.65 1.80 1.95 2.12 2.31
NPV 4,028.3 4,212.2 3,382.5 2,997.8 2,730.8 2,502.4 2,295.4 2,106.8 1,935.3 25,280.5
Enterprise Value (sum of NPVs) 51,471.8
Add net cash (end FY16E) 7,192.9
Add associates (end FY16E) 0.0
Add other investments (end FY16E) 0.0
Less minorities (135.8)
Equity Value 58,528.9
Issued shares (m) 2,213.9
Equity Value (RMB/share) 26.4
Cost of Capital Assumptions
Ke 9.5%
Risk free 3.9%
Market Risk Premium 5.6%
Beta 1.0
Kd 5.0%
Kd (after tax) 4.4%
Target Debt / (Debt + Equity) 15.0%
Target Equity / (Debt + Equity) 85.0%
WACC 8.7% Source: Deutsche Bank estimates
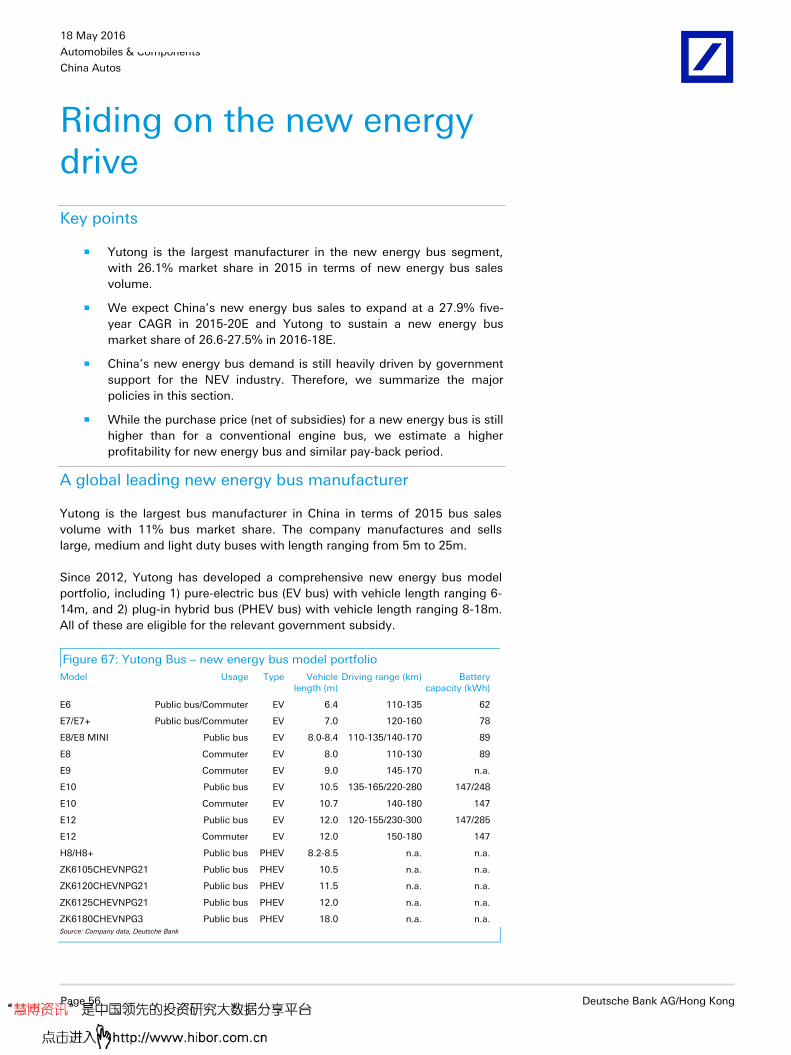
18 May 2016
Automobiles & Components
China Autos
Page 56 Deutsche Bank AG/Hong Kong
Riding on the new energy drive
Key points
Yutong is the largest manufacturer in the new energy bus segment,
with 26.1% market share in 2015 in terms of new energy bus sales
volume.
We expect China’s new energy bus sales to expand at a 27.9% five-
year CAGR in 2015-20E and Yutong to sustain a new energy bus
market share of 26.6-27.5% in 2016-18E.
China’s new energy bus demand is still heavily driven by government
support for the NEV industry. Therefore, we summarize the major
policies in this section.
While the purchase price (net of subsidies) for a new energy bus is still
higher than for a conventional engine bus, we estimate a higher
profitability for new energy bus and similar pay-back period.
A global leading new energy bus manufacturer
Yutong is the largest bus manufacturer in China in terms of 2015 bus sales
volume with 11% bus market share. The company manufactures and sells
large, medium and light duty buses with length ranging from 5m to 25m.
Since 2012, Yutong has developed a comprehensive new energy bus model
portfolio, including 1) pure-electric bus (EV bus) with vehicle length ranging 6-
14m, and 2) plug-in hybrid bus (PHEV bus) with vehicle length ranging 8-18m.
All of these are eligible for the relevant government subsidy.
Figure 67: Yutong Bus – new energy bus model portfolio
Model Usage Type Vehicle length (m)
Driving range (km) Battery capacity (kWh)
E6 Public bus/Commuter EV 6.4 110-135 62
E7/E7+ Public bus/Commuter EV 7.0 120-160 78
E8/E8 MINI Public bus EV 8.0-8.4 110-135/140-170 89
E8 Commuter EV 8.0 110-130 89
E9 Commuter EV 9.0 145-170 n.a.
E10 Public bus EV 10.5 135-165/220-280 147/248
E10 Commuter EV 10.7 140-180 147
E12 Public bus EV 12.0 120-155/230-300 147/285
E12 Commuter EV 12.0 150-180 147
H8/H8+ Public bus PHEV 8.2-8.5 n.a. n.a.
ZK6105CHEVNPG21 Public bus PHEV 10.5 n.a. n.a.
ZK6120CHEVNPG21 Public bus PHEV 11.5 n.a. n.a.
ZK6125CHEVNPG21 Public bus PHEV 12.0 n.a. n.a.
ZK6180CHEVNPG3 Public bus PHEV 18.0 n.a. n.a. Source: Company data, Deutsche Bank
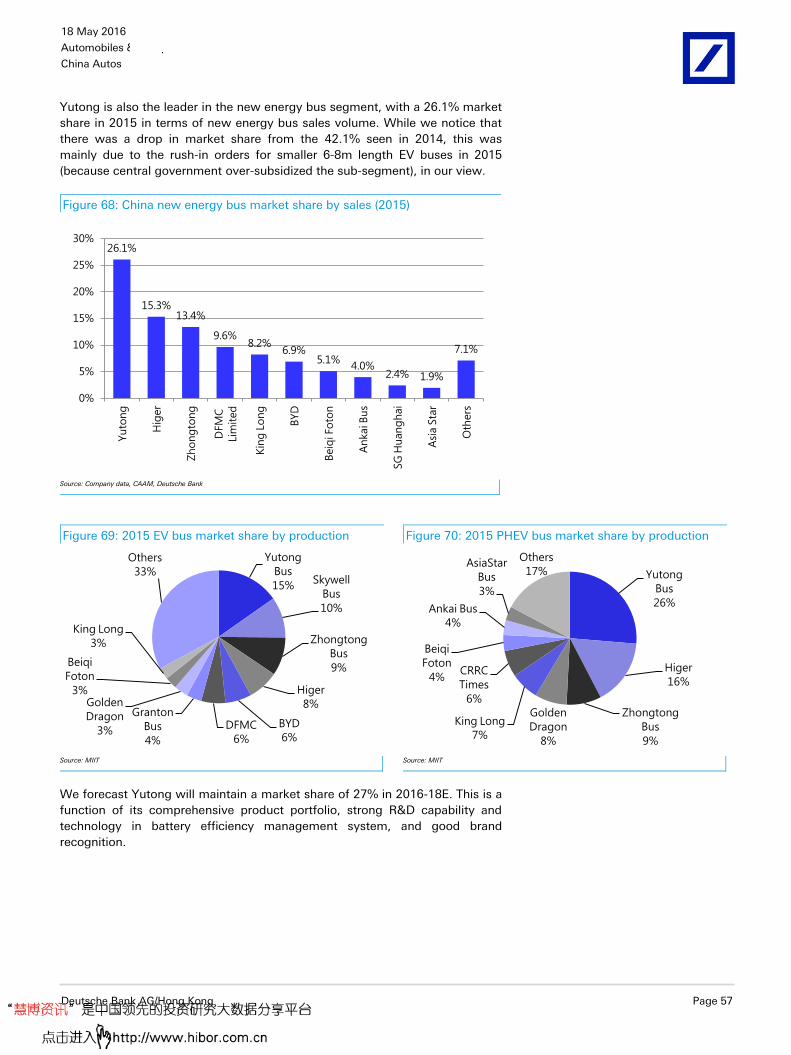
18 May 2016
Automobiles & Components
China Autos
Deutsche Bank AG/Hong Kong Page 57
Yutong is also the leader in the new energy bus segment, with a 26.1% market
share in 2015 in terms of new energy bus sales volume. While we notice that
there was a drop in market share from the 42.1% seen in 2014, this was
mainly due to the rush-in orders for smaller 6-8m length EV buses in 2015
(because central government over-subsidized the sub-segment), in our view.
Figure 68: China new energy bus market share by sales (2015)
26.1%
15.3%13.4%
9.6%8.2%
6.9%5.1%
4.0%2.4% 1.9%
7.1%
0%
5%
10%
15%
20%
25%
30%
Yu
ton
g
Hig
er
Zh
on
gto
ng
DF
MC
Lim
ite
d
Kin
g L
on
g
BY
D
Be
iqi
Fo
ton
An
ka
i Bu
s
SG
Hu
an
gh
ai
Asi
a S
tar
Oth
ers
Source: Company data, CAAM, Deutsche Bank
Figure 69: 2015 EV bus market share by production Figure 70: 2015 PHEV bus market share by production
Yutong
Bus
15%Skywell
Bus
10%
Zhongtong
Bus
9%
Higer
8%
BYD
6%DFMC
6%
Granton
Bus
4%
Golden
Dragon
3%
Beiqi
Foton
3%
King Long
3%
Others
33%
Yutong
Bus
26%
Higer
16%
Zhongtong
Bus
9%
Golden
Dragon
8%
King Long
7%
CRRC
Times
6%
Beiqi
Foton
4%
Ankai Bus
4%
AsiaStar
Bus
3%
Others
17%
Source: MIIT
Source: MIIT
We forecast Yutong will maintain a market share of 27% in 2016-18E. This is a
function of its comprehensive product portfolio, strong R&D capability and
technology in battery efficiency management system, and good brand
recognition.

18 May 2016
Automobiles & Components
China Autos
Page 58 Deutsche Bank AG/Hong Kong
Figure 71: Yutong’s market share in new energy bus segment
42.1%
26.1% 26.6% 26.9% 27.5%
20%
25%
30%
35%
40%
45%
0
10,000
20,000
30,000
40,000
50,000
60,000
2014 2015 2016E 2017E 2018E
Yutong new energy bus sales (units)
Yutong market share (%, RHS)
(units)
Source: Company data, CAAM, Deutsche Bank estimates
Subsidies the biggest driver of new energy bus sales
We emphasize that China’s new energy bus demand is still heavily driven by
government support for the NEV industry and we summarize the major policy
announcements in the past few years related to NEVs in below figure.
Figure 72: Summary of China’s major new energy vehicle supportive policies
Date Policy and summary of major implications
May 2010 Notice of The Pilot Implementation of Private Purchase of New Energy Vehicles Subsidies
Officially initiated China’s NEV subsidy program
Started small-scale pilot testing in six cities in China
June 2012 The 2012-2020 Development Plan for Fuel-efficient and New Energy Vehicle Industry
Roadmap for China’s NEV industry development
Targeted an cumulative NEV (EV and PHEV) sales volume of 500k units by 2015 and 5m units by 2020
Annual NEV production capacity to reach 2m units by 2020
September 2013 Notice to Continue to Promote The Usage of New Energy Vehicles
NEV purchase subsidy standard for 2013-15
Set up required NEV ownership targets in pilot cities
Priority given to NEVs in government procurement and public bus transit
July 2014 Notice to Waive the Purchase Tax for New Energy Vehicles
Waiver of purchase tax for electric vehicle, plug-in electric vehicle and fuel-cell vehicle
Both domestically produced and imported NEVs eligible for tax waiver
April 2015 Notice to Promote The Usage of New Energy Vehicles for 2016-20
NEV purchase subsidy standard announced for 2016-20 Source: State Council, Ministry of Finance, Ministry of Science and Technology, Ministry of Industry and Information Technology, National Development and Reform Commission, Deutsche Bank
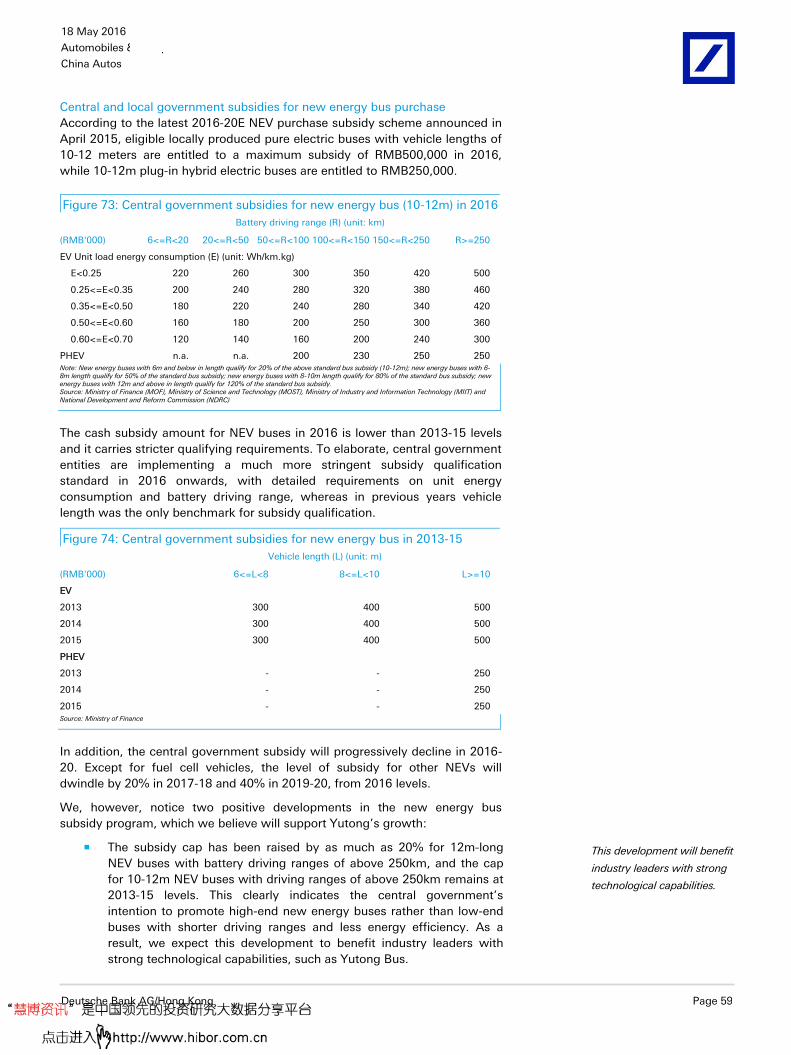
18 May 2016
Automobiles & Components
China Autos
Deutsche Bank AG/Hong Kong Page 59
Central and local government subsidies for new energy bus purchase
According to the latest 2016-20E NEV purchase subsidy scheme announced in
April 2015, eligible locally produced pure electric buses with vehicle lengths of
10-12 meters are entitled to a maximum subsidy of RMB500,000 in 2016,
while 10-12m plug-in hybrid electric buses are entitled to RMB250,000.
Figure 73: Central government subsidies for new energy bus (10-12m) in 2016
Battery driving range (R) (unit: km)
(RMB'000) 6<=R<20 20<=R<50 50<=R<100 100<=R<150 150<=R<250 R>=250
EV Unit load energy consumption (E) (unit: Wh/km.kg)
E<0.25 220 260 300 350 420 500
0.25<=E<0.35 200 240 280 320 380 460
0.35<=E<0.50 180 220 240 280 340 420
0.50<=E<0.60 160 180 200 250 300 360
0.60<=E<0.70 120 140 160 200 240 300
PHEV n.a. n.a. 200 230 250 250 Note: New energy buses with 6m and below in length qualify for 20% of the above standard bus subsidy (10-12m); new energy buses with 6-8m length qualify for 50% of the standard bus subsidy; new energy buses with 8-10m length qualify for 80% of the standard bus subsidy; new energy buses with 12m and above in length qualify for 120% of the standard bus subsidy. Source: Ministry of Finance (MOF), Ministry of Science and Technology (MOST), Ministry of Industry and Information Technology (MIIT) and National Development and Reform Commission (NDRC)
The cash subsidy amount for NEV buses in 2016 is lower than 2013-15 levels
and it carries stricter qualifying requirements. To elaborate, central government
entities are implementing a much more stringent subsidy qualification
standard in 2016 onwards, with detailed requirements on unit energy
consumption and battery driving range, whereas in previous years vehicle
length was the only benchmark for subsidy qualification.
Figure 74: Central government subsidies for new energy bus in 2013-15
Vehicle length (L) (unit: m)
(RMB'000) 6<=L<8 8<=L<10 L>=10
EV
2013 300 400 500
2014 300 400 500
2015 300 400 500
PHEV
2013 - - 250
2014 - - 250
2015 - - 250 Source: Ministry of Finance
In addition, the central government subsidy will progressively decline in 2016-
20. Except for fuel cell vehicles, the level of subsidy for other NEVs will
dwindle by 20% in 2017-18 and 40% in 2019-20, from 2016 levels.
We, however, notice two positive developments in the new energy bus
subsidy program, which we believe will support Yutong’s growth:
The subsidy cap has been raised by as much as 20% for 12m-long
NEV buses with battery driving ranges of above 250km, and the cap
for 10-12m NEV buses with driving ranges of above 250km remains at
2013-15 levels. This clearly indicates the central government’s
intention to promote high-end new energy buses rather than low-end
buses with shorter driving ranges and less energy efficiency. As a
result, we expect this development to benefit industry leaders with
strong technological capabilities, such as Yutong Bus.
This development will benefit
industry leaders with strong
technological capabilities.
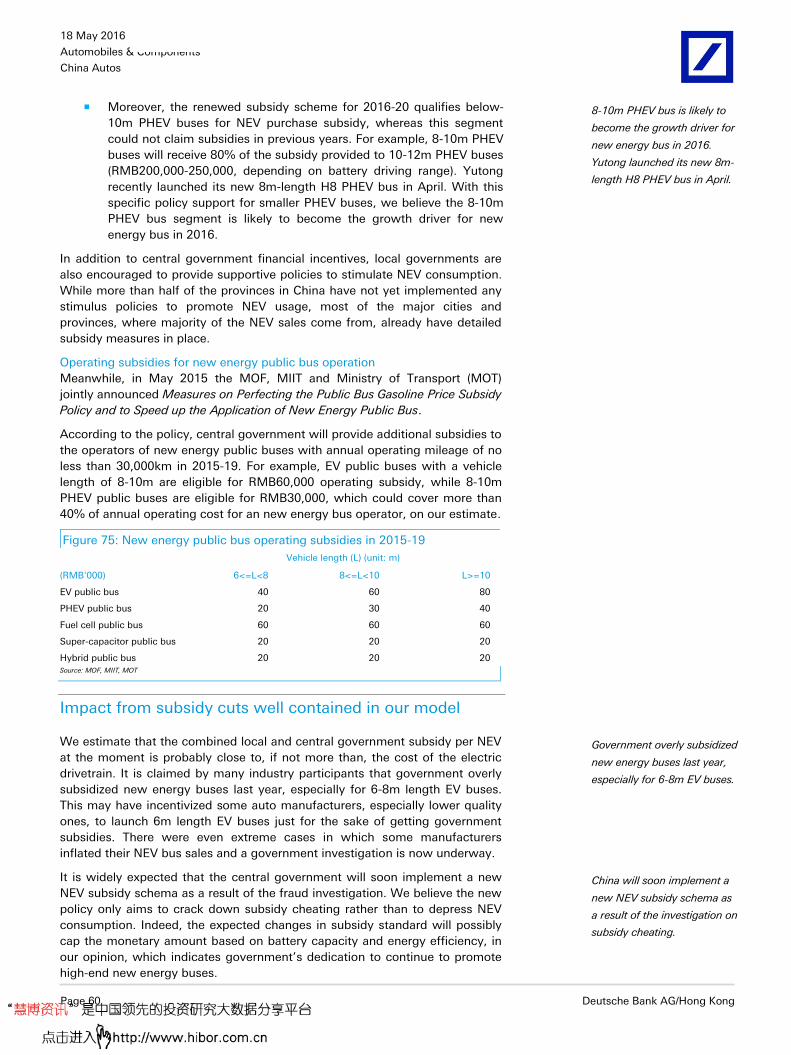
18 May 2016
Automobiles & Components
China Autos
Page 60 Deutsche Bank AG/Hong Kong
Moreover, the renewed subsidy scheme for 2016-20 qualifies below-
10m PHEV buses for NEV purchase subsidy, whereas this segment
could not claim subsidies in previous years. For example, 8-10m PHEV
buses will receive 80% of the subsidy provided to 10-12m PHEV buses
(RMB200,000-250,000, depending on battery driving range). Yutong
recently launched its new 8m-length H8 PHEV bus in April. With this
specific policy support for smaller PHEV buses, we believe the 8-10m
PHEV bus segment is likely to become the growth driver for new
energy bus in 2016.
In addition to central government financial incentives, local governments are
also encouraged to provide supportive policies to stimulate NEV consumption.
While more than half of the provinces in China have not yet implemented any
stimulus policies to promote NEV usage, most of the major cities and
provinces, where majority of the NEV sales come from, already have detailed
subsidy measures in place.
Operating subsidies for new energy public bus operation
Meanwhile, in May 2015 the MOF, MIIT and Ministry of Transport (MOT)
jointly announced Measures on Perfecting the Public Bus Gasoline Price Subsidy
Policy and to Speed up the Application of New Energy Public Bus.
According to the policy, central government will provide additional subsidies to
the operators of new energy public buses with annual operating mileage of no
less than 30,000km in 2015-19. For example, EV public buses with a vehicle
length of 8-10m are eligible for RMB60,000 operating subsidy, while 8-10m
PHEV public buses are eligible for RMB30,000, which could cover more than
40% of annual operating cost for an new energy bus operator, on our estimate.
Figure 75: New energy public bus operating subsidies in 2015-19
Vehicle length (L) (unit: m)
(RMB'000) 6<=L<8 8<=L<10 L>=10
EV public bus 40 60 80
PHEV public bus 20 30 40
Fuel cell public bus 60 60 60
Super-capacitor public bus 20 20 20
Hybrid public bus 20 20 20
Source: MOF, MIIT, MOT
Impact from subsidy cuts well contained in our model
We estimate that the combined local and central government subsidy per NEV
at the moment is probably close to, if not more than, the cost of the electric
drivetrain. It is claimed by many industry participants that government overly
subsidized new energy buses last year, especially for 6-8m length EV buses.
This may have incentivized some auto manufacturers, especially lower quality
ones, to launch 6m length EV buses just for the sake of getting government
subsidies. There were even extreme cases in which some manufacturers
inflated their NEV bus sales and a government investigation is now underway.
It is widely expected that the central government will soon implement a new
NEV subsidy schema as a result of the fraud investigation. We believe the new
policy only aims to crack down subsidy cheating rather than to depress NEV
consumption. Indeed, the expected changes in subsidy standard will possibly
cap the monetary amount based on battery capacity and energy efficiency, in
our opinion, which indicates government’s dedication to continue to promote
high-end new energy buses.
8-10m PHEV bus is likely to
become the growth driver for
new energy bus in 2016.
Yutong launched its new 8m-
length H8 PHEV bus in April.
Government overly subsidized
new energy buses last year,
especially for 6-8m EV buses.
China will soon implement a
new NEV subsidy schema as
a result of the investigation on
subsidy cheating.

18 May 2016
Automobiles & Components
China Autos
Deutsche Bank AG/Hong Kong Page 61
According to some press reports, the new subsidies for 6-8m new energy
buses are likely to see a significant decline of c.40-50% compared with
previous version and c.25% drop for 8-10m buses, whereas subsidies for 10m
and above buses will remain the same.
Figure 76: Expected changes in new NEV subsidy policy
Figure 77: Yutong – new energy bus sales breakdown
(FY15)
Max. subsidy amount (RMB'000)
Original Expected % chg
>12m EV bus 600 600 0%
10-12m EV bus 500 500 0%
8-10m EV bus 400 300 -25%
6-8m EV bus 250 150 -40%
>12m PHEV bus 300 300 0%
10-12m PHEV bus 250 250 0%
8-10m PHEV bus 200 150 -25%
6-8m PHEV bus 125 75 -40%
~32-34%
~19%
~15-16%
~32-34%
0%
5%
10%
15%
20%
25%
30%
35%
6-8m EV 8-10m EV >10m EV >10m PHEV
Source: Deutsche Bank estimates
Source: Company data, Deutsche Bank estimates
While it is difficult to quantify the precise impact on Yutong’s new energy bus
sales and average selling price (ASP), our FY16-18 estimates have factored in
10.9-11.9% YoY drop in ASP and 12.8-14.0% YoY decline in gross profit per
vehicle for new energy bus segment, respectively. We believe the drop in ASP
and unit gross profit will be less than the decline in subsidy as 1) only c.50% of
Yutong’s new energy bus sales last year was from 6-10m vehicles; 2) Yutong
will be able to partially pass through the reduced subsidy to customers; and 3)
it will offset the impact by selling more PHEV buses with the launch of new H8
bus, which are selling at higher prices vs. EV buses in comparable length.
On the cost analysis, we forecast 10.0% YoY decline in per vehicle battery cost
annually in FY16-18. This is in line with 1) our global auto team’s projection of
6.5% per annum drop in pack level cost in FY14-20E, and 2) increasing
contribution from PHEV buses, which use fewer batteries (in kWh terms) than
EV buses. We also factor in 10.5-13.4% YoY drop in unit COGS (excluding
battery) in FY16-18, given 1) economies of scale on 35% volume CAGR and 2)
low raw material costs.

18 May 2016
Automobiles & Components
China Autos
Page 62 Deutsche Bank AG/Hong Kong
Figure 78: Deutsche Bank forecast on Yutong’s new energy bus segment
2015 2016E 2017E 2018E
Sales volume (units) 20,445 27,814 37,838 50,758
YoY 36.0% 36.0% 34.1%
ASP (RMB'000) 683.6 608.9 536.6 475.5
YoY -10.9% -11.9% -11.4%
COGS per vehicle (RMB'000) -491.1 -441.2 -392.4 -350.5
YoY -10.2% -11.1% -10.7%
- Battery cost per vehicle (RMB'000) -335.4 -301.8 -271.6 -244.5
YoY -10.0% -10.0% -10.0%
- Other COGS per unit (RMB'000) -155.8 -139.4 -120.7 -106.0
YoY -10.5% -13.4% -12.2%
Gross profit per vehicle (RMB'000) 192.4 167.7 144.3 125.0
YoY -12.8% -14.0% -13.3%
Gross profit margin (%) 28.2% 27.5% 26.9% 26.3%
Source: Company data, Deutsche Bank estimates
New energy bus has a better operating cost profile
After taking into consideration the various government subsidies, operation of
new energy buses is very cost efficient when compared with the operation of
conventional gasoline buses, putting new energy bus in a competitive situation
vs. conventional internal combustion engine (ICE) bus.
While the purchase price (net of subsidies) for new energy bus is still higher
than for ICE bus, we estimate higher profitability for new energy bus, due to
lower operating costs, and a similar pay-back period to ICE bus.
Take Yutong’s 7m-length E7 EV bus as an example. Although the purchase
price for E7 is at a 1.8x premium to a comparable locally made Toyota Coaster
20-seater, the premium falls to 24% after deducting central and local
government subsidies for a 6-8m EV bus with driving range of 100-150km.
What is more, we forecast lower operating expenses for E7 with 75% lower
electricity cost vs. gasoline consumption for Coaster. As a result, we estimate
annual net profit for an E7 operator is 22% above that for a Toyota Coaster
operator and the pay-back period for the two is very close at around 3.7-3.8
years.

18 May 2016
Automobiles & Components
China Autos
Deutsche Bank AG/Hong Kong Page 63
Figure 79: Price comparison of Yutong E7 bus and a
comparable ICE bus
Figure 80: Profit and return period comparison for
Yutong E7 bus and a comparable ICE bus
(RMB) Yutong E7 EV bus Toyota Coaster 4.0L
Purchase price* 950,000 333,600
Central government subsidy 175,000 0
Local government subsidy** 175,000 0
License plate cost 0 120,000
Purchase tax 0 28,513
Net purchase price 600,000 482,113
(RMB) Yutong E7 EV bus Toyota Coaster 4.0L
Revenue* (rental income) 264,000 264,000
Operating cost 53,504 92,016
Wage and salary 36,000 36,000
Electricity/gasoline cost 9,504 38,016
Electricity/gasoline cost per km (RMB)** 0.30 1.20
Daily operating mileage (km) 120 120
Insurance fees 8,000 8,000
Maintenance *** 0 10,000
Profit 210,496 171,984
Income tax 52,624 42,996
Net profit 157,872 128,988
Net purchase price 600,000 482,113
Return period (year) 3.8 3.7
* Purchase price for Toyota Coaster 4.0L is derived from average MSRP and applying a 30% discount. ** Assuming local government subsidy amount to match central government subsidy. Source: Company data, Deutsche Bank estimates
* Assuming daily rents of RMB1,000, 22 working days per month. ** Electricity cost for Yutong E7 per company data; Gasoline cost per km for Toyota Coaster derived by assuming 21.7L/100km fuel consumption and RMB5.53/L price for #93 gasoline. *** Yutong provides 5-year warranty for its EV bus battery. Source: Company data, Deutsche Bank estimates
Soaring sales amid government policy support
2015 new energy bus sales up three-fold YoY
According to the China Association of Automobile Manufacturers (CAAM),
sales of total NEVs, including EV and PHEV, reached 331,092 units in 2015 (up
3.2x YoY), representing a 2011-15 four-year sales volume CAGR of 152.4%.
New energy bus sales also recorded a historical high of 78,409 units in 2015,
up 3.5x YoY, accounting for 90% of total new energy commercial vehicle sales
and 24% of total NEV sales.
Figure 81: China annual new energy bus sales volume and growth trend
17,321
78,409
104,400
140,400
184,800
224,400
268,800
353%
33% 34% 32% 21% 20%0%
50%
100%
150%
200%
250%
300%
350%
400%
0
50,000
100,000
150,000
200,000
250,000
300,000
2014 2015 2016E 2017E 2018E 2019E 2020E
New energy bus sales volume (units) YoY (%, RHS)(units)
Source: CAAM, Deutsche Bank estimates
Year-to-date slowdown probably due to policy overhang
Going into 2016, there has been a marked slowdown in NEV sales with 1Q16
commercial NEV and new energy bus sales up by 1.5x and 31.0% YoY
respectively, but down by 71.8% and 83.0% QoQ, respectively. We think that
the slowdown in commercial NEV sales momentum YTD is attributable to the
overhang related to the ongoing investigation of NEV bus subsidy cheating.

18 May 2016
Automobiles & Components
China Autos
Page 64 Deutsche Bank AG/Hong Kong
Figure 82: Commercial NEV sales Figure 83: New energy bus sales
-250%
0%
250%
500%
750%
1000%
1250%
0
5,000
10,000
15,000
20,000
25,000
30,000
Jan
-14
Ap
r-1
4
Jul-
14
Oct
-14
Jan
-15
Ap
r-1
5
Jul-
15
Oct
-15
Jan
-16
EV PHEV Total NEV YoY(units) (YoY)
-250%
0%
250%
500%
750%
1000%
1250%
0
5,000
10,000
15,000
20,000
25,000
Jan
-14
Ap
r-1
4
Jul-
14
Oct
-14
Jan
-15
Ap
r-1
5
Jul-
15
Oct
-15
Jan
-16
EV bus PHEV bus
Total NEV bus YoY(units) (YoY)
Source: CAAM, Deutsche Bank
Source: CAAM, Deutsche Bank
DB expects new energy bus sales to expand at 28% CAGR
Given the ongoing government policy support, we estimate new energy bus
sales will expand at a 27.9% five-year CAGR in 2015-20. This will be front-end
loaded with a faster sales growth rate of 33.1%/34.5%/31.6% in 2016/17/18
before slowing to 19.8-21.4% in 2019-20.
In addition, due to the inclusion of subsidy for PHEV buses below-10m, we
expect faster growth for PHEV buses than EV buses in 2016-20.
Figure 84: China new energy bus sales forecast and breakdown
(units) 2015 2016E 2017E 2018E 2019E 2020E
EV bus 60,132 78,300 102,492 131,208 154,836 180,096
YoY% 30.2% 30.9% 28.0% 18.0% 16.3%
PHEV bus 18,277 26,100 37,908 53,592 69,564 88,704
YoY% 42.8% 45.2% 41.4% 29.8% 27.5%
Total new energy bus 78,409 104,400 140,400 184,800 224,400 268,800
YoY% 33.1% 34.5% 31.6% 21.4% 19.8% Source: CAAM, Deutsche Bank estimates
Based on our bus sales forecast model, we expect China’s new energy bus
sales to contribute 17.2-40.0% to total bus sales in 2016-20. By the end of
2020, we estimate the new energy bus fleet will account for 32.6% of the total
bus fleet in China.
We believe above 30% new energy bus penetration by 2020 is realistic as
China aims to electrify a large portion of its public bus fleet (as high as 80% in
eastern provinces) and government vehicles procurement.

18 May 2016
Automobiles & Components
China Autos
Deutsche Bank AG/Hong Kong Page 65
Figure 85: China bus sales forecast model
(units) 2011 2012 2013 2014 2015 2016E 2017E 2018E 2019E 2020E
Fleet size
Total bus 2,739,508 2,599,051 2,484,445 2,516,663 2,576,201 2,642,861 2,717,741 2,801,092 2,893,098 2,993,895
New energy bus 12,285 15,482 19,540 36,861 115,270 218,528 356,643 538,135 752,100 975,778
New energy bus penetration 0.4% 0.6% 0.8% 1.5% 4.5% 8.3% 13.1% 19.2% 26.0% 32.6%
ICE bus 2,727,223 2,583,569 2,464,905 2,479,802 2,460,931 2,424,334 2,361,098 2,262,957 2,140,998 2,018,117
ICE bus penetration 99.6% 99.4% 99.2% 98.5% 95.5% 91.7% 86.9% 80.8% 74.0% 67.4%
Sales
Total bus 487,862 507,373 560,059 606,918 595,382 606,000 624,000 641,160 657,189 671,976
New energy bus 2,285 3,198 4,058 17,321 78,409 104,400 140,400 184,800 224,400 268,800
New energy bus contribution 0.5% 0.6% 0.7% 2.9% 13.2% 17.2% 22.5% 28.8% 34.1% 40.0%
ICE bus 485,577 504,175 556,001 589,597 516,973 501,600 483,600 456,360 432,789 403,176
ICE bus contribution 99.5% 99.4% 99.3% 97.1% 86.8% 82.8% 77.5% 71.2% 65.9% 60.0%
Replacement
Total bus 373,516 647,830 674,665 574,700 535,844 539,340 549,120 557,809 565,183 571,179
New energy bus 0 0 0 0 0 1,142 2,284 3,308 10,435 45,122
New energy bus contribution 0.0% 0.0% 0.0% 0.0% 0.0% 0.2% 0.4% 0.6% 1.8% 7.9%
ICE upgrade to new energy 2,285 3,198 4,058 17,321 78,409 103,258 138,116 181,492 213,965 223,678
ICE bus upgrade contribution 0.6% 0.5% 0.6% 3.0% 14.6% 19.1% 25.2% 32.5% 37.9% 39.2%
ICE bus 371,231 644,632 670,607 557,379 457,435 434,940 408,720 373,009 340,783 302,379
ICE bus contribution 99.4% 99.5% 99.4% 97.0% 85.4% 80.6% 74.4% 66.9% 60.3% 52.9%
Source: CEIC, CAAM, Deutsche Bank estimates
Public bus replacement bodes well for new energy bus sales
Demand is skewed towards the public sector transport operators and we
estimate this segment recorded c.55k units in 2015, accounting for c.70% of
China’s total new energy bus sales and c.63% of total new energy CV sales.
There are strong policy indications that this demand will maintained.
In February 2015, the State Council unveiled a supportive policy to
increase government procurement of NEVs in the public bus, taxi,
environmental sanitation, and logistics sectors. The policy requires
that 50% of government vehicles procured be NEVs.
In November 2015, the Ministry of Transport (MOT), MOF and MIIT
jointly announced The Assessment Measures for the Application and
Promotion of New Energy Public bus, which specified a required new
energy bus percentage for local government public bus purchases. To
elaborate, 15-50% of local governments’ public bus procurement in
2016 has to be new energy bus and the number increases
progressively to 30-80% in 2019.
In our projections, we have assumed a new energy public bus adoption rate of
c.36% of the public transport market by 2020E vs. c.13% in 2015E.
Figure 86: Required percentage of new energy public bus for public bus replacement and new additions
2015 2016 2017 2018 2019
Beijing, Shanghai, Tianjin, Hebei, Shanxi, Jiangsu, Zhejiang, Shandong, Guangdong, Hainan 40% 50% 60% 70% 80%
Anhui, Jiangxi, Henan, Hubei, Hunan, Fujian 25% 35% 45% 55% 65%
Others 10% 15% 20% 25% 30%
Source: MOT, MOF, MIIT

18 May 2016
Automobiles & Components
China Autos
Page 66 Deutsche Bank AG/Hong Kong
Financials
Key points
We estimate Yutong Bus will deliver a 10.3% FY15-18E three-year net
revenue CAGR, supported by a 35.4% new energy bus sales CAGR.
We expect the volume contribution from new energy bus to increase
to 50% by FY18E from 31% in FY15.
With new energy bus remaining the growth driver for Yutong, we
forecast an 11.1% FY15-18E three-year earnings CAGR.
Stable revenue and earnings growth outlook
We estimate Yutong Bus will deliver a 10.3% FY15-18E three-year net revenue
CAGR. We also foresee product mix improvement with slower conventional
ICE bus sales growth. With new energy bus remaining the growth driver for
Yutong, we forecast an 11.1% FY15-18E three-year earnings CAGR.
Figure 87: Yutong Bus – revenue and growth trend Figure 88: Yutong Bus – net profit and growth trend
17%
12%
16%
21%
10% 10% 10%
0%
5%
10%
15%
20%
25%
0
10,000
20,000
30,000
40,000
50,000
20
12
20
13
20
14
20
15
20
16
E
20
17
E
20
18
E
Net revenue (RMBm) YoY (%, RHS)(RMBm) (%)
31%
46%
15%
35%
9%
13%
11%
0%
10%
20%
30%
40%
50%
0
1,000
2,000
3,000
4,000
5,000
6,000
20
12
20
13
20
14
20
15
20
16
E
20
17
E
20
18
E
Net profit (RMBm) YoY (%, RHS)(RMBm) (%)
Source: Company data, Deutsche Bank estimates
Source: Company data, Deutsche Bank estimates
Stable profitability on increasing new energy contribution
We project a 14.6% bus sales volume CAGR over FY15-18 for Yutong, driven
mainly by a 35.4% CAGR in new energy bus sales during the same period, on
our estimates. Meanwhile, we only forecast a mild 2.5% CAGR for
conventional ICE bus sales in FY15-18. We expect the volume contribution
from new energy bus to increase to 50% by FY18E from 31% in FY15.
Figure 89: Yutong Bus – sales volume breakdown
(units) 2012 2013 2014 2015 2016E 2017E 2018E
New energy bus 1,791 3,897 7,291 20,445 27,814 37,838 50,758
YoY (%) 117.6% 87.1% 180.4% 36.0% 36.0% 34.1%
Conventional ICE bus 49,897 52,171 54,107 46,573 47,970 49,169 50,153
YoY (%) 4.6% 3.7% -13.9% 3.0% 2.5% 2.0%
Total bus sales 51,688 56,068 61,398 67,018 75,784 87,007 100,911
YoY (%) 8.5% 9.5% 9.2% 13.1% 14.8% 16.0% Source: Company data, Deutsche Bank estimates

18 May 2016
Automobiles & Components
China Autos
Deutsche Bank AG/Hong Kong Page 67
Figure 90: Yutong Bus – new energy bus revenue Figure 91: Yutong Bus – bus sales breakdown
8%14%
21%
45%49%
54%
58%
0%
20%
40%
60%
80%
0
5,000
10,000
15,000
20,000
25,000
30,000
20
12
20
13
20
14
20
15
20
16
E
20
17
E
20
18
E
New energy bus revenue (RMBm)
New energy bus revenue contribution (%)(RMBm) (%)
97% 93% 88%69% 63% 57% 50%
3% 7% 12%31% 37% 43% 50%
0%
20%
40%
60%
80%
100%
20
12
20
13
20
14
20
15
20
16
E
20
17
E
20
18
E
Conventional engine bus New energy bus
Source: Company data, Deutsche Bank estimates
Source: Company data, Deutsche Bank estimates
In FY12-15, Yutong experienced an expansion in both its gross profit margin
and net profit margin. In our view, this is mainly attributable to the gradual
increase in sales contribution from new energy buses. Due to a decrease in
government subsidy to NEVs in 2016-20E, partly offset by low raw material
prices, we forecast a mild declining trend in gross profit margin to 24.3-24.8%
levels in FY16-18E, from 25.0% in FY15. On the other hand, we estimate a
stable net profit margin of 11.2-11.6% in FY16-18E.
Figure 92: Yutong Bus – profit margin trend Figure 93: Yutong Bus – gross profit breakdown
19.5%22.6% 23.8% 25.0% 24.8% 24.5% 24.3%
7.9%10.3% 10.2% 11.4% 11.2% 11.6%11.6%
5%
10%
15%
20%
25%
30%
20
12
20
13
20
14
20
15
20
16
E
20
17
E
20
18
E
Gross profit margin Operating margin
Net profit margin
44% 40% 37% 33%
50% 54% 58% 62%
6% 6% 5% 5%
0%
20%
40%
60%
80%
100%
20
15
20
16
E
20
17
E
20
18
E
Conventional engine bus New energy bus Others
Source: Company data, Deutsche Bank estimates
Source: Company data, Deutsche Bank estimates
Balance sheet remains solid with sustainable net cash
Since FY08, Yutong Bus has been recording strong operating cash inflows
each year. Together with rational capex spending and solid revenue growth,
Yutong has been in a strong net cash position since FY08. Going forward, we
expect Yutong to sustain its net cash position on continued solid growth in the
new energy bus segment.

18 May 2016
Automobiles & Components
China Autos
Page 68 Deutsche Bank AG/Hong Kong
Figure 94: Yutong Bus – net cash and shareholders’
equity
Figure 95: Yutong Bus – operating and investing cash
flow
0
5,000
10,000
15,000
20,000
20
12
20
13
20
14
20
15
20
16
E
20
17
E
20
18
E
Net cash/(debt) Shareholders' equity(RMBm)
-5,000
-2,500
0
2,500
5,000
7,500
20
12
20
13
20
14
20
15
20
16
E
20
17
E
20
18
E
Operating cash inflowCapexOther investing cash inflow
(RMBm)
Source: Company data, Deutsche Bank estimates
Source: Company data, Deutsche Bank estimates
Efficient cash management to contain conversion cycle
Yutong Bus has been able to maintain a short and stable cash conversion cycle
since FY10 and we expect this healthy trend to continue, assuming
1) disciplined inventory planning with less than one month of inventory;
2) efficient cash collection to contain receivables days at about four months,
and 3) good relationships with suppliers, which can sustain payables days at
approximately 5-6 months. This should keep Yutong’s negative cash
conversion cycle at a level of about one month, on our estimates.
Figure 96: Yutong Bus – turnover days and cash conversion cycle
-200
-100
0
100
200
20
12
20
13
20
14
20
15
20
16
E
20
17
E
20
18
E
Inventory turnover Trade receivables turnover
Trade payables turnover Cash conversion cycle
(Days)
Source: Company data, Deutsche Bank estimates

18 May 2016
Automobiles & Components
China Autos
Deutsche Bank AG/Hong Kong Page 69
Figure 97: Zhengzhou Yutong Bus – consolidated income statement
Yearend December (RMBm) 2013 2014 2015 2016E 2017E 2018E
Net revenue 22,056.5 25,573.7 31,059.1 34,235.9 37,746.2 41,647.6
Cost of sales (17,076.4) (19,481.4) (23,305.9) (25,753.5) (28,491.5) (31,543.8)
Gross (loss)/profit 4,980.1 6,092.4 7,753.2 8,482.4 9,254.7 10,103.9
Gross profit margin (%) 22.6% 23.8% 25.0% 24.8% 24.5% 24.3%
Selling and distribution expenses (1,323.4) (1,518.1) (2,034.4) (2,139.7) (2,264.8) (2,394.7)
Administrative expenses (1,284.2) (1,452.4) (1,812.9) (1,951.4) (2,113.8) (2,290.6)
Operating profit (EBIT) 2,372.4 3,121.9 3,905.9 4,391.2 4,876.1 5,418.5
Operating profit margin (%) 10.8% 12.2% 12.6% 12.8% 12.9% 13.0%
Impairment gains/(losses) on assets (12.3) (356.5) (240.7) (200.0) (200.0) (200.0)
Gain/(losses) on change in fair value 8.2 14.5 (41.0) (100.0) 0.0 0.0
Investment income 36.0 97.9 61.7 64.8 68.1 71.5
Finance income/(costs), net 2.9 24.9 142.4 10.8 12.5 10.9
Non-operating income 220.9 167.9 331.9 348.5 366.0 384.3
Non-operating expense (9.5) (19.8) (55.9) (58.7) (61.6) (64.7)
Profit before income tax 2,618.5 3,050.8 4,104.3 4,456.6 5,061.1 5,620.4
Income tax credit/(expense) (327.6) (398.2) (516.7) (557.1) (632.6) (702.6)
Profit for the period/year 2,290.9 2,652.6 3,587.7 3,899.6 4,428.4 4,917.9
Minority interest (27.9) (40.0) (52.5) (57.0) (64.7) (71.9)
Profit attributable to equity holders 2,263.0 2,612.6 3,535.2 3,842.6 4,363.7 4,846.0
YoY% 46.0% 15.5% 35.3% 8.7% 13.6% 11.1% Source: Company data, Deutsche Bank estimates

18 May 2016
Automobiles & Components
China Autos
Page 70 Deutsche Bank AG/Hong Kong
Figure 98: Zhengzhou Yutong Bus – consolidated balance sheet
As at 31 December (RMBm) 2013 2014 2015 2016E 2017E 2018E
Current assets 13,352.3 17,223.5 22,983.1 24,756.5 26,885.7 28,976.8
Cash and cash equivalent 5,613.0 6,016.3 6,699.2 7,192.9 7,973.5 8,539.9
Bills and accounts receivables 5,071.8 9,309.9 11,363.4 12,388.9 13,591.0 14,844.8
Prepayments 228.7 260.2 427.6 449.0 471.4 495.0
Other receivables 109.7 171.6 260.0 273.0 286.7 301.0
Inventory 1,415.5 1,159.5 1,547.4 1,698.3 1,736.3 1,893.4
Other current assets 913.6 306.0 2,685.5 2,754.4 2,826.7 2,902.7
Non-current assets 5,263.2 6,600.0 7,156.0 7,935.5 8,846.9 9,914.5
Available-for-sale financial assets 142.4 149.0 378.7 397.6 417.5 438.3
Property, plant and equipment 3,281.0 3,630.3 4,071.8 4,511.4 5,027.0 5,632.5
Construction in progress 593.1 956.0 584.8 614.1 644.8 677.0
Intangible assets 703.2 939.4 1,463.5 1,722.4 2,033.1 2,405.9
Goodwill 0.5 0.5 0.5 0.5 0.5 0.5
Long term deferred expense 0.0 11.6 10.3 10.8 11.3 11.9
Deferred tax asset 319.1 407.3 561.2 589.3 618.7 649.7
Other non-current assets 224.0 505.8 85.2 89.4 93.9 98.6
Total assets 18,615.5 23,823.5 30,139.1 32,692.0 35,732.6 38,891.3
Current liabilities 8,533.7 12,358.8 16,317.0 18,247.0 18,734.1 19,108.2
Short term borrowings 160.4 0.0 0.0 0.0 0.0 0.0
Bills and accounts payables 6,099.1 9,104.7 12,191.1 13,915.2 14,186.0 14,333.0
Advance received from customers 851.9 1,211.4 1,933.6 2,030.3 2,131.8 2,238.4
Payroll payable 499.4 586.8 704.5 739.7 776.7 815.5
Tax payable 173.6 269.3 270.2 283.7 297.9 312.8
Other payables 698.1 1,163.6 1,211.2 1,271.8 1,335.3 1,402.1
Other current liabilities 51.2 22.9 6.4 6.4 6.4 6.4
Non-current liabilities 570.4 604.2 882.8 926.9 973.2 1,021.9
Long term borrowings 4.1 0.0 0.0 0.0 0.0 0.0
Accrued liabilities 298.4 314.6 496.1 520.9 546.9 574.3
Deferred income tax liabilities 0.8 3.1 0.0 0.0 0.0 0.0
Other non-current liabilities 267.1 286.4 386.7 406.0 426.3 447.6
Total liabilities 9,104.1 12,962.9 17,199.7 19,173.9 19,707.4 20,130.1
Net assets 9,511.4 10,860.6 12,939.4 13,518.0 16,025.2 18,761.2
Minority interests 33.4 56.1 78.8 135.8 200.5 272.3
Share capital and other reserves 4,939.6 4,753.9 5,048.5 5,048.5 5,048.5 5,048.5
Retained earnings 4,538.5 6,050.6 7,812.0 8,333.7 10,776.2 13,440.3
Total equity 9,511.4 10,860.6 12,939.4 13,518.0 16,025.2 18,761.2 Source: Company data, Deutsche Bank estimates
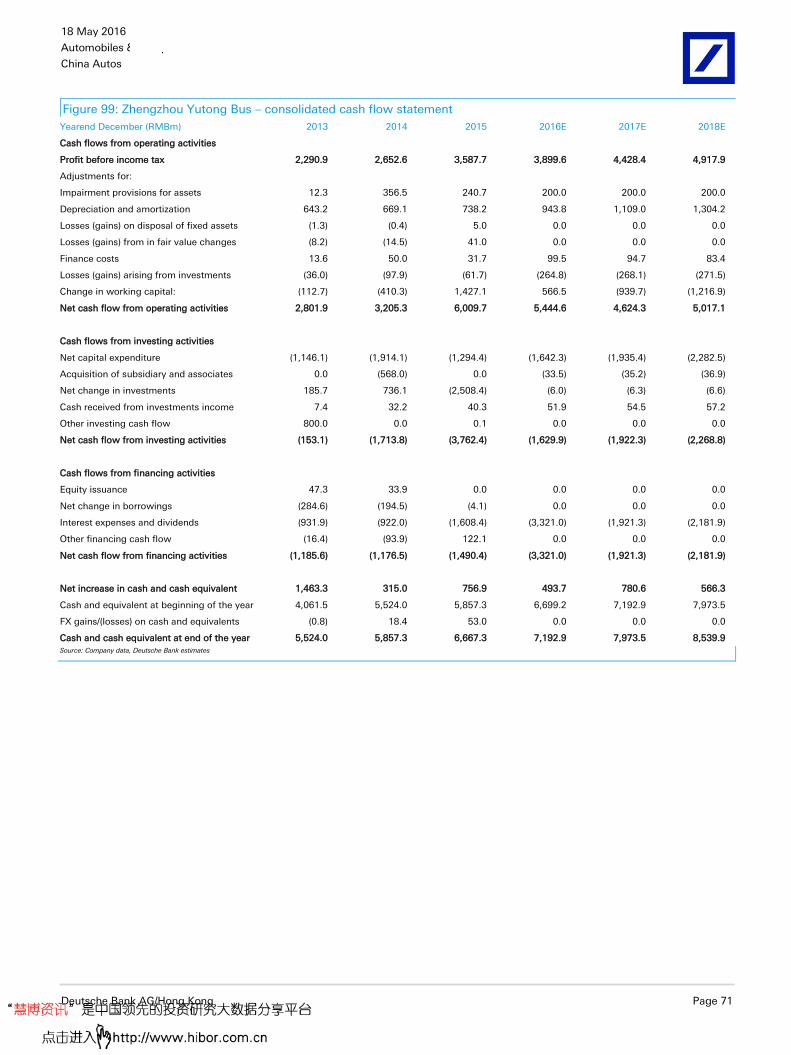
18 May 2016
Automobiles & Components
China Autos
Deutsche Bank AG/Hong Kong Page 71
Figure 99: Zhengzhou Yutong Bus – consolidated cash flow statement
Yearend December (RMBm) 2013 2014 2015 2016E 2017E 2018E
Cash flows from operating activities
Profit before income tax 2,290.9 2,652.6 3,587.7 3,899.6 4,428.4 4,917.9
Adjustments for:
Impairment provisions for assets 12.3 356.5 240.7 200.0 200.0 200.0
Depreciation and amortization 643.2 669.1 738.2 943.8 1,109.0 1,304.2
Losses (gains) on disposal of fixed assets (1.3) (0.4) 5.0 0.0 0.0 0.0
Losses (gains) from in fair value changes (8.2) (14.5) 41.0 0.0 0.0 0.0
Finance costs 13.6 50.0 31.7 99.5 94.7 83.4
Losses (gains) arising from investments (36.0) (97.9) (61.7) (264.8) (268.1) (271.5)
Change in working capital: (112.7) (410.3) 1,427.1 566.5 (939.7) (1,216.9)
Net cash flow from operating activities 2,801.9 3,205.3 6,009.7 5,444.6 4,624.3 5,017.1
Cash flows from investing activities
Net capital expenditure (1,146.1) (1,914.1) (1,294.4) (1,642.3) (1,935.4) (2,282.5)
Acquisition of subsidiary and associates 0.0 (568.0) 0.0 (33.5) (35.2) (36.9)
Net change in investments 185.7 736.1 (2,508.4) (6.0) (6.3) (6.6)
Cash received from investments income 7.4 32.2 40.3 51.9 54.5 57.2
Other investing cash flow 800.0 0.0 0.1 0.0 0.0 0.0
Net cash flow from investing activities (153.1) (1,713.8) (3,762.4) (1,629.9) (1,922.3) (2,268.8)
Cash flows from financing activities
Equity issuance 47.3 33.9 0.0 0.0 0.0 0.0
Net change in borrowings (284.6) (194.5) (4.1) 0.0 0.0 0.0
Interest expenses and dividends (931.9) (922.0) (1,608.4) (3,321.0) (1,921.3) (2,181.9)
Other financing cash flow (16.4) (93.9) 122.1 0.0 0.0 0.0
Net cash flow from financing activities (1,185.6) (1,176.5) (1,490.4) (3,321.0) (1,921.3) (2,181.9)
Net increase in cash and cash equivalent 1,463.3 315.0 756.9 493.7 780.6 566.3
Cash and equivalent at beginning of the year 4,061.5 5,524.0 5,857.3 6,699.2 7,192.9 7,973.5
FX gains/(losses) on cash and equivalents (0.8) 18.4 53.0 0.0 0.0 0.0
Cash and cash equivalent at end of the year 5,524.0 5,857.3 6,667.3 7,192.9 7,973.5 8,539.9
Source: Company data, Deutsche Bank estimates
18 May 2016
Automobiles & Components
China Autos
Page 72 Deutsche Bank AG/Hong Kong
Risks
Sudden change in the country’s NEV bus subsidy policy
Yutong and the whole EV sector is inextricably linked to government policy,
both for sales and for subsidies throughout the industry. While we have
reviewed the current regulations and conclude these will be supportive
through till 2020, the key risk for Yutong is any sudden unfavorable change in
the government’s NEV bus subsidy policy. In addition, if the macroeconomic
environment remains weak for a longer-than-expected period, NEV sales might
also be depressed.
Given plans for an industry-wide capacity ramp, a slowdown in industry NEV
sales would lead to more serious capacity underutilization concerns and could
be followed by more severe price cuts. This would inevitably hurt margins for
industry participants such as Yutong Bus.
Volatility in raw material prices and availability of materials
Raw materials and components are the major risks on the cost side. Even
though the company may be able to pass some raw material price increases
on to customers, we believe the chance of a comprehensive and effective
pass-through is limited given market competition and the time lag in passing
costs on.
Ability to adopt new technology and develop new models
Our sales and earnings estimates are based on the assumption that Yutong
Bus can adopt new NEV technologies and apply them to auto
design/manufacturing. Should the company fail to commercialize R&D efforts
made to the development of new energy bus models, there could be downside
to our FY16-18 sales volume and earnings forecasts for Yutong.

18 May 2016
Automobiles & Components
China Autos
Deutsche Bank AG/Hong Kong Page 73
Company background
Long history in the China bus industry
Zhengzhou Yutong Bus Co., Ltd. (Yutong Bus) is a large bus manufacturer with
advanced technology, headquartered in Zhengzhou, Henan province, China. It
is the largest bus manufacturer in China in terms of 2015 bus sales volume.
Yutong Bus was listed on the Shanghai Stock Exchange in 1997, the first listed
company in China's bus industry. The company manufactures and sells large
and medium size buses with lengths ranging from 5m to 25m. The products
cover segments including, but not limited to, highway passenger transit,
tourism, public transport, school buses, and special vehicles.
Yutong Bus's history can be traced back to the Henan Provincial Department
of Transport Zhengzhou Bus Repair Factory, which was established in 1963.
The first coach (JT660) was produced that year. With the implementation of
shareholding system reform, Yutong Bus was established in 1993. Besides
conventional engine buses, Yutong Bus also produces new energy buses.
Currently, the combined annual production capacity of the company’s three
manufacturing plants is 65,000 units. Yutong Bus exports its products to more
than 130 countries and regions, including Cuba, Venezuela, Peru, Australia,
Hong Kong, Macao, Taiwan, the Philippines, Kazakhstan, Britain, France,
Russia, Saudi Arabia, Israel, Ghana, Sudan and other markets.
Figure 100: Zhengzhou Yutong Bus – development milestones
Year Milestones
1963 Established Henan Provincial Department of Transport Zhengzhou Bus Repair Factory and produced the first coach in Henan (JT660)
1968 Henan Provincial Department of Transport Zhengzhou Bus Repair Factory was renamed as Zhengzhou Bus Repair Factory
1985 Zhengzhou Bus Repair Factory was renamed as Zhengzhou Bus Factory
1993 Implemented shareholding system reform and established Zhengzhou Yutong Bus Co., Ltd. with a sales volume of 708 units
1995 Yutong's annual sales volume reached 2,000 units for the first time
1997 Zhengzhou Yutong Bus Co., Ltd. was listed on the Shanghai Stock Exchange and became the first listed company in China's bus industry
1997 Established international brand strategy and began to use the trademark "Yutong"
1998 Invested RMB400m in Yutong Industrial Park and put it into operation
2002 Yutong’s annual sales volume exceeded 10,000 units for the first time
2005 Launched its overseas market strategy and became the first Chinese bus builder to export CKD parts
2006 Granted the Certificate for the Exemption from Export Inspection
2009 Established Zhengzhou Yutong Bus Co., Ltd. Specialty Vehicle Branch
2009 Set up the internationally advanced cathodic electro coating line and the first experimental center for buses and parts in China
2011 Launched Yutong TSM (Yutong Electro coating Standard) intelligent operating system
2012 Yutong New Energy Bus Plant was put into operation
2013 Daily production capacity exceeded 310 units
2014 Yutong’s sales volume of buses and coaches exceeded 60,000 units for the first time, among which new energy bus reached 7,405 units, representing 90% YoY growth
2015 Yutong successfully completed the world's first trial operation of unmanned bus Source: Company data, Deutsche Bank

18 May 2016
Automobiles & Components
China Autos
Page 74 Deutsche Bank AG/Hong Kong
Figure 101: Zhengzhou Yutong Bus – corporate structure
Zhengzhou Yutong Group Co., Ltd.
85%
Zhengzhou Yutong Bus Co. Ltd. (Yutong Bus, 600066.SS)
Public A shares Lions Bus Co., Ltd.
15%
Partners of Zhengzhou Yutong Group Co., Ltd.
Zhengzhou Tongtai Zhihe Business Management Centre LP
郑州通泰志合企业管理中心(有限合伙)
Zhengzhou Tongtai Renhe Yihao Business Management Centre LP and 32 partnerships
郑州通泰人合壹号企业管理中心(有限合伙)等32家合伙企业
Zhengzhou Yiren Industrial Co., Ltd.
郑州亿仁实业有限公司
Mr. TANG Yuxiang
Zhengzhou Tongtai Hezhi Management Consulting Ltd.
郑州通泰合智管理咨询有限公司
7 partner representatives, include Mr. Tang Yuxiang* (actual controller)
99% 99.99%
58.86%
0.01%, control
control
0.01%
100%
elect
99.99%
100%
37.19% 3.95%
Source: Company data, Deutsche Bank
Diversified product portfolio covering IC and NEV buses
Yutong Bus offers a diversified and complementary portfolio of bus models,
which enables the company to cover different market segments ranging from
large buses to medium and light buses. The company’s model portfolio
consists of both conventional internal combustion engine buses and new
energy buses that are able to satisfy a wide range of customer demands.
Figure 102: Yutong Bus – new energy bus model portfolio
Model Usage Type Vehicle length (m)
Driving range (km) Battery capacity (kWh)
E6 Public bus/Commuter EV 6.4 110-135 62
E7/E7+ Public bus/Commuter EV 7.0 120-160 78
E8/E8 MINI Public bus EV 8.0-8.4 110-135/140-170 89
E8 Commuter EV 8.0 110-130 89
E9 Commuter EV 9.0 145-170 n.a.
E10 Public bus EV 10.5 135-165/220-280 147/248
E10 Commuter EV 10.7 140-180 147
E12 Public bus EV 12.0 120-155/230-300 147/285
E12 Commuter EV 12.0 150-180 147
H8/H8+ Public bus PHEV 8.2-8.5 n.a. n.a.
ZK6105CHEVNPG21 Public bus PHEV 10.5 n.a. n.a.
ZK6120CHEVNPG21 Public bus PHEV 11.5 n.a. n.a.
ZK6125CHEVNPG21 Public bus PHEV 12.0 n.a. n.a.
ZK6180CHEVNPG3 Public bus PHEV 18.0 n.a. n.a.
Source: Company data, Deutsche Bank
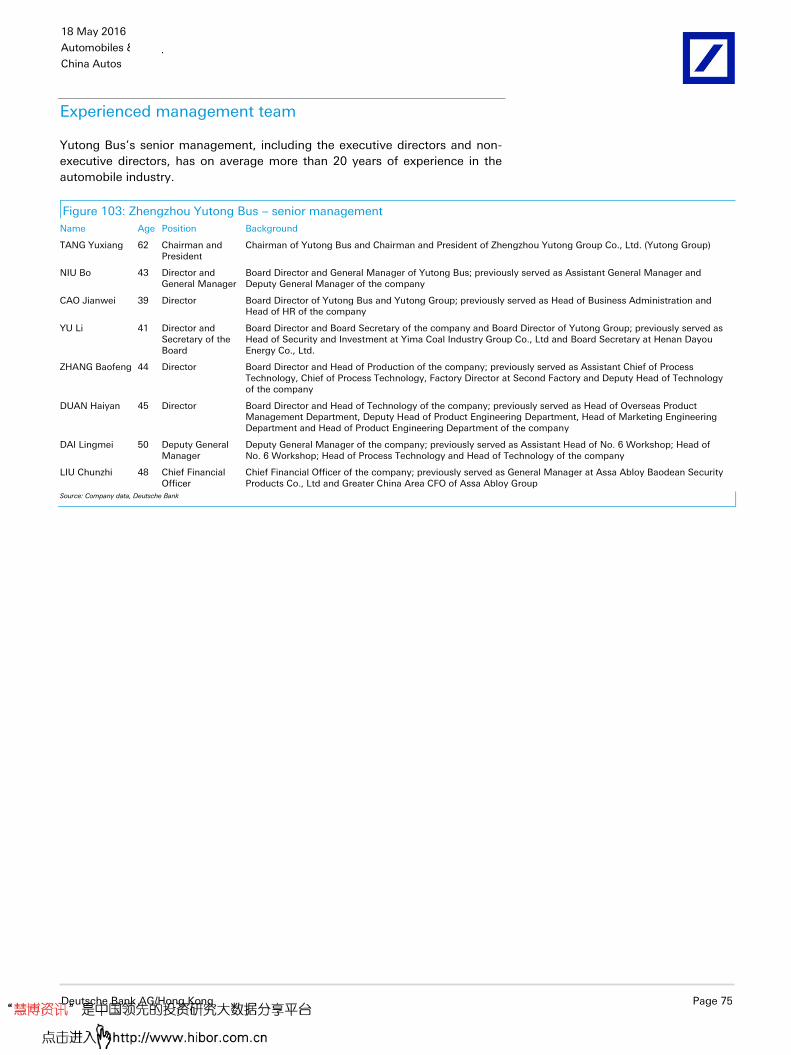
18 May 2016
Automobiles & Components
China Autos
Deutsche Bank AG/Hong Kong Page 75
Experienced management team
Yutong Bus’s senior management, including the executive directors and non-
executive directors, has on average more than 20 years of experience in the
automobile industry.
Figure 103: Zhengzhou Yutong Bus – senior management
Name Age Position Background
TANG Yuxiang 62 Chairman and President
Chairman of Yutong Bus and Chairman and President of Zhengzhou Yutong Group Co., Ltd. (Yutong Group)
NIU Bo 43 Director and General Manager
Board Director and General Manager of Yutong Bus; previously served as Assistant General Manager and Deputy General Manager of the company
CAO Jianwei 39 Director Board Director of Yutong Bus and Yutong Group; previously served as Head of Business Administration and Head of HR of the company
YU Li 41 Director and Secretary of the Board
Board Director and Board Secretary of the company and Board Director of Yutong Group; previously served as Head of Security and Investment at Yima Coal Industry Group Co., Ltd and Board Secretary at Henan Dayou Energy Co., Ltd.
ZHANG Baofeng 44 Director Board Director and Head of Production of the company; previously served as Assistant Chief of Process Technology, Chief of Process Technology, Factory Director at Second Factory and Deputy Head of Technology of the company
DUAN Haiyan 45 Director Board Director and Head of Technology of the company; previously served as Head of Overseas Product Management Department, Deputy Head of Product Engineering Department, Head of Marketing Engineering Department and Head of Product Engineering Department of the company
DAI Lingmei 50 Deputy General Manager
Deputy General Manager of the company; previously served as Assistant Head of No. 6 Workshop; Head of No. 6 Workshop; Head of Process Technology and Head of Technology of the company
LIU Chunzhi 48 Chief Financial Officer
Chief Financial Officer of the company; previously served as General Manager at Assa Abloy Baodean Security Products Co., Ltd and Greater China Area CFO of Assa Abloy Group
Source: Company data, Deutsche Bank
18 May 2016
Automobiles & Components
China Autos
Page 76 Deutsche Bank AG/Hong Kong
The author of this report wishes to acknowledge the contributions made by Ms.
Lu Xu, an employee of Crisil, a third-party provider to Deutsche Bank of offshore
research support services.

18 May 2016
Automobiles & Components
China Autos
Deutsche Bank AG/Hong Kong Page 77
Appendix 1
Important Disclosures
Additional information available upon request
Disclosure checklist
Company Ticker Recent price* Disclosure
Yutong Bus 600066.SS 21.66 (CNY) 18 May 16 NA
BYD-A 002594.SZ 58.56 (CNY) 18 May 16 7,14,15
BYD 1211.HK 42.15 (HKD) 18 May 16 7,14,15
BAIC Motor 1958.HK 5.42 (HKD) 18 May 16 7
SAIC Motor 600104.SS 19.81 (CNY) 18 May 16 NA *Prices are current as of the end of the previous trading session unless otherwise indicated and are sourced from local exchanges via Reuters, Bloomberg and other vendors . Other information is sourced from Deutsche Bank, subject companies, and other sources. For disclosures pertaining to recommendations or estimates made on securities other than the primary subject of this research, please see the most recently published company report or visit our global disclosure look-up page on our website at http://gm.db.com/ger/disclosure/DisclosureDirectory.eqsr.
Important Disclosures Required by U.S. Regulators
Disclosures marked with an asterisk may also be required by at least one jurisdiction in addition to the United States. See Important Disclosures Required by Non-US Regulators and Explanatory Notes.
7. Deutsche Bank and/or its affiliate(s) has received compensation from this company for the provision of investment banking or financial advisory services within the past year.
14. Deutsche Bank and/or its affiliate(s) has received non-investment banking related compensation from this company within the past year.
15. This company has been a client of Deutsche Bank Securities Inc. within the past year, during which time it received non-investment banking securities-related services.
Important Disclosures Required by Non-U.S. Regulators
Please also refer to disclosures in the Important Disclosures Required by US Regulators and the Explanatory Notes.
7. Deutsche Bank and/or its affiliate(s) has received compensation from this company for the provision of investment banking or financial advisory services within the past year.
For disclosures pertaining to recommendations or estimates made on securities other than the primary subject of this research, please see the most recently published company report or visit our global disclosure look-up page on our website at http://gm.db.com/ger/disclosure/DisclosureDirectory.eqsr
Analyst Certification
The views expressed in this report accurately reflect the personal views of the undersigned lead analyst about the subject issuers and the securities of those issuers. In addition, the undersigned lead analyst has not and will not receive any compensation for providing a specific recommendation or view in this report. Vincent Ha

Historical recommendations and target price: Yutong Bus (600066.SS) (as of 5/18/2016)
0.00
5.00
10.00
15.00
20.00
25.00
30.00
35.00
May 13 Aug 13 Nov 13 Feb 14 May 14 Aug 14 Nov 14 Feb 15 May 15 Aug 15 Nov 15 Feb 16
Secu
rity
Pri
ce
Date
Previous Recommendations
Strong Buy Buy Market Perform Underperform Not Rated Suspended Rating
Current Recommendations
Buy Hold Sell Not Rated Suspended Rating
*New Recommendation Structure as of September 9,2002
Historical recommendations and target price: BYD-A (002594.SZ) (as of 5/18/2016)
1
2
3
4
5
6
7
8
0.00
10.00
20.00
30.00
40.00
50.00
60.00
70.00
80.00
90.00
May 13 Aug 13 Nov 13 Feb 14 May 14 Aug 14 Nov 14 Feb 15 May 15 Aug 15 Nov 15 Feb 16
Secu
rity
Pri
ce
Date
Previous Recommendations
Strong Buy Buy Market Perform Underperform Not Rated Suspended Rating
Current Recommendations
Buy Hold Sell Not Rated Suspended Rating
*New Recommendation Structure as of September 9,2002
1. 12/03/2015: Upgrade to Sell, Target Price Change CNY27.70 5. 29/10/2015: Sell, Target Price Change CNY34.90
2. 02/06/2015: Sell, Target Price Change CNY40.90 6. 27/11/2015: Sell, Target Price Change CNY35.90
3. 07/08/2015: Sell, Target Price Change CNY34.80 7. 14/03/2016: Sell, Target Price Change CNY38.20
4. 27/08/2015: Sell, Target Price Change CNY30.90 8. 29/03/2016: Sell, Target Price Change CNY39.50
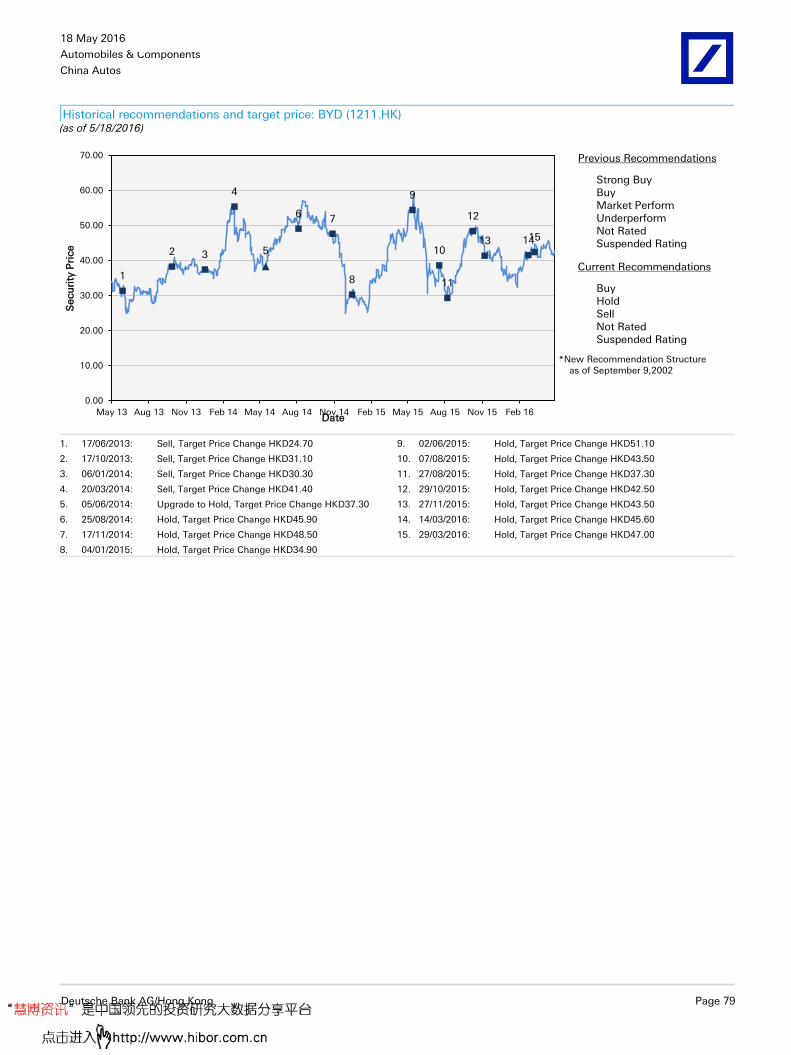
18 May 2016
Automobiles & Components
China Autos
Deutsche Bank AG/Hong Kong Page 79
Historical recommendations and target price: BYD (1211.HK) (as of 5/18/2016)
1
2 3
4
5
6 7
8
9
10
11
12
13 1415
0.00
10.00
20.00
30.00
40.00
50.00
60.00
70.00
May 13 Aug 13 Nov 13 Feb 14 May 14 Aug 14 Nov 14 Feb 15 May 15 Aug 15 Nov 15 Feb 16
Secu
rity
Pri
ce
Date
Previous Recommendations
Strong Buy Buy Market Perform Underperform Not Rated Suspended Rating
Current Recommendations
Buy Hold Sell Not Rated Suspended Rating
*New Recommendation Structure as of September 9,2002
1. 17/06/2013: Sell, Target Price Change HKD24.70 9. 02/06/2015: Hold, Target Price Change HKD51.10
2. 17/10/2013: Sell, Target Price Change HKD31.10 10. 07/08/2015: Hold, Target Price Change HKD43.50
3. 06/01/2014: Sell, Target Price Change HKD30.30 11. 27/08/2015: Hold, Target Price Change HKD37.30
4. 20/03/2014: Sell, Target Price Change HKD41.40 12. 29/10/2015: Hold, Target Price Change HKD42.50
5. 05/06/2014: Upgrade to Hold, Target Price Change HKD37.30 13. 27/11/2015: Hold, Target Price Change HKD43.50
6. 25/08/2014: Hold, Target Price Change HKD45.90 14. 14/03/2016: Hold, Target Price Change HKD45.60
7. 17/11/2014: Hold, Target Price Change HKD48.50 15. 29/03/2016: Hold, Target Price Change HKD47.00
8. 04/01/2015: Hold, Target Price Change HKD34.90

Historical recommendations and target price: BAIC Motor (1958.HK) (as of 5/18/2016)
1
23
4 5
6
7
8910
0.00
2.00
4.00
6.00
8.00
10.00
12.00
14.00
Dec 14 Mar 15 Jun 15 Sep 15 Dec 15 Mar 16
Secu
rity
Pri
ce
Date
Previous Recommendations
Strong Buy Buy Market Perform Underperform Not Rated Suspended Rating
Current Recommendations
Buy Hold Sell Not Rated Suspended Rating
*New Recommendation Structure as of September 9,2002
1. 25/01/2015: Upgrade to Buy, Target Price Change HKD11.30 6. 26/08/2015: Buy, Target Price Change HKD8.90
2. 21/04/2015: Buy, Target Price Change HKD12.30 7. 27/11/2015: Buy, Target Price Change HKD9.50
3. 02/06/2015: Buy, Target Price Change HKD13.40 8. 18/02/2016: Buy, Target Price Change HKD7.40
4. 31/07/2015: Buy, Target Price Change HKD10.10 9. 26/02/2016: Buy, Target Price Change HKD7.10
5. 11/08/2015: Buy, Target Price Change HKD9.30 10. 29/03/2016: Buy, Target Price Change HKD7.30
Historical recommendations and target price: SAIC Motor (600104.SS) (as of 5/18/2016)
1
23
0.00
5.00
10.00
15.00
20.00
25.00
30.00
May 13 Aug 13 Nov 13 Feb 14 May 14 Aug 14 Nov 14 Feb 15 May 15 Aug 15 Nov 15 Feb 16
Secu
rity
Pri
ce
Date
Previous Recommendations
Strong Buy Buy Market Perform Underperform Not Rated Suspended Rating
Current Recommendations
Buy Hold Sell Not Rated Suspended Rating
*New Recommendation Structure as of September 9,2002
1. 24/09/2015: Upgrade to Buy, Target Price Change CNY20.50 3. 28/01/2016: Buy, Target Price Change CNY23.80
2. 27/11/2015: Buy, Target Price Change CNY23.20
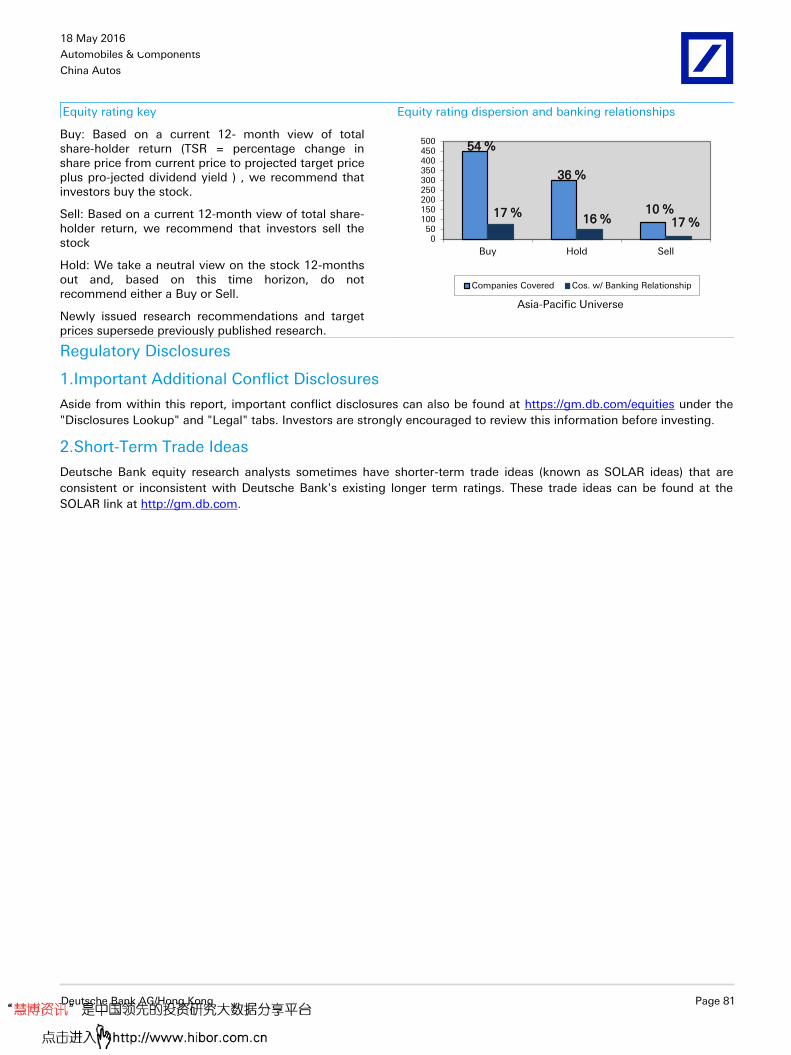
18 May 2016
Automobiles & Components
China Autos
Deutsche Bank AG/Hong Kong Page 81
Equity rating key Equity rating dispersion and banking relationships
Buy: Based on a current 12- month view of total share-holder return (TSR = percentage change in share price from current price to projected target price plus pro-jected dividend yield ) , we recommend that investors buy the stock.
Sell: Based on a current 12-month view of total share-holder return, we recommend that investors sell the stock
Hold: We take a neutral view on the stock 12-months out and, based on this time horizon, do not recommend either a Buy or Sell.
Newly issued research recommendations and target prices supersede previously published research.
54 %
36 %
10 %17 %16 % 17 %
050
100150200250300350400450500
Buy Hold Sell
Asia-Pacific Universe
Companies Covered Cos. w/ Banking Relationship
Regulatory Disclosures
1.Important Additional Conflict Disclosures
Aside from within this report, important conflict disclosures can also be found at https://gm.db.com/equities under the
"Disclosures Lookup" and "Legal" tabs. Investors are strongly encouraged to review this information before investing.
2.Short-Term Trade Ideas
Deutsche Bank equity research analysts sometimes have shorter-term trade ideas (known as SOLAR ideas) that are
consistent or inconsistent with Deutsche Bank's existing longer term ratings. These trade ideas can be found at the
SOLAR link at http://gm.db.com.

Additional Information
The information and opinions in this report were prepared by Deutsche Bank AG or one of its affiliates (collectively
"Deutsche Bank"). Though the information herein is believed to be reliable and has been obtained from public sources
believed to be reliable, Deutsche Bank makes no representation as to its accuracy or completeness.
If you use the services of Deutsche Bank in connection with a purchase or sale of a security that is discussed in this
report, or is included or discussed in another communication (oral or written) from a Deutsche Bank analyst, Deutsche
Bank may act as principal for its own account or as agent for another person.
Deutsche Bank may consider this report in deciding to trade as principal. It may also engage in transactions, for its own
account or with customers, in a manner inconsistent with the views taken in this research report. Others within
Deutsche Bank, including strategists, sales staff and other analysts, may take views that are inconsistent with those
taken in this research report. Deutsche Bank issues a variety of research products, including fundamental analysis,
equity-linked analysis, quantitative analysis and trade ideas. Recommendations contained in one type of communication
may differ from recommendations contained in others, whether as a result of differing time horizons, methodologies or
otherwise. Deutsche Bank and/or its affiliates may also be holding debt securities of the issuers it writes on.
Analysts are paid in part based on the profitability of Deutsche Bank AG and its affiliates, which includes investment
banking revenues.
Opinions, estimates and projections constitute the current judgment of the author as of the date of this report. They do
not necessarily reflect the opinions of Deutsche Bank and are subject to change without notice. Deutsche Bank has no
obligation to update, modify or amend this report or to otherwise notify a recipient thereof if any opinion, forecast or
estimate contained herein changes or subsequently becomes inaccurate. This report is provided for informational
purposes only. It is not an offer or a solicitation of an offer to buy or sell any financial instruments or to participate in any
particular trading strategy. Target prices are inherently imprecise and a product of the analyst’s judgment. The financial
instruments discussed in this report may not be suitable for all investors and investors must make their own informed
investment decisions. Prices and availability of financial instruments are subject to change without notice and
investment transactions can lead to losses as a result of price fluctuations and other factors. If a financial instrument is
denominated in a currency other than an investor's currency, a change in exchange rates may adversely affect the
investment. Past performance is not necessarily indicative of future results. Unless otherwise indicated, prices are
current as of the end of the previous trading session, and are sourced from local exchanges via Reuters, Bloomberg and
other vendors. Data is sourced from Deutsche Bank, subject companies, and in some cases, other parties.
Macroeconomic fluctuations often account for most of the risks associated with exposures to instruments that promise
to pay fixed or variable interest rates. For an investor who is long fixed rate instruments (thus receiving these cash
flows), increases in interest rates naturally lift the discount factors applied to the expected cash flows and thus cause a
loss. The longer the maturity of a certain cash flow and the higher the move in the discount factor, the higher will be the
loss. Upside surprises in inflation, fiscal funding needs, and FX depreciation rates are among the most common adverse
macroeconomic shocks to receivers. But counterparty exposure, issuer creditworthiness, client segmentation, regulation
(including changes in assets holding limits for different types of investors), changes in tax policies, currency
convertibility (which may constrain currency conversion, repatriation of profits and/or the liquidation of positions), and
settlement issues related to local clearing houses are also important risk factors to be considered. The sensitivity of fixed
income instruments to macroeconomic shocks may be mitigated by indexing the contracted cash flows to inflation, to
FX depreciation, or to specified interest rates – these are common in emerging markets. It is important to note that the
index fixings may -- by construction -- lag or mis-measure the actual move in the underlying variables they are intended
to track. The choice of the proper fixing (or metric) is particularly important in swaps markets, where floating coupon
rates (i.e., coupons indexed to a typically short-dated interest rate reference index) are exchanged for fixed coupons. It is
also important to acknowledge that funding in a currency that differs from the currency in which coupons are
denominated carries FX risk. Naturally, options on swaps (swaptions) also bear the risks typical to options in addition to
the risks related to rates movements.

18 May 2016
Automobiles & Components
China Autos
Deutsche Bank AG/Hong Kong Page 83
Derivative transactions involve numerous risks including, among others, market, counterparty default and illiquidity risk.
The appropriateness or otherwise of these products for use by investors is dependent on the investors' own
circumstances including their tax position, their regulatory environment and the nature of their other assets and
liabilities, and as such, investors should take expert legal and financial advice before entering into any transaction similar
to or inspired by the contents of this publication. The risk of loss in futures trading and options, foreign or domestic, can
be substantial. As a result of the high degree of leverage obtainable in futures and options trading, losses may be
incurred that are greater than the amount of funds initially deposited. Trading in options involves risk and is not suitable
for all investors. Prior to buying or selling an option investors must review the "Characteristics and Risks of Standardized
Options”, at http://www.optionsclearing.com/about/publications/character-risks.jsp. If you are unable to access the
website please contact your Deutsche Bank representative for a copy of this important document.
Participants in foreign exchange transactions may incur risks arising from several factors, including the following: ( i)
exchange rates can be volatile and are subject to large fluctuations; ( ii) the value of currencies may be affected by
numerous market factors, including world and national economic, political and regulatory events, events in equity and
debt markets and changes in interest rates; and (iii) currencies may be subject to devaluation or government imposed
exchange controls which could affect the value of the currency. Investors in securities such as ADRs, whose values are
affected by the currency of an underlying security, effectively assume currency risk.
Unless governing law provides otherwise, all transactions should be executed through the Deutsche Bank entity in the
investor's home jurisdiction.
United States: Approved and/or distributed by Deutsche Bank Securities Incorporated, a member of FINRA, NFA and
SIPC. Analysts employed by non-US affiliates may not be associated persons of Deutsche Bank Securities Incorporated
and therefore not subject to FINRA regulations concerning communications with subject companies, public appearances
and securities held by analysts.
Germany: Approved and/or distributed by Deutsche Bank AG, a joint stock corporation with limited liability incorporated
in the Federal Republic of Germany with its principal office in Frankfurt am Main. Deutsche Bank AG is authorized under
German Banking Law and is subject to supervision by the European Central Bank and by BaFin, Germany’s Federal
Financial Supervisory Authority.
United Kingdom: Approved and/or distributed by Deutsche Bank AG acting through its London Branch at Winchester
House, 1 Great Winchester Street, London EC2N 2DB. Deutsche Bank AG in the United Kingdom is authorised by the
Prudential Regulation Authority and is subject to limited regulation by the Prudential Regulation Authority and Financial
Conduct Authority. Details about the extent of our authorisation and regulation are available on request.
Hong Kong: Distributed by Deutsche Bank AG, Hong Kong Branch.
India: Prepared by Deutsche Equities India Pvt Ltd, which is registered by the Securities and Exchange Board of India
(SEBI) as a stock broker. Research Analyst SEBI Registration Number is INH000001741. DEIPL may have received
administrative warnings from the SEBI for breaches of Indian regulations.
Japan: Approved and/or distributed by Deutsche Securities Inc.(DSI). Registration number - Registered as a financial
instruments dealer by the Head of the Kanto Local Finance Bureau (Kinsho) No. 117. Member of associations: JSDA,
Type II Financial Instruments Firms Association and The Financial Futures Association of Japan. Commissions and risks
involved in stock transactions - for stock transactions, we charge stock commissions and consumption tax by
multiplying the transaction amount by the commission rate agreed with each customer. Stock transactions can lead to
losses as a result of share price fluctuations and other factors. Transactions in foreign stocks can lead to additional
losses stemming from foreign exchange fluctuations. We may also charge commissions and fees for certain categories
of investment advice, products and services. Recommended investment strategies, products and services carry the risk
of losses to principal and other losses as a result of changes in market and/or economic trends, and/or fluctuations in
market value. Before deciding on the purchase of financial products and/or services, customers should carefully read the
relevant disclosures, prospectuses and other documentation. "Moody's", "Standard & Poor's", and "Fitch" mentioned in
this report are not registered credit rating agencies in Japan unless Japan or "Nippon" is specifically designated in the
name of the entity. Reports on Japanese listed companies not written by analysts of DSI are written by Deutsche Bank

Group's analysts with the coverage companies specified by DSI. Some of the foreign securities stated on this report are
not disclosed according to the Financial Instruments and Exchange Law of Japan.
Korea: Distributed by Deutsche Securities Korea Co.
South Africa: Deutsche Bank AG Johannesburg is incorporated in the Federal Republic of Germany (Branch Register
Number in South Africa: 1998/003298/10).
Singapore: by Deutsche Bank AG, Singapore Branch or Deutsche Securities Asia Limited, Singapore Branch (One Raffles
Quay #18-00 South Tower Singapore 048583, +65 6423 8001), which may be contacted in respect of any matters
arising from, or in connection with, this report. Where this report is issued or promulgated in Singapore to a person who
is not an accredited investor, expert investor or institutional investor (as defined in the applicable Singapore laws and
regulations), they accept legal responsibility to such person for its contents.
Taiwan: Information on securities/investments that trade in Taiwan is for your reference only. Readers should
independently evaluate investment risks and are solely responsible for their investment decisions. Deutsche Bank
research may not be distributed to the Taiwan public media or quoted or used by the Taiwan public media without
written consent. Information on securities/instruments that do not trade in Taiwan is for informational purposes only and
is not to be construed as a recommendation to trade in such securities/instruments. Deutsche Securities Asia Limited,
Taipei Branch may not execute transactions for clients in these securities/instruments.
Qatar: Deutsche Bank AG in the Qatar Financial Centre (registered no. 00032) is regulated by the Qatar Financial Centre
Regulatory Authority. Deutsche Bank AG - QFC Branch may only undertake the financial services activities that fall
within the scope of its existing QFCRA license. Principal place of business in the QFC: Qatar Financial Centre, Tower,
West Bay, Level 5, PO Box 14928, Doha, Qatar. This information has been distributed by Deutsche Bank AG. Related
financial products or services are only available to Business Customers, as defined by the Qatar Financial Centre
Regulatory Authority.
Russia: This information, interpretation and opinions submitted herein are not in the context of, and do not constitute,
any appraisal or evaluation activity requiring a license in the Russian Federation.
Kingdom of Saudi Arabia: Deutsche Securities Saudi Arabia LLC Company, (registered no. 07073-37) is regulated by the
Capital Market Authority. Deutsche Securities Saudi Arabia may only undertake the financial services activities that fall
within the scope of its existing CMA license. Principal place of business in Saudi Arabia: King Fahad Road, Al Olaya
District, P.O. Box 301809, Faisaliah Tower - 17th Floor, 11372 Riyadh, Saudi Arabia.
United Arab Emirates: Deutsche Bank AG in the Dubai International Financial Centre (registered no. 00045) is regulated
by the Dubai Financial Services Authority. Deutsche Bank AG - DIFC Branch may only undertake the financial services
activities that fall within the scope of its existing DFSA license. Principal place of business in the DIFC: Dubai
International Financial Centre, The Gate Village, Building 5, PO Box 504902, Dubai, U.A.E. This information has been
distributed by Deutsche Bank AG. Related financial products or services are only available to Professional Clients, as
defined by the Dubai Financial Services Authority.
Australia: Retail clients should obtain a copy of a Product Disclosure Statement (PDS) relating to any financial product
referred to in this report and consider the PDS before making any decision about whether to acquire the product. Please
refer to Australian specific research disclosures and related information at
https://australia.db.com/australia/content/research-information.html
Australia and New Zealand: This research, and any access to it, is intended only for "wholesale clients" within the
meaning of the Australian Corporations Act and New Zealand Financial Advisors Act respectively.
Additional information relative to securities, other financial products or issuers discussed in this report is available upon
request. This report may not be reproduced, distributed or published without Deutsche Bank's prior written consent.
Copyright © 2016 Deutsche Bank AG

GRCM2016PROD035542
David Folkerts-Landau Chief Economist and Global Head of Research
Raj Hindocha Global Chief Operating Officer
Research
Marcel Cassard Global Head
FICC Research & Global Macro Economics
Steve Pollard Global Head
Equity Research
Michael Spencer Regional Head
Asia Pacific Research
Ralf Hoffmann Regional Head
Deutsche Bank Research, Germany
Andreas Neubauer Regional Head
Equity Research, Germany
International locations
Deutsche Bank AG
Deutsche Bank Place
Level 16
Corner of Hunter & Phillip Streets
Sydney, NSW 2000
Australia
Tel: (61) 2 8258 1234
Deutsche Bank AG
Große Gallusstraße 10-14
60272 Frankfurt am Main
Germany
Tel: (49) 69 910 00
Deutsche Bank AG
Filiale Hongkong
International Commerce Centre,
1 Austin Road West,Kowloon,
Hong Kong
Tel: (852) 2203 8888
Deutsche Securities Inc.
2-11-1 Nagatacho
Sanno Park Tower
Chiyoda-ku, Tokyo 100-6171
Japan
Tel: (81) 3 5156 6770
Deutsche Bank AG London
1 Great Winchester Street
London EC2N 2EQ
United Kingdom
Tel: (44) 20 7545 8000
Deutsche Bank Securities Inc.
60 Wall Street
New York, NY 10005
United States of America
Tel: (1) 212 250 2500