dating the species network: allopolyploidy and repetitive
TRANSCRIPT

[15:56 3/10/2018 Sysbio-OP-SYSB180024.tex] Page: 1010 1010–1025
Syst. Biol. 67(6):1010–1024, 2018© The Author(s) 2018. Published by Oxford University Press, on behalf of the Society of Systematic Biologists.This is an Open Access article distributed under the terms of the Creative Commons Attribution Non-Commercial License (http://creativecommons.org/licenses/by-nc/4.0/), which permitsunrestricted reuse, distribution, and reproduction in any medium, provided the original work is properly cited. For permissions, please email: [email protected]:10.1093/sysbio/syy024Advance Access publication March 19, 2018
Dating the Species Network: Allopolyploidy and Repetitive DNA Evolution in AmericanDaisies (Melampodium sect. Melampodium, Asteraceae)
JAMIE MCCANN1, TAE-SOO JANG1,2, JIRI MACAS3, GERALD M. SCHNEEWEISS1, NICHOLAS J. MATZKE4, PETR NOVÁK3,TOD F. STUESSY1,5, JOSÉ L. VILLASEÑOR6, AND HANNA WEISS-SCHNEEWEISS1,∗
1Department of Botany and Biodiversity Research, University of Vienna, Rennweg 14, A-1030 Vienna, Austria; 2Department of Biology, College ofBioscience and Biotechnology, Chungnam National University, Daejeon 34134, South Korea; 3Biology Centre, Czech Academy of Sciences, Institute of Plant
Molecular Biology, Branišovská 31, CZ-37005, Ceské Budejovice, Czech Republic; 4Division of Ecology and Evolution, Research School of Biology,Australian National University, Canberra, ACT 2601, Australia; 5Herbarium and Department of Evolution, Ecology and Organismal Biology, 1315 Kinnear
Road, The Ohio State University, Columbus, Ohio 43212, USA; and 6Department of Botany, UNAM,Tercer Circuito s/n, Ciudad Universitaria, Delegación Coyoacán, MX-04510 México, D.F., México
∗Correspondence to be sent to: Department of Botany and Biodiversity Research, University of Vienna, Rennweg 14, 1030 Vienna, Austria.Email: [email protected].
Received 4 July 2017; reviews returned 17 February 2018; accepted 15 March 2018Associate Editor: David Tank
Abstract.—Allopolyploidy has played an important role in the evolution of the flowering plants. Genome mergers areoften accompanied by significant and rapid alterations of genome size and structure via chromosomal rearrangements andaltered dynamics of tandem and dispersed repetitive DNA families. Recent developments in sequencing technologies andbioinformatic methods allow for a comprehensive investigation of the repetitive component of plant genomes. Interpretationof evolutionary dynamics following allopolyploidization requires both the knowledge of parentage and the age of origin of anallopolyploid. Whereas parentage is typically inferred from cytogenetic and phylogenetic data, age inference is hamperedby the reticulate nature of the phylogenetic relationships. Treating subgenomes of allopolyploids as if they belonged todifferent species (i.e., no recombination among subgenomes) and applying cross-bracing (i.e., putting a constraint on theage difference of nodes pertaining to the same event), we can infer the age of allopolyploids within the framework of themultispecies coalescent within BEAST2. Together with a comprehensive characterization of the repetitive DNA fraction usingthe RepeatExplorer pipeline, we apply the dating approach in a group of closely related allopolyploids and their progenitorspecies in the plant genus Melampodium (Asteraceae). We dated the origin of both the allotetraploid, Melampodium strigosum,and its two allohexaploid derivatives, Melampodium pringlei and Melampodium sericeum, which share both parentage and thedirection of the cross, to the Pleistocene (<1.4 Ma). Thus, Pleistocene climatic fluctuations may have triggered formation ofallopolyploids possibly in short intervals, contributing to difficulties in inferring the precise temporal order of allopolyploidspecies divergence of M. sericeum and M. pringlei. The relatively recent origin of the allopolyploids likely played a role in thenear-absence of major changes in the repetitive fraction of the polyploids’ genomes. The repetitive elements most affected bythe postpolyploidization changes represented retrotransposons of the Ty1-copia lineage Maximus and, to a lesser extent, alsoAthila elements of Ty3-gypsy family.[Allopolyploidy; divergence time estimation; Melampodium; phylogenetics; repetitiveDNA evolution; species network.]
Polyploidy plays an important role in eukaryoticgenome evolution, especially in the plant kingdom(Madlung 2013; Weiss-Schneeweiss et al. 2013; Wendel2015), and although the debate over its relevancefor speciation continues (see Mayrose et al. 2011and replies), it is clear that most plants stem frompolyploid backgrounds (Comai 2005; Jiao et al. 2011).Allopolyploidy, in particular, combines hybridizationand whole genome duplication (WGD) and is thoughtto be a mechanism contributing to diversification inplants (Grant 1981; Rieseberg and Willis 2007; Wood et al.2009). This evolutionary process has also been shownto stimulate rapid and extensive genome reshufflingattributed to either hybridization, genome doubling or acombination of both (Koh et al. 2010; Barker et al. 2012).
Genome dynamics in allopolyploids typically reflectthe processes of genetic and cytological diploidization(Wolfe 2001; Leitch and Bennett 2004; Ma and Gustafson2005; Renny-Byfield et al. 2013; Hollister 2015). Animportant component of these dynamics is repetitiveDNA, which is responsible for much of the genome sizevariation observed in the plant kingdom (Dodsworthet al. 2015). Repetitive DNA in plant genomes is
composed largely of dispersed transposable elements(retrotransposons and DNA transposons; Bennetzenand Wang 2014) and tandem repeats, both noncoding(arrays of monomers of species- or genus-specificsatellite DNAs; Macas et al. 2002; Garrido-Ramos 2015)and coding (ribosomal DNAs), arranged in distinctchromosomal loci (Kovarík et al. 2008). Major changesin the composition of repetitive DNA have beenshown to occur soon after allopolyploidization inNicotiana (Renny-Byfield et al. 2011, 2012, 2013), witha near-complete genome turnover occurring within afew million years only (Lim et al. 2007). Althoughchanges in repetitive DNA landscapes on the genomicscale can now be comprehensively investigated dueto technological (high-throughput sequencing) andanalytical advances (dedicated bioinformatic pipelines,such as RepeatExplorer: Novák et al. 2010, 2013),comparative studies in allopolyploid species remainscarce (Renny-Byfield et al. 2011, 2012, 2013; Mandákováet al. 2013; Zozomová-Lihová et al. 2014).
Inferences of the dynamics and mechanisms of theevolution of polyploid genomes require understandingtheir origins, with respect to both their parentage
1010
Dow
nloaded from https://academ
ic.oup.com/sysbio/article-abstract/67/6/1010/4944071 by Australian N
ational University user on 26 February 2019

[15:56 3/10/2018 Sysbio-OP-SYSB180024.tex] Page: 1011 1010–1025
2018 MCCANN ET AL.—AGE ESTIMATION AND REPEAT DYNAMICS IN POLYPLOIDS 1011
and age. The parental origin of an allopolyploid istypically inferred from a combination of morphological,cytogenetic, and molecular evidence. Hypotheses ofparental origin can be tested and refined by genomicin situ hybridization (GISH; i.e., mapping of genomicDNAs of the putative parental taxa to allopolyploidchromosomes; Jang and Weiss-Schneeweiss 2015),additionally allowing for the assessment of the extentof interactions between the parental subgenomes inallopolyploids (Chester et al. 2012, 2015; Mandákováet al. 2013, 2014). Several phylogenetic methods forreconstructing species networks have been developedthat can address, for instance, the assignment ofallopolyploid homoeologues to their correspondingparental genomes and building the species networksfrom multilabeled trees (Than et al. 2008; Jones et al.2013; Marcussen et al. 2012, 2015; Bertrand et al. 2015).A fully Bayesian approach incorporating assignment ofall homoeologues and the multispecies coalescent toreconstruct allopolyploid species networks has recentlybeen developed (AlloppNET and AlloppMUL models ofJones et al. 2013; Jones 2017), but it is currently availableonly for allotetraploids.
Despite these methodological advances inunderstanding allopolyploid origins, establishingan age for these origins remains problematic. Variousaspects of the mechanisms of allopolyploid formation,including number of origins, the extinction of parentaltaxa (incomplete sampling) and the presence of multiplesubgenomes in a single species complicate and biasa divergence time analysis (Doyle and Egan 2010).Bertrand et al. (2015) use the divergence times ofparental and allopolyploid alleles in a simple Bayesianmodel to determine ages for the allopolyploidy events,but this may introduce bias as divergence times of genesdo not necessarily correspond to those of the lineages(Kellogg 2016). This issue can be circumvented in theframework of the multispecies coalescent, where underthe same assumptions made by most of the previousphylogenetic approaches applied to allopolyploids, thatis, extant parental ancestors and disomic inheritance,the allopolyploid subgenomes may be treated as distinct“species” (Fig. 1). Dating a multilabeled tree obtained inthis way, however, will result in independent (and likelydifferent) age estimates for the splits of the allopolyploidsubgenomes from their respective lower-ploid ancestors.However, we know that these “two” divergence eventsare really one allopolyploidization event, and so shouldhave the same estimated age, even though the absoluteage of this event is unknown (Fig. 1). A method toobtain a single age estimate, with credible intervals, forthe splits between parental taxa and the correspondingallopolyploid subgenomes is “cross-bracing” the datinganalysis. Cross-bracing puts a prior constraint on theage difference of nodes pertaining to the same event(Fig. 1). It was recently introduced in the context of geneduplications (Shih and Matzke 2013), and its utility inthe context of allopolyploidy will be tested here.
An excellent group in which to perform dating ofallopolyploid origins and to investigate repetitive DNA
FIGURE 1. Application of cross-bracing to date the age ofallopolyploids. Species A and B gave rise to the allotetraploid speciesP (gray network). Under the assumption that the parental subgenomesin the allotetraploid, PA and PB, do not recombine, each is treated asdistinct “species” (i.e., a gene pool/subgenome that has no history ofintermixing with another gene pool/subgenome), resulting in a speciestree with four leaves (A, B, PA, PB). Split times between the lower-ploid species and the parental subgenomes [t(A/PA) and t(B/PB),indicated by dotted lines] have separate, explicit or implicit, priors(light grey distributions), but are forced by a narrow cross-bracing prior[white distribution; acting on the differences of the split age t(A/PA)and t(B/PB), respectively, from the mean split age t] to be essentiallycontemporaneous, as they correspond to the same allopolyploidizationevent.
evolution following (successive) polyploidization is thecytologically diverse genus Melampodium (Asteraceae).Its approximately 40 species exhibit chromosomenumber variation due to dysploidy (x=9, 10, 11, 12, 14)as well as polyploidy with 40% of the species being ofpolyploid origin (Stuessy et al. 2011; Weiss-Schneeweisset al. 2012; McCann et al. 2016). The focal group of thisstudy contains three diploid (Melampodium americanum,Melampodium glabribracteatum, and Melampodiumlinearilobum), one allotetraploid (Melampodiumstrigosum) and two allohexaploid species (Melampodiumpringlei and Melampodium sericeum), all belonging tosection Melampodium. The allotetraploid M. strigosum(2n=4x=40) originated from the hybridizationof the diploids M. americanum (2n=2x=20) andM. glabribracteatum (2n=2x=20), and in turn hashybridized with the diploid M. linearilobum (2n=2x=20)to give rise to two allohexaploid species, M. pringlei(2n=6x=60) and M. sericeum (2n=6x=60; Weiss-Schneeweiss et al. 2012). These two allohexaploids notonly share both parental species but also the directionof the cross (Weiss-Schneeweiss et al. 2012).
Here we use Melampodium to address how the age andparental origin of allopolyploids as well as ploidy levelinfluence the dynamics of repetitive DNA evolution.Specifically, we test the hypotheses that (1) the extent ofrepetitive DNA composition divergence from parentaltaxa increases with time after allopolyploid origin and(2) that divergent evolution of ribosomal DNAs (rDNAs),both in terms of sequences and number of loci (Weiss-Schneeweiss et al. 2012), is paralleled by divergentevolution of the repetitive fraction of the genome.To this end, we (1) establish a dated phylogenetic
Dow
nloaded from https://academ
ic.oup.com/sysbio/article-abstract/67/6/1010/4944071 by Australian N
ational University user on 26 February 2019

[15:56 3/10/2018 Sysbio-OP-SYSB180024.tex] Page: 1012 1010–1025
1012 SYSTEMATIC BIOLOGY VOL. 67
framework using cross-bracing in the program BEAST 2,(2) characterize the repetitive DNA in allopolyploid andparental genomes using the RepeatExplorer pipeline,and (3) investigate the dynamics of genome turnover inallopolyploids with respect to their parents and age oforigin.
MATERIALS AND METHODS
Dating AnalysesMolecular dating was done in two steps. First, the
age of Melampodium sect. Melampodium was estimatedusing a larger data set from the tribe Heliantheae towhich the genus Melampodium belongs. In the secondstep, the estimated age distribution for Melampodiumsect. Melampodium was used as secondary calibrationon the root node in a small data set includingthe focal allopolyploid species. All sequences wereobtained from GenBank. Alignments (nexus files),BEAST XML files, and annotated MCC trees aredeposited as Supplementary Material available onDryad at http://dx.doi.org/10.5061/dryad.dg8q0 (seebelow).
Divergence time analysis for the genus Melampodium.—Acollection of 159 sequences taken from lineages acrossthe Heliantheae alliance, containing ITS1, 5.8S, andITS2 of the 35S rDNA locus, were downloaded fromGenBank (Supplementary Table S1 available on Dryad).Sequence alignment of this data set was performedwith MUSCLE 3.8.31 (Edgar 2004) and further refinedby eye. Partitioning schemes and best-fit substitutionmodels were determined using the program IQ-TREE1.3.4 (Nguyen et al. 2015) and chosen based on theBayesian Information Criterion (BIC).
Molecular phylogenetic analysis and divergencetime estimation were performed in BEAST 2.4.2 usinga previous estimate on the age of the Heliantheaealliance (17–21 myr old; Kim et al. 2005, Torices 2010;see Supplementary Appendix S1 available on Dryadfor details). A log-normal prior was used for theheight of the root node. As a tree prior, a speciationmodel following a Yule process was used, with adiffuse inverse-gamma birth rate prior (alpha = 1,beta = 3). The monophyly of Melampodium (includingAcanthospermum and Lecocarpus) and the monophylyof section Melampodium (excluding Melampodiumlongipilum) was enforced as suggested by previous workin Blöch et al. (2009).
Both a strict and an uncorrelated (log-normal) relaxedclock (Drummond et al. 2006) model were used with agamma-distributed rate prior reflecting range estimatesfrom Kay et al. (2006; see Supplementary Appendix S1available on Dryad for details). Four separate runsof 25 × 106 generations (sampling every 10,000thgeneration) were performed for each model. The logfiles were merged without 10% burn-in for each runand examined for convergence [i.e., effective sample size(ESS) values of at least 200] using Tracer 1.8. Steppingstone sampling (Baele et al. 2012; 2013) was performed
using an increasingly larger number of steps (alwaysthe same for both models) until the marginal likelihoodestimates became stable. Each step was resumed untilthe ESS value of likelihood was >200. The marginallikelihood estimates for the competing clock modelswere used to choose the best-fit model according to theBayes Factor.
Dating the age of allopolyploid origin in Melampodiumsect. Melampodium.—One to two species were selectedper phylogenetically and cytologically defined diploidgenomic group (Weiss-Schneeweiss et al. 2012) thatwere considered most likely candidates involved inthe allopolyploidy events (Weiss-Schneeweiss et al.2012): M. glabribracteatum from diploid genomic groupGlabribracteata; M. linearilobum from diploid genomicgroup Lineariloba, M. americanum and Melampodiumdiffusum from diploid genomic group Melampodium.The subgenomes of the allopolyploids were treated asseparate “species.” In this context, “species” does notrefer to a taxonomic rank, but to a subgenome that hasno history of intermixing with another subgenome, i.e.,there is no recombination between subgenomes; withinsubgenomes, recombination between genes is permitted,while recombination within genes is not, thus followingthe same model assumptions used by Jones et al. (2013).
Sequences for five loci, the 5S rDNA nontranscribedspacer (NTS), the internal-transcribed spacers (ITS) 1and 2 of 35S rRNA gene, the chloroplast gene matK,and two paralogues of the nuclear gene PgiC (denotedI and II), for the selected diploid and allopolyploidspecies were downloaded from GenBank (accessionstaken from Blöch et al. 2009; Weiss-Schneeweiss et al.2012; Supplementary Table S2 available on Dryad),treated separately and aligned using MUSCLE 3.8.31(Edgar 2004). Partitioning and substitution modelswere evaluated as outlined above for the Heliantheaealliance. The previous assignment of sequences fromthe allopolyploids to diploid genomic groups by Weiss-Schneeweiss et al. (2012) was re-evaluated using pairwisemaximum likelihood (ML) estimates of genetic distancecalculated in IQ-TREE 1.3.4 (Nguyen et al. 2015) foreach locus. In case no sequence from a homoeologoussubgenome was recovered (due to concerted evolution,gene loss, etc.), an empty sequence was used, as forestimation of all parameters in *BEAST (e.g., meanpopulation size) all “species” (i.e., diploid species andsubgenomes of allopolyploids) had to be representedat least once in each alignment and twice in at leastone (Heled and Drummond 2010). For computationalreasons (avoidance of many different stepping stonesampling runs), applicability of a strict molecular clockwas tested for using likelihood ratio tests (Felsenstein1981). To this end, maximum likelihood trees werecalculated using IQ-TREE 1.3.4 (Nguyen et al. 2015),and likelihood scores were calculated on these treeswith and without the molecular clock assumption inMEGA 7.0.1 (Kumar et al. 2016). As the simpler modelof a homogeneous rate across the tree (i.e., a strict clockmodel) was significantly rejected in all cases (P<0.05),
Dow
nloaded from https://academ
ic.oup.com/sysbio/article-abstract/67/6/1010/4944071 by Australian N
ational University user on 26 February 2019

[15:56 3/10/2018 Sysbio-OP-SYSB180024.tex] Page: 1013 1010–1025
2018 MCCANN ET AL.—AGE ESTIMATION AND REPEAT DYNAMICS IN POLYPLOIDS 1013
only relaxed clock models were used in the followingBEAST analyses.
Relationships among “species” (i.e., diploid speciesand subgenomes of allopolyploids) and their divergencetimes were estimated using the multispecies coalescentas implemented in the *BEAST package of BEAST 2.4.2(Heled and Drummond 2010; Ogilvie and Drummond2017). In the species tree, the “species” correspondingto the allopolyploid subgenomes were forced to bemonophyletic with their parental taxon. The split ofthe allopolyploid subgenomes from their lower-ploidancestors was assumed to be (nearly) contemporaneous.This was achieved via the cross-bracing strategy ofShih and Matzke (2013). In contrast to cross-calibration,where the same prior distribution is applied to nodesof presumed same age (e.g., Marcussen et al. 2012),in cross-bracing a narrow, normally distributed prior(here, mean = 0 myr, standard deviation = 0.02 myr)is placed on the difference between the ages of the cross-braced nodes and the mean age of the cross-braced nodes(Fig. 1; for details including implementation in BEAST2, which requires manual editing of the XML file, seeSupplementary Appendix S2 available on Dryad). Toaccount for the magnitude of the ages of the cross-braced nodes, the standard deviation of this prioris recommended to be chosen to be roughly in theorder of 1% of the suspected age (Shih and Matzke2013). This standard deviation allows the MCMC tomove the ages of both nodes (a standard deviationof 0 would not), but ensures that the cross-bracednode ages will be tightly correlated. This prior canbe constructed to accommodate a single origin ofan allopolyploid (permitting a difference of zero) aswell as any desired length of time during which anallopolyploid may originate repeatedly, as is commonlyobserved in angiosperms (Soltis et al. 2010). Specifically,increasing the standard deviation of this cross-bracingprior allows the node height differences between thecross-braced nodes to behave more like non-cross-bracednodes (i.e., nodes without the cross-bracing prior; seeSupplementary Appendix S2 available on Dryad).
For the two allohexaploid species, M. pringlei and M.sericeum, which have the allotetraploid M. strigosum asone of their parents (Weiss-Schneeweiss et al. 2012), allthree scenarios of origin (a single origin vs. sequentialorigins of allohexaploids with M. pringlei splittingoff first or second, respectively; see SupplementaryAppendix S3 available on Dryad) were tested usingBayes Factors. Six separate runs of 108 generations foreach scenario (sampling every 100,000th generation)were performed. After removal of 10% burn-in, thelog files of each were combined and checked in Tracerfor convergence (ESS >200). Stepping stone samplingfor determining the best scenario of origin for theallohexaploid species was performed using 112 steps andalpha = 0.3. Each step was run until the ESS values for theparameters were above 200. Absolute ages were obtainedby putting a log-normal prior (mean = 5.5, standarddeviation 0.2 in real space) on the root node, which wasobtained from the age estimate of Melampodium sect.
Melampodium in the first part of the divergence timeanalysis. To avoid overparameterization, a coalescenttree prior with constant population size was used for thegene trees, while the Yule prior was used for the speciestree. Diffuse inverse-gamma prior distributions (alpha =2, beta = 2) were used on both the population mean andthe birth-rate parameters. The substitution model priorswere left as the default settings for all loci. The speciestree relaxed clock of Ogilvie and Drummond (2017) wasused with rates drawn from a log-normal distribution,with log-normal and exponential hyperpriors on itsmean (mean = 0.005, standard deviation = 0.35 in realspace, thus accommodating rate variation reported forITS sequences (Kay et al. 2006); see SupplementaryAppendix S1 available on Dryad for details) and itsstandard deviation (mean = 0.33), respectively.
Plant Materials for NGS and Cytogenetic AnalysesSeeds, silica-dried leaves, and vouchers of all six
species of Melampodium analyzed cytogenetically andfor repetitive DNA composition were collected fromnatural populations in Mexico in August 2013 (collectingpermit granted to J.L.V.). Herbarium specimens aredeposited in the herbaria of the University of Vienna(WU), Ohio State University (OSU), and the NationalAutonomous University of Mexico (MEXU). Collectionand accession numbers of each individual analyzedin this study are available in Supplementary Table S3available on Dryad. Seed germination and plantcultivation were performed in the Botanical Garden ofthe University of Vienna (HBV).
DNA Isolation and SequencingGenomic DNAs (gDNAs) were isolated using a
modified CTAB protocol (Doyle and Doyle 1987;Jang and Weiss-Schneeweiss 2015) and checkedfor quality and concentration using a Nanodropspectrophotometer (PeqLab, Erlangen, Germany) anda fluorospectrophotometer and Quant-iT PicogreendsDNA assay kit (PeqLab). DNA samples from two tothree individuals per species, ideally from differentpopulations, were pooled in equal proportions.Two independent libraries were prepared for eachpooled sample (species), and these were sequencedseparately. Fragmentation (600–800 nt in length) andlibrary preparation were performed at the CSF-NGSsequencing facility (Vienna Biocenter, Austria). Allsamples were shotgun sequenced on a single lane of anIllumina HiSeq2500 machine (Illumina, San Diego, CA,USA) using the 150 nt paired-end technology. GenomicDNAs of putative parental taxa (Weiss-Schneeweisset al. 2012) were also used for GISH.
Chromosome Spreads and GISHActively growing root meristems were harvested,
pretreated with 0.002 M solution of 8-hydroxyquinolinefor 2.5 h at room temperature and 2.5 h at 4◦C, fixedin a 3:1 ethanol and acetic acid mixture, and stored
Dow
nloaded from https://academ
ic.oup.com/sysbio/article-abstract/67/6/1010/4944071 by Australian N
ational University user on 26 February 2019

[15:56 3/10/2018 Sysbio-OP-SYSB180024.tex] Page: 1014 1010–1025
1014 SYSTEMATIC BIOLOGY VOL. 67
at −20◦C until use (Weiss-Schneeweiss et al. 2012).Chromosome preparations were made after enzymaticdigestion of fixed root meristems as described earlier(Weiss-Schneeweiss et al. 2012).
Genomic in situ hybridization was performed forthe allotetraploid M. strigosum (M147, Hidalgo, Mexico)and for the allohexaploids M. sericeum (M63, Oaxaca,Mexico) and M. pringlei (M2089, Oaxaca, Mexico), usinggDNAs of previously identified parental taxa (Weiss-Schneeweiss et al. 2012) as probes. Parental gDNAs ofdiploid Melampodium linearilobum, M. glabribracteatum,and M. americanum, as well as allotetraploid M.strigosum were sheared at 98◦C for 5 min and labeledusing either digoxigenin or the biotin nick translationkit (Roche, Vienna, Austria). The recently developedformamide-free hybridization and detection technique(Jang and Weiss-Schneeweiss 2015) was applied forGISH. Preparations were analyzed with an AxiolmagerM2 epifluorescent microscope (Carl Zeiss). Images werecaptured with a CCD camera and processed usingAxioVision 4.8 (Carl Zeiss) with only those functions thatapply to all pixels of the image equally.
Analysis of the Repetitive Fraction of the Genome usingRepeatExplorer
Read pairs containing Illumina adapters,indeterminate bases (N) at any position, or failingto have a quality score �10 for at least 95% of thebases in either sequence were removed prior toclustering analysis using a combination of custompython and R scripts and the program BBMAP 34.65(http://sourceforge.net/projects/bbmap/). Additionalread filtering was performed to remove reads derivedfrom plastid genomes and the PhiX spike-in DNA(Illumina). To that end, the sequence data sets wereblasted against databases constructed from severalAsteraceae plastid genomes (GenBank) and the PhiXgenome. Read pairs were removed if both sequencesproduced blast hits with >90% sequence identity andover 90% of the read length. Filtering out mitochondrialreads was not possible at this stage due to the lackof a reference mitochondrial genome; as this affectsall samples in the same way, no bias is expected, andclusters annotated as mitochondrial DNA were notcounted as repetitive DNA in subsequent analyses. Theremaining reads were trimmed to 140 nt by removingthe first 10 nt of each sequence and assigned a uniquethree-letter species identifier for use in comparativeclustering.
The reads were analyzed using the command lineimplementation of the RepeatExplorer pipeline (Nováket al. 2010, 2013). In brief, an all-to-all blast comparisonwas performed to generate a graph where the readsare connected by edges weighted by read similarity.The graph is then partitioned into highly interconnectedsections which represent different repeat families(Novák et al. 2010). The identity of these families wasdetermined by blasting the reads within a family tothe default database of the plant transposable element
domains included in the RepeatExplorer pipeline. Thereads were analyzed using the default settings forsequence similarity and alignment length thresholds(Novák et al. 2013).
Clustering analyses were first performed individuallyfor each species using the maximum number of readspossible for 100 GB of RAM (automatically estimatedby RepeatExplorer and highly dependent on the speciesanalyzed). Reads of two independently sequencedlibraries of each taxon were analyzed together to detectbiases due to library preparation. Clusters containing atleast 0.01% of the total reads analyzed were manuallyannotated using both graph and dot-plot structure,and blast hits to the transposable element domaindatabases available by default in RepeatExplorer (Nováket al. 2013). Clusters containing reads that generated acumulative number of blast hits to one or more protein-coding domains from the plant transposable elementdatabase >5% of the number of reads in the clusterwere annotated with the lineage found in the database.Paired-end reads were used to annotate clusters unableto be annotated by other means when the ratio of numberof pairs shared between clusters to the sum of the totalnumber of missing mates from each cluster was >0.10(Novák et al. 2013).
Proportions of solo-LTRs (long-terminal repeats) foreach species were estimated as presented in Macas et al.(2015). This approach uses a blast database built fromsequence tags at the junction of the 3′ end of the LTRsand the 5′ end of the untranslated region (UTR). The ratioof reads having blast hits to both regions to reads havinghits only to the 3′ LTR region was used as an estimatorof the ratio between solo-LTRs and full-length elements.
Following the individual species analyses, a numberof reads from each species, scaled down to represent0.1 × coverage of each genome (genome size data fromWeiss-Schneeweiss et al. 2012), were sampled from onlythe forward mates of read pairs used in each of theindividual analyses and combined into a single dataset for comparative analysis using RepeatExplorer. Thisallowed for a more representative sample of the genomefor a smaller number of reads. The resulting clusters inthe comparative analysis, representing the same repeattypes/families across the analyzed genomes, wereannotated automatically using the cluster annotationsfrom the individual species analyses.
To assess the similarity of the repetitive fraction ofthe genomes, a table was constructed with the numberof reads derived from each species for each dispersedrepeat-containing cluster obtained in the comparativeanalysis. Pairwise scatterplots were constructed forspecies on the same ploidy level, where the position ofa single point in the scatterplot represents the numberof reads in a cluster for the species on the x and yaxes. Additionally, in silico allopolyploids, representingthe expected number of reads given the additivityassumption, were constructed by summing the numberof reads for the parental taxa in each row. These insilico allopolyploids were plotted against the observednumber of reads for the actual allopolyploids in the
Dow
nloaded from https://academ
ic.oup.com/sysbio/article-abstract/67/6/1010/4944071 by Australian N
ational University user on 26 February 2019

[15:56 3/10/2018 Sysbio-OP-SYSB180024.tex] Page: 1015 1010–1025
2018 MCCANN ET AL.—AGE ESTIMATION AND REPEAT DYNAMICS IN POLYPLOIDS 1015
FIGURE 2. Phylogenetic relationships and repeat composition in analyzed Melampodium species. a) Dated phylogenetic network showingrelationships between allopolyploids and parental taxa for the single allopolyploid origin scenario. Divergence times are shown at the nodeswith 95% highest-posterior density intervals indicated by the gray bars; cross-braced nodes are marked by dots and triangles, respectively. b)Genomic proportions of repetitive elements for each species according to genome size and colored by repeat type (see legend). The species areabbreviated as follows: AME = M. americanum; GBB = M. glabribracteatum; LIN = M. linearilobum; PRG = M. pringlei; SER = M. sericeum; STR =M. strigosum. Ploidy level of each species is indicated as 2x, 4x, and 6x for diploids, tetraploids, and hexaploids, respectively.
same way as the pairwise scatterplots for the species onthe same ploidy level. One-to-one lines were plotted inall scatterplots, where the slope of the line representsthe ratio of the genome sizes between the species onthe x and y axes. Deviation from this line representsdifferences in genomic proportion of a given clusterof reads for the species shown. In the allopolyploids,the slope of this was taken to be one, representing theadditivity expectation of the allopolyploid subgenomeswith respect to their parental taxa.
RESULTS
Dating the Age of Origin of AllopolyploidsFor the Heliantheae data set, the alignment of the
ITS1-5.8S-ITS2 region was 735 nt long (including gaps)with 496 variable sites. The best partitioning schemeaccording to the BIC was one in which the whole regionwas in a single partition with the TN +� substitutionmodel with four discrete rate categories. Bayes Factors,estimated from the marginal likelihoods, indicatedstrong support for a relaxed clock model over the strictclock model (71.766). The mean tMRCA for Melampodium(including Acanthospermum and Lecocarpus) was 9.9 myr(95% HPD interval 7.5–12.7). The mean tMRCA age forMelampodium sect. Melampodium, comprising the focalgroup, was 5.1 myr (95% HPD interval 3.4–6.8 Ma;Supplementary Fig. S1 in Appendix S1 available onDryad).
For the Melampodium sect. Melampodium data set, theamount of missing sequences ranged from 1.3 % (matK)to 13.1 % (5S rDNA NTS spacer; Supplementary Table S4available on Dryad). Failure to recover sequencesfrom the homoeologous subgenome affected allallopolyploids, especially for plastid matK and nuclearITS sequences (Supplementary Table S4 available on
Dryad). The strict clock hypothesis was rejected forML trees obtained from all loci and correspondingsequence data sets (Supplementary Table S5 availableon Dryad). Therefore, only the relaxed clock resultsare presented here. Bayes factors were inconclusive(maximally 0.8) with respect to the three alternativescenarios (maximum clade credibility trees are shownin Supplementary Figs. S5–S7 in Appendix S3 availableon Dryad) for allopolyploid formation correspondingto a single origin for the allohexaploid or two possiblescenarios for independent origins (SupplementaryTable S6 available on Dryad).
Regardless of the scenario under consideration, themean age of the ancestor to allotetraploid M. strigosum(i.e., the ages of the cross-braced nodes indicated witha black dot in Fig. 2a) was always around 0.9 millionyears ago (Ma; Fig. 2a, Supplementary Table S6 availableon Dryad), ranging from 0.898 to 0.952 Ma across allscenarios. The 95% HPD estimates were 0.544–1.361 Ma,0.579–1.414 Ma, and 0.561–1.308 Ma for the single origin(Supplementary Table S6 available on Dryad), M. pringleifirst and M. sericeum first scenarios, respectively. Underthe shared parental origin scenario, the allohexaploidancestor of M. pringlei and M. sericeum (i.e., the ages ofthe cross-braced nodes indicated with a black trianglein Fig. 2a) had a mean age of 0.584 Ma (95% HPDinterval 0.349–0.860 Ma; Fig. 2a). For the M. pringleifirst and M. sericeum first scenarios, the mean ages ofM. pringlei were 0.639 (95% HPD interval 0.354–0.947 Ma)and 0.506 Ma (95% HPD 0.294–0.750 Ma), while the meanages of M. sericeum were 0.493 (95% HPD 0.257–0.749Ma) and 0.571 (95% HPD 0.344–0.815 Ma), respectively(Supplementary Table S6 available on Dryad).
The differences in the ages of the cross-braced nodesrepresenting the origin of the parental subgenomeswere small in accordance with the cross-bracing prior
Dow
nloaded from https://academ
ic.oup.com/sysbio/article-abstract/67/6/1010/4944071 by Australian N
ational University user on 26 February 2019

[15:56 3/10/2018 Sysbio-OP-SYSB180024.tex] Page: 1016 1010–1025
1016 SYSTEMATIC BIOLOGY VOL. 67
FIGURE 3. Phase contrast chromosomes (unstained), GISH and cut-out karyotype on mitotic chromosomes of the three allopolyploids. a)Allotetraploid Melampodium strigosum with labeled genomic DNA of diploid Melampodium glabribracteatum (green) and diploid Melampodiumamericanum (red). b, c) GISH of allohexaploid Melampodium sericeum (b) and of allohexaploid Melampodium pringlei (c) with labeled genomicDNA of diploid M. linearilobum (red) and allotetraploid M. strigosum (green). Scale bar, 5 �m.
imposed on these nodes. Individual BEAST runs neededupwards of half a billion generations to attain effectivesample sizes >200 for each parameter value. Extendingthe run length to 2 billion generations (sampling every100,000th generation) increased the ESS values, thelowest being those of the mean ages of the cross-bracednodes (ESS >975), but did not change the parameterestimates. Each of the runs of 600 million generationsrequired slightly <2 days (∼46 h) to complete on acomputer with a 3.6 GHz processor, NVIDIA graphicscard (GeForce GT 520) and the Beagle library installed(Ayres et al. 2012). To determine the effect of cross-bracing on the efficiency of MCMC exploration theprobability of acceptance of node change proposals,affecting node height, was assessed. If proposed for across-braced node, the new node height may conflictwith the cross-bracing prior, causing this node changeproposal to be rejected. This will result in an overallreduced probability of acceptance of node changeproposals. We expect that sampling efficiency will be
decreased proportional to the number of cross-bracednodes in the tree. Indeed, the probability of nodechange proposals across the whole tree throughout theMCMC of the cross-braced runs was around 7.1% forall scenarios compared to 18.71% in the run withoutcross-bracing.
Parental Genome Identification in AllopolyploidsGISH with labeled gDNAs of putative diploid
parental species, M. americanum and M. glabribracteatum,allowed unambiguous identification of the two parentalchromosome sets in the allotetraploid M. strigosum(2n=4x=40) with 20 chromosomes each fromM. glabribracteatum (green) and M. americanum (red;Fig. 3a). No intergenomic translocations were detectedamong the four tetraploid individuals analyzed (datanot shown).
Genomic DNAs of the putative parental species,allotetraploid M. strigosum and diploid M. linearilobum,
Dow
nloaded from https://academ
ic.oup.com/sysbio/article-abstract/67/6/1010/4944071 by Australian N
ational University user on 26 February 2019

[15:56 3/10/2018 Sysbio-OP-SYSB180024.tex] Page: 1017 1010–1025
2018 MCCANN ET AL.—AGE ESTIMATION AND REPEAT DYNAMICS IN POLYPLOIDS 1017
TABLE 1. Species and DNA sequence information (from NGS data) for individual and comparative RepeatExplorer analyses
Species ID Ploidy level Genome sizea Individual clustering Comparative clustering
Gbp/1C No. reads coverage No. reads (0.1 × )
Melampodium americanum AME 2x 1.11 7621416 0.96 × 897117Melampodium glabribracteatum GBB 2x 1.81 5555528 0.43 × 1465723Melampodium linearilobum LIN 2x 0.48 7957510 2.32 × 388729Melampodium strigosum STR 4x 2.79 5946104 0.30 × 737049Melampodium pringlei PRG 6x 3.21 5787404 0.25 × 721808Melampodium sericeum SER 6x 3.18 4568954 0.20 × 729206
aFrom Weiss-Schneeweiss et al. (2012).
TABLE 2. Estimates of the genome proportion (%) of various repeat types identified in the analyzed diploid and allopolyploid genomes ofMelampodium
Type Repeat family AME GBB LIN STR PRG SER
Retrotransposons — 39.96 58.92 37.95 43.49 40.74 39.97copia — 19.94 38.47 19.55 26.69 24.83 23.97
Maximus 18.41 35.46 17.94 25.23 23.41 22.48Other 1.52 3.01 1.61 1.46 1.42 1.49
gypsy — 20.03 20.46 18.40 16.80 15.91 16.00Athila 8.79 9.96 8.41 8.07 7.71 7.56
Chromo 7.36 7.23 6.01 5.49 4.97 5.40Ogre/Tat 3.88 3.26 3.98 3.24 3.22 3.04
Other/nonLTR — 0.69 0.81 0.73 0.52 0.59 0.50LINE 0.03 0.35 0.06 0.09 0.09 0.09SINE 0.14 0.04 0.14 0.11 0.12 0.13MITE 0.38 0.14 0.40 0.19 0.25 0.17PARA 0.14 0.27 0.13 0.14 0.13 0.10
DNA transposons — 3.99 2.05 7.25 4.81 3.24 4.86CACTA 3.23 1.73 6.39 4.34 2.64 4.38Other 0.76 0.32 0.86 0.47 0.60 0.48
Tandem repeats — 3.14 1.56 2.88 1.74 1.60 1.68rDNA 1.01 1.03 0.88 0.62 0.57 0.54
satDNA 2.12 0.53 1.99 1.11 1.03 1.14Unclassified — 10.15 5.55 8.33 8.02 10.17 9.36Total repeats — 57.94 68.89 57.13 58.58 56.34 56.37Low copy — 42.06 31.11 42.87 41.42 43.66 43.63
AME = M. americanum; GBB = M. glabribracteatum; LIN = M. linearilobum; STR = M. strigosum; PRG = M. pringlei; SER = M. sericeum.
were mapped to chromosomes of the two allohexaploids,M. pringlei and M. sericeum (both 2n=6x=60). In bothhexaploid karyotypes, 20 chromosomes were clearlylabeled with the genomic DNA of M. linearilobum (red)and 40 as M. strigosum (green; Fig. 3b,c). Two to fourreciprocal translocations were detected in two of fiveindividuals of M. pringlei, but no translocations werefound in M. sericeum (Fig. 3b,c). To test the tri-parentalorigin of allohexaploids and determine the extentof genome homogenization within the M. strigosumparental subgenome in the two allohexaploids, a tri-color GISH experiment was performed (SupplementaryAppendix S4 available on Dryad). The M. americanumand M. glabribracteatum subgenomes were labeled in thekaryotypes of both allohexaploid species, M. pringleiand M. sericeum, as efficiently as in their allotetraploidparent M. strigosum and the 20 chromosomes of M.linearilobum were weakly labeled with the genomic DNAof M. americanum (Supplementary Fig. S8 in AppendixS4 available on Dryad).
Quantification of Repeats in Individual Genomes
Whole genome shotgun sequencing using the Illuminatechnology generated between 8 and 12 million 150 ntpaired-end reads per sample (Table 1). Preprocessed datasets used for the final analyses were submitted to theNCBI Short Read Archive (SRA accession: SRP132795).
Clusters containing at least 0.01% of the totalreads, corresponding to the medium- to high-copynumber repeat families, were characterized in allspecies analyzed. Of these repeat families, 81–92%were successfully annotated. The largest proportions ofunclassified clusters were found in the two allohexaploidspecies and in the diploid M. americanum (Table 2and Fig. 2b). Repeats identified as retroelements werethe most abundant, ranging from 37% to 59% of thetotal genomic composition in the diploid genomesand constituting ∼40% of the allopolyploid genomes(Table 2). The majority of these repeats originatedfrom the Maximus/SIRE lineage of the Ty1-copia
Dow
nloaded from https://academ
ic.oup.com/sysbio/article-abstract/67/6/1010/4944071 by Australian N
ational University user on 26 February 2019
[15:56 3/10/2018 Sysbio-OP-SYSB180024.tex] Page: 1018 1010–1025
1018 SYSTEMATIC BIOLOGY VOL. 67
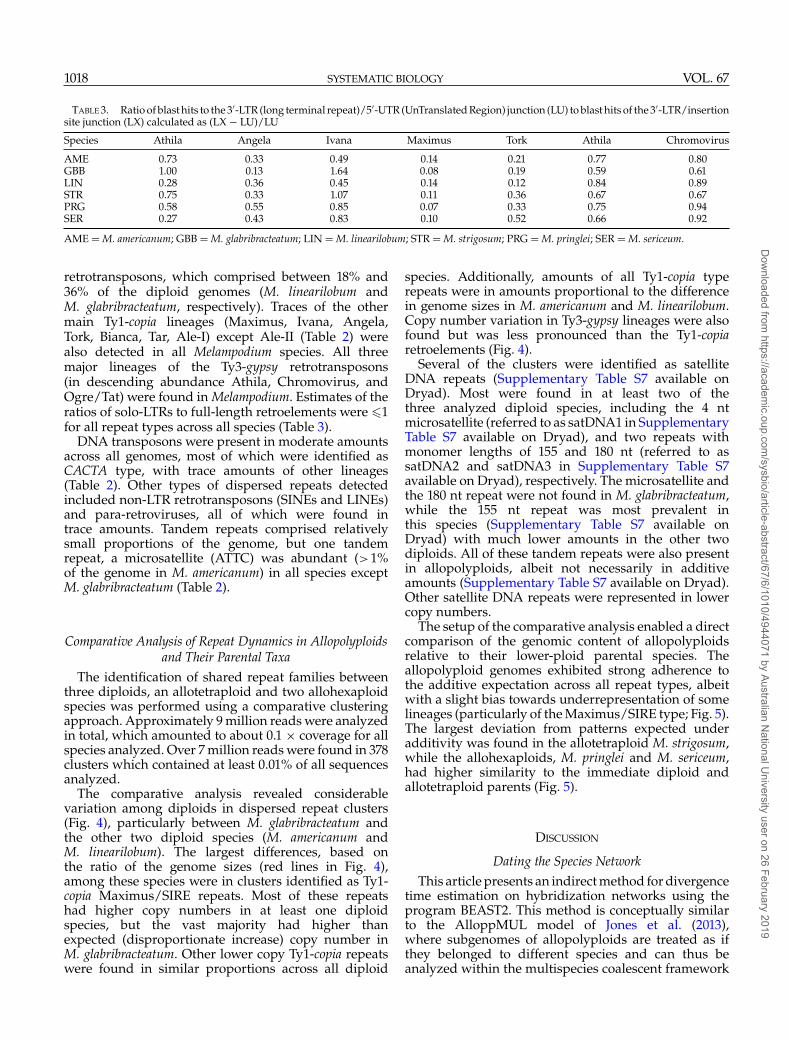
TABLE 3. Ratio of blast hits to the 3′-LTR (long terminal repeat)/5′-UTR (UnTranslated Region) junction (LU) to blast hits of the 3′-LTR/insertionsite junction (LX) calculated as (LX − LU)/LU
Species Athila Angela Ivana Maximus Tork Athila Chromovirus
AME 0.73 0.33 0.49 0.14 0.21 0.77 0.80GBB 1.00 0.13 1.64 0.08 0.19 0.59 0.61LIN 0.28 0.36 0.45 0.14 0.12 0.84 0.89STR 0.75 0.33 1.07 0.11 0.36 0.67 0.67PRG 0.58 0.55 0.85 0.07 0.33 0.75 0.94SER 0.27 0.43 0.83 0.10 0.52 0.66 0.92
AME = M. americanum; GBB = M. glabribracteatum; LIN = M. linearilobum; STR = M. strigosum; PRG = M. pringlei; SER = M. sericeum.
retrotransposons, which comprised between 18% and36% of the diploid genomes (M. linearilobum andM. glabribracteatum, respectively). Traces of the othermain Ty1-copia lineages (Maximus, Ivana, Angela,Tork, Bianca, Tar, Ale-I) except Ale-II (Table 2) werealso detected in all Melampodium species. All threemajor lineages of the Ty3-gypsy retrotransposons(in descending abundance Athila, Chromovirus, andOgre/Tat) were found in Melampodium. Estimates of theratios of solo-LTRs to full-length retroelements were �1for all repeat types across all species (Table 3).
DNA transposons were present in moderate amountsacross all genomes, most of which were identified asCACTA type, with trace amounts of other lineages(Table 2). Other types of dispersed repeats detectedincluded non-LTR retrotransposons (SINEs and LINEs)and para-retroviruses, all of which were found intrace amounts. Tandem repeats comprised relativelysmall proportions of the genome, but one tandemrepeat, a microsatellite (ATTC) was abundant (>1%of the genome in M. americanum) in all species exceptM. glabribracteatum (Table 2).
Comparative Analysis of Repeat Dynamics in Allopolyploidsand Their Parental Taxa
The identification of shared repeat families betweenthree diploids, an allotetraploid and two allohexaploidspecies was performed using a comparative clusteringapproach. Approximately 9 million reads were analyzedin total, which amounted to about 0.1 × coverage for allspecies analyzed. Over 7 million reads were found in 378clusters which contained at least 0.01% of all sequencesanalyzed.
The comparative analysis revealed considerablevariation among diploids in dispersed repeat clusters(Fig. 4), particularly between M. glabribracteatum andthe other two diploid species (M. americanum andM. linearilobum). The largest differences, based onthe ratio of the genome sizes (red lines in Fig. 4),among these species were in clusters identified as Ty1-copia Maximus/SIRE repeats. Most of these repeatshad higher copy numbers in at least one diploidspecies, but the vast majority had higher thanexpected (disproportionate increase) copy number inM. glabribracteatum. Other lower copy Ty1-copia repeatswere found in similar proportions across all diploid
species. Additionally, amounts of all Ty1-copia typerepeats were in amounts proportional to the differencein genome sizes in M. americanum and M. linearilobum.Copy number variation in Ty3-gypsy lineages were alsofound but was less pronounced than the Ty1-copiaretroelements (Fig. 4).
Several of the clusters were identified as satelliteDNA repeats (Supplementary Table S7 available onDryad). Most were found in at least two of thethree analyzed diploid species, including the 4 ntmicrosatellite (referred to as satDNA1 in SupplementaryTable S7 available on Dryad), and two repeats withmonomer lengths of 155 and 180 nt (referred to assatDNA2 and satDNA3 in Supplementary Table S7available on Dryad), respectively. The microsatellite andthe 180 nt repeat were not found in M. glabribracteatum,while the 155 nt repeat was most prevalent inthis species (Supplementary Table S7 available onDryad) with much lower amounts in the other twodiploids. All of these tandem repeats were also presentin allopolyploids, albeit not necessarily in additiveamounts (Supplementary Table S7 available on Dryad).Other satellite DNA repeats were represented in lowercopy numbers.
The setup of the comparative analysis enabled a directcomparison of the genomic content of allopolyploidsrelative to their lower-ploid parental species. Theallopolyploid genomes exhibited strong adherence tothe additive expectation across all repeat types, albeitwith a slight bias towards underrepresentation of somelineages (particularly of the Maximus/SIRE type; Fig. 5).The largest deviation from patterns expected underadditivity was found in the allotetraploid M. strigosum,while the allohexaploids, M. pringlei and M. sericeum,had higher similarity to the immediate diploid andallotetraploid parents (Fig. 5).
DISCUSSION
Dating the Species NetworkThis article presents an indirect method for divergence
time estimation on hybridization networks using theprogram BEAST2. This method is conceptually similarto the AlloppMUL model of Jones et al. (2013),where subgenomes of allopolyploids are treated as ifthey belonged to different species and can thus beanalyzed within the multispecies coalescent framework
Dow
nloaded from https://academ
ic.oup.com/sysbio/article-abstract/67/6/1010/4944071 by Australian N
ational University user on 26 February 2019

[15:56 3/10/2018 Sysbio-OP-SYSB180024.tex] Page: 1019 1010–1025
2018 MCCANN ET AL.—AGE ESTIMATION AND REPEAT DYNAMICS IN POLYPLOIDS 1019
FIGURE 4. Pairwise scatterplots of the number of reads from each diploid species in repeat clusters from the comparative analysis. Theslope of the red line is equal to the ratio of the genome sizes of the two species, thus, repeats (points) on the line are found in the same genomicproportions in species compared. a), c), e): Ty1-copia elements; b), d), f): Ty3-gypsy elements. The species are abbreviated as follows: AME = M.americanum; GBB = M. glabribracteatum; LIN = M. linearilobum.
(Heled and Drummond 2010). Using species trees forestimating allopolyploidization time has the advantageof taking lineage sorting and incomplete sampling ofgenes readily into account. This alleviates problemsarising from differences in gene coalescence times
(Doyle and Egan 2010; Kellogg 2016) and allows timecalibrations to be placed on the internal nodes of speciestrees rather than the gene trees themselves. A technicaladvantage is that it can make use of available datingtools (such as BEAST) without having to resort to ad
Dow
nloaded from https://academ
ic.oup.com/sysbio/article-abstract/67/6/1010/4944071 by Australian N
ational University user on 26 February 2019

[15:56 3/10/2018 Sysbio-OP-SYSB180024.tex] Page: 1020 1010–1025
1020 SYSTEMATIC BIOLOGY VOL. 67
FIGURE 5. Pairwise scatterplots of the number of reads from each polyploid species and the sum of the parental taxa in repeat clusters fromthe comparative analysis. The slope of the red line is one, reflecting the expectation of additivity in allopolyploid genomes (i.e., the number ofreads in allopolyploids should equal the sum of the number of reads in both parents). a, c, e): Ty1-copia elements; b, d, f): Ty3-gypsy elements.The species are abbreviated as follows: STR = M. strigosum; PRG = M. pringlei; SER = M. sericeum.
hoc approaches, such as the multistep approach used byMarcussen et al. (2015).
The cross-bracing method applied to species treesallows for variation in the coalescence times of genes
in the ancestral populations of the children of the cross-braced nodes, while keeping the nodes in the speciestrees (nearly) the same. Also, the increased informationon node split times (i.e., two nodes diverged at the same
Dow
nloaded from https://academ
ic.oup.com/sysbio/article-abstract/67/6/1010/4944071 by Australian N
ational University user on 26 February 2019

[15:56 3/10/2018 Sysbio-OP-SYSB180024.tex] Page: 1021 1010–1025
2018 MCCANN ET AL.—AGE ESTIMATION AND REPEAT DYNAMICS IN POLYPLOIDS 1021
time in different parts of the tree) may lead to betterdivergence time estimates across the whole tree (Shihand Matzke 2013). Additionally, alternative scenarios ofhybridization can be directly addressed using modeltesting approaches via Bayes Factors (Baele et al. 2012,2013). This applies to successive allopolyploidizationevents, as in our case, or to alternative scenarios forparentage of allopolyploids. However, this can becomeunwieldy, as the number of analyses that need to be runwill quickly increase with uncertainty in allopolyploidorigin.
Naturally, the cross-bracing method has somepotential caveats. Homoeologous sequences have tobe assigned to their respective parental genomes priorto the dating analysis, which will be problematic ifmeasures, such as distances among sequences (asdone here), give ambiguous results. These may bealleviated by integrating over assignment uncertaintyas part of the analysis, as is done for the AlloppMULand AlloppNET models (Jones et al. 2013, Jones2017). The current implementation in these models,however, assumes a pair of homoeologues per tetraploidindividual (no higher ploidy level implemented yet:Jones et al. 2013, Jones 2017), i.e., it is not explicitlytaking allelic variation into account [although thesecan be resolved in an ad hoc manner, as explained inthe manual to the AlloppNET model available fromhttp://indriid.com/workingnotes2013.html (accessed25 October 2017)].
Here, we assume that the allopolyploid parentage isknown, or can be tested or reduced to a reasonably smallnumber of candidates such that topology testing can beapplied. In case one or both of the parental species areextinct or have remained unsampled, using a speciesclosely related to the true parental species will likelylead to overestimation of the age of the allopolyploid(Doyle and Egan 2010). These issues are avoided by theAlloppNET model (Jones et al. 2013; Jones 2017), whichestimates the ages of so-called hybridization nodes (i.e.,the age of the allopolyploidization event), which aredistinct from the nodes pertaining to the split betweenthe subgenome of an allopolyploid and its parentalspecies (Fig. 2 in Jones 2017). This method, however,cannot be applied at higher allopolyploid levels (Joneset al. 2013; Jones 2017).
Like other methods, including the AlloppNET model(Jones et al. 2013; Jones 2017), the cross-bracing methoddoes not explicitly account for multiple origins, whichis very common in natural plant populations (Soltiset al. 2010). This is not a problem per se, as ancestralallelic variation in the allopolyploid subgenomes dueto multiple origin is readily accommodated by themultispecies coalescent. If multiple origins over anextended period of time are suspected or suggested byother evidence, these may be mimicked by allowing alarger difference between the cross-braced node ages.
A technical disadvantage of cross-bracing is theincreased length of the MCMC chain that needs to berun to obtain good effective sample sizes (ESS) for thecross-braced nodes (Shih and Matzke 2013). The narrow
prior calibrations on the difference between cross-bracednodes make it difficult for the operators on node heightsto make successful proposals during the MCMC, i.e., anynode change proposal on one of a group of cross-bracednodes is very likely to be rejected because of the narrowprior on the difference between the cross-braced nodes.The dates of cross-braced nodes can change, but they willbe sampled more slowly, because, in effect, one node datecan be changed, and is unlikely to move again until othercross-braced nodes “catch up.” Therefore, only nodedates which are not cross-braced (including the root)will sample quickly. This effect can be seen in BEASTruns with and without cross-bracing. In our analysis,about half of the nodes were cross-braced, and theconditional acceptance rate [Pr(acc |m) in the screen logof a BEAST run] was reduced from 0.1834 to 0.0717. Thisdemonstrates the reduced efficiency of parameter-spaceexploration during the MCMC. This can be amelioratedby increasing the number of generations of the MCMCby a factor proportional to the number of cross-bracednodes. It is expected that designing a new operator inBEAST that moves the date of cross-braced nodes atonce would result in dramatic improvements in proposalacceptance, and higher ESS/hour.
Allopolyploid Species Phylogeny of Melampodium sect.Melampodium
The age of the species phylogeny was calibrated usingthe divergence time estimates from the Heliantheaealliance. The inferred age of the whole genusMelampodium was determined to lie within the early tomiddle Miocene, while section Melampodium was placedin the late Pliocene to early Miocene (3.4–6.8 Ma).
The age estimates for the allopolyploids, ranging from0.23 to 1.41 Ma (Fig. 2), suggest that they all formedduring the Pleistocene. Allopolyploid formation withrespect to age, climatic change, and harsher climates hasbeen discussed in the literature (Brochmann et al. 2004).It has been proposed that allopolyploids may have aselective advantage in more variable habitats, perhapsimplying that they may have been more likely to formand persist during periods of change. Mexico has notbeen exempt from such climatic fluctuations, as has beenreviewed by Metcalfe et al. (2000).
In such periods of climatic fluctuations, successivelineage divergence may have been triggered in shortintervals, causing difficulties in inferring the precisetemporal order of species origin. This is evident forthe allohexaploids M. sericeum and M. pringlei, wheretopology testing of the different scenarios potentiallyleading to the formation of the two allohexaploids(shared origin, M. pringlei first, and M. sericeum first)provided no decisive support for any of the scenarios(Bayes Factors <1). Support for an independent originof the two species from recurrent hybridization ofparental taxa in line with commonly observed multipleorigins of allopolyploids (Soltis et al. 2010) is providedfrom divergent trajectories of rDNA sequence and loci
Dow
nloaded from https://academ
ic.oup.com/sysbio/article-abstract/67/6/1010/4944071 by Australian N
ational University user on 26 February 2019

[15:56 3/10/2018 Sysbio-OP-SYSB180024.tex] Page: 1022 1010–1025
1022 SYSTEMATIC BIOLOGY VOL. 67
evolution (Weiss-Schneeweiss et al. 2012). In contrastto rDNA evolution, however, the overall repetitiveDNA composition is remarkably similar in the twoallohexaploids. Evidently, more data, also at thepopulation level, will be necessary to elucidate thedetails of allopolyploid history of these species.
Repetitive DNA Evolution in Melampodium sect.Melampodium
Despite having the same number of chromosomes,the three diploid parental taxa of the Melampodiumallopolyploids have disparate genome sizes rangingfrom 0.49 (M. linearilobum) to 1.85 pg/1C (M.glabribracteatum). As the genome size of M. americanumis similar to the inferred ancestral genome size of thewhole section Melampodium (McCann 2017), larger andsmaller genome sizes in M. glabribracteatum and M.linearilobum, respectively, represent both major trendsproposed: the up- and downsizing of plant genomesduring evolution (Lysak et al. 2009). Differentialaccumulation and/or deletion of a small number ofhigh-abundance repeat families, as suggested for anumber of related diploid species (Ty3-gypsy Ogrein Vicia, Macas et al. 2015; Ty3-gypsy Gorge 3 inGossypium, Hawkins et al. 2009), is found in M.glabribracteatum, where preferential amplification of theMaximus lineage of the Ty1-copia retrotransposons ledto an increase of genome size (Table 2). In contrast,proportional changes in copy numbers across themajority of repeats, as suggested for the giant genomesof Fritillaria (Kelly et al. 2015), are in line with the similarrelative proportions of all major repeat types in M.americanum and M. linearilobum (Fig. 4). Melampodiumlinearilobum experienced genome downsizing sinceits divergence from other species in this series,0.5 to 1.5 Ma.
The genome sizes of M. strigosum (4x), M. pringlei(6x), and M. sericeum (6x) were additive (or nearlyso) in comparison to the extant relatives of theirparental taxa (Weiss-Schneeweiss et al. 2012), which issuggestive of little to no change in genome size followingpolyploidization. Such genome stasis is well-supportedin this study by the roughly commensurate genomicproportions of most repeat types in allohexaploids andthat expected from the parental genomes (Fig. 5). Thelack of significant restructuring of the repeatome is alsoreflected in the efficiency of GISH. The parental andgrandparental (in the allohexaploids) subgenomes inthe allopolyploids were unequivocally labeled (Fig. 3,Supplementary Fig. S8 in Appendix S4 availableon Dryad) indicating low levels of cross-subgenomerepetitive DNA homogenization (Lim et al. 2007; Renny-Byfield et al. 2013; Dodsworth et al. 2017).
General repetitive DNA and genome size additivity,however, does not have to imply a complete lack ofgenome turnover. Factors driving change followingpolyploidization and speciation events may haveacted on lower copy number sequences in theseallopolyploids, such as the identified tandem repeats.
Differential evolution of rDNA loci, includingcytological diploidization and sequence evolution havealready been demonstrated in both the allotetraploidand its allohexaploid derivatives (Weiss-Schneeweisset al. 2012). Accordingly, this study shows that satelliteDNA and rDNA repeats do show some deviation fromadditivity, which due to their generally lower copynumber may not be reflected in total genome sizechanges. However, it is known that such repeats exhibitrelatively fast rates of turnover including change inchromosomal localization, copy number and monomertype (Garrido-Ramos 2015). Therefore, a more fine-grained analysis of these tandem repeats, includinglocalization of satellite DNAs in the chromosomesusing fluorescent in situ hybridization (FISH), will benecessary to confidently test the presence and extent ofgenomic stasis in the Melampodium allopolyploids.
The relatively recent origin of the allopolyploidsanalyzed in this study (<1.4 Ma) likely played a role inthe absence of more significant changes in the repetitivefraction of their genomes. Although changes in thisallopolyploid complex were relatively low comparedto those found in other systems (Renny-Byfield et al.2012; Dodsworth et al. 2017), differences in the levelsof deviation from additivity with respect to ploidylevel were detectable. Relative to its allohexaploiddescendants, the allotetraploid M. strigosum displayedan overall trend of increased disparity from additivity(biased towards underrepresentation) across themajority of repeats. This was particularly the case inrepeats of Ty1-copia Maximus type, although, due tolow solo-LTR to full element ratios (Table 3), cannotbe explained by intrastrand recombination alone. Inthe established temporal framework used here, theobserved patterns can be explained by the necessity thatM. strigosum is older and thus, in the absence of the moretypically observed punctuated transposable elementevolution following polyploid formation (Parisod andSenerchia 2012; Bennetzen and Wang 2014), is likely toexhibit more change overall than its derivative species.
SUPPLEMENTARY MATERIAL
Data available from the Dryad Digital Repository:http://dx.doi.org/10.5061/dryad.dg8q0.
FUNDING
This work was supported by Austrian ScienceFund (FWF) [project P25131 to H.W.S.]; Czech ScienceFoundation [BP501/12/G090 to J.M.] and CzechAcademy of Sciences [RVO:60077344 to J.M.]; DiscoveryEarly Researcher Award DE150101773, awarded by theAustralian Research Council to N.J.M.
ACKNOWLEDGMENTS
The authors acknowledge financial support ofthe Austrian Science Fund (FWF), Czech Science
Dow
nloaded from https://academ
ic.oup.com/sysbio/article-abstract/67/6/1010/4944071 by Australian N
ational University user on 26 February 2019
[15:56 3/10/2018 Sysbio-OP-SYSB180024.tex] Page: 1023 1010–1025
2018 MCCANN ET AL.—AGE ESTIMATION AND REPEAT DYNAMICS IN POLYPLOIDS 1023
Foundation, and Czech Academy of Sciences. Access tocomputing and storage facilities owned by the ViennaScientific Cluster (Vienna, Austria) and Czech NationalGrid Infrastructure MetaCentrum provided under theprogram “Projects of Large Research, Development, andInnovations Infrastructures” (CESNET LM2015042), isgreatly appreciated. We thank Enrique Ortiz (UNAM,Mexico) for logistic and physical help during the fieldtripto collect plant material. We would also like to thankthe editors and anonymous reviewers for insightfulcomments on previous versions of this manuscript.
REFERENCES
Ayres D.L., Darling A., Zwickl D.J., Beerli P., Holder M.T., LewisP.O., Huelsenbeck J.P., Ronquist F., Swofford D.L., CummingsM.P., Rambaut A., Suchard M.A. 2012. BEAGLE: an applicationprogramming interface and high-performance computing libraryfor statistical phylogenetics. Syst. Biol. 61:170–173.
Baele G., Lemey P., Bedford T., Rambaut A., Suchard M.A.,Alekseyenko A.V. 2012. Improving the accuracy of demographicand molecular clock model comparison while accommodatingphylogenetic uncertainty. Mol. Biol. Evol. 29:2157–2167.
Baele G., Li W.L.S., Drummond A.J., Suchard M.A., Lemey P. 2013.Accurate model selection of relaxed molecular clocks in Bayesianphylogenetics. Mol. Biol. Evol. 30:239–243.
Barker M.S., Baute G.J., Liu S.L., 2012. Duplications and turnover inplant genomes. In: Wendel J., Greilhuber J., Dolezel J., Leitch I.J.Plant genome diversity, vol. 1. Vienna, Austria: Springer, p. 155–169.
Bennetzen J.L., Wang H. 2014. The contributions of transposableelements to the structure, function, and evolution of plant genomes.Annu. Rev. Plant Biol. 65:505–530.
Bertrand Y.J., Scheen A.-C., Marcussen T., Pfeil B.E., de Sousa F.,Oxelman B. 2015. Assignment of homoeologs to parental genomesin allopolyploids for species tree inference, with an example fromFumaria (Papaveraceae). Syst. Biol. 64:448–471.
Blöch C., Weiss-Schneeweiss H., Schneeweiss G.M., Barfuss M.H.,Rebernig C.A., Villaseñor J.L., Stuessy T.F. 2009. Molecularphylogenetic analyses of nuclear and plastid DNA sequencessupport dysploid and polyploid chromosome number changesand reticulate evolution in the diversification of Melampodium(Millerieae, Asteraceae). Mol. Phylogenet. Evol. 53:220–233.
Brochmann C., Brysting A.K., Alsos I.G., Borgen L., Grundt H.H.,Scheen A.C. Elven R. 2004. Polyploidy in arctic plants. Biol. J.Linnean Soc. 82:521–536.
Chester M., Gallagher J.P., Symonds V.V., da Silva A.V.C., MavrodievE.V., Leitch A.R., Soltis P.S., Soltis D.E. 2012. Extensive chromosomalvariation in a recently formed natural allopolyploid species,Tragopogon miscellus (Asteraceae). Proc. Natl. Acad. Sci. USA109:1176–1181.
Chester M., Riley R., Soltis P., Soltis D. 2015. Patterns of chromosomalvariation in natural populations of the neoallotetraploid Tragopogonmirus (Asteraceae). Heredity 114:309–317.
Comai L. 2005. The advantages and disadvantages of being polyploid.Nat. Rev. Genet. 6:836–846.
Dodsworth S., Leitch A.R., Leitch I.J. 2015. Genome size diversity inangiosperms and its influence on gene space. Curr. Opin. Genet.Dev. 35:73–78.
Dodsworth S., Jang T.S., Struebig M., Chase M.W., Weiss-SchneeweissH., Leitch A.R. 2017. Genome-wide repeat dynamics reflectphylogenetic distance in closely related allotetraploid Nicotiana(Solanaceae). Plant Syst. Evol. 303:1013–1020.
Doyle J., Doyle J. 1987. A rapid DNA isolation procedure for smallquantities of fresh leaf tissue. Phytochem. Bull. 19:11–15.
Doyle J.J., Egan A.N. 2010. Dating the origins of polyploidy events.New Phytol. 186:73–85.
Drummond A.J., Ho S.Y., Phillips M.J., Rambaut A. 2006. Relaxedphylogenetics and dating with confidence. PLoS Biol. 4:699.
Edgar R.C. 2004. MUSCLE: multiple sequence alignment with highaccuracy and high throughput. Nucleic Acids Res. 32:1792–1797.
Felsenstein J. 1981. Evolutionary trees from DNA sequences: amaximum likelihood approach. J. Mol. Evol. 17:368–376.
Garrido-Ramos M.A. 2015. Satellite DNA in plants: more than justrubbish. Cytogenet. Genome Res. 146:153–170.
Grant V. 1981. Plant speciation. New York, USA: Columbia UniversityPress.
Hawkins J.S., Proulx S.R., Rapp R.A., Wendel, J.F. 2009. Rapid DNA lossas a counterbalance to genome expansion through retrotransposonproliferation in plants. Proc. Natl. Acad. Sci. USA 106:17811–17816.
Heled J., Drummond A.J. 2010. Bayesian inference of species trees frommultilocus data. Mol. Biol. Evol. 27:570–580.
Hollister J.D. 2015. Polyploidy: adaptation to the genomic environment.New Phytol. 205:1034–1039.
Huang C.-H., Zhang C., Liu M., Hu Y., Gao T., Qi J., Ma H. 2016. Multiplepolyploidization events across Asteraceae with two nested events inthe early history revealed by nuclear phylogenomics. Mol. Biol. Evol.33:2820–2835.
Jang T.-S., Weiss-Schneeweiss H. 2015. Formamide-free genomic in situhybridization allows unambiguous discrimination of highly similarparental genomes in diploid hybrids and allopolyploids. Cytogenet.Genome Res. 146:325–331.
Jiao Y.N., Wickett N.J., Ayyampalayam S., Chanderbali A.S., LandherrL., Ralph P.E., Tomsho P.E., Hu Y., Liang H.Y., Soltis P.S., Soltis D.E.,Clifton S.W., Schlarbaum S.E., Schuster S.C., Ma H., Leebens-MackJ., dePamphilis C.W. 2011. Ancestral polyploidy in seed plants andangiosperms. Nature 473:97–100.
Jones G. 2017. Bayesian phylogenetic analysis for diploid andallotetraploid species networks. bioRxiv, doi: 10.1101/129361.
Jones G., Sagitov S., Oxelman B. 2013. Statistical inference ofallopolyploid species networks in the presence of incompletelineage sorting. Syst. Biol. 62:467–478.
Kay K.M., Whittall J.B., Hodges S.A. 2006. A survey of nuclearribosomal internal transcribed spacer substitution rates acrossangiosperms: an approximate molecular clock with life historyeffects. BMC Evol. Biol. 6:36.
Kellogg E.A. 2016. Has the connection between polyploidy anddiversification actually been tested? Curr. Opin. Plant Biol.30:25–32.
Kelly L.J., Renny-Byfield S., Pellicer J., Macas J., Novák P., NeumannP., Lysak M.A., Day P.D., Berger M., Fay M.F., Nichols R.A., LeitchA.R., Leitch I.J. 2015. Analysis of the giant genomes of Fritillaria(Liliaceae) indicates that a lack of DNA removal characterizesextreme expansions in genome size. New Phytol. 208:596–607.
Kim K.-J., Choi K.-S., Jansen R.K. 2005. Two chloroplast DNAinversions originated simultaneously during the early evolution ofthe sunflower family (Asteraceae). Mol. Biol. Evol. 22:1783–1792.
Koh J., Soltis P.S., Soltis D.E. 2010. Homoeolog loss and expressionchanges in natural populations of the recently and repeatedlyformed allotetraploid Tragopogon mirus (Asteraceae). BMCGenomics 11:97.
Kovarík A., Dadejova M., Lim Y.K., Chase M.W., Clarkson J.J., KnappS., Leitch A.R. 2008. Evolution of rDNA in Nicotiana allopolyploids:a potential link between rDNA homogenization and epigenetics.Ann. Bot. 101:815–823.
Kumar S., Stecher G., Tamura K. 2016. MEGA7: Molecular EvolutionaryGenetics Analysis version 7.0 for bigger datasets. Mol. Biol. Evol.33:1870–1874.
Leitch I., Bennett M. 2004. Genome downsizing in polyploid plants.Biol. J. Linnean Soc. 82:651–663.
Lim K.Y., Kovarík A., Matyasek R., Chase M.W., Clarkson J.J.,Grandbastien M., Leitch A.R. 2007. Sequence of events leading tonear-complete genome turnover in allopolyploid Nicotiana withinfive million years. New Phytol. 175:756–763.
Lysak M.A., Koch M.A., Beaulieu J.M., Meister A., Leitch I.J. 2009. Thedynamic ups and downs of genome size evolution in Brassicaceae.Mol. Biol. Evol. 26:85-98.
Ma X.-F., Gustafson J. 2005. Genome evolution of allopolyploids:a process of cytological and genetic diploidization. Cytogenet.Genome Res. 109:236–249.
Macas J., Meszaros T., Nouzova M. 2002. PlantSat: a specializeddatabase for plant satellite repeats. Bioinformatics 18:28–35.
Dow
nloaded from https://academ
ic.oup.com/sysbio/article-abstract/67/6/1010/4944071 by Australian N
ational University user on 26 February 2019

[15:56 3/10/2018 Sysbio-OP-SYSB180024.tex] Page: 1024 1010–1025
1024 SYSTEMATIC BIOLOGY VOL. 67
Macas J., Novák P., Pellicer J., Cížková J., Koblížková A., NeumannP., Fuková I., Doležel J., Kelly L.J., Leitch I.J. 2015. In depthcharacterization of repetitive DNA in 23 plant genomes revealssources of genome size variation in the legume tribe Fabeae. PLoSOne 10:e0143424.
Madlung A. 2013. Polyploidy and its effect on evolutionary success:old questions revisited with new tools. Heredity 110:99–104.
Mandáková T., Kovarík A., Zozomová-Lihová J., Shimizu-Inatsugi R.,Shimizu K.K., Mummenhoff K., Marhold K., Lysak M.A. 2013. Themore the merrier: recent hybridization and polyploidy in Cardamine.Plant Cell 25:3280–3295.
Mandáková T., Marhold K., Lysak M.A. 2014. The widespread cruciferspecies Cardamine flexuosa is an allotetraploid with a conservedsubgenomic structure. New Phytol. 201:982–992.
Marcussen T., Jakobsen K.S., Danihelka J., Ballard H.E., Blaxland K.,Brysting A.K., Oxelman B. 2012. Inferring species networks fromgene trees in high-polyploid North American and Hawaiian violets(Viola, Violaceae). Syst. Biol. 61:107–126.
Marcussen T., Heier L., Brysting A.K., Oxelman B., Jakobsen K.S. 2015.From gene trees to a dated allopolyploid network: insights from theangiosperm genus Viola (Violaceae). Syst. Biol. 64:84–101.
Mayrose I., Zhan S.H., Rothfels C.J., Magnuson-Ford K., Barker M.S.,Rieseberg L.H., Otto S.P. 2011. Recently formed polyploid plantsdiversify at lower rates. Science 333:1257–1257.
McCann J., Schneeweiss G.M., Stuessy T.F., Villaseñor J.L., Weiss-Schneeweiss H. 2016. The impact of reconstruction methods,phylogenetic uncertainty and branch lengths on inference ofchromosome number evolution in American daisies (Melampodium,Asteraceae). PLoS One 11:e0162299.
McCann J. 2017. Genome evolution of diploids and polyploids in genusMelampodium (Asteraceae) [Ph.D. Thesis]. University of Vienna. p.39–66.
Metcalfe S.E., O’Hara S.L., Caballero M., Davies S.J. 2000. Records ofLate Pleistocene–Holocene climatic change in Mexico—a review.Quat. Sci. Rev. 19:699–721.
Nguyen L.-T., Schmidt H.A., von Haeseler A., Minh B.Q. 2015. IQ-Tree:A fast and effective stochastic algorithm for estimating maximum-likelihood phylogenies. Mol. Biol. Evol. 32:268–274.
Novák P., Neumann P., Macas J. 2010. Graph-based clusteringand characterization of repetitive sequences in next-generationsequencing data. BMC Bioinformatics 11:378.
Novák P., Neumann P., Pech J., Steinhaisl J., Macas J. 2013.RepeatExplorer: a galaxy-based web server for genome-widecharacterization of eukaryotic repetitive elements from next-generation sequence reads. Bioinformatics 29:792–793.
Ogilvie H.A., Drummond A.J. 2017. StarBEAST2 brings faster speciestree inference and accurate estimates of substitution rates. Mol. Biol.Evol. 34:2101–2114.
Parisod C., Senerchia N. 2012. Responses of transposable elementsto polyploidy. In: Grandbastien M.A., Casacuberta J.M.,editors. Plant transposable elements. Vienna, Austria: Springer.pp. 147–168.
Renny-Byfield S., Chester M., Kovarík A., Le Comber S.C.,Grandbastien M.-A., Deloger M., Nichols R., Macas J., NovákP., Chase M.W., Leitch A.W. 2011. Next generation sequencingreveals genome downsizing in allotetraploid Nicotiana tabacum,predominantly through the elimination of paternally derivedrepetitive DNAs. Mol. Biol. Evol. 28:2843–2854.
Renny-Byfield S., Chester M., Nichols R.A., Macas J., Novák P., LeitchA.R. 2012. Independent, rapid and targeted loss of highly repetitiveDNA in natural and synthetic allopolyploids of Nicotiana tabacum.PLoS One 7:e36963.
Renny-Byfield S., Kovarík A., Kelly L.J., Macas J., Novák P., ChaseM.W., Nichols R.A., Pancholi M.R., Grandbastien M.-A., Leitch A.R.2013. Diploidization and genome size change in allopolyploidsis associated with differential dynamics of low-and high-copysequences. Plant J. 74:829–839.
Rieseberg L.H., Willis J.H. 2007. Plant speciation. Science 317:910–914.Shih P.M., Matzke N.J. 2013. Primary endosymbiosis events date to
the later Proterozoic with cross-calibrated phylogenetic dating ofduplicated ATPase proteins. Proc. Natl. Acad. Sci. USA 110:12355–12360.
Soltis D.E., Buggs R.J., Doyle J.J., Soltis P.S. 2010. What we still don’tknow about polyploidy. Taxon 59:1387–1403.
Stuessy T.F., Blöch C., Villaseñor J.L., Rebernig C.A., Weiss-Schneeweiss H. 2011. Phylogenetic analyses of DNA sequenceswith chromosomal and morphological data confirm and refinesectional and series classification within Melampodium (Asteraceae,Millerieae). Taxon 60:436–449.
Than C., Ruths D., Nakhleh L. 2008. PhyloNet: a software package foranalyzing and reconstructing reticulate evolutionary relationships.BMC Bioinformatics 9:1.
Torices R. 2010. Adding time-calibrated branch lengths to theAsteraceae supertree. J. Syst. Evol. 48:271–278.
Weiss-Schneeweiss H., Blöch C., Turner B., Villaseñor J.L., Stuessy T.F.,Schneeweiss G.M. 2012. The promiscuous and the chaste: frequentallopolyploid speciation and its genomic consequences in Americandaisies (Melampodium sect. Melampodium; Asteraceae). Evolution66:211–228.
Weiss-Schneeweiss H., Emadzade K., Jang T.-S., Schneeweiss G. 2013.Evolutionary consequences, constraints and potential of polyploidyin plants. Cytogenet. Genome Res. 140:137–150.
Wendel J.F. 2015. The wondrous cycles of polyploidy in plants. Am. J.Bot. 102:1753–1756.
Wolfe K.H. 2001. Yesterday’s polyploids and the mystery ofdiploidization. Nat. Rev. Genet. 2:333–341.
Wood T.E., Takebayashi N., Barker M.S., Mayrose I., Greenspoon P.B.,Rieseberg L.H. 2009. The frequency of polyploid speciation invascular plants. Proc. Natl. Acad. Sci. USA 106:13875-13879.
Zozomová-Lihová J., Mandáková T., Kovaríková A., Mühlhausen A.,Mummenhoff K., Lysak M.A., Kovarík A. 2014. When fathersare instant losers: homogenization of rDNA loci in recentlyformed Cardamine schulzii trigenomic allopolyploid. New Phytol.203:1096–1108.
Dow
nloaded from https://academ
ic.oup.com/sysbio/article-abstract/67/6/1010/4944071 by Australian N
ational University user on 26 February 2019