david crowley dept of environmental sciences, university ... · david crowley . dept of...
TRANSCRIPT
Irrigation and Salinity Management of AvocadoDavid Crowley
Dept of Environmental Sciences, University of California, Riverside


New Technologies for Avocado Production
Improved rootstocks for salinity tolerance
Soil inoculation with PGPR (plant growth promoting rhizobacteria)Control of phytophthora root rotProduction of plant growth hormonesSuppression of stress ethylene
Improved water use efficiencyImproved salinity tolerance
Online Decision Support ToolsIrrigation and Fertilizer ManagementNeural network based disease and yield forecasting models
Use of charcoal (biochar) amendmentsImproved CEC, pH, bulk density, soil structureImproved water holding, aeration, root growthIncreased microbial activity
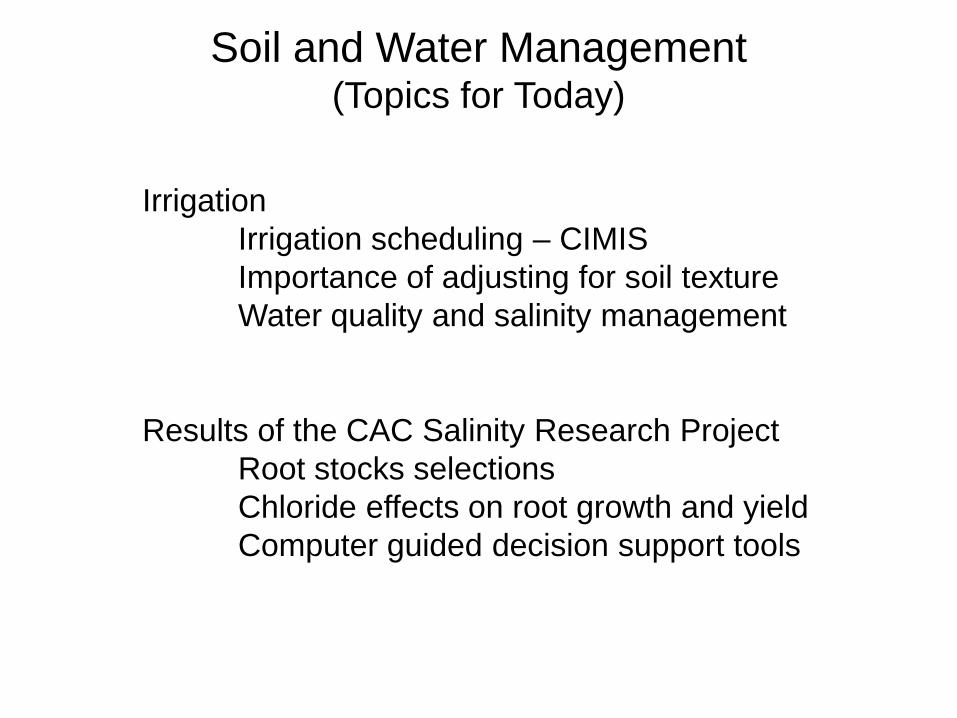
Soil and Water Management(Topics for Today)
Irrigation Irrigation scheduling – CIMISImportance of adjusting for soil textureWater quality and salinity management
Results of the CAC Salinity Research ProjectRoot stocks selectionsChloride effects on root growth and yieldComputer guided decision support tools
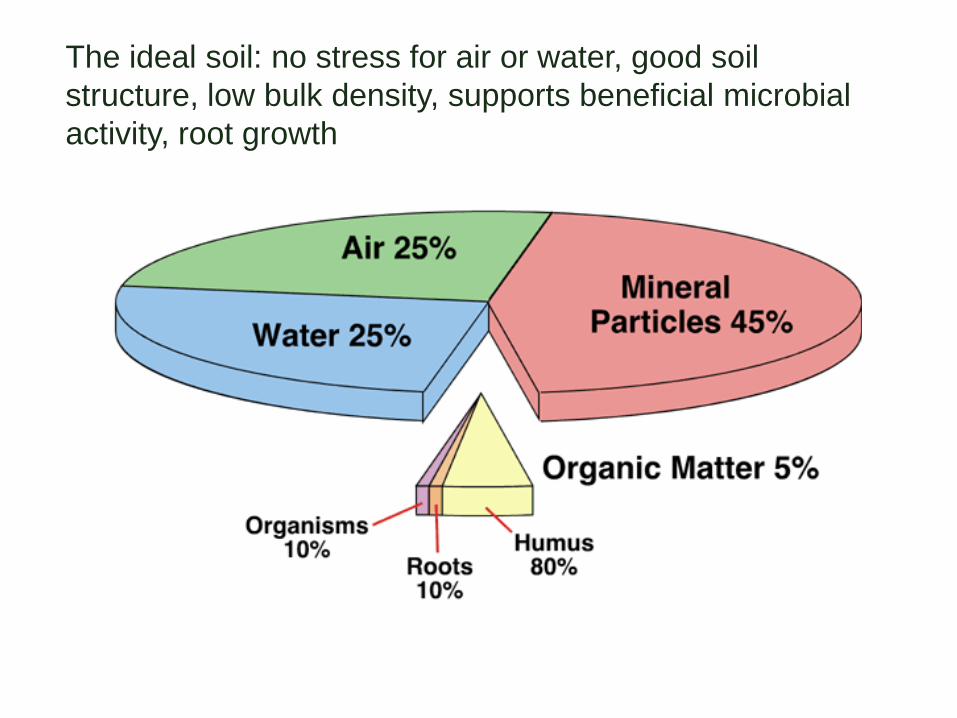
The ideal soil: no stress for air or water, good soil structure, low bulk density, supports beneficial microbial activity, root growth
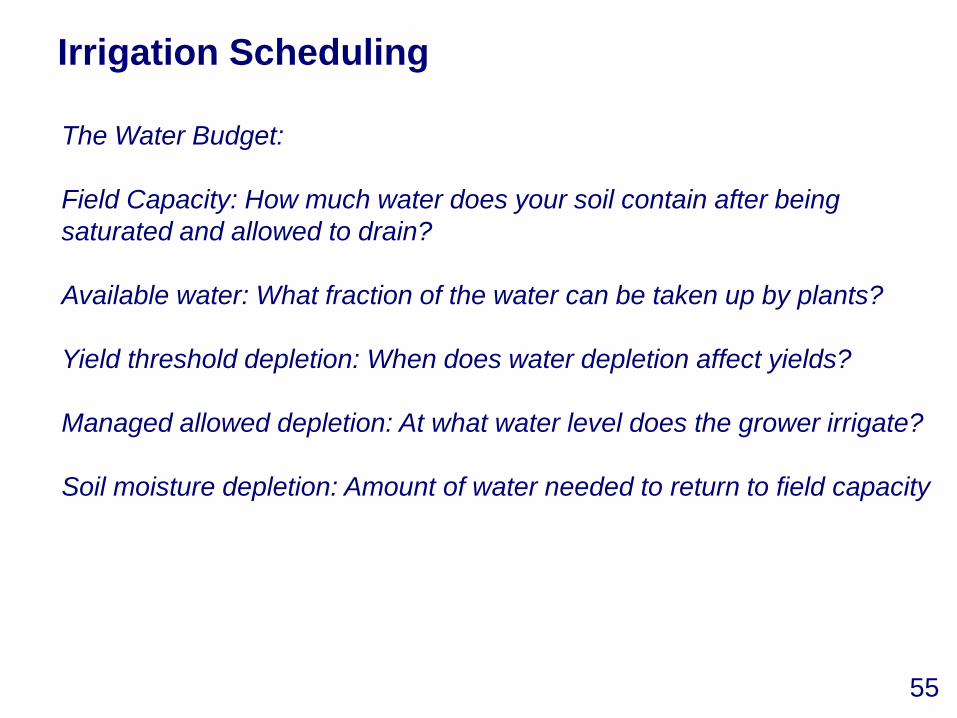
Irrigation Scheduling
The Water Budget:
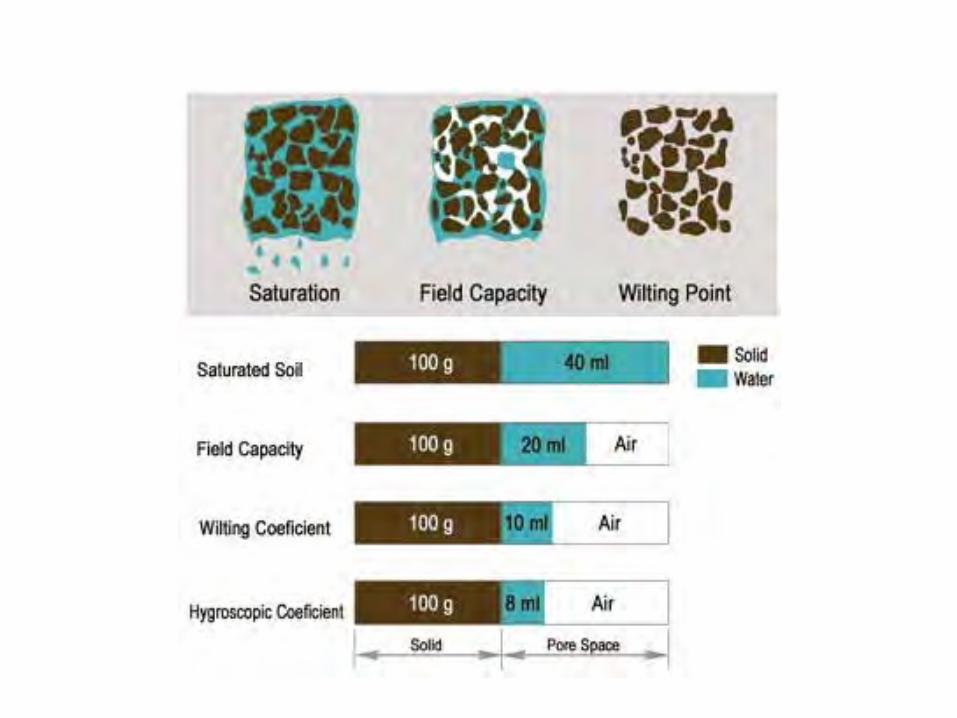
Field Capacity: How much water does your soil contain after being saturated and allowed to drain?
Available water: What fraction of the water can be taken up by plants?
Yield threshold depletion: When does water depletion affect yields?
Managed allowed depletion: At what water level does the grower irrigate?
Soil moisture depletion: Amount of water needed to return to field capacity
55
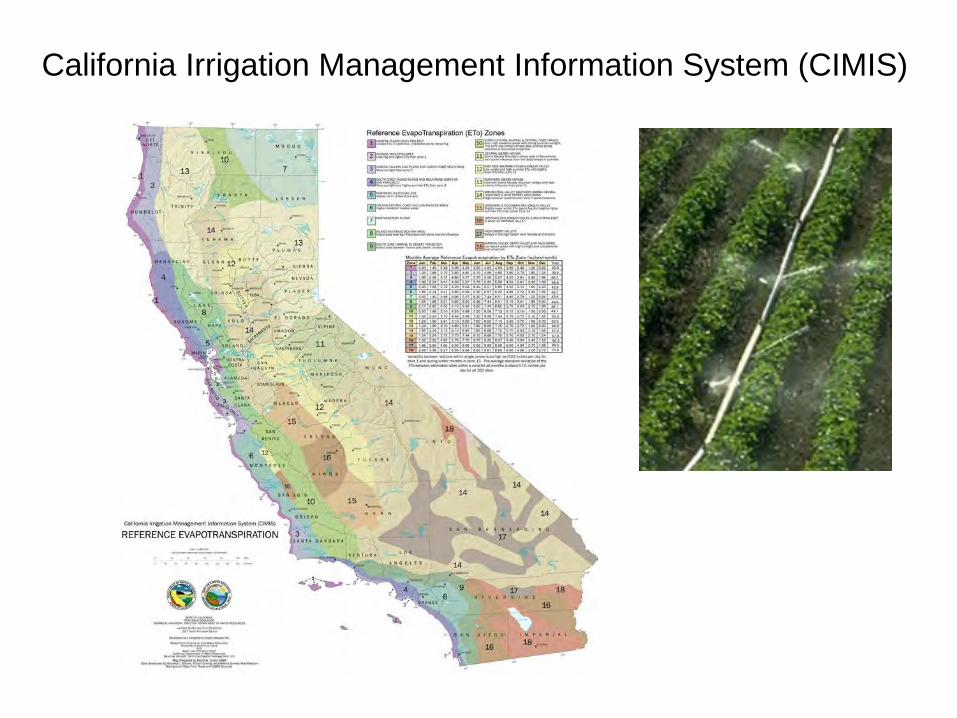
California Irrigation Management Information System (CIMIS)
54

ET of California Avocado Soils
54
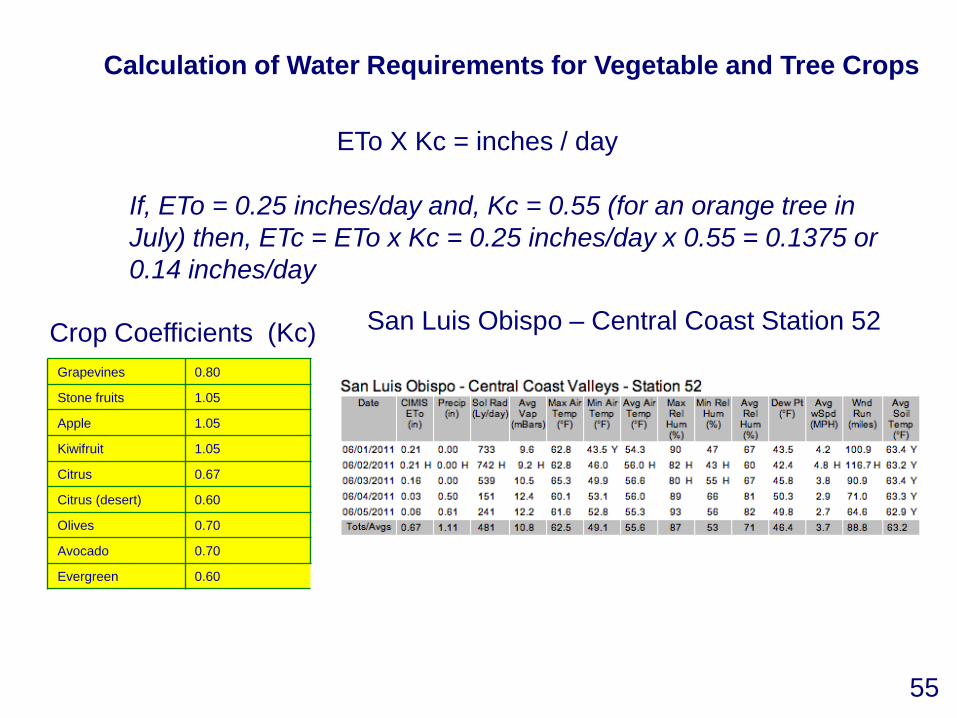
Grapevines 0.80
Stone fruits 1.05
Apple 1.05
Kiwifruit 1.05
Citrus 0.67
Citrus (desert) 0.60
Olives 0.70
Avocado 0.70
Evergreen 0.60
Crop Coefficients (Kc)
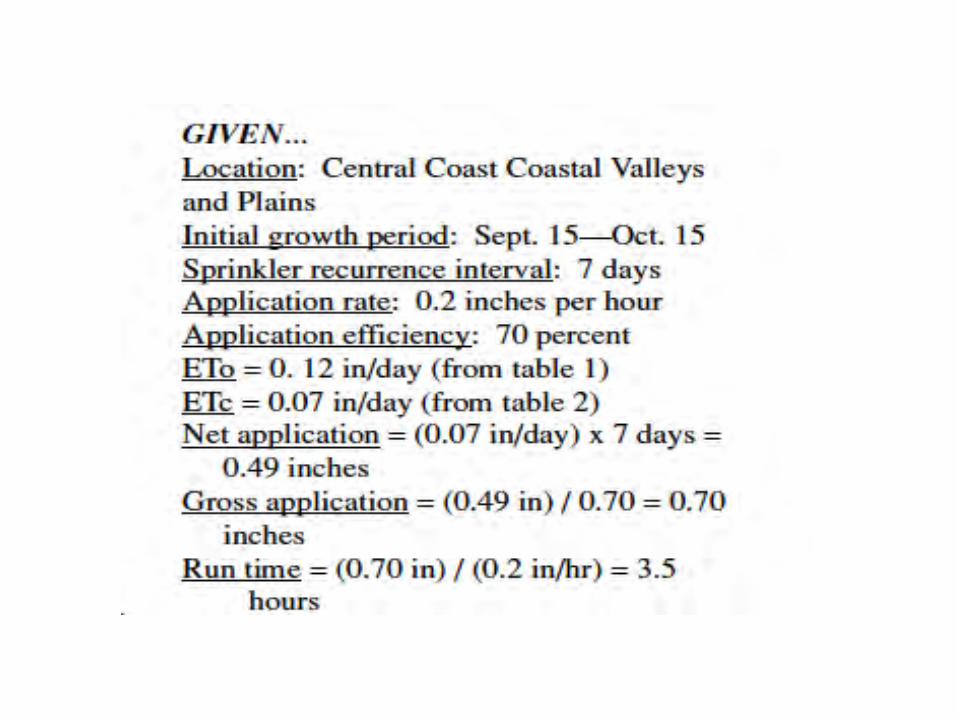
Calculation of Water Requirements for Vegetable and Tree Crops
If, ETo = 0.25 inches/day and, Kc = 0.55 (for an orange tree in July) then, ETc = ETo x Kc = 0.25 inches/day x 0.55 = 0.1375 or 0.14 inches/day
ETo X Kc = inches / day
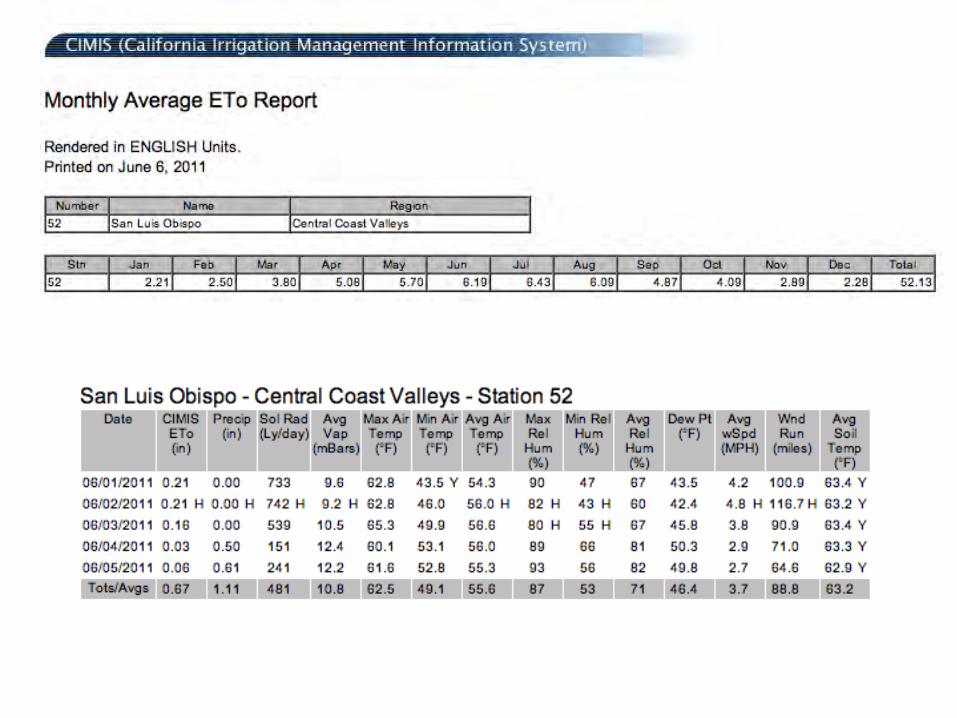
San Luis Obispo – Central Coast Station 52
55

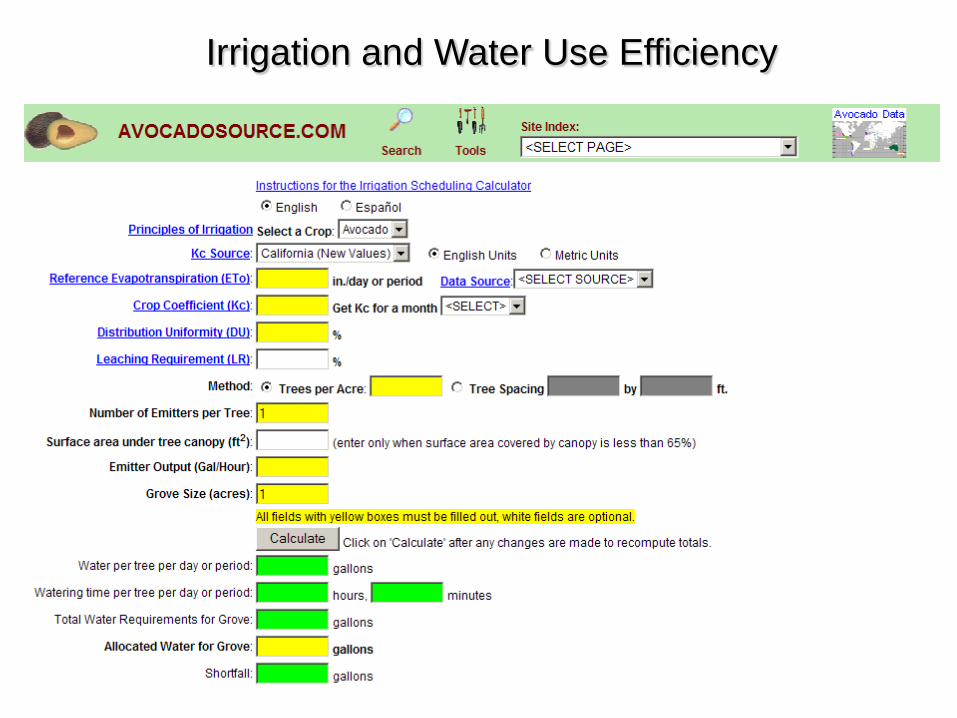
Irrigation and Water Use Efficiency

The Role of Soil Texture (Sand, Silt, Clay)
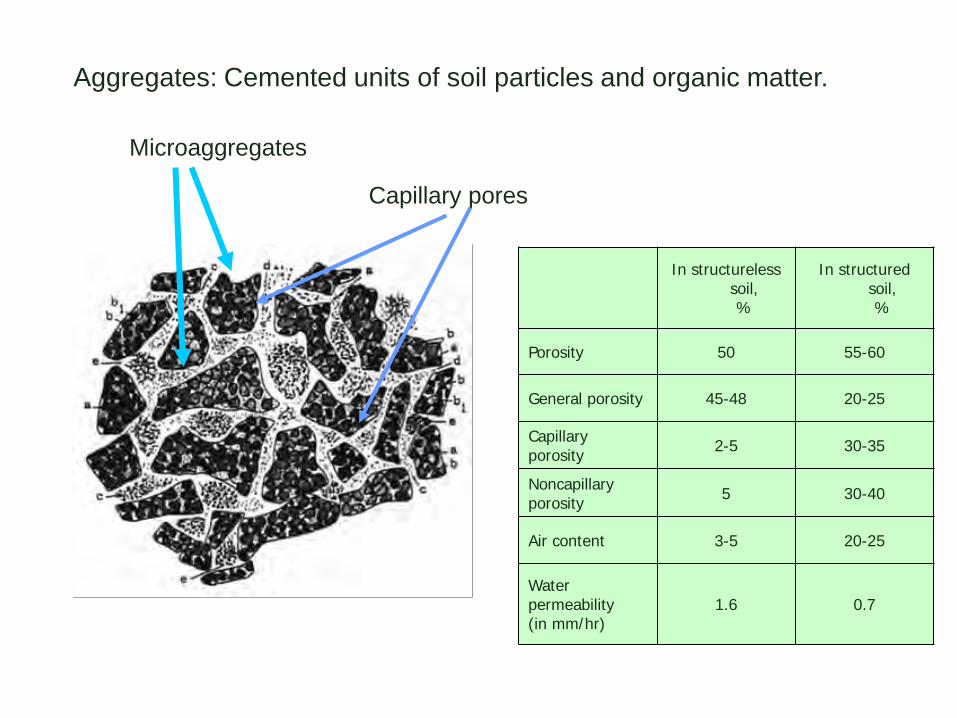
Aggregates: Cemented units of soil particles and organic matter.
In structureless soil,%
In structured soil,%
Porosity 50 55-60
General porosity 45-48 20-25
Capillary porosity 2-5 30-35
Noncapillary porosity 5 30-40
Air content 3-5 20-25
Water permeability(in mm/hr)
1.6 0.7
Microaggregates
Capillary pores
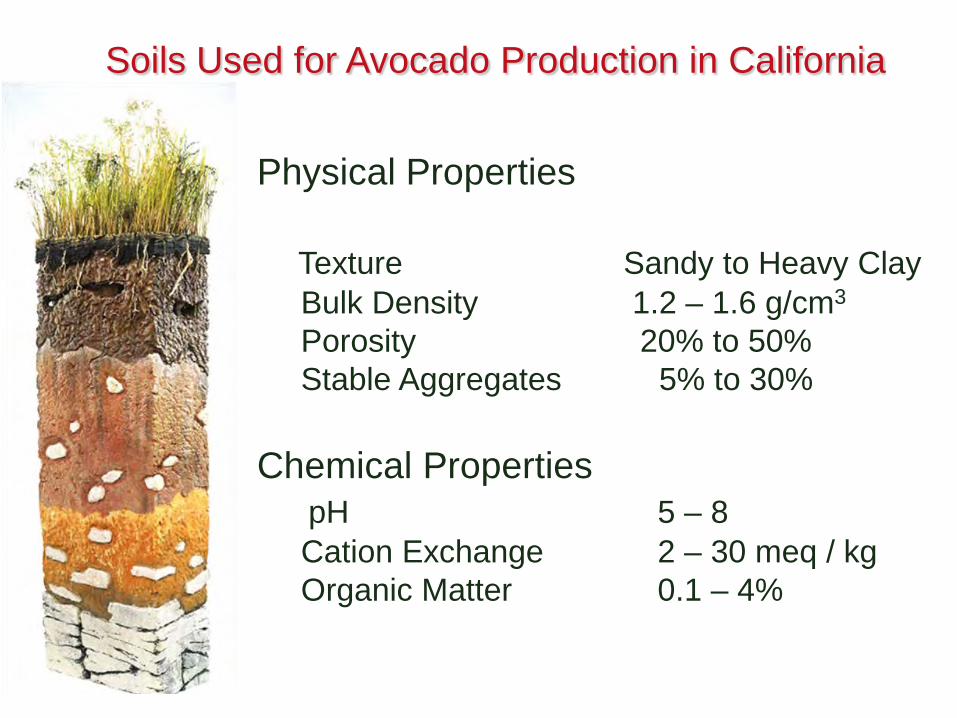
Soils Used for Avocado Production in California
Physical Properties
Texture Sandy to Heavy ClayBulk Density 1.2 – 1.6 g/cm3
Porosity 20% to 50%Stable Aggregates 5% to 30%
Chemical PropertiespH 5 – 8Cation Exchange 2 – 30 meq / kgOrganic Matter 0.1 – 4%


Finding your soil: USDA Web Soil Survey
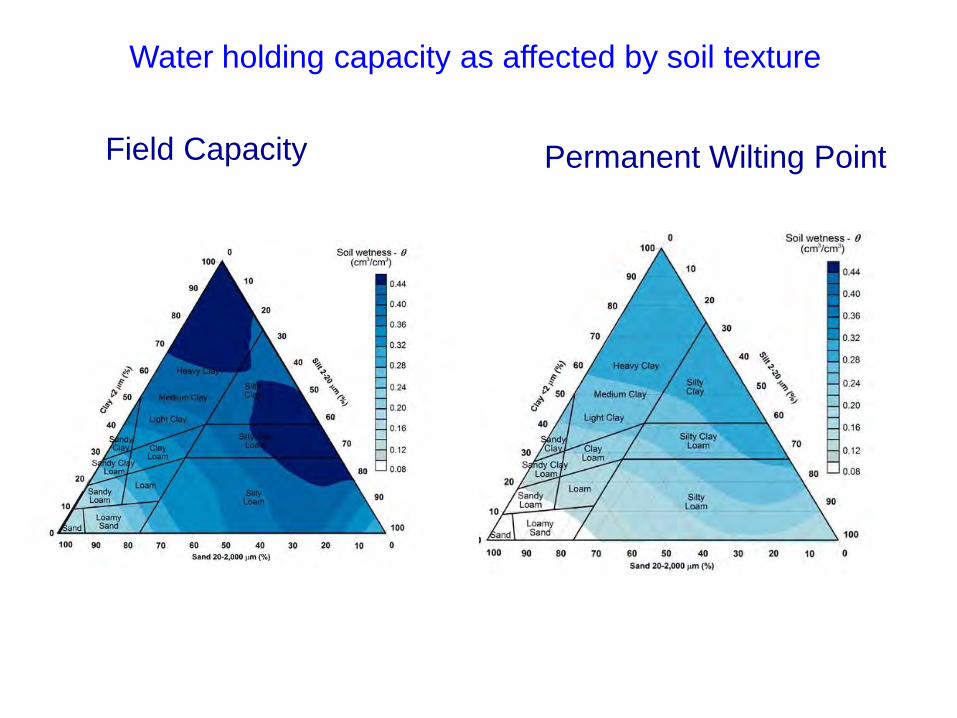
Field Capacity Permanent Wilting Point
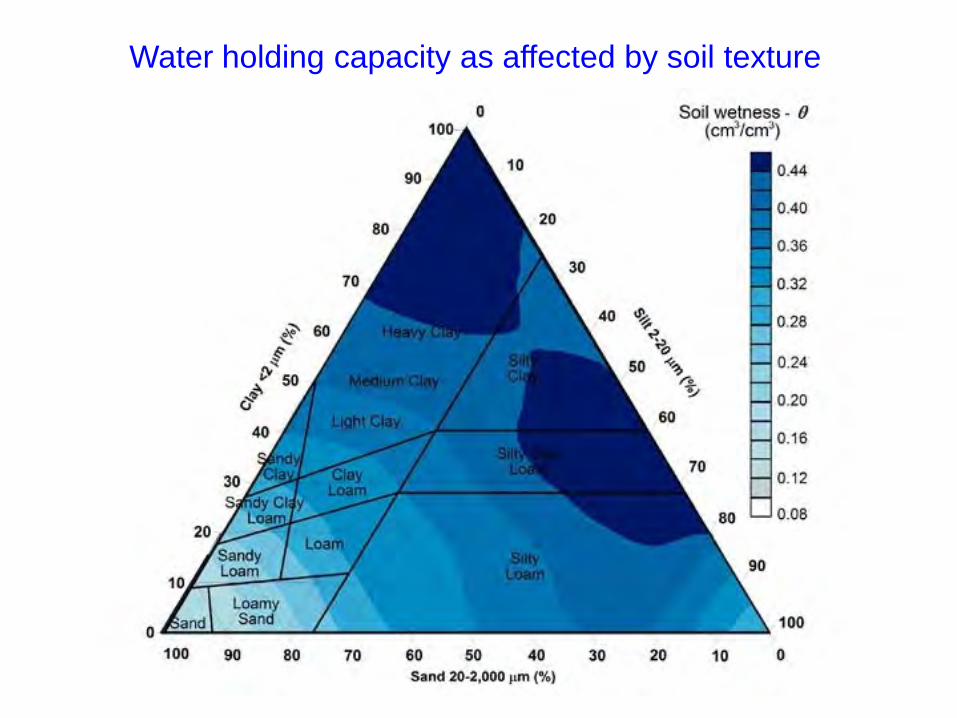
Water holding capacity as affected by soil texture
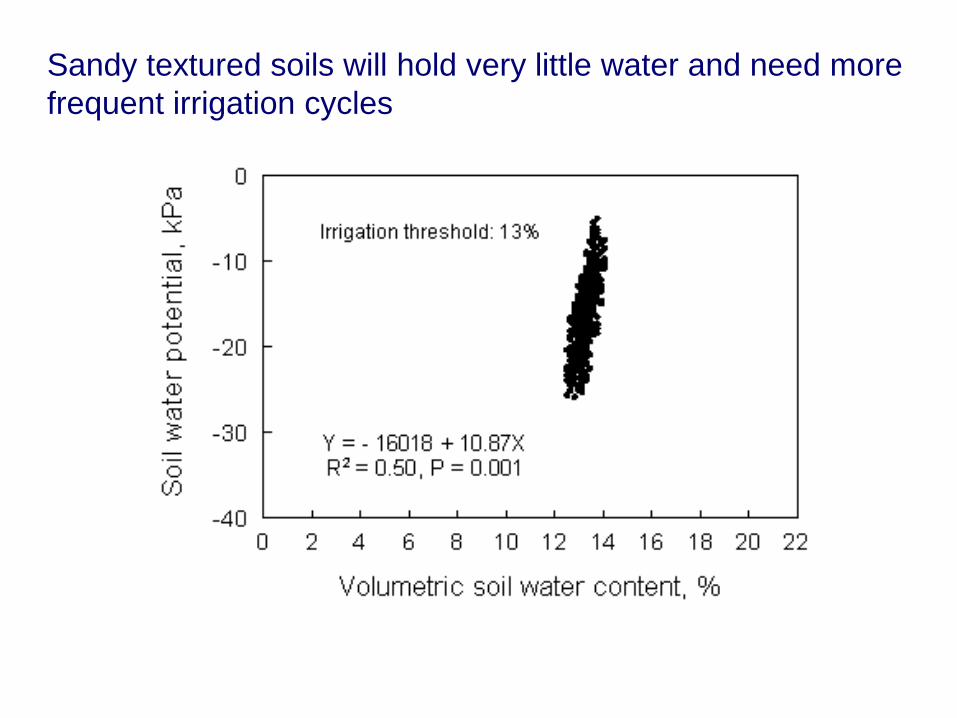
Sandy textured soils will hold very little water and need morefrequent irrigation cycles

Measurement of Soil Water Potential
TensionmeterAbsorbent BlocksTime Domain Reflectometery (TDR)
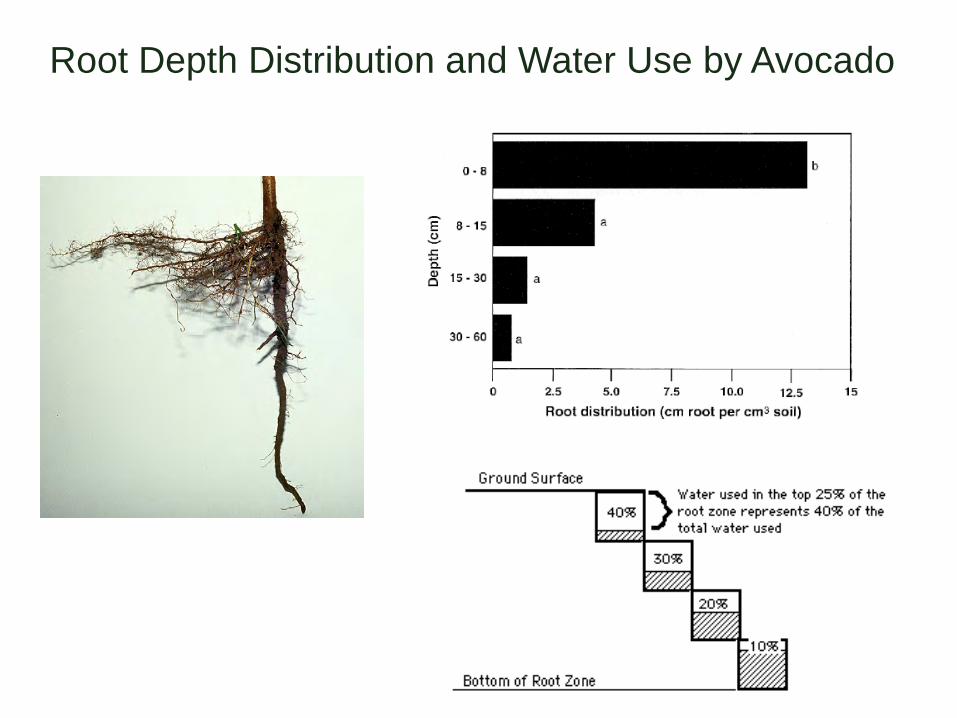
Root Depth Distribution and Water Use by Avocado

Water Mark Probes
1. Soil temperature2. Tree 1 6 inch3. Tree 2 6 inch4. Tree 3 6 inch5. Tree 1 12 inch6. Tree 2 12 inch7. Tree 3 12 inch8. Tree 1 24 inch
Water Mark Probes
1. Soil temperature2. Tree 1 6 inch3. Tree 2 6 inch4. Tree 3 6 inch5. Tree 1 12 inch6. Tree 2 12 inch7. Tree 3 12 inch8. Tree 1 24 inch
Quality Electrical
Conductivity
(millimhos/cm)
Total Salts
(ppm)
Sodium
(% of
total
salts)
SAR pH
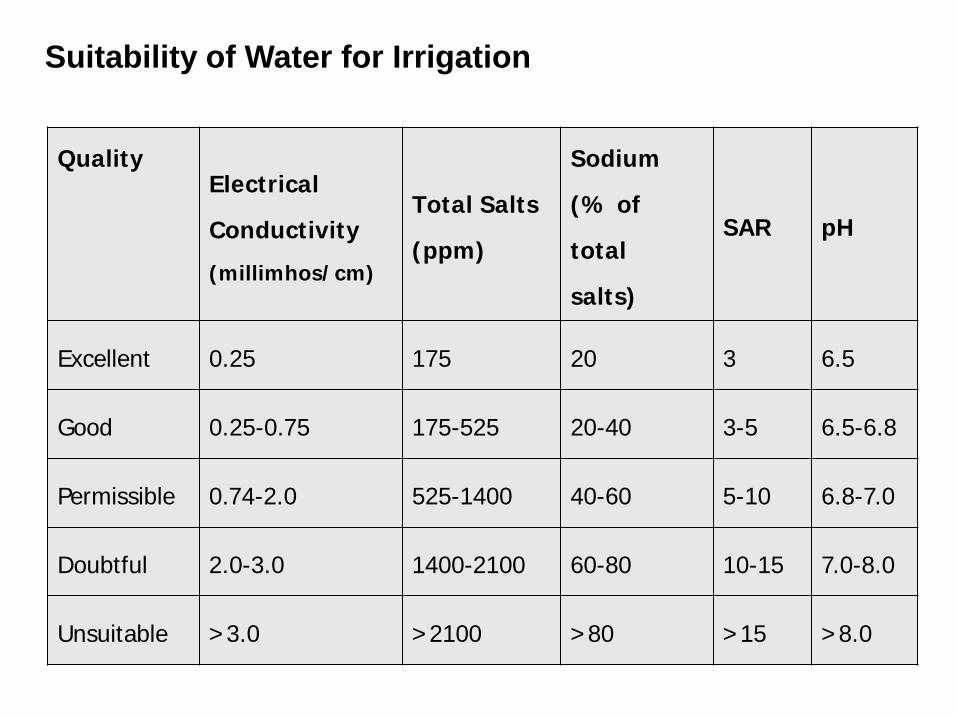
Excellent 0.25 175 20 3 6.5
Good 0.25-0.75 175-525 20-40 3-5 6.5-6.8
Permissible 0.74-2.0 525-1400 40-60 5-10 6.8-7.0
Doubtful 2.0-3.0 1400-2100 60-80 10-15 7.0-8.0
Unsuitable >3.0 >2100 >80 >15 >8.0
Suitability of Water for Irrigation

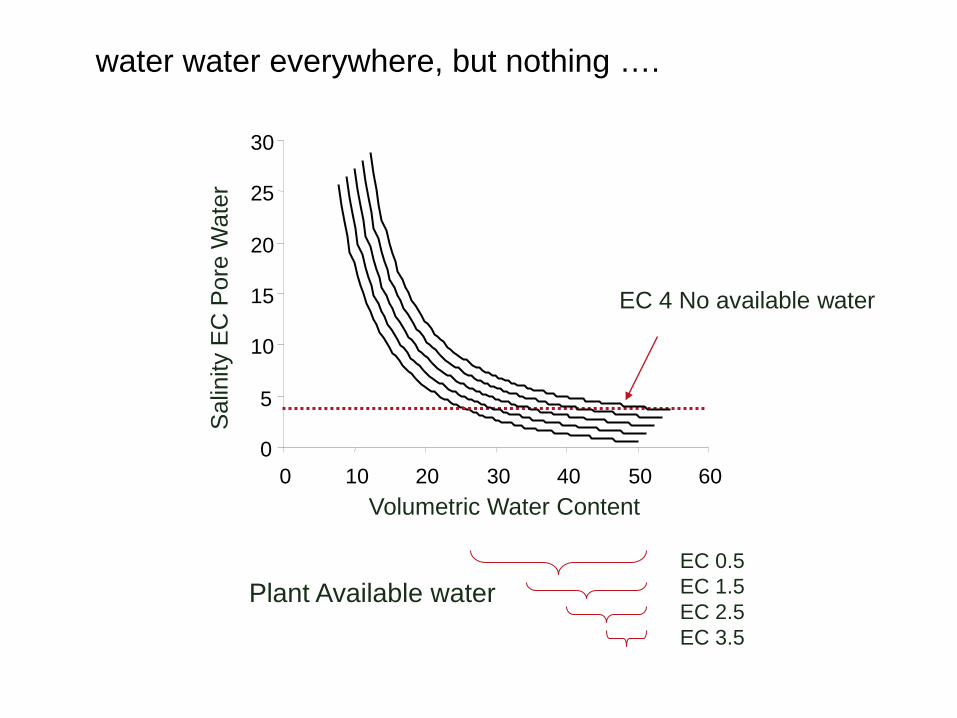
The Problem with Total Dissolved Salt: High Salt Inhibits Plant Water Uptake
Water enters the plant by osmosisSalt in the soil sucks water out from the plant roots
For avocado, this occurs at EC = 4 dS/m
0
5
10
15
20
25
30
0 10 20 30 40 50 60
EC 4 No available water
EC 0.5EC 1.5EC 2.5EC 3.5
Plant Available water
Volumetric Water Content
Sal
inity
EC
Por
e W
ater
water water everywhere, but nothing ….

Avocado is one of the most saline sensitive crops, and is subject to yield reduction when irrigated with saline irrigation water. This is due to a combined effect of dissolved solids (EC) and chloride toxicities.
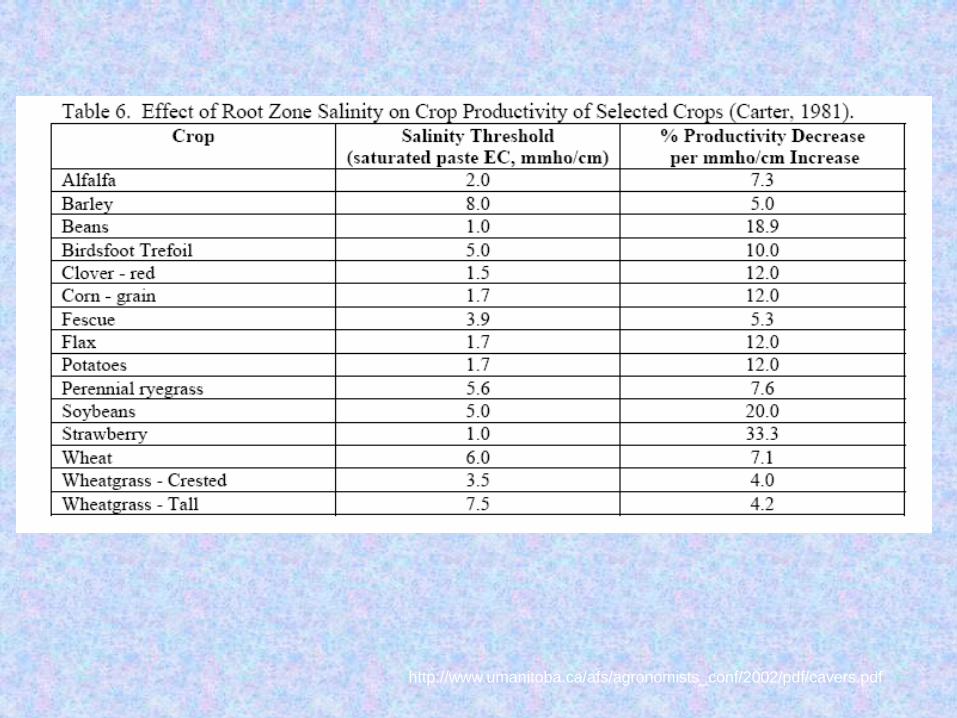
http://www.umanitoba.ca/afs/agronomists_conf/2002/pdf/cavers.pdf

Avocado Yield Function for Irrigation Water SalinityOster and Arpaia, J. Am Soc. Hort Sci. 2007
100
80
60
40
20
0Rel
ativ
e Yi
eld
(%)
0.5 1.0 1.5 2.0 2.5 3.0
Salinity (EC)
320 640 960 1280 1600 1920
TDS (ppm)
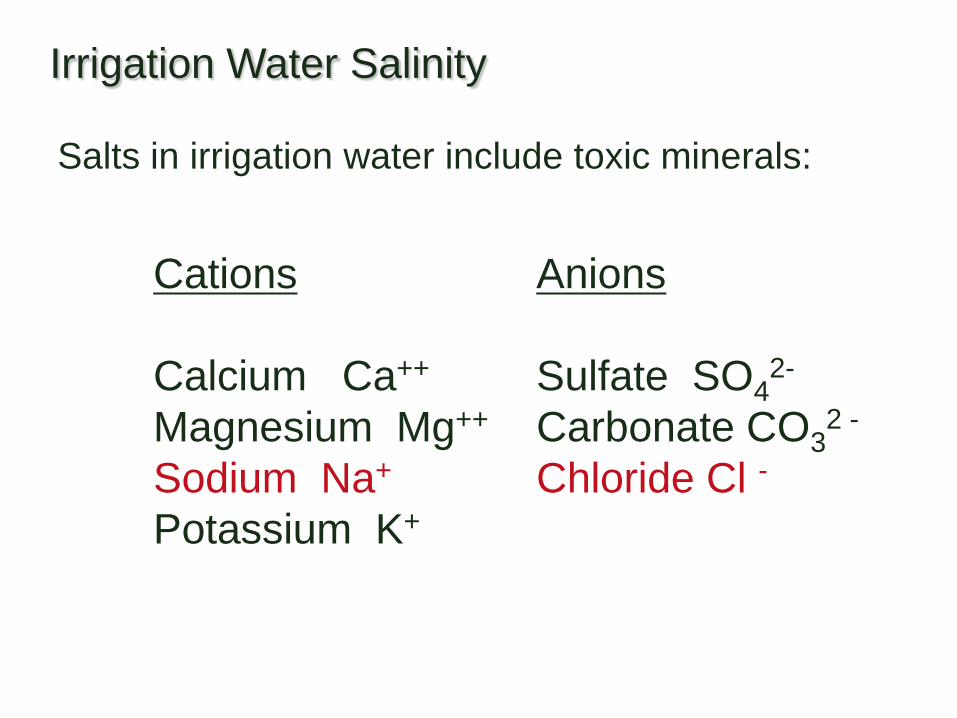
Irrigation Water Salinity
Salts in irrigation water include toxic minerals:
Cations Anions
Calcium Ca++ Sulfate SO42-
Magnesium Mg++ Carbonate CO32 -
Sodium Na+ Chloride Cl -Potassium K+

Chloride Sodium
Uptake and Distribution of Radiolabeled Chloride and Sodium (Kadman ca 1960s, avocadosource.com)
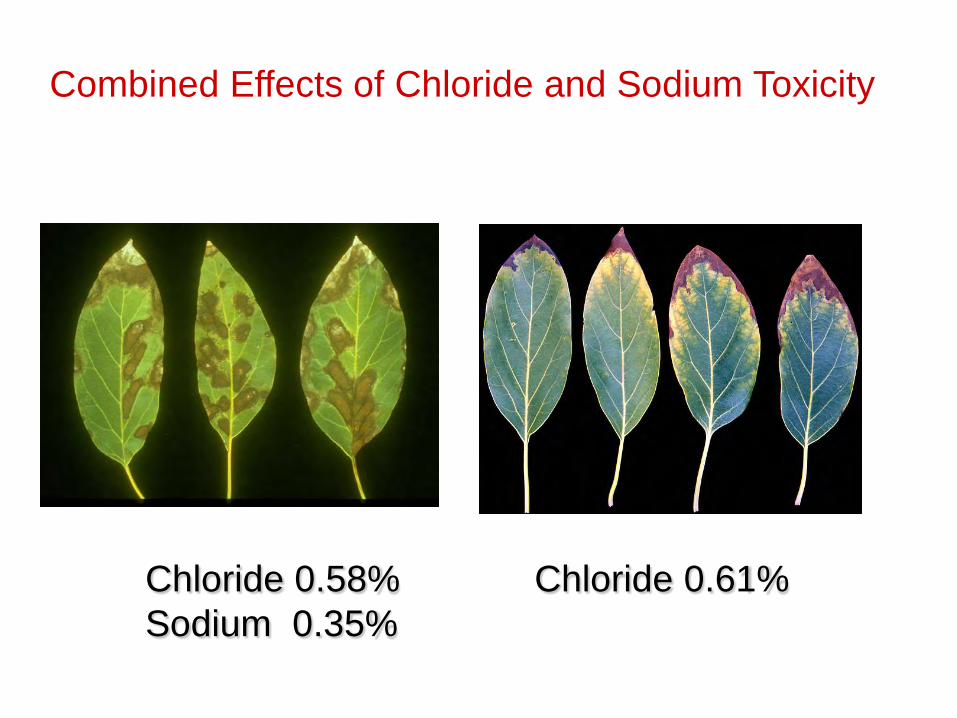
Combined Effects of Chloride and Sodium Toxicity
Chloride 0.58% Chloride 0.61%Sodium 0.35%
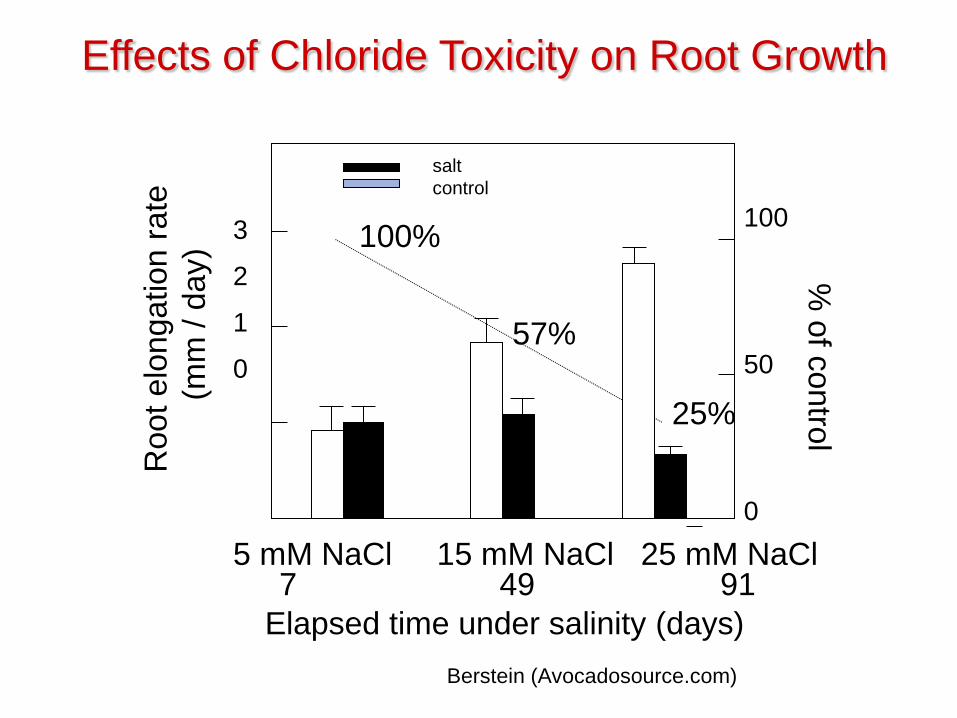
Effects of Chloride Toxicity on Root Growth
7 49 915 mM NaCl 15 mM NaCl 25 mM NaCl
Elapsed time under salinity (days)
Roo
t elo
ngat
ion
rate
(m
m /
day)
3
2
1
0
100
50
0
% of control
saltcontrol
100%
57%
25%
Berstein (Avocadosource.com)

Would you put this on your orchard?

1 Acre Foot = 1,233,000 Liters
TDS = 500 mg / Liter
615 kg of TDS Salt
X
How Much Salt is in Your Water?
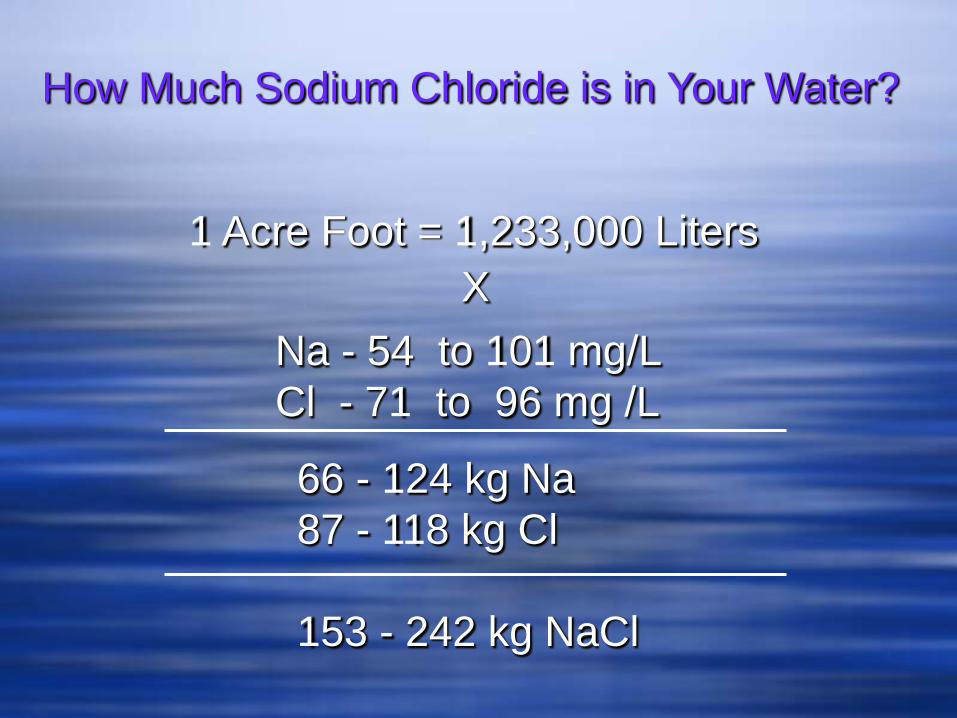
1 Acre Foot = 1,233,000 Liters
Na - 54 to 101 mg/L Cl - 71 to 96 mg /L
66 - 124 kg Na87 - 118 kg Cl
153 - 242 kg NaCl
X
How Much Sodium Chloride is in Your Water?
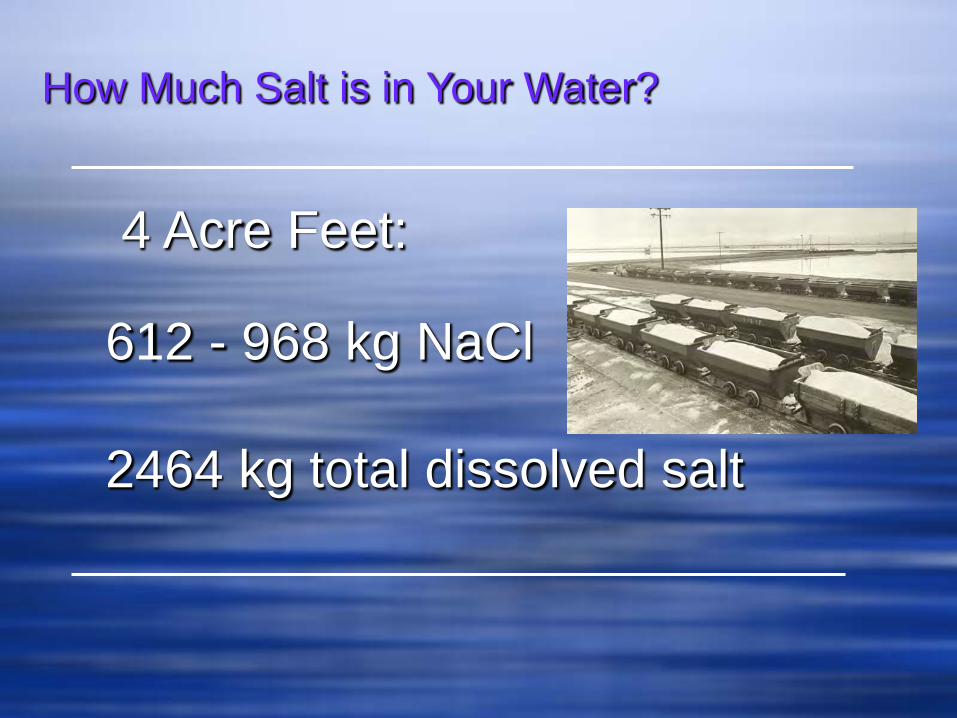
4 Acre Feet:
612 - 968 kg NaCl
2464 kg total dissolved salt
How Much Salt is in Your Water?

Measuring Salinity: Electrical Conductivity
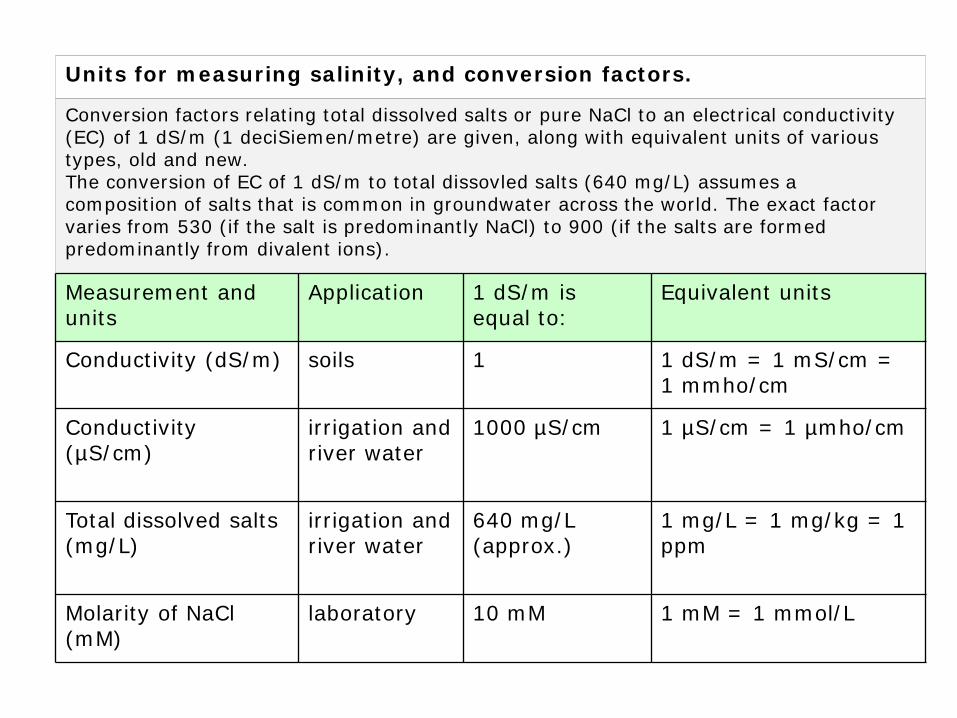
Units for measuring salinity, and conversion factors.
Conversion factors relating total dissolved salts or pure NaCl to an electrical conductivity (EC) of 1 dS/m (1 deciSiemen/metre) are given, along with equivalent units of various types, old and new. The conversion of EC of 1 dS/m to total dissovled salts (640 mg/L) assumes a composition of salts that is common in groundwater across the world. The exact factor varies from 530 (if the salt is predominantly NaCl) to 900 (if the salts are formed predominantly from divalent ions).
Measurement and units
Application 1 dS/m is equal to:
Equivalent units
Conductivity (dS/m) soils 1 1 dS/m = 1 mS/cm = 1 mmho/cm
Conductivity (µS/cm)
irrigation and river water
1000 µS/cm 1 µS/cm = 1 µmho/cm
Total dissolved salts (mg/L)
irrigation and river water
640 mg/L (approx.)
1 mg/L = 1 mg/kg = 1 ppm
Molarity of NaCl (mM)
laboratory 10 mM 1 mM = 1 mmol/L

Example of an EMI Survey MapHigh conductivity readings are expected where a heavy clay soil is seasonally waterlogged with saline ground water (red to pink colours on an EMI survey map); and Low conductivity readings can be expected in dry, sandy soils (or gravel), with little clay and almost no salt (blue to green).

Salt Accumulation in Tree Crop Orchards Using Drip Irrigation

Salt Accumulation in Tree Crop Orchards Using Micro-Spray Irrigation
CDWR 2003

Soil Leaching: Pushing Salt Down

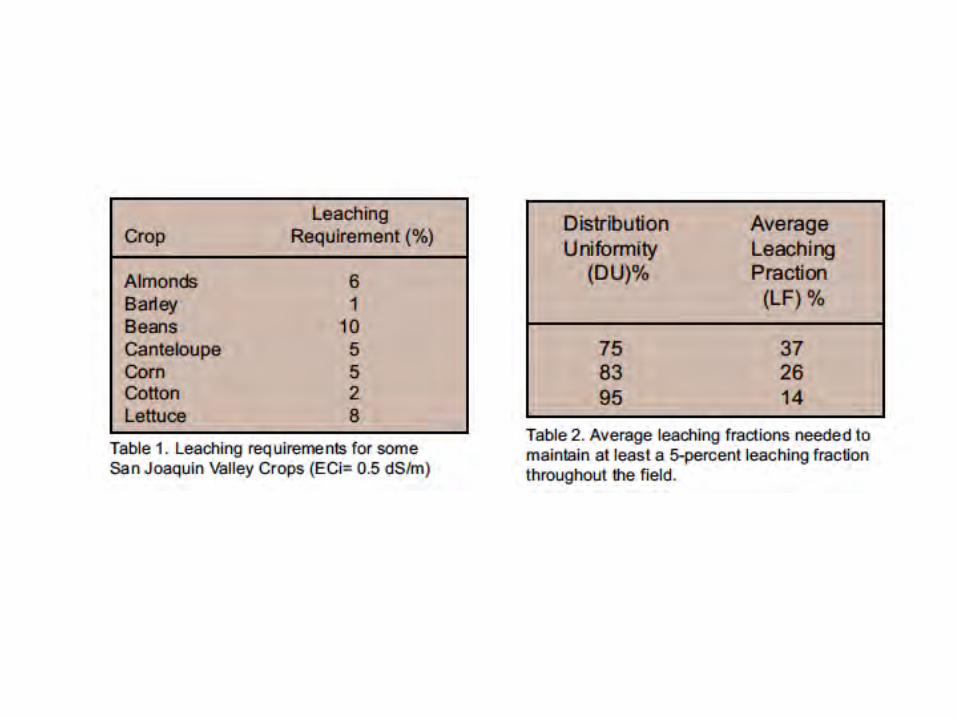
Leaching Fraction
Soil
ECe
(dS/
m)
Irrigation Water ECiw (dS/m)
0 2 4 6 8 10
10
8
6
4
2
0
0.05 0.10 0.15 0.20
Leaching Fractions

TDS/Conductivity/Salinity Pen
Collect Soil Cores0-6”, 6-12”, 12-18”
Prepare 2:1 Water:Soil ExtractsDistilled Water
Measure ECMultiply x 6 (to estimate soil ECw)
If EC > 0.25 dS m-1 for 2:1 water extract then it is time to leach (equivalent to an ECw of 2.0 at field capacity)
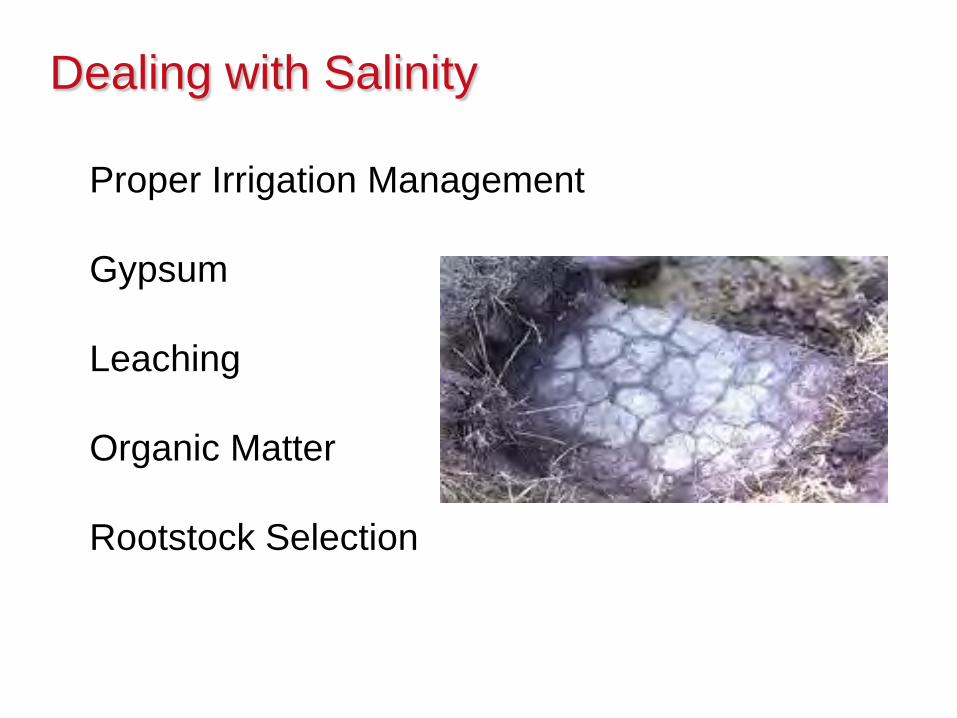
Dealing with Salinity
Proper Irrigation Management
Gypsum
Leaching
Organic Matter
Rootstock Selection
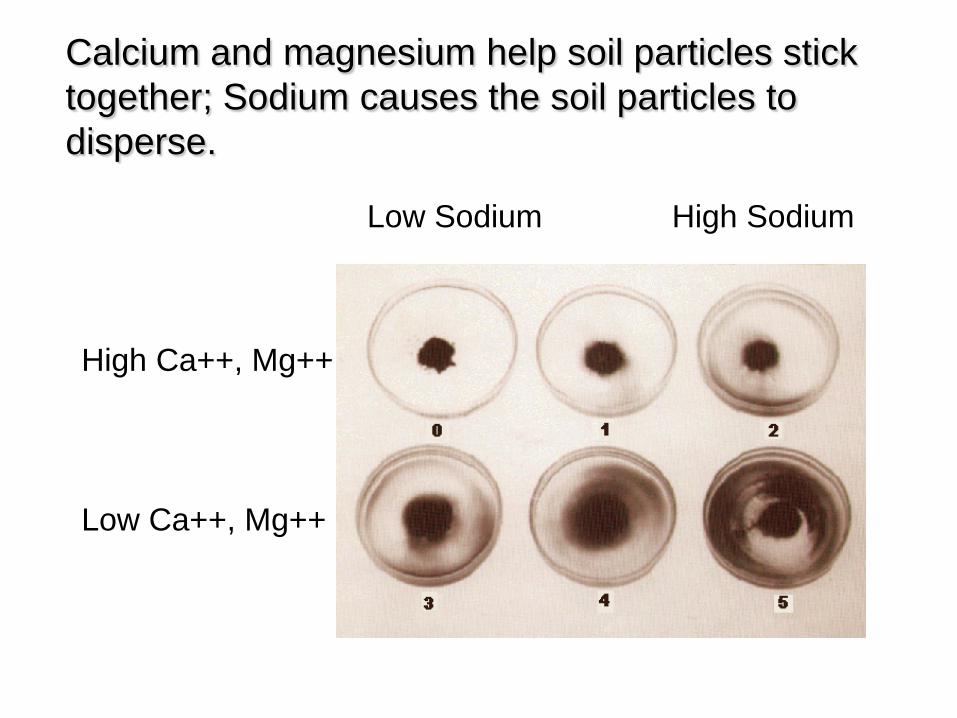
High Ca++, Mg++
Low Ca++, Mg++
Calcium and magnesium help soil particles stick together; Sodium causes the soil particles to disperse.
Low Sodium High Sodium
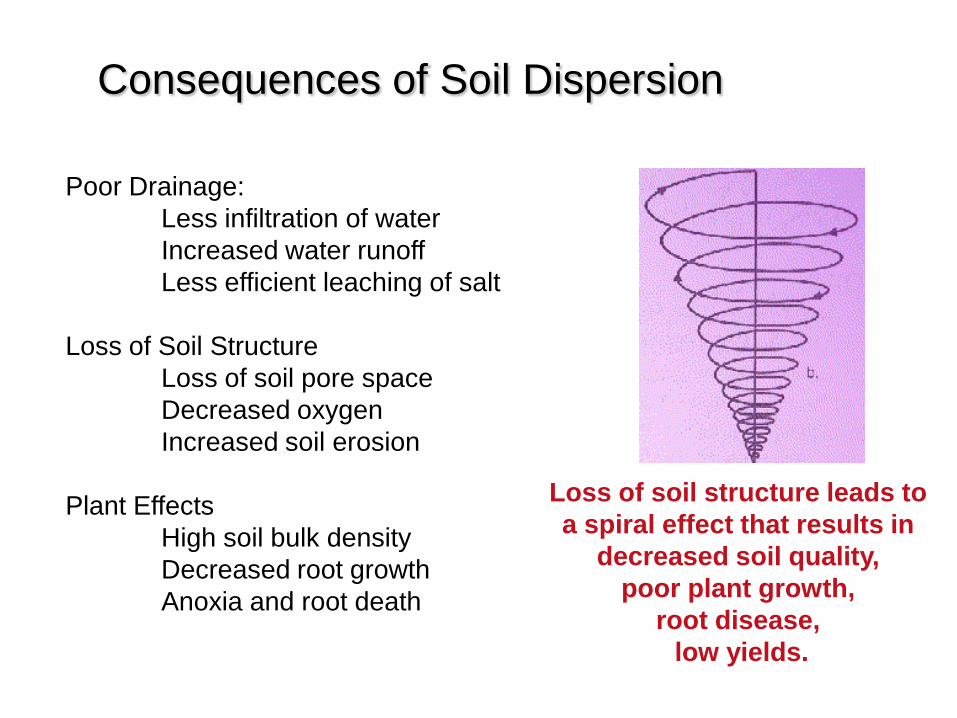
Consequences of Soil Dispersion
Poor Drainage: Less infiltration of waterIncreased water runoffLess efficient leaching of salt
Loss of Soil StructureLoss of soil pore spaceDecreased oxygenIncreased soil erosion
Plant Effects High soil bulk density Decreased root growthAnoxia and root death
Loss of soil structure leads to a spiral effect that results in
decreased soil quality, poor plant growth,
root disease, low yields.
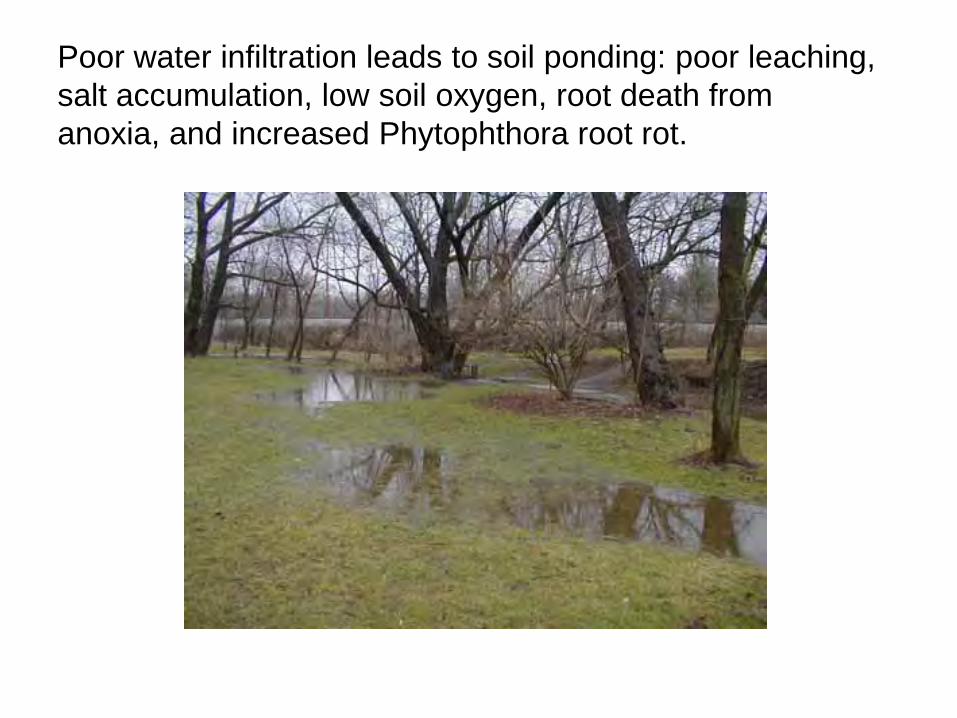
Poor water infiltration leads to soil ponding: poor leaching, salt accumulation, low soil oxygen, root death from anoxia, and increased Phytophthora root rot.

Salinity: Sodium and Chloride
Good Salts: Calcium, MagnesiumHold soil particles together
Problem Salts: Sodium – soil dispersionChloride - toxicity
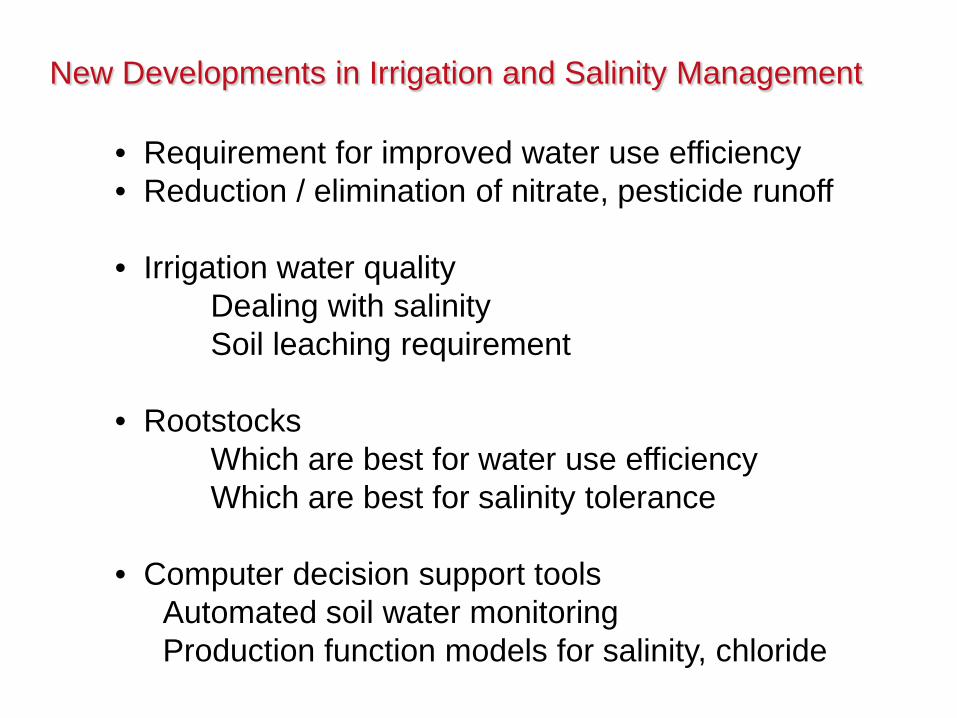
New Developments in Irrigation and Salinity Management
• Requirement for improved water use efficiency• Reduction / elimination of nitrate, pesticide runoff
• Irrigation water qualityDealing with salinitySoil leaching requirement
• RootstocksWhich are best for water use efficiencyWhich are best for salinity tolerance
• Computer decision support toolsAutomated soil water monitoringProduction function models for salinity, chloride

Salinity-Chloride Interactions: Their Influence on Yields
David Crowley and Mary Lu ArpaiaDept of Environmental Sciences, University of California,
Riverside, and UC Kearney Agricultural Center, Parlier, CA Cooperating Investigators: Ben Faber and Gary Bender
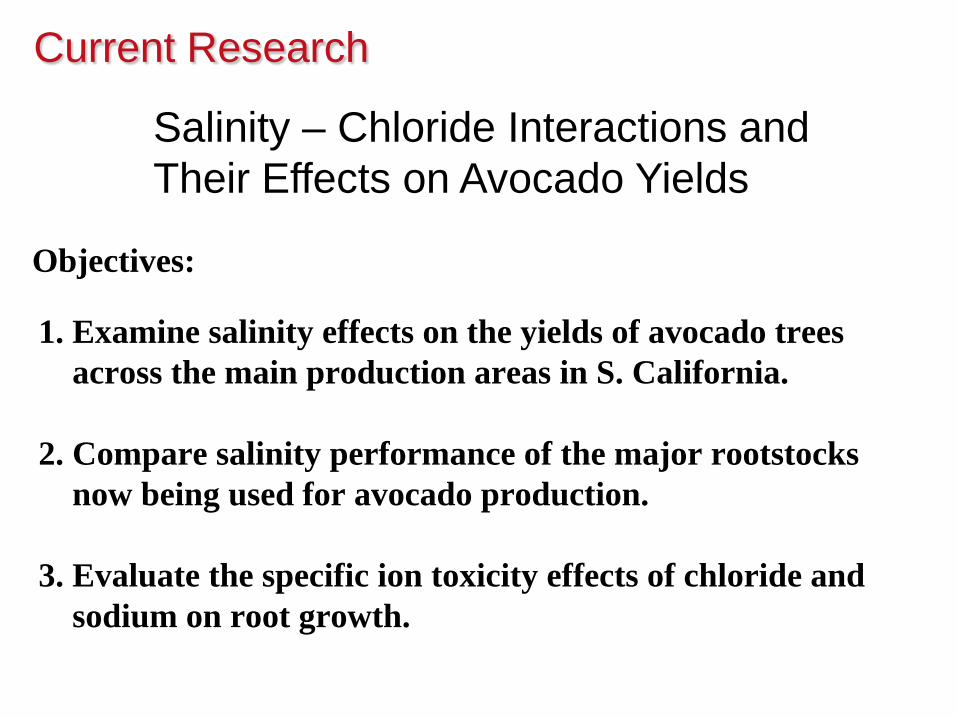
1. Examine salinity effects on the yields of avocado trees across the main production areas in S. California.
2. Compare salinity performance of the major rootstocks now being used for avocado production.
3. Evaluate the specific ion toxicity effects of chloride and sodium on root growth.
Objectives:
Current Research
Salinity – Chloride Interactions and Their Effects on Avocado Yields


Due to nutrient interactions that affect yield, scatter plots show no apparent relationship between chloride toxicity and fruit yields.

Yield values predicted from an artificial neural network model using fixed values for all nutrientsexcept chloride (values fixed at average levels for entire orchard: N 2.4%, P 0.18%, K 1.2%, Ca1.5%, Mg 0.4%, Na 0.015%, Zn 30 ppm, Fe 84 ppm, B 40 ppm.
Fruit yield as affected by leaf chloride content for Hass avocado grafted on to different rootstocks under “average” nutrient conditions.
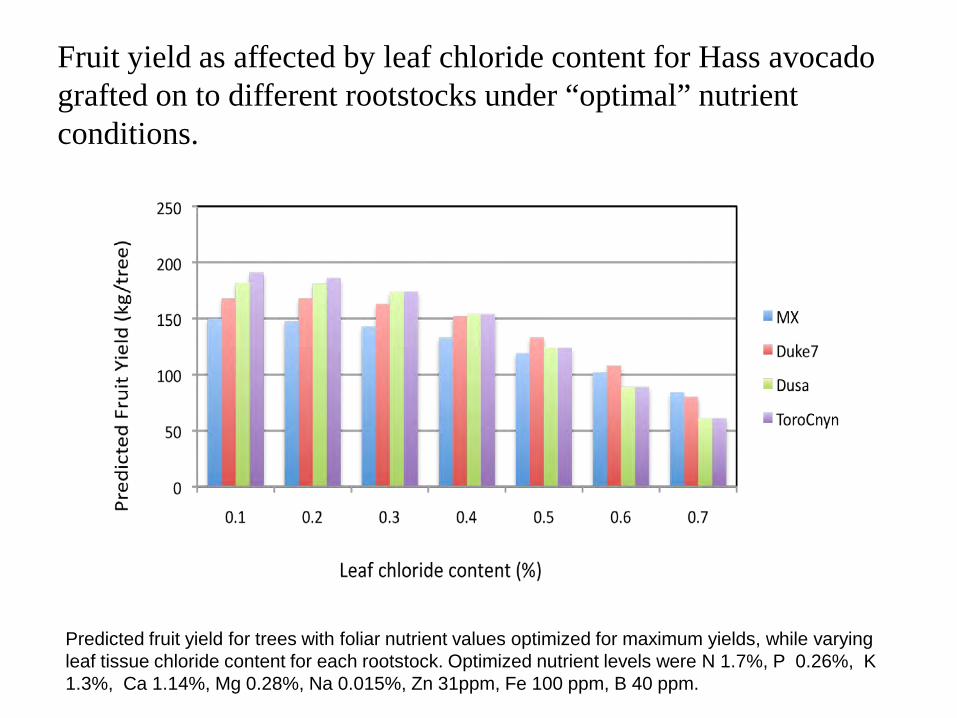
Fruit yield as affected by leaf chloride content for Hass avocado grafted on to different rootstocks under “optimal” nutrient conditions.
Predicted fruit yield for trees with foliar nutrient values optimized for maximum yields, while varying leaf tissue chloride content for each rootstock. Optimized nutrient levels were N 1.7%, P 0.26%, K 1.3%, Ca 1.14%, Mg 0.28%, Na 0.015%, Zn 31ppm, Fe 100 ppm, B 40 ppm.

0
0.2
0.4
0.6
0.8
1
Toro Cny Dusa Duke 7 Mexican Thomas
pH 6.5pH 7.0pH 7.5
Leaf
Chl
orid
e (%
)
0
0.2
0.4
0.6
0.8
1
Toro Cny Dusa Duke 7 Mexican Thomas
pH 6.5pH 7.0pH 7.5
0
0.2
0.4
0.6
0.8
1
Toro Cny Dusa Duke 7 Mexican Thomas
pH 6.5pH 7.0pH 7.5
Leaf
Chl
orid
e (%
)ANN predicted effect of changes in soil pH on leaf chloride content for five avocado rootstocks. Additional parameters were set under relatively harsh conditions that are associated with elevated chloride levels: soil ECe= 4.0 dS/m, soil Cl 8 mg/kg; irrigation water EC 0.8 dS/m; irrigation water chloride = 50 mg/L; soil clay content 50%.
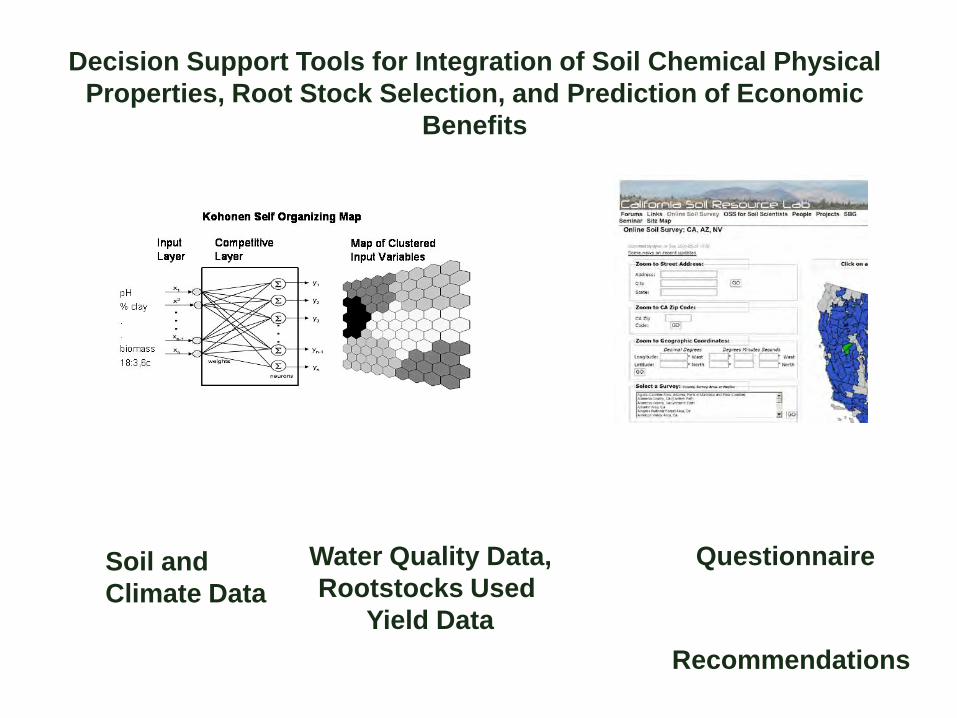
Decision Support Tools for Integration of Soil Chemical Physical Properties, Root Stock Selection, and Prediction of Economic
Benefits
Questionnaire
Recommendations
Water Quality Data, Rootstocks Used
Yield Data
Soil and Climate Data
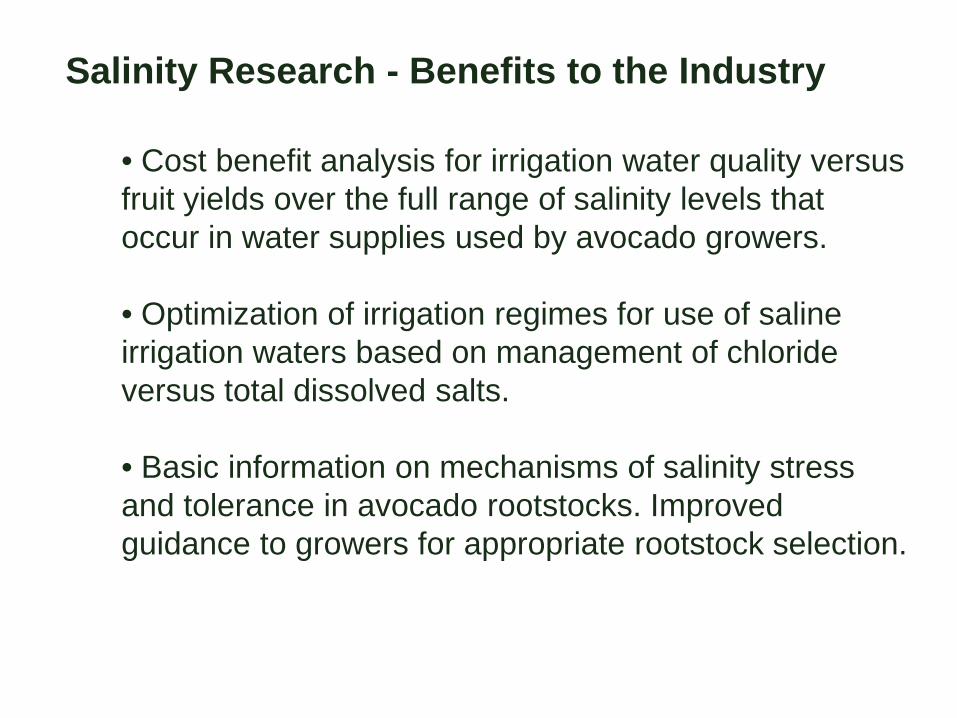
Salinity Research - Benefits to the Industry
• Cost benefit analysis for irrigation water quality versus fruit yields over the full range of salinity levels that occur in water supplies used by avocado growers.
• Optimization of irrigation regimes for use of saline irrigation waters based on management of chloride versus total dissolved salts.
• Basic information on mechanisms of salinity stress and tolerance in avocado rootstocks. Improved guidance to growers for appropriate rootstock selection.

SUBMITTED BY: CROWLEY, DAVID WORK REQ #: 03W003DANR SECTION: AGF: ENV SCI, UCR # OF SAMPLES: 2
DATE RECEIVED: 07/08/02COMMODITY: Avocado Irrigation Water DATE REPORTED: 07/26/02
DANR CLIENT #: CROX1 TURN AROUND TIME IN WORKING DAYS: 15
Sample Type: WATER Date Sampled: 24 Oct 01 & 18 May 02; Grower/Location/Project: Stehly/San Diego/ Stehly SalinityEC pH Ca (Soluble) Mg (Soluble) Na (Soluble) Cl HCO3 CO3 B (Soluble) SAR Zn (Soluble) Cu (Soluble)
SAMPLE # DESC[ SOP 815 ]mmhos/cm
[ SOP 805 ] [ SOP 835 ]meq/L
[ SOP 835 ]meq/L
[ SOP 835 ]meq/L
[ SOP 825 ]meq/L
[ SOP 820 ]meq/L
[ SOP 820 ]meq/L
[ SOP 835 ]ppm
[ SOP 840 ] [ SOP 835 ]ppm
[ SOP 835 ]ppm
1A 24-Oct-01 2.12 8.0 10.0 7.2 6.6 8.3 3.3 0.1 0.1 2 <0.02 <0.02 1B 2.09 8.0 9.8 7.0 6.6 8.4 3.3 0.1 0.1 2 <0.02 <0.02
2A 18-May-02 3.28 8.0 14.7 14.5 9.5 13.6 3.8 <0.1 0.1 2 <0.02 <0.02 2B 3.17 8.0 14.6 14.4 9.6 13.4 3.8 <0.1 0.1 3 <0.02 <0.02
Method Detection Limit: 0.01 0.1 0.1 0.1 0.1 0.1 0.1 0.1 0.1 1 0.02 0.02Blank Concentration: - - 0.0 0.0 0.0 0.0 0.0 0.0 0.0 - 0.00 0.00Standard Ref as Tested: 0.29 6.4 0.4 0.7 1.8 0.4 2.1 - 0.3 3 50 8.6Standard Ref Acceptable: 0.29±0.04 6.5±0.4 0.4±0.2 0.8±0.2 1.7±0.2 0.3±0.2 2.3±0.4 - 0.4±0.2 2±2 50±6 8.7±1.2Standard Reference: UCD 005 UCD 004 UCD 005 UCD 005 UCD 005 UCD 005 UCD 005 - UCD 005 UCD 005 UCD 155 UCD 155
Checked and Approved: {electronically signed by E. Sue Littlefield} E. Sue Littlefield, Lab Supervisor
Typical Soil Water Analysis for Well Water San Diego County
Total Chlorides Range Measured in 2006: 8 to 13 mM, 300 – 560 ppm(1 meq Cl x 35 = ppm)
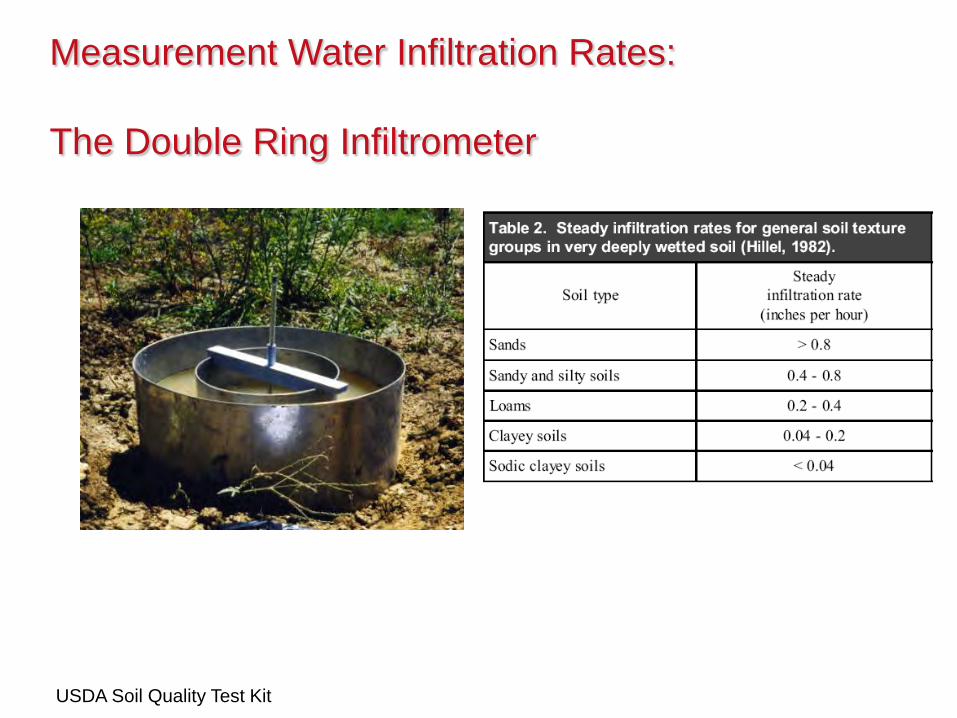
Measurement Water Infiltration Rates:
The Double Ring Infiltrometer
USDA Soil Quality Test Kit
Water holding capacity as affected by soil texture
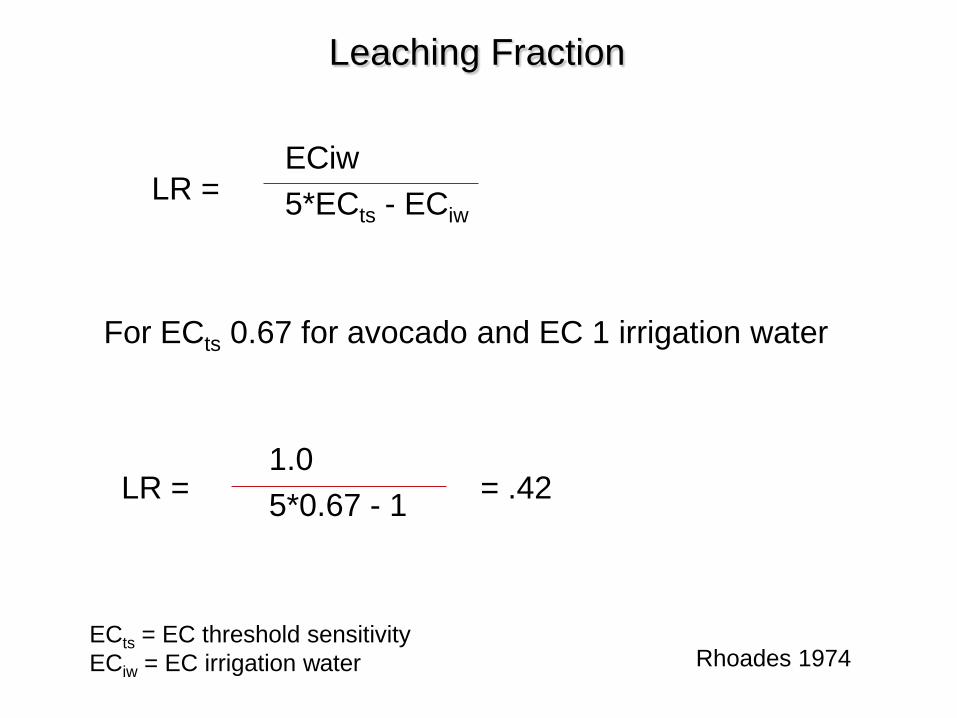
Leaching Fraction
LR = ECiw5*ECts - ECiw
For ECts 0.67 for avocado and EC 1 irrigation water
1.05*0.67 - 1LR = = .42
ECts = EC threshold sensitivityECiw = EC irrigation water Rhoades 1974
0.1
0.2
0.3
0.4
0.5
0.6
0.7
0.8
1 2 3 4 5 6 7 8
Toro CnyDusaDuke 7MexicanThomas
Soil Chloride (mg / kg)
Leaf
Chl
orid
e (%
)
0.1
0.2
0.3
0.4
0.5
0.6
0.7
0.8
1 2 3 4 5 6 7 8
Toro CnyDusaDuke 7MexicanThomas
0.1
0.2
0.3
0.4
0.5
0.6
0.7
0.8
1 2 3 4 5 6 7 8
Toro CnyDusaDuke 7MexicanThomas
Soil Chloride (mg / kg)
Leaf
Chl
orid
e (%
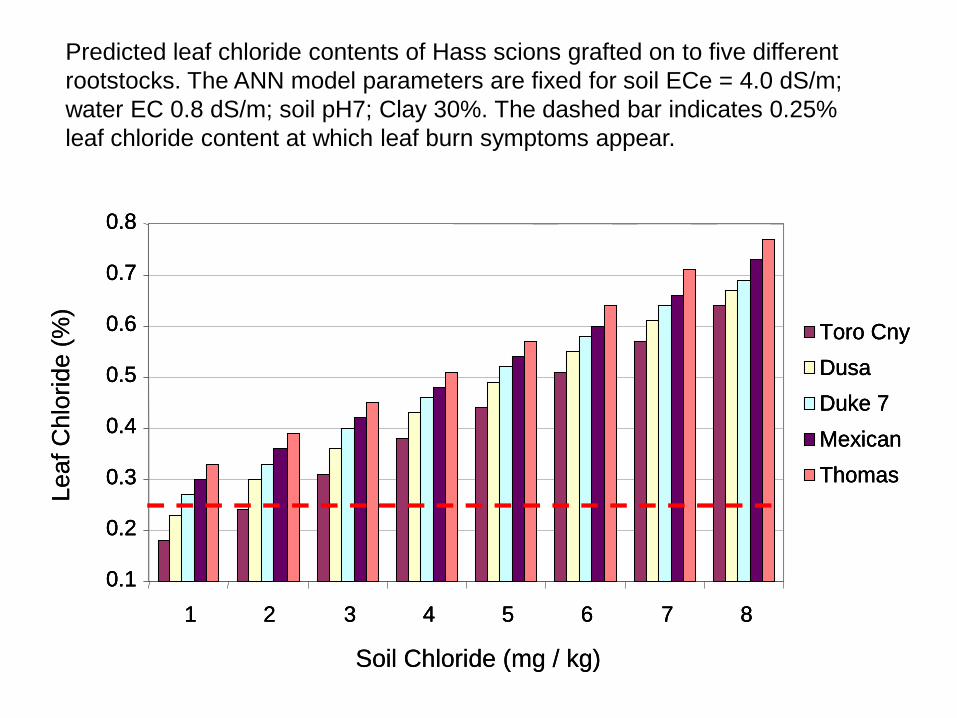
)Predicted leaf chloride contents of Hass scions grafted on to five different rootstocks. The ANN model parameters are fixed for soil ECe = 4.0 dS/m; water EC 0.8 dS/m; soil pH7; Clay 30%. The dashed bar indicates 0.25% leaf chloride content at which leaf burn symptoms appear.
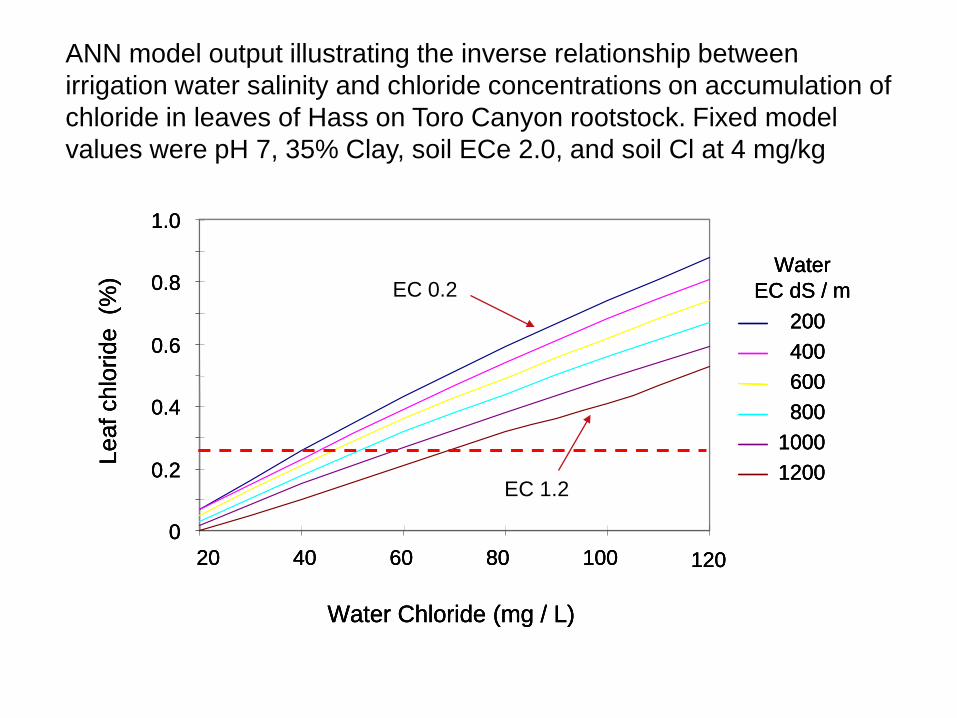
ANN model output illustrating the inverse relationship between irrigation water salinity and chloride concentrations on accumulation of chloride in leaves of Hass on Toro Canyon rootstock. Fixed model values were pH 7, 35% Clay, soil ECe 2.0, and soil Cl at 4 mg/kg
0
0.2
0.4
0.6
0.8
1.0
20 40 60 80 100 120
200400600800
10001200
WaterEC dS / m
Water Chloride (mg / L)
Leaf
chl
orid
e (%
)
0
0.2
0.4
0.6
0.8
1.0
20 40 60 80 100 120
200400600800
10001200
WaterEC dS / m
Water Chloride (mg / L)
Leaf
chl
orid
e (%
)
0
0.2
0.4
0.6
0.8
1.0
20 40 60 80 100 120
200400600800
10001200
WaterEC dS / m
Water Chloride (mg / L)
Leaf
chl
orid
e (%
) EC 0.2
EC 1.2
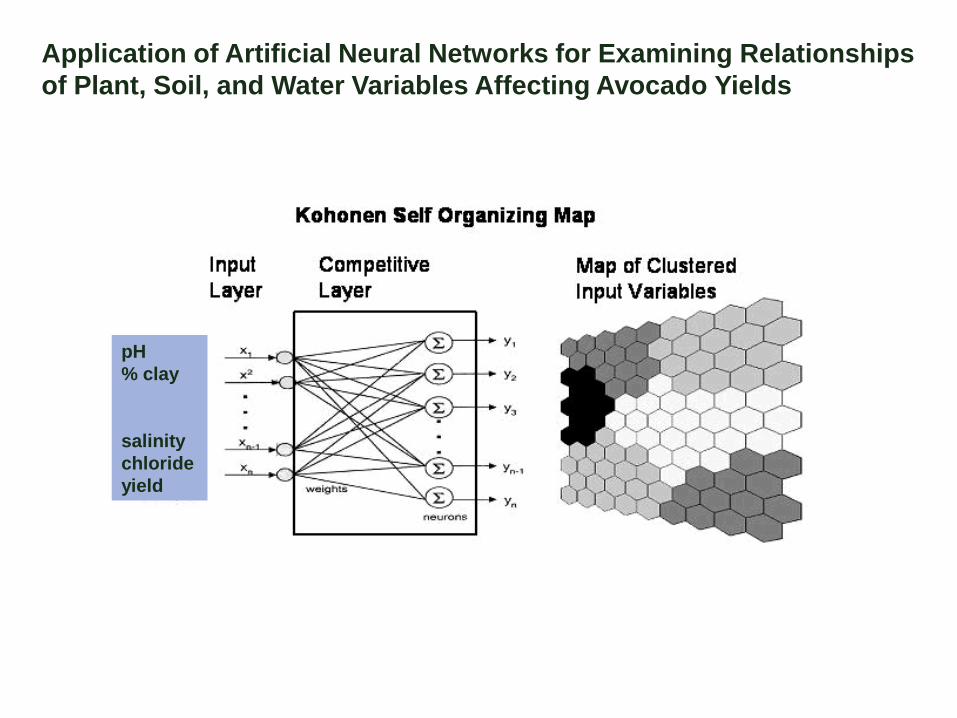
Application of Artificial Neural Networks for Examining Relationships of Plant, Soil, and Water Variables Affecting Avocado Yields
pH% clay
salinity chlorideyield
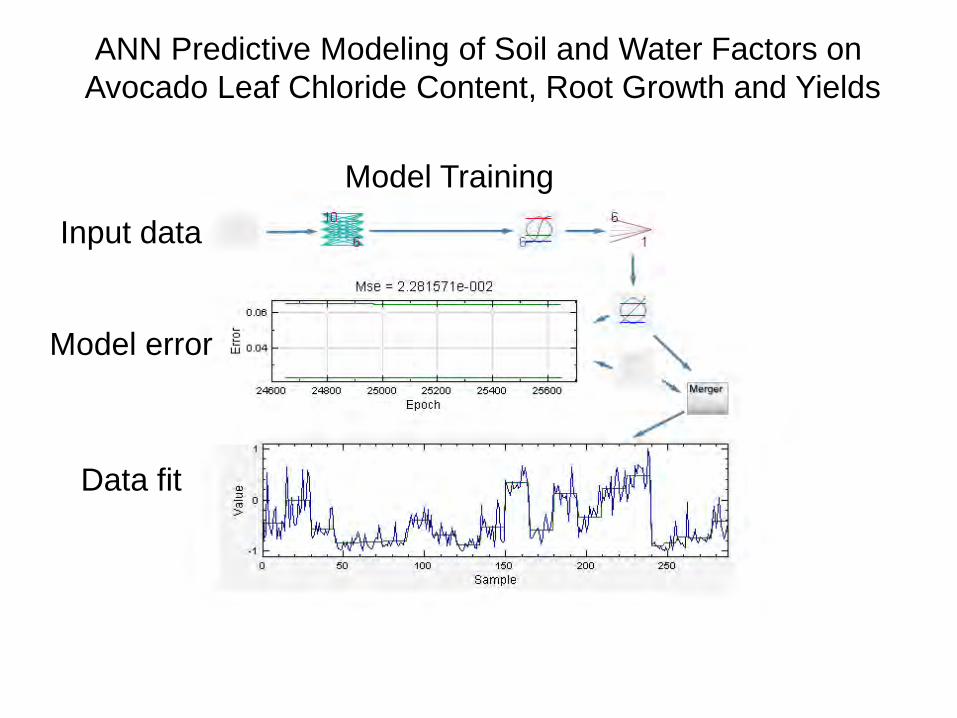
ANN Predictive Modeling of Soil and Water Factors on Avocado Leaf Chloride Content, Root Growth and Yields
Input data
Model error
Model Training
Data fit

Due to nutrient interactions that affect yield, scatter plots show no apparent relationship between chloride toxicity and fruit yields.

Root length7.55 mg/kg soil
Slide baradjustment
Variable Value Predicted output variable value
Root length7.55 mg/kg soil
Slide baradjustment
Variable Value Predicted output variable value
ANN Model Output and Sensitivity Analysis of Soil and Water Factors Affecting Root Length

Salinity Calculations for Soil At Different Moisture Levels
Soil Status Water Content CentiBars EC
Saturation 50% 0 1Field Capacity 25% 3 2Air dry 10% 40 5Wilting point <5% >100 10
Irrigation water EC = 1Assume no prior accumulation, Then as soil dries:
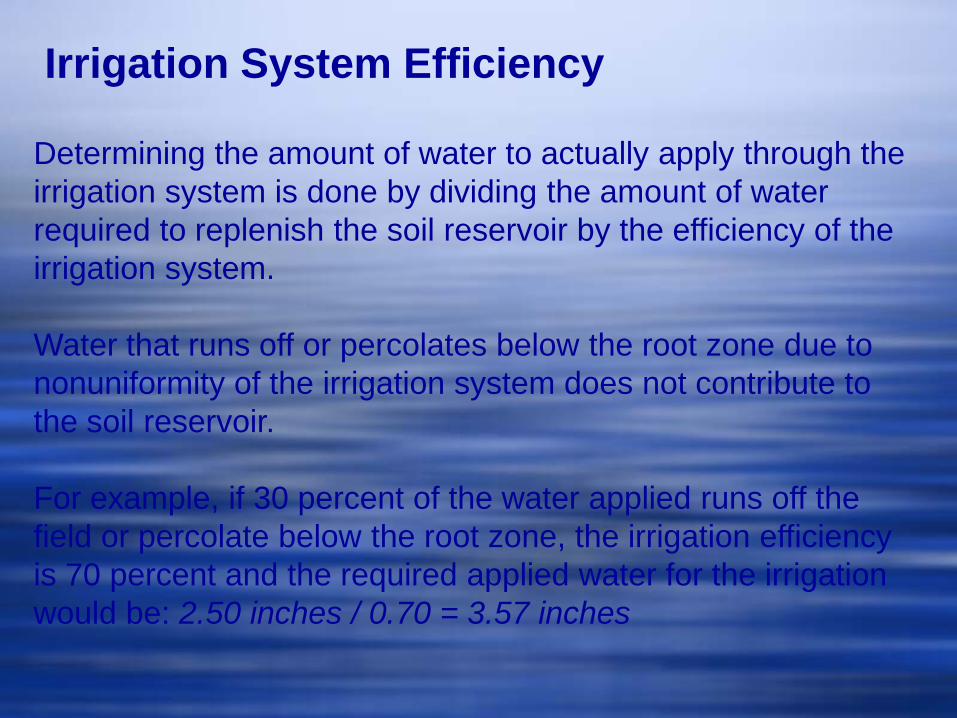
Irrigation System Efficiency
Determining the amount of water to actually apply through the irrigation system is done by dividing the amount of water required to replenish the soil reservoir by the efficiency of the irrigation system.
Water that runs off or percolates below the root zone due to nonuniformity of the irrigation system does not contribute to the soil reservoir.
For example, if 30 percent of the water applied runs off the field or percolate below the root zone, the irrigation efficiency is 70 percent and the required applied water for the irrigation would be: 2.50 inches / 0.70 = 3.57 inches
Improving Soil Physical Properties: Bulk Density
Prepare new plantings with mounded rows,include compost or other organic matter
Mulch applications
Gypsum applications in clay soils
Charcoal amendments (Biochar)