david jones limited interim results presentation 13 march 2000
TRANSCRIPT
DAVID JONES LIMITED
Interim Results Presentation13 March 2000

Peter WilkinsonChief Executive

3
Performance Overview
Improvement
Sales $780.3m + 9.6%
EBIT $ 50.3m +23.3%
PAT (before Abnormals) $ 28.9m +12.9%
EPS (before Abnormals) 7.4c +13.9%
Stock Turn 2.73 times + 6.6%

4
Highlights
• Continued to grow market share
• Strengthened position in WA and Victoria
• Fundamental change in business continuing strongly- benefits still flowing through
• Well positioned to handle any demand swings
• Progress on growth strategy
• New CFO

5
Key Drivers
• Buying department
• Exclusive brands
• Systems improvement
• Cost control
• Supplier relationships
• Customer Service
• Improved marketing

Brian HillChief Financial Officer

7
‘All the Key Financials showed strong growth on the corresponding half’
Key Financials 6 MonthsJan 2000
$m
6 MonthsJan 1999
$mChange
Store Sales 780.3 711.9 +9.6%
EBIT 50.3 40.8 +23.3%
Profit After Tax Before Abnormals 28.9 25.6 +12.9%
Earnings per Share Before Abnormals 7.4 c 6.5 c +13.9%
Dividend per Share 4.0 c 4.0 c -

8
‘Double digit growth in Profit after Tax was offset by an Abnormal Item of $4.1m’
Profit Summary6 MonthsJan 2000
$m
6 MonthsJan 1999
$m
Change
EBIT 50.3 40.8 +23.3%Interest (5.0) (2.4) +108.3%Profit Before Tax 45.3 38.4 +18.0%Income Tax (16.4) (12.8) +28.1%PAT Before Abnormals 28.9 25.6 +12.9%Abnormals After Tax (4.1) - -Profit After AbnormalItems and Tax
24.8 25.6 -3.1%

9
‘Earnings before Interest up 23.3% due to strong growth in Retail Operations and Credit’
Earnings Before Interest & Tax 6 MonthsJan 2000 $m
6 MonthsJan 1999 $m
Change
Retail Earnings 36.0 28.9 +24.6%
Property 9.2 9.1 -
Credit 5.1 2.8 +82.1%
EBIT 50.3 40.8 +23.3%

10
‘Higher Sales and well controlled costs contribute to an increase in Retail Contribution of 24.6%’
Retail Operations 6 MonthsJan 2000 $m
6 MonthsJan 1999 $m
Change
Sales 780.3 711.9 +9.6%
Gross Profit 270.3 248.4 +8.8%
Expenses 234.3 219.6 +6.7%
Retail Contribution 36.0 28.9 +24.6%
SG&A as percentage of Sales 30.0% 30.9% -3.0%

11
‘Comparable store sales grew by more than all DSS - gaining market share’
Sales Growth 6 MonthsJan 2000 $m
6 MonthsJan 1999 $m
Change
Store Sales 780.3 711.9 +9.6%
New Stores 29.1 * 6.0
Comparable Store Basis 751.2 705.9 +6.4%
Department Stores 6452.7 6206.3 +3.9%
* Carindale, Chadstone, Birkenhead and Harbour Town

12
‘All major product categories performed strongly’
• Introduction of new brands
• Rebuilt buying capacity
• Supplier partnering
Home,Electrical &Furniture
Apparel Cosmetics,Shoes &
Accessories
19992000
+13%
+9%
+7%

13
‘Operational efficiencies and fee income drive 82% improvement in Credit Card profits despite higher interest free’
David Jones Credit Card Change on
Corresponding Half
New approved Credit Cards +78%
- Without Shareholder Discount +22%
Operating Expenses + 4%
Fee Income New
Total Card Receivables +16%
Interest Free and Deferred Receivables +42%
14
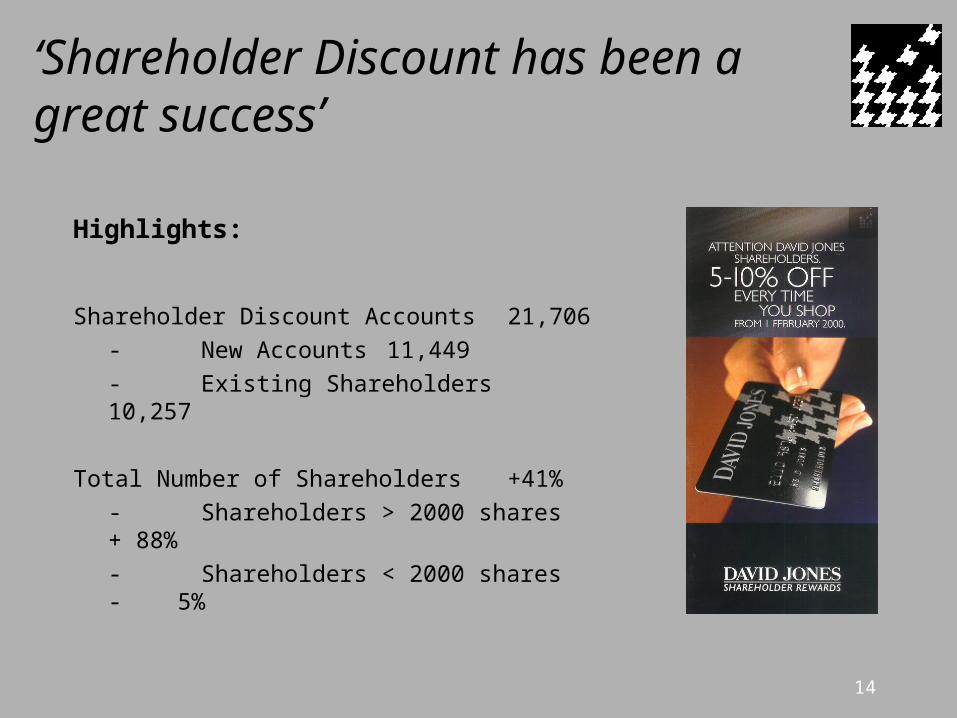
‘Shareholder Discount has been a great success’
Highlights:
Shareholder Discount Accounts 21,706
- New Accounts 11,449
- Existing Shareholders 10,257
Total Number of Shareholders +41%
- Shareholders > 2000 shares + 88%
- Shareholders < 2000 shares - 5%

15
‘Abnormals Reduced Profit After Tax by $4.1m’
Abnormal Item Before Tax $m
Rebated Tax $m
AfterTax$m
Preparing for GST (3.3) 1.2 (2.1)
Adjustment of Net Income
Tax Benefits for Change of
Tax Rate from 36% to 30% - (2.0) (2.0)
Total Abnormal (3.3) (0.8) (4.1)

16
‘Negative Cash Flow primarily due to Capital Return’
Cash Flow 6 MonthsJan 2000
$m
6 MonthJan 1999
$m
Comment
Net Cash Flow (86.6) ( 0.8)
Major Items:
Debtors (7.7) (34.7) Higher debts, but effect ofsecuritisation
Depreciation and Provisions 18.3 18.1 Creditors 36.4 ( 4.2) Higher inventories and timing Dividends (15.7) (11.8) Dividend increases from 3c to 4c Sale of Assets 0.4 21.2 Sale of Rundle Mall last year;
Adelaide in second half Capital Expenditure (65.5) (20.4) Chadstone, Adelaide, Harbour
Town and Southland Return of Capital (79.2) - 20 cents per share return

17
‘Balance Sheet has strengthened with Debt to Equity decreasing from 52.3% to 36.5%’
Balance Sheet 6 MonthsJan 2000
$m
6 MonthJan 1999
$m
Change
$m
Comment
Inventory 250.2 230.3 +19.9
Debtors 74.4 286.6 -212.2 Securitisation of debtors
Property Plant & Equipment 431.7 379.6 +52.1 Adelaide, Chadstone
Other Assets 24.2 19.6
Total Assets 780.6 916.1
Represented by
Creditors & Provisions 213.6 177.2 +36.4 Higher inventories and timing
Borrowings 151.6 253.9 -102.3 Securitisation proceeds/capital return
Equity 415.5 -485.0 -69.5 Capital Return
Debt to Equity 36.5% 52.3%

18
‘Adelaide Central Plaza sale improves Debt to Equity to 20.6% on a pro-forma basis’Pro-forma Balance Sheet(After Sale of Adelaide)
6 MonthsJan 2000
$m
6 MonthJan 1999
$m
Change
$m
Comment
Inventory 250.2 230.3 +19.9
Debtors 74.4 286.6 -212.2 Securitisation of debtors
Property Plant & Equipment 365.8 379.6 -13.8 Chadstone
Other Assets 24.2 19.6
Total Assets 714.7 916.1
Represented by
Creditors & Provisions 213.6 177.2 +36.4 Higher inventories and timing
Borrowings 85.7 253.9 -168.2 Securitisation proceeds/capital return
Equity 415.5 -485.0 -69.5 Capital Return
Debt to Equity 20.6% 52.3%

Peter WilkinsonChief Executive

20
Growth
• Victoria and Western Australia– Underlying growth (Value Proposition)
• Food Business– Customer research positive
– Strong team
– Progress on leases
• E-Commerce– Significantly progressed, hampers success
– Pure plays v. “clicks and mortar”
– multi-channel
• Full strategy briefing “field day” in June

21
Outlook
• Environment in 2H will be impacted by GST– Positioned to handle any swings in demand
• Continue to trade in line with expectations
• Maximising Shareholder Value over-riding corporate objective