david t. butry, d. evan mercer, jeffrey p. prestemon,
TRANSCRIPT

November 200 1 - Journal of Forestry 9
David T. Butry, D. Evan Mercer, Jeffrey P. Prestemon,John M. Pye, and Thomas P . Holmes
We modeled and analyzed the economic impacts of the six weeks of large, catastrophic wild-fires in northeastern Florida in June and July 1998, among Florida’s most devastating in recenthistory. The result of the unusually strong El Niño-Southern Oscillation (ENSO) in 1998, theFlorida wildfires produced economic impacts of at least $600 million, similar in scale to recentcategory-2 hurricanes. Improved understanding of the interactions between management,wildfire, and its costs may yield large payoffs to society by identifying optimal interventionactivities.
Keywords: economics;fire management; Florida; policy
ldfires engender far-reach- such as timber and capital. However,ing costs and losses to soci- wildfires also can produce gains, for ex-ety. Government agencies ample, by sustaining fire-dependent
and private landowners spend money forested ecosystems.for presuppression and suppression ac- The increasing costs and damagestivities as wildfires damage the physical associated with wildfires during thestocks and productivity of resources, 1990s suggest a need to analyze the
amount we should spend to preventand suppress wildfires. Using the least-cost-plus-net-value-change criteria,Gorte and Gorte (1979) explained thatthe economically optimal amount ofpresuppression effort or expenditures isthe point at which they minimize thewildfire’s cost, including both presup-pression and suppression costs, plus thenet value change of the affected re-sources (the sum of all wildfire-inducedgains and losses).
Clearly, minimizing the economicimpacts of catastrophic wildfires re-
Above: Fire plumes in Florida as seen from theNASA GOES-8 satellite, June 6, 1998.

figure I. The locations of the June and July1998 wildfires in Florida are shown in red.The St. John’s River Water ManagementDistrict is outlined in black.
Average fire size Total fire area(acres) ( t h o u s a n d a c r e s )
2 5 0‘C2 0 0
- Average fire size
- Total fire area
1 5004 5 0
4 0 0
3 5 0
3 0 0
2 5 0
2 0 0
1 5 0
F i g u r e z . Average fire size and total fire area for Florida in June and July, all fuel types (federal landsexcluded), 1981-99.
quires careful calculation of all associ- sion expenditures averaged $500 mil-ated costs, losses, and gains. Neverthe- lion per year for the period 1994-99.less, we know of no organization in the Such totals, however, shed no light onUnited States that systematically and suppression expenditures for one fire orempirically quantifies economic im- set of fires to enable optimal suppres-pacts of wildfires. The National Intera- sion and prevention pol icies . Althoughgency Fire Center (2000) reported that a few analysts have expanded wildfirethe federal portion of wildfire suppres- cost accounting to include other eco-
nomic components of costs and netvalue change (e.g., Bellinger et al.1983; Mills and Flowers 1985; Price-w a t e r h o u s e C o o p e r s 1998), i n m o s tstudies net value change usually refersonly to timber losses (Gorte and Gorte1979).
Wildfires create both short- andlong-run economic impacts. Wherehuman populations are high and wild-fires are catastrophic, unique near-termlosses associated with large-scale localeconomic disruptions are often gener-ated. Long-term costs and losses are in-curred in vegetation management, rou-tine wildfire monitoring, and impactson timber and other forest values. Thesummer of 2000, when wildfiresburned more than 8 million acres inthe United States, is a testament to thepotential impact of wildfires on peopleand their economic systems. As humanpopulations increase, and as the num-ber of structures in and near wildlandsincreases over time, the costs and eco-nomic losses from occasional cata-strophic wildfires are l ikely to increase.Detailed analyses of the potential im-pacts of catastrophic wildfires areneeded to help the public and policy-makers better understand the potentialreturn to alternative presuppressionand suppression strategies to reducerisks and impacts of wildfires.
Wildfires of 1998The fire season of 1998 was the
most devastat ing in Florida’s recent his-tory. Approximately 500,000 acresburned, mostly in the forests of 18northeastern Florida counties (fig. I)that compose the St. John’s RiverWater Management District. Althoughthe actual number of fires in Florida(federal lands excluded) for 1998 wasbelow average (4,9 16 fires versus the5,720 average for the period 1981-99),more than twice the usual number ofwildfires occurred in the summermonths of June and July 1998 (2,255versus an average of 935). The 1998fires also were unusually large, averag-ing 200 acres in 1998 compared to 59acres in an average year, propellingtotal area burned to more than twicethe long-term average between 198 1and 1999 (Jig. 2).
The 1998 catastrophic wildfires
10 Journal of Forestry * November 2001

were caused in large part by theweather patterns associated with an un-usually strong (“super”) El Nifio-Southern Oscillation (ENSO), thecentral Pacific Ocean temperature fluc-tuation that affects weather patternsworldwide. ENS0 can be divided intothree recognizable phases-El Niiio,La Niña, and neutral (Green et al.1997)--all of which affect weather inFlorida. The El Niño phase is charac-terized by heavier-than-normal precip-itation in Florida, whereas the La Nifiaphase usually produces reduced levelsof precipitation or drought. The neu-tral phase, following an El Niiio-LaNifia oscillation, is typified by normalprecipitation patterns in Florida.
The ENS0 pattern of 1997-98 (fig.3) was atypical compared with otherENSOs because of the extraordinarilyhigh rainfall in Florida during the wetEl Niño portion of the cycle. Thequick return to the La Nifia phase wasalso atypical and created a severedrought. During the El Nifio phase(1997 and early 1998), vegetation ac-cumulated in northeastern Florida. ByApril 1998, when the drought tookhold, the vegetation dried up and be-came a large and hazardous fuel source.In late spring and early summer 1998,the Keetch-Bryam drought index, astandard measure of wildfire danger,flirted with the maximum possiblevalue of 800 for several weeks. Indeed,these conditions were so extreme thatbald cypress swamps and other lowlandforests burned more often than uplandtypes (Mercer et al. 2000).
In addition, the weather patternspresent under La Nifia and the result-ing fuel buildup changed the mix of ig-nition sources for wildfire. Typically,arson is the most common source ofwildfires in Florida. During the springand summer of 1998, however, light-ning was the most prevalent ignitionsource, with total strikes exceeding60,000 for the St. John’s River WaterManagement District from June tomid-July 1998.
Economic EffectsWe examine seven major categories
of costs and losses associated with cata-s trophic wildf ires: presuppression costs ,suppression costs , disaster rel ief expen-
N i b 3 sea su r facet e m p e r a t u r e a n o m a l y
(“(2
D e p a r t u r e f r o m n o r m a lm c n t h l y (1950-2ooo)
Fkdda rainfalll i nches~
El Nlfio n n
3
1 . 5
0
-1.5
- 1 9 9 7 1998
Figure 3. Nifio 3 sea surface temperature anomaly and departure from normal rainfall for Florida bymonth from May 1997 to December 1998. The El Nifio and La Niña phases are depicted in green andorange, respectively.
ditures, timber losses, property dam-age, tourism-related losses, and humanhealth effects. This list is by no meansexhaustive, as other potential costs andlosses may exist (e.g., lost wages, de-creased quality of life, higher long-runfirefighting expenditures, landscape re-habilitation, environmental degrada-tion). But examining these seven cate-gories al lows us to focus on data that isreadily available to produce a conserva-tive, lower-bound estimate.
Unlike much of the wildfire-vulner-able West, northeastern Florida is heav-ily populated, and private land owner-ship predominates. The wildfires of1998, therefore, required evacuationsof hundreds of thousands of peopleand destroyed private and public tim-ber resources. Because Florida, like theWest, is a popular tourist destination,the 1998 wildfires also disruptedtourism to popular attractions such asbeaches, Disney World, and a majorstock-car race. The smoke from thewildfires also posed a potential healthrisk to Florida’s large and vulnerable el-derly population. In the following sec-tion, we examine the economic scale ofeach of these impacts in Florida.
Timber losses. Natural catastrophessuch as wildfires can have short- andlong-term effects on timber markets.
Short-term effects (one to two years)include the immediate destruction ofvaluable standing timber and eco-nomic disequilibrium associated withthe flooding of markets with salvagedtimber. The glut of salvaged timber dri-ves prices downward temporarily,which affects owners of the killed tim-ber, owners of undamaged timber, andtimber consumers. Holmes’s 1991analysis of a major southern pine bee-tle outbreak in Texas and Louisiana,and Prestemon and Holmes’s 2000study of the effects of Hurricane Hugoin South Carolina document the short-run price drops caused by gluts of sal-vage material. Long-run effects on tim-ber markets can arise from the loss of alarge portion of standing inventory, aloss that tends to drive prices upwardfor extended periods and produce awindfall for owners of undamaged tim-ber. They also can create conditions fa-vorable for a contraction in timber de-mand. Prestemon and Holmes (2000)found that the elimination of morethan 10 percent of the inventory in aregion could drive up long-run prices,assuming no contraction in demand.Therefore, large-scale catastrophesoften redistribute wealth among pro-ducers and consumers and cause a neteconomic loss .
November 2 0 0 1 l Journal of Forestry 11
Timber Market Effects of the 1998 Wildfires in Florida
We quantified economic effects of the 1998 wildfires innorthern Florida’s southern pine sawtimber and pulpwoodmarkets (data limitations prohibit analyses of hardwood mar-kets impacts). The affected region corresponded closely toTimber Mart-South Area 1 (Norris Foundation 1998), sobase p r i ce es t imates were based on the T imber Mar t -Sou threport for Area 1 for the second quarter of 1998. We as-sumed that northern Florida timber prices moved in a waysimilar to price changes identified by Prestemon and Holmes(2000) for sawtimber and pulpwood stumpage in South Car-olina following Hurricane Hugo: a salvage glut period, inwhich prices were lower than they would have been withoutthe catastrophe, and a price rise after the salvage periodwas completed. The price rise after Hugo followed the lossof 16 percent of southern pine inventory in the coastal plainand ‘lower Piedmont ‘ofSouth Carolina. A similarscale of inventory loss wasexperienced in northernFlorida-14 percent of saw-timber inventory and 19 per-cent of pulpwood inventory(Mercer e t a l . 2000)--sothis price path seems justi-fied. Of the sawtimber andpulpwood inventories killedin Florida in 1998, landown-ers salvaged approximately24 percent and 23 percentof killed pine and hardwoodvolume, respectively. Thesesa lvage quant i t ies amountedto more than twice the aver-age annual removals for theregion, implying that bothpine and hardwood timber
P IP O
PI
and harvest quantities, we calculated the economic surplus(consumer and producer surplus effects) of the fires on thenorthern Florida economy. This approach was partial equilib-rium, ignoring any feedback effects that may occur betweenthe timber sector and other sectors.
markets faced gluts of salvage materials for several monthsafter the fires ended. Communications with experts in thefield revealed that the salvage period was over by mid- 1999.
A statistical analysis of the price effects of the Floridawildfires in the manner of Prestemon and Holmes (2000)was not possible, because we lacked a long time series ofobserved prices following the wildfires. As an alternative, weestimated the timber price changes by applying a structuraleconomic model: using supply-and-demand relationshipsavailable in the literature and data from Mercer et al. (2000)on inventory losses and salvage volumes. The price effectswere estimated by assuming a path of salvage volume andregular harvest volumes in northern Florida and then findingthe pure effects of the salvage glut and inventory reductionscaused by the fire on prices. In other words, we calculatedhow far observed prices in northern Florida should have de-parted from actual prices in the quarters following the fires.Using those price departure estimates, salvage volumes,
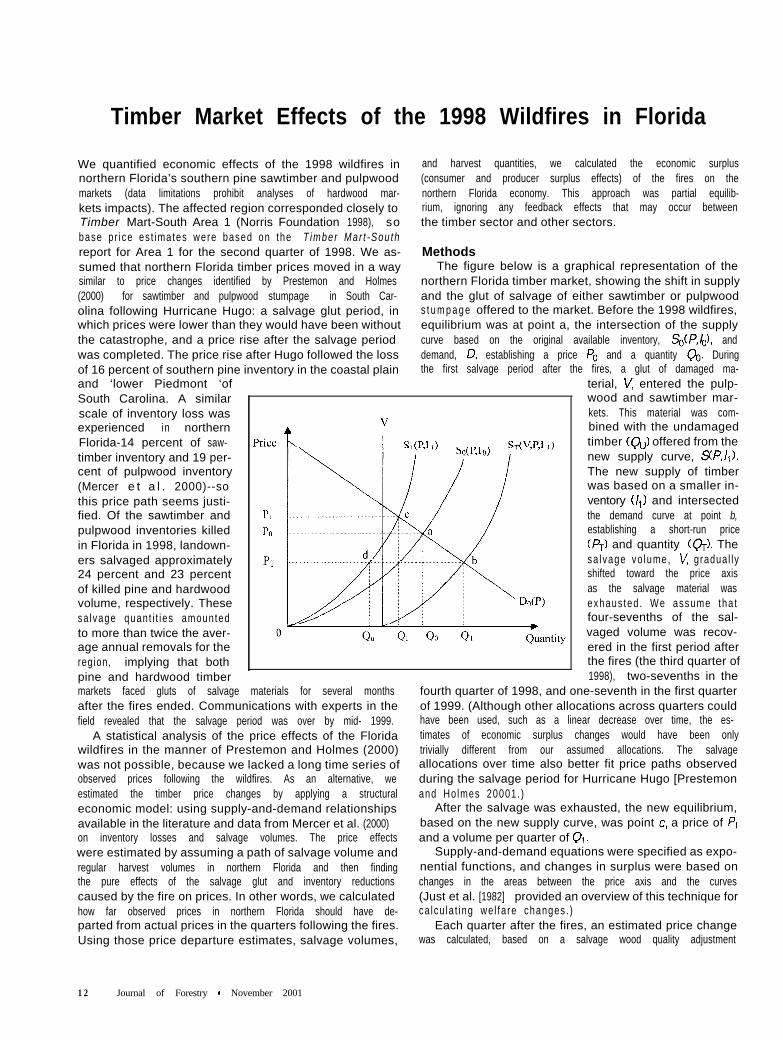
MethodsThe figure below is a graphical representation of the
northern Florida timber market, showing the shift in supplyand the glut of salvage of either sawtimber or pulpwoods t u m p a g e offered to the market. Before the 1998 wildfires,equilibrium was at point a, the intersection of the supplycurve based on the original available inventory, So(P,@, anddemand, D , establishing a price P O and a quantity Qo. Duringthe first salvage period after the fires, a glut of damaged ma-
terial, V, entered the pulp-wood and sawtimber mar-kets. This material was com-bined with the undamagedtimber ( f & I offered from thenew supply curve, S 7 P , ! 1 1 ) .The new supply of timberwas based on a smaller in-ventory (1,) and intersectedthe demand curve at point b,establishing a short-run price( 4 ) and quantity ( & I . Thesa lvage vo lume, V, g radual lyshifted toward the price axisas the salvage material wasexhaus ted . We assume tha tfour-sevenths of the sal-vaged volume was recov-ered in the first period afterthe fires (the third quarter of1998), two-sevenths in the
fourth quarter of 1998, and one-seventh in the first quarterof 1999. (Although other allocations across quarters couldhave been used, such as a linear decrease over time, the es-timates of economic surplus changes would have been onlytrivially different from our assumed allocations. The salvageallocations over time also better fit price paths observedduring the salvage period for Hurricane Hugo [Prestemonand Ho lmes 20001. )
After the salvage was exhausted, the new equilibrium,based on the new supply curve, was point c , a price of P Iand a volume per quarter of 91.
Supply-and-demand equations were specified as expo-nential functions, and changes in surplus were based onchanges in the areas between the price axis and the curves(Just et al. [1982] provided an overview of this technique forca lcu la t ing we l fa re changes . )
Each quarter after the fires, an estimated price changewas calculated, based on a salvage wood quality adjustment
12 Journal of Forestry * November 2001
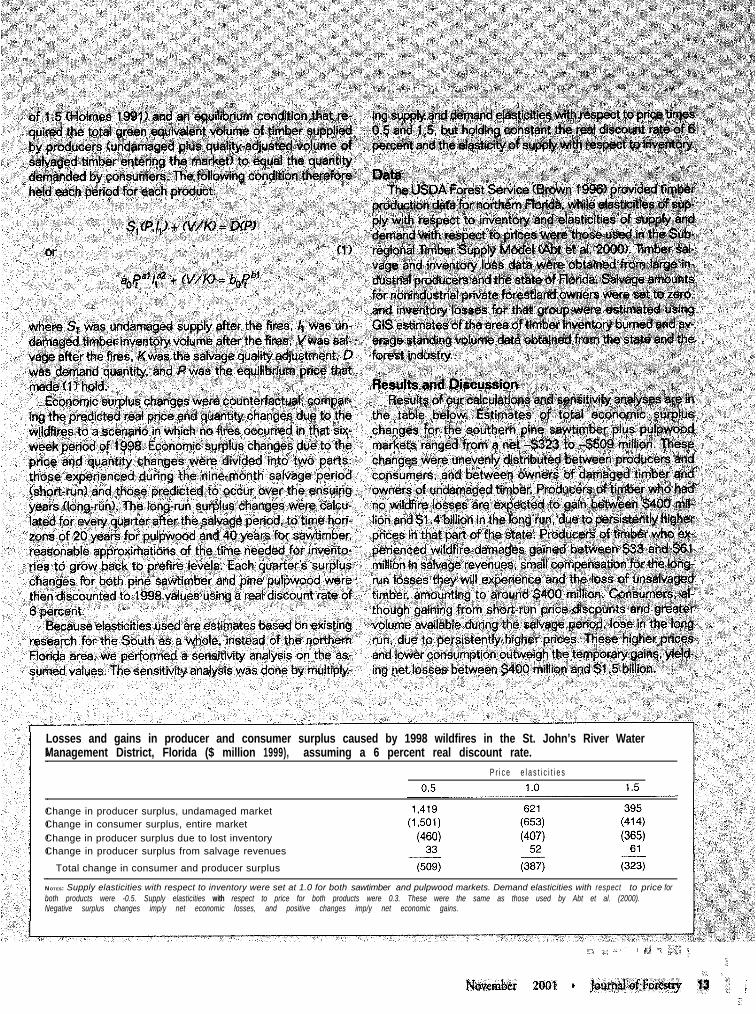
Losses and gains in producer and consumer surplus caused by 1998 wildfires in the St. John’s River WaterManagement District, Florida ($ million 1999), assuming a 6 percent real discount rate.
P r i c e e l a s t i c i t i e s
Change in producer surplus, undamaged marketChange in consumer surplus, entire marketChange in producer surplus due to lost inventoryChange in producer surplus from salvage revenues
Total change in consumer and producer surplus
NOTES: Supply elasticities with respect to inventory were set at 1.0 for both sawtimber and pulpwood markets. Demand elasticities with respect to price forboth products were -0.5. Supply elasticities with respect to price for both products were 0.3. These were the same as those used by Abt et al. (2000).Negative surplus changes imp/y net economic losses, and positive changes imp/y net economic gains.
c ; ; : \., ‘ , . : : r1 . * _ I; : . .;‘ i
(_ %
& e m b e r 2 0 0 1 * ~ ~ ~ ~ ~ ~ ~ ~ ~ $ 9 : :.̂

Table 1. Wildfire impact on summer tourism for counties in the St. John’sRiver Water Management District, Florida, June-August 1998.
Change in summerCounty h o t e l r e v e n u e
Alachua $ (403,181)Baker -
Brevard (4,599,488)C l a y ( 3 5 , 7 4 4 )
Duval 1,033,772F l a g l e r ( 4 4 2 , 1 4 8 )
Indian River (302,288)L a k e ( 3 3 0 , 6 7 6 )
Marion -Nassau ( 2 9 9 , 3 4 7 )
Okeechobee 28,883O r a n g e ( 48 ,835 ,556 )
Osceola 9,169,125P o l k ( 6 6 6 , 8 4 6 )
Putnam 129,424S t . J o h n ’ s (7 ,823 ,967)
Seminole 1,169,430V o l u s i a (8 ,790 ,112)
T o t a l $ ( 60 ,998 ,679 )
Change in summertourist spending T o t a l c h a n g e
$ (510,522) ^ $ ( 9 1 3 , 7 0 3 )- -
(5,823,976) (10,423,424)( 4 5 , 2 6 0 ) ( 8 1 , 0 0 4 )
1,308,997 2,342,769
( 5 5 9 , 8 6 2 ) (1,002,010)
(382,768) (685,056)( 4 1 8 , 7 1 3 ) ( 7 4 9 , 3 8 9 )
( 3 7 9 , 0 4 4 ) ( 6 7 8 , 3 9 1 )
36,573 65,456( 61 ,837 ,230 ) ( 1 1 0 , 6 7 2 , 7 8 6 )
1 1 , 6 1 0 , 2 5 6 2 0 , 7 7 9 , 3 8 1( 8 4 4 , 3 8 4 ) (1 ,511 ,230)
163,881 293,395(9 ,906 ,972) (17 ,730 ,939 )
i , 4 8 6 , 7 7 1 2 , 6 5 0 , 2 0 1(11 ,130 ,336 ) (19 ,920 ,448 )
$ ( 77 ,238 ,589 ) $ ( 1 3 8 , 2 3 7 , 2 6 8 )
fires produced between $322 and $509We calculated that the 1998 wild-
million in net losses to the Florida pinetimber market (for details, see “TimberMarket Effects of the 1998 Wildfires inFlorida,” p. 12). These losses excludethe hardwood timber market, where ef-fects are probably smaller but likelyamount to tens of millions of dollars.Because of data limitations, we did notestimate the economic effects of thewildfires on hardwood markets, buthardwood t imber inventory losses weresimilar in scale to softwood inventorylosses (Mercer et al. 2000). Differentsegments of society were unequally af-fected by the wildfires, and these dif-ferences were economically significant:Consumers lost $400 million to $1.5billion, owners of damaged timber lost$360 to $460 million, and owners ofundamaged timber gained $400 mil-lion to $1.4 billion.
fires in June, about $9.4 million (cov-lion annually. Before the major wild-
ering 377,936 acres) had been spenton prescribed fire in Florida in 1998.Total presuppression and vegetationmanagement expenditures may easilysurpass $12.7 million annually, as wedo not have data for other manage-ment activities aimed at wildfire riskreduction, such as thinning and herbi-cide treatments.
Costs of suppression and disaster relief:The Federal Emergency ManagementAgency (FEMA) approved wildfire sup-pression reimbursement and disaster re-lief aid to Florida in the wake of the1998 wildfires. FEMA originally autho-rized $50 million for the Fire Suppres-sion Assistance Program (FSAP), al-though the final tally was expected totop $100 million (this discussion drawsfrom Suiter and Copenhaver 1999).FSAP reimbursed state and local gov-ernments for 100 percent of their fire-f ighting costs , including wages for fire-fighting crews and the costs of theirgear, and the leasing of multiple fixed-wing aircraft, helicopters, fire engines,and bulldozers. FEMA disaster reliefexpenditures were expected to total $20to $25 million, with 25 percent repre-
Costs ofpresuppress ion andprescribedburning. Each year in Florida, approx-imately 506,000 acres of land are sub-jected to prescribed fire to reduce therisk of wildfire. Assuming a treatmentcost of $25 per acre, prescribed burn-ing in Florida costs federal, state, andprivate landowners about $12.7 mil-
senting state and local government dis-aster relief expenditures. Disaster reliefcovered the expenses of debris removal,relief centers, temporary housing, andcris is counsel ing.
Property losses. The 1998 wildfiresdamaged or destroyed 340 homes, 33businesses, and several cars and boats.These losses amounted to between $10and $12 million (Saunders 1998). Be-cause of data constraints , this est imateonly includes losses to insured prop-erty. Homes accounted for the major-i ty of the total property losses .
Tourism and trade losses. Comparedto previous years, tourism expendituresin northeastern Florida fell consider-ably below expected levels during thesummer months of 1998. While na-tionwide media coverage of the effectsof the 1998 wildfires-including re-ports on mandatory evacuations, exces-sive smoke, and road closures-dis-couraged travel to the state, the unusu-ally hot, dry conditions may also havereduced the attractiveness of Florida totourists . As we were unable to separateout the independent economic effect,if any, of merely bad weather ontourism, we assumed that al l the reduc-tions in tourism were the result of thewildf i res .
We stat ist ical ly tested for changes intourism during the 1998 wildfire sea-son for the 18 counties lying at leastpartially within the St. John’s RiverWater Management District. The sta-tist ical analysis of hotel revenue effectsused data from the Florida Depart-ment of Revenue’s transient rental(hotel) tax receipts, where revenuesequal the hotel tax divided by the cor-responding county hotel tax rate(Baker and Marion Counties were ex-cluded because they do not reporthotel taxes). The months of June, July,and August 1998 were analyzed, withAugust included to account for anylagged effects the fires may have had ontourism.
The change in tourism expenditureswas estimated by comparing predicted(without fire) with observed expendi-tures. The predicted level was deter-mined by multiplying 1997 tourismrevenues, as recorded by each includedcounty, by 1 plus the mean annual per-cent change occurring over the previ-
1 4 Journal of Forestry - November 2001

ous lo-year period. Calculations wereperformed separately for June, July,and August 1998. To determinewhether the change in gross sales from1997 to 1998 was statistically signifi-cant, the percent change was comparedto the 95 percent confidence intervalfor the average percentage change oc-curring in the previous 10 years foreach county. If the percent changefrom 1997-98 fell outside the confi-dence interval, it was determined to bestatistically significant.
The difference in tourism expendi-tures in June and July 1998 comparedto the previous 10 years was not statis-tically significant. August tourismlosses (792,19 1 hotel-room nights),however, were statistically significantcompared to the predicted revenues forAugust 1998 (p < 0.05). Reducedtourism resulted in an estimated $61million gross loss in hotel revenues andan estimated $77.2 million gross loss innon-hotel-related tourist spending.Most of these losses were experiencedby the hotels and businesses of Orange,Volusia, St. Johns, and Brevard Coun-ties
Health care costs. Air pollution emis-sions were estimated for the 1998 sum-mer wildfires by county (table 2), andthese emissions formed the basis for es-timating some of the economic effectsof the wildfires on health. Brevard, Fla-gler, and Volusia Counties accountedfor over 82 percent of the wildfire-related pollution. The Volusia CountyHealth Department and the FloridaDepartment of Health examined thefrequency of hospital visits for asthma,bronchitis, and other respiratory con-ditions between June 1 and July 6,1998. Sorenson et al. (1999) surveyedseven hospitals in Volusia County andone in Flagler County in 1998 andcompared admissions and emergencyroom visits for each county for thesame period in 1997. They found thatemergency room visits increased by 9 Ipercent for asthma and by 132 percentfor bronchitis with acute exacerbationduring the 1998 fire season.
Usually, this type of fine-scale healthdata is not recorded or easily accessible.Longer time series data would, amongother things, allow hypotheses to betested, such as whether and to what de-
Table 2. Wildfire emissions by county for the St. John’s River WaterManagement District, Florida, June-July 1998.
County Acres C a r b o n V o l a t i l eburned’ organics*
N i t r o g e nParticulates m o n o x i d e o x i d e
. . . . . &“S . . . . . . . . . . . . I . . . .
Alachua 6 , 7 8 4 5 1 9 4 , 2 7 4 7 3 3 1 2 2
Baker 6 6 5 5 1 4 1 9 7 2 1 2
Brevard 5 7 , 0 4 2 4 , 3 6 4 3 5 , 9 3 7 6 , 1 6 1 1 , 0 2 7
C l a y 6 , 9 6 2 5 3 3 4 , 3 8 6 7 5 2 1 2 5
Duval 8 , 4 3 8 6 4 6 5 , 3 1 6 9 1 1 1 5 2
F l a g l e r 9 5 , 8 0 9 7 , 3 2 9 6 0 , 3 6 0 1 0 , 3 4 7 1 , 7 2 5
I n d i a n R i v e r 3 0 2 1 9 3 1
Lake 8 8 2 6 7 5 5 6 9 5 1 6
Marion 9 7 3 7 4 6 1 3 1 0 5 1 8
Nassau 2 , 2 1 9 1 7 0 1 , 3 9 8 2 4 0 4 0
Okeechobee 1 , 2 7 4 9 7 a03 138 2 3
O r a n g e 6 , 7 0 4 5 1 3 4 , 2 2 3 7 2 4 1 2 1
Osceola 8 , 2 0 1 6 2 7 5 , 1 6 6 a 8 6 1 4 8
P o l k 7 , 0 9 4 5 4 3 4 , 4 6 9 7 6 6 1 2 8
P u t n a m 4 , 5 3 2 3 4 7 2 , 8 5 5 4 8 9 8 2
St. John’s 1 1 , 8 4 9 9 0 6 7 , 4 6 5 1 , 2 8 0 2 1 3
S e m i n o l e 2 , 0 4 6 1 5 7 1 , 2 8 9 2 2 1 3 7
V o l u s i a 1 6 1 , 3 2 9 1 2 , 3 4 2 1 0 1 , 6 3 7 1 7 , 4 2 3 2 , 9 0 4
T o t a l 3 8 2 , 8 3 3 2 9 , 2 8 7 2 4 1 , 1 8 5 4 1 , 3 4 6 6 , 8 9 4
‘ G r a s s y f u e l s e x c l u d e d .‘Expressed as methane.
gree wildfire size, intensity, or severityaffects the incidence of respiratory ail-ments. A complication may be that res-piratory ailments also are affected byother factors associated with the kindo f w e a t h e r experienced duringdroughts, such as increased levels ofdust, pollen, and fungal spores. Disen-tangling the specific effects of fire-cre-ated pollutants using empirical analy-ses is challenging, but respiratory prob-lems represent a tangible cost that canexceed thousands of dollars per patient,and these ailments traditionally targetsensitive populations such as childrenand the elderly.
We applied the findings of Sorensonet al. (1999) to calculate the economiceffects of the 1998 wildfires on health.We assumed that the observed in-creases in treatment for asthma andbronchitis were the direct result of thewildfires and that these increases oc-curred at the same rate in the remain-ing counties in the St. John’s RiverWater Management District (normal-ized for population differences). Theadditional asthma-related health care
expenditures due to wildfires rangedfrom $325,000 to $700,000. These ex-penditures included costs associatedwith emergency room visits, inpatientcare, outpatient care, and doctor’s of-fice visits. The majority of the expendi-tures stemmed from inpatient andemergency room care (because of datalimitations we examined asthma only).Cost per treatment was calculated bydividing total expenditures by thenumber of visits, from Weiss et al.(1992) and Smith et al. (1997), for in-patient care and emergency room vis-its. Weiss et al. and Smith et al. exam-ined a sample of asthma occurrences in1985 and 1987, respectively, and ex-trapolated to determine nationwide in-cidence and cost. To calculate the rangeof expenditures from outpatient anddoctor’s office visits, we assume thatthe ratio between inpatient and emer-gency room visits to outpatient and of-fice visits that occurred nationwide in1985 and 1987 also held for 1998. Weestimated that the wildfires caused theinpatient admission of 59 more peoplethan normal, at a cost of $2,200 to
November 2001 . Journal of Forestry 1 5

$6,300 per visit of roughly five days,and that an additional 686 patientswere treated in emergency rooms, at acost of $110 to $290 per visit. The firesalso produced 80 to 800 additionaldoctor’s office visi ts , at a cost of about$45 per visit, and 20 to 90 additionalincidents of outpatient care, at a cost of$80 to $400 per occurrence. Becauseof data limitations, these numbers donot include costs associated with t reat-ment for other conditions such asbronchitis, shortness of breath, wheez-ing, or other respiratory ailments thathave been shown to increase during thesix-week extreme wildfire season. Fi-nally, these estimates do not includeexpenses paid for medications or indi-rect costs from lost wages.
Discuss ionBased on this analysis, we predict
that the 1998 wildfires will cause netdamages of $300 to $500 million tothe pine timber market in Florida inthe long run. These are conservative es-timates, as they ignore both the hard-wood timber market and the generalequilibrium effects that changes in thetimber market have on the larger econ-omy. The additional $280 million inestimated nontimber economic lossesare also conservative estimates. Pre-scribed burning costs around $12.7million annually, but how much moreis being spent on other presuppressionmethods? FEMA considered the $100million in fire suppression and relatedsupport to be a minimum value. Wild-fire-related property losses of $10 to$12 million also provide a lower boundto actual losses, given that they do notinclude uninsured property losses, nordo they account for residents’ t ime andeffort spent cleaning up and repairingdamaged property. Tourism losses mayhave l ingered well past August and mayhave become more severe as cleanupcontinued and media attention per-sisted. Gross tourism revenue losses inAugust were almost as large as the com-bined losses of June and July.
Asthma-related healthcare costs,proxied as the cost of asthma treat-ment, were small compared to othereconomic losses. However, three im-portant points should be made beforewe discard them for economic insignif-
icance. First, it is possible that sociallyand politically important distributionaleffects exist, as sensitive populationsare harmed first. Weiss et al. (1992)found that almost half of all emergencyroom visits for asthma were to treatchildren. Second, these health effectswere only for the short-run costs oftreatment and do not include potentiallonger-term health impacts. Third,they do not account for the real costsassociated with pain and discomfortexperienced by all people who weresubject to smoky conditions.
Even given the conservative natureof our cost accounting for the 1998wildfires, the season’s total estimatedimpact, at $600 to $800 million, rivalsthe economic effects associated withcategory-2 hurricanes. The size of thisimpact underscores the importance ofa complete and accurate accountingand economic analysis of such cata-strophic events. In future studies ofcatastrophic losses from wildfire, werecommend a more detailed account-ing framework than that used currentlyby government agencies:
1. Because more than half of thetotal costs of the 1998 wildfires inFlorida were in timber losses, we sug-gest a more sophisticated evaluation oftimber market impacts. This evalua-tion should include a more detailedtally of inventory losses, salvage vol-umes by species, and salvage materialquality degradation, and it should in-clude an analysis of the long-term ef-fects on the forest sector.
2. We believe that an establishedsystem for monitoring wildfire smokeemissions in the vicinity of vulnerablepopulations and in conjunction withcareful monitoring of hospital admis-sion rates would enable analysts tomore accurately link smoke to healthimpacts .
3. A refined accounting frameworkshould include a system for performinga complete accounting of propertylosses, including both insured anduninsured. This is particularly impor-tant for evaluating the effects of suchevents in heavily populated areas andin areas where people have limited eco-nomic means.
The magnitude of our impact esti-mate highlights the need for mitigating
16 Journal of Forestry l November 2001
fire hazards, especially in areas wherepopulation is dense and in proximityto fire-prone forest ecosystems. Becauserelatively large expenses are incurred bywildfire suppression crews and emer-gency personnel to prevent the kinds ofeconomic losses detailed in this article,a better understanding of actual lossescan inform decisionmakers on the ap-propriate amount of suppression ex-penditures and presuppression expen-ditures (e.g., vegetation managementactivities). Enlightened wildfire policyand land-use decisions are unlikelywithout more complete and accurateaccounting of the costs and losses tosociety of wildfires.
literature CitedAiii, R.C., EW. Cwii\c;i-, dnd (;. l’A(:HI;CO. 2000.
Southern forest iebonrce assessment using the Subre-gional Timber Supply (SRTS) model. Forest l’roductr/otrn?a/50(4):25-33.
Bt:l, INGFR, M.D., H.F. K,\I\FI:, and H.A. HAI?I~I\ON.19X3. Economic efficiency of fire managemenr oninonfederal forest and range lands. Journal r~fFormry8 1(6):373-75.
BIIOWN, M.J. 1996. Form rturirticrjr Florida, 1995. Re-source Bulletin SRS-6. Asheville, NC: USDA ForestService.
GOKI t., J.K., and R.W. GOR-I F. 1979. Applictltion ofeco-nomic techniqm to,& mmagmmt: A mm reviewml cdu7tion. General Technical Report INT-53.Ogden. U’I‘: USDA Forest Service.
(kthv, PM., D.M. LI:GI.I.K, C.J. MIKANIIA V, and J.J.O’BKIIN. 1997. 7‘hp North American clirn~~t~~pnttcmnrnaociatrd zurth thr El NiAo-Southern Orrillution.COAI’S l’wjecr Reporr Series 97- 1 . T&~hassee:Florid‘~ Start Uniwsiry, Center for OceawAtmos-pheric Prediction Studies. Available online arwww.co~~ps.iiu.ed~lilibibookler/. Last accessed by sraffAugust LOO I.
HOI MI s, II! I 99 I, Price and welfare effects of cata-strophic forest damage from southern pine bcrtle epi-dcmio. i~omt Sciuncc .37(2):500-5 16.
JL>~I; R.E., l).L. H~JI.II+, and A.S. S C twiIr/. 1982. Ap-plied w$m e~or~ov~ic~ and public policy. EnglewoodClif&, NJ: Prentice Hall.
Ml.ilc,t II, D.E., J.M. PYI., J.P l’lli~\I’I~MON, D.‘I: B~IKY,and 711’ 1 IOI hf1.5. 2000. &~:;&r &tr of’c/lt~-atrophic u~ildfim. Research ‘liiangle Park, NC: USDAForeat Servicr, Southern Research Station, ForestrySciences I.,~boratory. AvGlahle online at www.rtp.srs.fs.fed.us/ecoi~ii~lih\idemOO1.hrm. L.ast accesed bystaff Augntr 200 I.
Joumnl ofAgricultural Economics X2( 1): 145-60.Pl~lctw~ri-r~riousi~c~~ol~~Rs. 1998. Econconomic /meis-
merit IJ~ 1998 Florida f;res, final report of contract#EDOO24268000024-12. Washington, DC: USDepartment of Commerce, Economic DevelopmentAdministration.
SAUNIXXS, J. 1998. Feds to absorb $145 million of fire-fighting cm. Florida &e~Union. Available onlineat www.jacksonville.com/tu-online/srories/O~O99~/met-2Alwildf.html. Last accessed by staff August2001.
SMITH, D.H., D.C. MAIONE, K.A. L~~WSON, L.J.OKAMOTO, C. BXITIS~A, and W.B. SAUNLXRS. 1997.A national estimate of the economic costs of asrhma.American Journal of Respiratory Critical Cure Medicine156:787-93.
SOKENSON, B., M. Fuss, Z. MULLA, W. BIGLER, S.WIERSMA, and R. HOPKINS. 1999. Surveillance of
morbidity during wildfires-central Florida 1998.Morbidity and Mortaliq Weekly Report48(4):78-79.
Sun IX, L., and COP~NHAVFK, J. 1999. Statements madear dn appearance before rhe US House of Representa-tives Committee on Resources, Subcommirtee onForests and Foresr Health and Commitwe on Trans-portation and Infrastructure, Subcommittee on Over-sight, Investigations, and Emergency Management.Avnilable online x www.fema.govilibraryilib1Oc.hrm.Last accessed by staff Augusr 2001.
Wtxs, K.B., l?J. GIKXN, 2ndT.A. HOIXXON. 1992. Aneconomic evaluarion of asthma in the United Stares.New England Journal ofMedicine 326~862-66.
David 7: Butry ([email protected]) iseconomist, D. Evan Mercer is researcheconomist, Jefiey I? Prestemon is researchforester, John M. Pye is ecologist, andThomas I? Holmes is research forester,Disturbance Economics Research Team,USDA Forest Service, Southern ResearchStat ion, IQ Box 12254, Research Trian-g/e Park, NC 27709. This research waspartially $nded by a 1999 Joint FireScience Program grant t i t led “Ecologicaland Economic Consequences of the 1998Florida WiUjres”and by a National FirePlan-funded study titled ‘Ympact ofWildjre on Local Economies. ”
Noven~ber 2001 . Journal of l%restry 1 7