david w. taylor naval ship ^^ research and …
TRANSCRIPT
D » \M Ci K.C)C - ^o^/ Ul J> N,EP ISy^
Hi
><
QZ<
2OHO
O LUZ Q
u
3 UJ
Si.C/> O
o
.03nd.
?^I^13
DAVID W. TAYLOR NAVAL SHIP ^^
RESEARCH AND DEVELOPMENT CENTERBethetda, Maryland 20084
WHODOCUMENTCOLLECTION
THE EFFECTS OF HULL PITCHING MOTIONS AND WAVES
ON PERIODIC PROPELLER BLADE LOADS
by
Stuart D. Jessup
Robert J. Boswell
APPROVED FOR PUBLIC RELEASE: DISTRIBUTION UNLIMITED
Presented at the
Fourteenth Symposium on Naval HydrodynamicsThe University of Michigan
Ann Arbor, Michigan, 23-27 August 1982
SHIP PERFORMANCE DEPARTMENTRESEARCH AND DEVELOPMENT REPORT
September 1982 DTNSRDC-82/093
,
^ J

MAJOR DTNSRDC ORGANIZATIONAL COMPONENTS
DTNSRDC
COMMANDER00
TECHNICAL DIRECTOR01
OFFICER-IN-CHARGECARDEROCK
05
SYSTEMSDEVELOPMENTDEPARTMENT
SHIP PERFORMANCEDEPARTMENT
15
STRUCTURESDEPARTMENT
17
SHIP ACOUSTICSDEPARTMENT
19
OFFICER-IN-CHARGEANNAPOLIS
04
AVIATION ANDSURFACE EFFECTSDEPARTMENT
16
COMPUTATION,MATHEMATICS AND
LOGISTICS DEPARTMENT18
PROPULSION ANDAUXILIARY SYSTEMS
DEPARTMENT27
SHIP MATERIALSENGINEERINGDEPARTMENT
28
CENTRALINSTRUMENTATIONDEPARTMENT
29
MniALnTWSRDf: :i>IR0/43b (Rev. 2-80)

UNCLASSIFIEDSECUftlTY CLASSIFICATION OF THIS PAGE (When Data Entered)
REPORT DOCUMENTATION PAGE READ INSTRUCTIONSBEFORE COMPLETING FORM
1. REPORT NUMBER
DTNSRDC-82/0932. GOVT ACCESSION NO 3. RECIPIENT'S CATALOG NUMBER
4. TITLE (and SublllU)
THE EFFECTS OF HULL PITCHING MOTIONS AND WAVES ONPERIODIC PROPELLER BLADE LOADS
'W 'H'"GP f
^
{ POCUMFNTPERFORhlNGORG. REPORT NUMBEORG. REPORT NUMB
COLLECTION7. AUTHORfe;
Stuart D. JessupRobert J. Boswell
8. CONTRACT OS GRANT NUME
PERFORMING ORGANIZATION NAME AND ADDRESS
David W. Taylor Naval Ship Researchand Development CenterBethesda, Maryland 20084
10. PROGRAM ELEMENT PROJECT, TASKAREA a WORK UNIT NUMBERSTask Area S0379-SL001Task 19977Work Unit 1544-350
II. CONTROLLING OFFICE NAME AND ADDRESS
Naval Sea Systems Command (05R)
Ship Systems Research and Technology GroupWashington, D.C. 20362
12. REPORT DATE
September 1982
13. NUMBER OF PAGES
62
14 MONITORING AGENCY NAME & ADDRESSCy/ dlllerent Irom Controlling Ollice)
Naval Sea Systems Command (56X4)
Propulsion Lineshaft Equipment DivisionWashington, D.C. 20362
IS. SECURITY CLASS, (ol this report)
UNCLASSIFIED
16. DISTRIBUTION STATEMENT (ol this Report)
APPROVED FOR PUBLIC RELEASE: DISTRIBUTION UNLIMITED
17. DISTRIBUTION STATEMENT (of the abstract entered In Block 20, It dlllerent Irom Report)
18. SUPPLEMENTARY NOTES
Presented at the Fourteenth Symposium on Naval Hydrodynamics, The
University of Michigan, Ann Arbor, Michigan, 23-27 August 1982.
KEY WORDS (Continue on reve
Marine PropellerLoadsPropulsionModel ExperimentsPropeller Research
aide II neceaaary and identity by block number)
Unsteady LoadsWavesDynamic Pitching
ABSTRACT (Continue on reverse side it necessary and identity by block number)
Fundamental investigations were made of the effects of periodic hull
pitching motions and waves on the periodic loads on propeller blades and
bearings. These periodic loads were measured during carefully controlledmodel experiments in which the periodic hull pitching motions, regular waves,
and relative phase of the hull pitching to the wave encounter were system-atically and independent].y v.aried. The periodic blade loads were calculated
(Continued on reverse side)
DD 1473 EDITION OF 1 NOV 65 IS OBSOLETES/N 0102-LF-014-6601
UNCLASSIFIEDSECURITY CLASSIFICATION OF THIS PAGE (When Data Bnlared)

UNCLASSIFIEDSECURITY CLASSIFICATION OF THIS PAGE (Whan Data Entered)
(Block 20 continued)
using trochoidal wave velocity profiles, and representation of the pro-peller based on a quasi-steady method.
The results of both theory and experiment show significant modula-tion of the amplitudes of the periodic blade loads with hull pitchingmotions and wave frequency of encounter. Further, the experiments con-firm the theoretical assumption that the individual influences of thewave velocity profile and the induced velocities due to vertical hullmotions can be linearly superimposed. The influence of the hull signifi-cantly modifies the amount of modulation of the shaft frequency loads due
to both the periodic vertical motion of the propeller and the trochoidalwave velocity profile in the absence of the hull. However, trends of shaft
frequency loads are well predicted by simple periodic variations of the
velocity into the propeller, and a simple quasi-steady representation of
the propeller. Trends of the results are shown to be consistent withavailable full-scale data. Therefore, for engineering purposes, the
modulation of blade loads due to waves and hull motions for transom typehulls can be estimated by simple trochoidal wave velocity profiles, quasi-steady propeller theory, and constant multiples derived from the experi-ments presented in this paper.
UNCLASSIFIEDSECURITY CLASSIFICATION OF THIS PAGErWien Data Entered)

TABLE OF CONTENTS
Page
LIST OF FIGURES iv
LIST OF TABLES v
ABSTRACT 1
INTRODUCTION 1
EXPERIMENTAL TECHNIQUES 4
DYNAMOMETRY 4
HULL PITCHING AND WAVE SIMULATION 4
EXPERIMENTAL CONDITIONS AND PROCEDURES 5
DATA ACQUISITION AND ANALYSIS 7
ACCURACY 8
DISCUSSION OF EXPERIMENTAL RESULTS 9
LOADING COMPONENTS 9
CENTRIFUGAL AND GRAVITATIONAL LOADS 10
INFLUENCE OF DYNAMOMETER BOAT 10
OPERATION IN CALM WATER WITHOUT HULL PITCHING 11
OPERATION IN CALM WATER WITH HULL PITCHING 13
Time-Average Loads Per Propeller Revolution 17
Periodic Loads 17
Peak Loads 18
OPERATION IN WAVES WITHOUT HULL PITCHING 19
Time-Average Loads Per Revolution 23
Periodic Loads 23
Peak Loads 24
OPERATION IN WAVES WITH HULL PITCHING ^25
DISCUSSION 28
SUMMARY AND CONCLUSIONS 29
ACKNOWLEDGMENTS ; 30
REFERENCES 30
NOTATION 32
ili

LIST OF FIGURES
Page
1 - Hull and Propeller Geometry 34
2 - Components of Blade Loading 35
3 - Hull and Dynamometer Boat 36
4 - Block Diagram of SERVOMECHANISM for Pitching Model at SpecifiedPhase Relative to Waves 37
5 - Experimental Data Showing Plus and Minus 1.96 Standard Deviationson Measured Values of F 37
X
6 - Distribution of Wake in Propeller Plane 37
7 - Open-Water Characteristics of DTNSRDC Model Propellers 4710and 4711 38
8 - Influence of Extraneous Signals on Measured Loads 38
9 - Experimental Data Showing Extraneous Higher Harmonics . 39
10 - Variation of Experimental Hydrodynamic Loads with Angular Positionfor Simulated Propulsion in Calm Water without Hull Pitching 39
11 - Variations of Hydrodynamic Loads with Hull Pitch Cycle forOperation in Calm Water 40
12 - Variation of Fx with Blade Angular Position for Hull Pitching in
Calm Water Showing Portions of the Hull Pitch Cycle withExtremes of Peak Loading 41
13 - Afterbody of Hull Showing Propeller Disk 41
14 - Variations of the Harmonic Amplitudes of F^^ During the Hull PitchCycle in Calm Water 42
15 - Variations of Hydrodynamic Loads with Location in Wave Cycle forOperation Without Hull Pitching 43
16 - Variation of F^ with Blade Angular Position for Operation in
Waves Without Hull Pitching Showing Selected Locations in
Wave Cycle Illustrating Extremes of Variation in Loading 44
17 - Variations of Harmonic Amplitudes of Fx During Wave CycleWithout Hull Pitching 45

Page
18 - Comparison of Hydrodynamic Blade Loads for Operation in Waves withHull Pitching with Values Obtained from Linear Superposition ofIncreases due to Pitching Only and Increases Due to Waves Only 46
19 - Maximum Absolute Values of Blade Loads for Various Values of
^A> ^a/^pp ^^^ $^-$\j( Derived from Linear Superposition ofIncreases due to Pitching Only and Increases due to
Waves Only 48
LIST OF TABLES
1 - Experimental Conditions 49
2 - Time-Average Hydrod3mamic Loads for Operation in Calm Waterwithout Hull Pitching 49
3 - Comparison of Measured F with Other Transom-Stern Configurationsfor Operation in Calm Water with Hull Pitching 50
4 - Summary of Maximum Values of Hydrodynamic Loads for Operation in
Calm Water with Hull Pitching 51
5 - Summary of Maximum Values of Hydrodynamic Loads for Operation in
Waves without the Hull Pitching 52


THE EFFECTS OF HULL PITCHING MOTIONS AND WAVES ON PERIODIC
PROPELLER BLADE LOADS
Stuart D. Jessup and Robert J. Boswell
David W. Taylor Naval Ship Research and Development Center
Bethesda, Maryland 2008A
ABSTRACT
Fundamental investigations were made of the effects of periodic
hull pitching motions and waves on the periodic loads on propeller
blades and bearings. These periodic loads were measured during care-
fully controlled model experiments in which the periodic hull pitching
motions, regular waves, and relative phase of the hull pitching to the
wave encounter were systematically and independently varied. The peri-
odic blade loads were calculated using trocltoidal wave velocity pro-
files, and representation of the propeller based on a quasi-steady
method
.
The results of both theory and experiment show significant modula-
tion of the amplitudes of the periodic blade loads with hull pitching
motions and wave frequency of encounter. Further, the experiments con-
firm the theoretical assumption that the individual influences of the
wave velocity profile and the induced velocities due to vertical hull
motions can be linearly superimposed. The influence of the hull sig-
nificantly modifies the amount of modulation of the shaft frequency
loads due to both the periodic vertical motion of the propeller and the
trochoidal wave velocity profile in the absence of the hull. However,
trends of shaft frequency loads are well predicted by simple periodic
variations of the velocity into the propeller, and a simple quasi-
steady representation of the propeller. Trends of the results are
shown to be consistent with available full-scale data. Therefore, for
engineering purposes, the modulation of blade loads due to waves and
hull motions for transom type hulls can be estimated by simple trochoi-
dal wave velocity profiles, quasi-steady propeller theory, and constant
multiples derived from the experiments presented in this paper.
I. INTRODUCTION
The mechanisms by which rough seas and resulting ship motions
influence the time-average and periodic loads on propeller blades and
propeller shafts and bearings are complex. Factors include the in-
creased time-average propeller loading due to increased hull resistance
and the increased periodic loading resulting from the influence of the

free surface and modification of the flow pattern into the propeller
disk. This flow pattern is influenced by (1) direct orbital velocitiesfrom the ocean waves, (2) relative velocities of the propeller due to
ship motions, and (3) modification of the hull wake pattern due to theship motions in the rough sea.
In general, the rough sea modulates the amplitudes of the periodicloadings on the propeller blades and bearings from the correspondingvalues in calm water. The periodic loads on individual blades, includ-
ing modulation by a rough sea, must be considered in the design of the
propeller blades from consideration of fatigue. This is especially
important for controllable pitch (CP) propellers. Periodic bearingforces, including modulation by a rough sea, are important for consid-
eration of ship vibration, especially in the main propulsion system,
noise, and fatigue strength of components of the main propulsion system.
Extreme modulation of the periodic thrust in the main propulsion shaft-
ing can result in reversals of the thrust on the main thrust bearing
which can cause extensive damage.
Procedures for calculating periodic propeller blade and bearing
loads in calm water are reasonably well refined. These procedures have
been summarized by Boswell et al. (1968, 1981), Breslin (1972), and
Schwanecke (1975)
.
Procedures for calculating the blade and bearing loads in a seaway
are much less refined than for steady operation in calm water. Lipis
(1975) and Tasaki (1975) review the mechanisms and procedures for pre-
dicting the effect of the seaway on periodic bearing forces which, in
principle, also apply to unsteady loading on an individual blade. Keil
et al. (1972), Watanabe et al. (1973), and Lipis (1975) present data
from strain measurements on the blades of full-scale propellers in both
calm and rough seas. Gray (1981) presents the modulation of blade rate
hull vibration due to ship motion in a seaway.
These existing data and procedures provide valuable information
regarding increases in periodic blade and bearing loads due to operation
in a seaway. However, they address the overall complex problem in a
statistical manner including the net influence of a complex sea state,
complex ship responses, and numerous interactions. However, to the
authors' knowledge, before the present study there were no experimental
measurements of periodic loads on individual propeller blades that
demonstrated the influence of waves and ship motions in a controlled
environment
.
An extensive systematic model experimental program was undertaken
to obtain fundamental information on the influences of rough water and
ship motions on periodic propeller blade loads on high speed open-shaft
transom stern configurations. The experiments were conducted under
carefully controlled idealized conditions in which sinusoidal hull pitch-
ing motions and regular head waves were independently varied. Experi-
ments with hull pitching were conducted on three hull forms, two of
which were reported previously by Boswell et al. (1976a, 1976b, 1978)
and Jessup et al. (1977), and the third of which is presented in this
paper. Restrained model experiments in waves, including forced sinus-
oidal pitching of a model in waves, were conducted on only one model,
and are presented in the present paper. Experiments were conducted in

calm water with no ship motions, in calm water with forced sinusoidalpitching of the hull, in regular waves with no ship motions, and inregular waves with forced sinusoidal pitching of the hull at the fre-quency equal to the wave frequency of encounter. The experiments withforced hull pitching in waves were run over a range of relative phasesbetween the hull pitching and the wave encounter. Six components ofblade loads were measured during the dynamic conditions simulated.
The modulation of the blade load variation was correlated with pre-dictions calculated from trochoidal wave theory and the periodic verti-cal motion of the hull. The assumption of superposition of the effectsof pitching and waves was evaluated. Trends of modulations of theperiodic bearing loads were determined from the modulations of thepertinent harmonics of the single-blade loads.
The objective of these experiments was to obtain accurate system-atic experimental data showing the effects of hull pitching and waves onperiodic and time-average blade loads under carefully controlled experi-mental conditions so that the effects of ship motions and waves on peri-odic and time-average blade loads could be isolated. It is anticipatedthat these data will serve as a basis for developing procedures for cal-culating periodic and time-average blade loads for operation in a com-plex sea state.
In these experiments the model speed and propeller rotational speedwere held constant at the values corresponding to operation in calm waterwith no ship motions. In practice, when a ship operates in rough seasthe ship speed and propeller rotational speed at a given delivered powerdecrease from the corresponding values in calm water due to increasedshaft torque resulting from increased resistance of the hull and changein the propulsion coefficients (involuntary speed loss) (Lewis, 1967,Oosterveld, 1978, Day et al. , 1977) . Furthermore, in rough seas thedelivered power is often deliberately reduced from the calm water value(voluntary speed loss) as discussed by Day et al. (1977) and Lloyd andAndrew (1977) . Therefore, the difference in blade loads between opera-tion in calm seas and operation in rough seas can be represented asbeing made up of two major parts:
1. Differences in loads resulting from the difference in shipspeed and propeller rotational speed between calm seas and rough seas,
and2. Increases in loads due to the direct influence of waves and
ship motions at a given value of ship speed and propeller rotationalspeed.
The changes in propeller rotational speed, ship speed, and Taylorwake fraction due to operation in rough seas can be estimated experi-mentally or theoretically using methods or data summarized by Oosterveld
(1978), Day et al. (1977), and Lloyd and Andrew (1977). The resulting
changes in periodic blade loads can be estimated based on the systematic
experimental data or theoretical methods described previously by Boswell
et al. (1976a, 1976b, 1978). The experiments described in the present
paper provide information on the direct influence of the waves and ship
motions on periodic and time-average blade loads.

II. EXPERIMENTAL TECHNIQUES
A. Dynamometry
All experiments were conducted using the hull and propeller shovmin Figure 1 on Carriage II at the David W. Taylor Naval Ship Researchand Development Center (DTNSRDC) , using basically the same dynamometryand hardware described by Boswell et al. (1976a, 1976b, 1978). Thestarboard propeller, on which blade loads were measured, was located in
its proper position relative to the model hull but was isolated fromthe hull and driven from downstream (see Figure 2). This downstreamdrive system was necessary in order to house instrumentation required to
obtain the frequency response characteristics of the system for measur-ing unsteady loading.
The sensing elements were flexures to which bonded semi-conductorstrain-gage bridges were attached. The design of these flexures hasbeen described by Dobay (1971) . Three flexures were necessary to meas-ure all six components of force and moment. Flexure 1 measured F^ andMy, Flexure 2 measured Fy and l-tx, and Flexure 3 measured Fz and Mz ; seeFigure 3. The flexures were mounted inside a propeller hub specificallydesigned for these experiments. Only one flexure could be mounted at a
time because of space limitations, and this necessitated three duplicateruns for each condition. The flexure calibration procedure was identi-cal to that described by Boswell et al. (1976a, 1976b, 1978).
The port propeller, on which blade loads were not measured, wasdriven from inside the model hull as would be the case in a self-propul-sion experiment. The propeller rotational speed, which could be con-trolled independently of the starboard propeller, was measured via a
toothed gear pickup and recorded on a digital voltmeter. The time-average thrust and torque were measured for selected runs by a trans-mission dynamometer.
B. Hull Pitching and Wave Simulation
The downstream body which housed the drive system was modifiedfrom the configuration used by Boswell et al. (1976a, 1976b, 1978) so
that it could be operated fully submerged. This was necessary in the
present experiment because the large shaft angle necessitated deep sub-
mergence, and the operation in waves caused an additional disturbanceto the water surface. The modifications included a waterproof housingfor the drive motor, waterproof electrical cables and connectors, re-
moval of the upper apron which had extended the sides of the boat, and
the addition of a nonwaterproof top to the boat. Both the body housing
(the drive system was soft mounted to this body) and the model hull were
rigidly attached to a pitch-heave oscillator which was driven by a
hydraulic cylinder. The pitch-heave oscillator was rigidly mounted on
the towing carriage. This arrangement enabled the model hull and the
drive system to be dynamically pitched together while maintainingindependent support from one another.

For operation in waves, regular head waves were generated by apneumatic wavemaker (Brownell et al., 1956). The level of the watersurface was measured as a function of time by a pulsed ultrasonic probethat was mounted on the carriage; see Figure 4. The output of thisprobe, which was filtered using a low pass filter to remove the influ-ence of small irregularities in the water surface, yielded the amplitudeand frequency of encounter of the wave.
For operation with forced dynamic pitching of the model hull inwaves, a servomechanism was used to ensure that the pitching of themodel hull maintained the desired phase relative to the wave at thepropeller throughout the experimental run. Figure 4 presents a schema-tic diagram of this servomechanism. In this servomechanism, a servo-control unit subtracts the feedback signal from the hydraulic cylinder,ep, from the signal from the wave height probe, e^, and sends this dif-ference signal, or servo signal eg, to the servo valve. Based on thisservo signal, es, the servo valve slightly adjusts the frequency of thehydraulic cylinder so that eg seeks the null signal. When eg is null,ep is in phase with e^; that is, the pitching is in phase with thewaves. With this system small corrections to the frequency of the hy-draulic cylinder are made continuously to maintain eg near the null, andthus to maintain the pitching of the model in phase with the waves. Thephase of the wave at the propeller plane was varied relative to thephase of the model pitching by moving the wave height probe used in theservomechanism forward or aft a prescribed distance relative to the
plane of the propeller. For example, for setting the phase of the
pitching, $^, equal to the phase of the wave at the propeller plane, $,,the wave height probe was placed in the propeller plane. For setting
*^ - $i|;= 90 degrees, the wave height probe was placed a three-quarters
of a wavelength forward of the propeller plane.
A second wave height probe, which was not used in the servomechanism,remained in the propeller plane for all conditions. The output of this
probe was input for the computer and served as a reference for analyz-
ing the blade force and moment data as a function of position in the
wave cycle. In all cases, the wave height probes were placed suffi-
ciently far from the model in the transverse plane so that the model did
not disturb the water surface at the points at which the water levels
were measured
.
C. Experimental Conditions and Procedures
Experiments were conducted at several conditions including steady
ahead operation in calm water with no ship motions, simulated periodic
pitching of the hull in calm water, operation in regular head waves
without pitching of the hull, and operation in regular head waves with
periodic pitching of the hull. All conditions were run with the model
hull rigidly attached to its support, with no freedom to sink or trim,
and with essentially equal rotation on the port and starboard propel-
lers.

The basic condition, which simulates steady ahead self-propulsionin calm water with no ship motions, is defined as Condition 1 in Table 1.
The propeller rotational speed, trim and draft at this condition wereobtained from model self-propulsion data. No cavitation occurred on themodel propeller at any model experimental condition described in thispaper.
Runs simulating hull pitching and/or the effect of waves were con-ducted at the same conditions as the run in calm water with no hullpitching, except that the hull pitch was varied and/or the model wasrun in waves (Conditions 2 to 6 in Table 1) . These experiments wereconducted for forced pitching of the model in calm water, for operationin regular head waves without pitching of the restrained model hull,and for forced pitching of the model for operation in regular headwaves. For forced pitching in waves, the phase of the wave at the pro-peller, il>j-, was varied relative to the phase of the hull pitching, ^^.Three relative phases were evaluated:
1. Wave crest at the propeller plane when the stern of the modelhull is pitched up at its maximum value, $^ - $^ = (Condition 4 inTable 1).
2. Wave crest at the propeller plane when the stern of the modelhull is pitched down at its maximum value, $j- - $^ = 180 degrees (Con-dition 5 in Table 1)
.
3. Wave crest at the propeller planes when the hull pitch is
passing through its mean value (^I^j^iax~ '^MIN^/^ from stern down to stern
up, $^ - $^ = 90 degrees (Condition 6 in Table 1).
For the unsteady hull-pitch simulation in calm water, the hull-pitch angle ij; was varied sinusoidally about the calm water equilibriumtrim angle i^n^j) with an amplitude ijj^ of 1.33 degrees and a frequencyf-^ of 0.8 hertz, f^L^/g'^ = 2.63. For operation in waves without thehull pitching, the model hull operated in regular head waves with a
single amplitude r,^ of 0.118 m (0.39 ft), ^a/^w = 0.019; a wavelength
% of 9.20 m (30.20 ft), 1^/% = 1.62; and a wave velocity Vy of
3.79 m/s (12.43 ft/s) . At the experimental model speed of 3.58 m/s(6.96 knots) the frequency of encounter is 0.8 hertz which is the same
as the model pitching frequency. Operation in waves with pitching of
the model hull necessitated a reduction in the amplitude of the pitchof the model hull and/or the amplitude of the waves from the afore-mentioned values in order to prevent flooding of the model hull. Theminimum amplitudes of the hull pitch and the waves were 0.67 degree and
75 mm (0.25 ft), respectively (see Table 1). The frequency of the hull
pitching and the frequency of encounter of the waves were both 0.8 hertz
for all experimental conditions with pitching and waves.
The selected amplitude and frequency of encounter of the waves,
and amplitude and frequency of the hull pitching were within the scaled,
predicted operating and response characteristics at full scale of an
equivalent transom-stern ship.
Air-spin experiments were conducted with all three flexures over a
range of rotational speeds in order to isolate the effects of

centrifugal and gravitational loading from hydrodynamic loading. Sup-plemental experiments were conducted to assess the influence of thedownstream dynamometer boat on the flow in the propeller plane. Thesesupplemental experiments consisted of wake surveys in the propellerplane in calm water without the hull pitching (Condition 1 in Table 1)
with and without the downstream body. These wake surveys yielded adirect measure of the change in the velocity distribution through thepropeller disk attributable to the downstream body.
D. Data Acquisition and Analysis
Data were collected, stored, and analyzed on-line using a mini-computer. A computer program was written with options for analyzingeach of the two basic types of runs: (1) operation in calm water with-out hull pitching, and (2) operating with periodic hull pitching and/oroperation in regular waves. Data were collected and analyzed in thesame manner as described by Boswell et al. (1976a, 1976b, 1978). For a
given run, the computer collected force, moment, propeller rotationspeed, model speed, hull pitch angle, and wave height at 4-degree in-crements of propeller angular position over 200 to 300 propeller revo-lutions.
For operation in calm water without hull pitching, the computerwas used to analyze and print the data. The average force and momentsignals for each 4-degree angular position were printed along with the
average model velocity and propeller rotation speed for the run. Thestandard deviation of the accumulated data for the run was also calcu-lated for V, n, and the force and moment signals at each position. Aharmonic analysis was performed on the force and moment data providingthe mean signal and amplitude and phase of the first 16 harmonics of
shaft speed.
For runs simulating hull pitching or waves, the force and momentdata were selectively analyzed over the range of pitch angles or waveheights measured. Initially, the values of pitch and wave height wereaveraged over each revolution of a given run. An analysis wasused to search through a series of similar runs extracting propeller
revolutions of force and moment data corresponding to prescribed values
of pitch or wave height with a prescribed slope and tolerance band.
Typically, 50 to 200 revolutions were averaged at each value of pitch or
wave height. Twenty-six positions in the pitch or wave cycle were
selected for analysis.For runs with pitching in waves, both the pitch angle and the wave
height were fed into the computer. The blade loading data could be
sorted based on either of these two signals. To check the proper phas-
ing between the two signals, the pitch and wave data were also analyzed
in the time domain. For each run, a strip chart record of the pitch
angle and wave height variation was printed, along with analysis of the
average frequency, amplitude and phase of the two signals. Runs with
consistent wave and pitching frequency, amplitude, and phases were
selected for blade loading analysis.

Final analysis was conducted after the experimental agenda wasrepeated for each of the three flexures representing the six componentsof blade load. Corrections for interactions between the various loadcomponents were performed for a representative condition in calm waterwithout hull pitching, as outlined by Boswell et al. (1976a, 1976b,1978) . The resulting load corrections were applied to all other condi-tions in the experimental agenda. The total loading components werecorrected for the centrifugal and gravitational loads to obtain thehydrodynamic loads. Corrections were also made to the mean loads toaccount for the influence of the d3mamometer boat.
E. Accuracy
The accuracy of the experiment was generally similar to that de-scribed by Boswell et al. (1976a, 1976b, 1978). During the experiments,the on-line analysis averaged data over many revolutions and computedstandard deviations of speed V, rotation speed n, forces, and moments,assuming a normal distribution in the variation of these quantities.From this, a variation in the measured quantities was calculated with a95 percent confidence level. Model speed V, and rotation speed n variedby +0.5 percent from calculated mean values. For the condition in calmwater with no hull pitching, the force and moment signals at each angularposition measured, varied by +2 to +10 percent of the calculated averagevalue. Figure 5 shows the measured variation in the raw F^ signal.Note that the variation in force at each angular position was greatestwhen the blade was nearest the model hull. The variation of the loadingcomponents during the pitching and wave conditions was +10 to +20 per-cent of the mean values at each angular position. These variations weregreater than the still water condition because each run was evaluatedover a certain tolerance range in pitch or wave height. It should benoted that the variations from the mean represent the band in which 95
percent of the measured data lie. The accuracy of the mean values cal-culated will be higher than the variations calculated.
Besides the fluctuation in signals occurring in a given run, theoverall accuracy of the data can be represented by the repeatabilitybetween different runs. An effort was made to set experimental condi-tions identically on repeat runs; however, the propeller rotationalspeed and model velocity were set by hand, so some variation was unavoid-able. The variation in the measured experimental conditions and theblade loading data for repeat runs is similar to that documented byBoswell et al. (1978) and Jessup et al. (1977) showing that the varia-tions in the mean forces and moments were +4 percent over all the runs.
As discussed in the section on data acquisition and analysis, foroperation with periodic pitching either with or without waves, the datawere sorted and analyzed based on instantaneous position in the pitchcycle, and for operation in waves without hull pitching, the data weresorted and analyzed based on instantaneous position of the propeller in
the wave cycle. For periodic pitching runs, selection of a propellerrevolution at a specified pitch angle ^ in the pitch cycle necessitateda tolerance of 0.05 degree to ij;; however, the average value of i^ for

which data were presented during the periodic pitching runs was generallywithin 0.02 degree of the target ij;. For runs in waves without hullpitching, the selection of a propeller revolution at a specified instan-taneous water level within the wave necessitated a tolerance of 5 mm(0.20 in.) of the target water level.
Considering all sources of error including deviations during a runand inaccuracies in setting conditions, the model scale forces andmoments presented in this paper are generally considered to be accurateto within (plus or minus) the following variations:
"max^ %AX
N (lb) N (lb) N-m (in-lb) N-m (in-lb)
Calm water without 0.4 (0.1) 0.9 (0.2) 0.02 (0.2) 0.05 (3.4)hull pitching
Pitching and/or 0.9 (0.2) 1.8 (0.4) 0.05 (0.4) 0.09 (0.8)waves
The values are somewhat more accurate for the runs in calm waterwithout pitching than for runs with pitching and/or waves, because theexperimental conditions could be controlled more precisely for runs incalm water without waves and the measured forces and moments were aver-aged over many more revolutions of the propeller. The time-averagevalues per revolution (based on 90 samples per revolution) are slightlymore accurate than the maximum values (based on one sample per revolu-tion) which took into account the variation with blade angular position.Further, the peak values may have been slightly influenced by the dyna-mic response of the flexures.
III. DISCUSSION OF EXPERIMENTAL RESULTS
A. Loading Components
The basic loading components are shown in Figure 2. For a right-hand propeller, as used in this case, the sign convention follows theconventional right-hand rule with right-hand Cartesian coordinatesystem.
Each component of loading is represented as a variation of the in-
stantaneous values with blade angular position, 9, and as a Fourierseries in blade angular position in the following form:
NE
n=lF,M(0) = (F,M) + E (F.M)^ cosCnG -
((j.^ ^^)^} (1)

In general, the loads consist of hydrodynamic , centrifugal andgravitational components. However, in this paper, only the hydrodynamiccomponent of blade loading is presented. The results considering totalloads showed the same trends as results including only hydrodynamicloads. Centrifugal and gravitational loads were measured to permit thehydrodynamic loads to be determined by subtracting the centrifugal andgravitational loads from the total experimental loads. The centrifugaland gravitational loads were, of course, independent of hull pitchingand waves since all conditions were run at the same propeller rotationalspeed, n.
B. Centrifugal and Gravitational Loads
Centrifugal and gravitational loads were determined from air-spinexperiments with each flexure over a range of rotational speed n. Thecentrifugal load, which is a time-average load in a coordinate systemrotating with the propeller, should vary as n . The time-average experi-mental data followed this trend. The gravitational load, which is afirst harmonic load in a coordinate system rotating with the propeller,should be independent of n. The first harmonic experimental datafollowed this trend.
The centrifugal and gravitational loads measured during these ex-periments agreed with the values determined by Boswell et al. (1981)
,
and the gravitational loads agreed with values deduced from the weightsof the blades and associated flexures. Therefore, these results willnot be repeated here.
C. Influence of Dynamometer Boat
The results of the wake survey with and without the downstream body(dynamometer boat) are presented in Figure 6. Harmonic analysis ofthese data indicate that the downstream body had only a small effect onthe circumferential and radial variations in the flow and only a smalleffect on the harmonic content of the flow. However, they also indicatethat the downstream body reduced the volume mean speed through the pro-peller disk by approximately 12 percent. These results are, of course,without the propeller in place.
The change in effective speed through the propeller due to thedownstream body was deduced from thrust and torque identities betweenthe mean thrust and torque measured during the blade loading experi-ments and mean thrust and torque measured during the corresponding self-propulsion model-experiment. These results, which include the effect of
the propeller, indicate that the downstream body reduced the effectivespeed through the propeller disk by approximately 14 percent; i.e.,without the body, (1-w.j.) = 1.00 and (1-wq) = 1.00, whereas, with the
body, (1-Wrj,) = 0.86 and (1-Wq) = 0.85. This agrees quite closely withthe 12 percent reduction in the volume mean speed due to the downstreambody as deduced from the wake surveys at the corresponding conditions.
10

Based on these results, it was concluded that the downstream bodyreduced the mean speed into the propeller by 14 percent for all con-ditions. These reductions are somewhat larger than the 12 and 5 percentreductions obtained by Boswell et al. (1976a, 1976b, 1978), respectively,in which essentially the same dynamometer boat was used behind othermodel hulls. However, in the earlier experiments the dynamometer boatwas not fully submerged.
The downstream body will disturb the location of the shed andtrailing vortex sheets from the propeller. This may influence theperiodic and time-average propeller blade loads. No correction was madefor this effect.
After the effects of centrifugal force were subtracted from themeasured loading components as discussed previously, the time-averagevalue per revolution of each hydrodynamic loading component was cor-rected for the downstream body as follows: From the me^asured hydrodyna-mic blade thrust (Fxj.) and hydrodynamic blade torque (>^) , effectiveadvance coefficients based on thrust identity (Jip) and torque identity(Jq) were deduced from the open water data (Figure 7) . These valueswere multiplied by (1/0.88) to obtain corrected values of J™_and Jq,_i.e., without the downstream body. The corrected values of Fxu and Mjj
were then obtained from the open water data at the corrected advancecoefficient Jj and Jq, respectively. It was assumed that the downstreambody dj^d not affect the radial centers of thrust F-^ and tangentialforce Fy„. Therefore,
M corrected = (F corrected/F measured) (M measured)'^n ^ ^ 'H
F corrected = (M corrected/M measured) (F measured)^H ^ ^ ^H
No corrections are^ made to F^^ and K^ for the effect of the down-stream body; however, F^^, M^ are small for all experimental conditions,as discussed later.
No correction for the effect of the downstream dynamometer boatwas made to the measured circumferential variations of the loading com-ponents. Calculations made by the methods of Tsakonas et al. (1974)
and McCarthy (1961) indicated that the influence of the downstream bodyalters the peak-to-peak circumferential variation of the loads by no
more than 2 percent.
D. Operation in Calm Water Without Hull Pitching
For operation in calm water without the hull pitching (Condition 1
in Table 1), Table 2 presents the time-average loads. Figure 8 presentsthe variation of the F^^ component of hydrodynamic blade loading withblade angular position, and Figure 9 presents the amplitude of the
first 25 harmonics of the F^^ component of hydrodynamic blade loading.Based on the dynamic calibration by Dobay (1971) , it was judged
that for all loading components the data are valid for the first 10
11

harmonics. In addition, the wake data show no significant amplitudesfor harmonics greater than the tenth. Therefore, all data and analysesexcept Figures 8 and 9 are based on reconstructed signals using thefirst 10 harmonics. The symbols shown in Figure 8 indicate unfilteredvalues determined from the experiment; each represents the average valueat the indicated blade angular position for over 200 propeller revolu-tions. The variation in measured values at a given angular position isdiscussed in the section on accuracy. The lines on Figure 8 indicatethat the variations of the signals with blade angular position areadequately represented by the number of harmonics retained.
The variations of all measured hydrodynamic loading componentswith blade angular position for simulated propulsion in calm water with-out hull pitching are shown in Figure 10. The amplitudes and phases ofthe harmonics of these loading components are presented in Figure 9.
These data show that for hydrodynamic loading the variation of allloading components was predominantly a once-per-revolution variation.The extreme values for all loading components, except Fz and Mz, occur-red near the angular position of the spindle axis, 6 = 114 and 270degrees; i.e., within 24 degrees of the horizontal. The propeller eval-uated has a projected skew angle at the tip of approximately 11 degrees;therefore at the positions of extreme loading the blade tip is withinapproximately 13 degrees of the horizontal. This suggests that thetangential component of the wake is the primary driving force; seeFigure 6. The extreme values of F^ and M^ occur within 20 degrees ofthe extreme values of the other components. The reason for this varia-tion in location of extreme values is not clear; however, it may bepartially due to experimental inaccuracy with the T^-^z flexure as dis-cussed by Boswell et al. (1976a, 1976b, 1978). Further the net stressesin the blades are generally less sensitive to the F^ and Mz componentsthan they are to the other force and moment components.
The results presented here for circumferential variation of hydro-dynamic loads follow trends similar to results presented by Boswell et
al. (1976a, 1976b) for a single-screw transom-stem configuration andresults presented by Boswell et al. (1978) and Jessup et al. (1977) fora twin-screw transom-stern configuration.
The circumferential variations and first harmonics of all loadingcomponents except F^ and Mz were substantially larger fractions of theirtime-average values for the condition evaluated here than they were forthe conditions evaluated previously on the models r^eported by Boswellet al. (1976a, 1976b, 1978). For example, (FxH^l/^xtj was 0.66 for thepresent case, 0.40 from Boswell et al. (1976) , and 0.52 from Boswell et
al. (1978). The differences in the ratios of the circumferential vari-ations of loads to the time-average loads for these three cases arisefrom many factors including the propeller time-average loading coef-ficients which are essentially independent of the unsteady loading, themagnitude of the circumferential variation of the wake (primarily the
amount of shaft inclination for the three cases under considerationhere) , and propeller geometry especially the blade width and pitch-diameter ratio. The ratio of the unsteady loading to the time-averageloading is useful for evaluating the unsteady loading of a given
12

propeller over a range of ship and propeller operating conditions; how-ever, this ratio is not a good parameter for comparing the unsteadyloadings on different propellers on different ships with different oper-ating conditions. Analytical calculations, not presented here, confirmthat the periodic loading components for operation in calm water withno ship motions should be larger fractions of the respective time-averageloading components for the propeller-hull combination described in thepresent paper than for those described by Boswell et al. (1976a, 1976b,
1978).
E. Operation in Calm Water with Hull Pitching
Figure 11 shows the variations of peak values per revolution, time-average values per revolution, and first harmonic values of the F^ and
Mx components of hydrodynamic blade loading with hull pitch angle ^
(Condition 2 in Table 1) . The Fy and My components showed similar vari-ations as in Figure 11, and the Fz and Mz components were found to berelatively independent of hull pitch, and therefore are not shown.
Table 4 summarizes the maximum absolute values of the peak loads, first
harmonic loads, and time-average load per revolution for operation in
calm water with hull pitching.Figure 11 shows the loading components at the individual pitch
angles analyzed. Spline curves were fit through the points shown. An
oscillatory behavior is shown in the peak and first harmonic loads at
the time when the hull is moving from stem-up to stern-down position.
This behavior was believed to be caused by observed slight transverse
oscillation of the dynamometer boat probably caused by vortex shedding.
This did not occur in the experiments described by Boswell et al. (1976a,
1976b, 1978) because the djmamometer boat was not completely submerged
in those experiments as it was in the present experiments. This be-
havior was believed to have no significance, since the model hull did
not oscillate transversely in a similar fashion. Therefore, this os-
cillation is faired out in the curves shown in Figure 11.
The time-average values per revolution for each of the two loading
components remained within 5 percent of their values in calm waterwithout hull pitching throughout the pitch cycle presented. The trends
in variations of the time-average values of the various components with
position in the pitch cycle are similar. The largest absolute valuesof the time-average values per revolution of all loading components
occurred near the time at which the hull pitch was passing through its
equilibrium value from stern-up to stern-down; i.e., near (ij; - ij^cvj)~
0, ^ <0.
The maximum absolute values of the peak loads increased by as much
as 22 percent relative to the time-average loads in calm water without
hull pitching above the corresponding peak loads in calm water without
hull pitching. Similarly, the maximum values of the first harmonic
loads increased by as much as 13 percent relative to the time-average
loads in calm water without hull pitching. The maximum absolute values
of both the peak loads and the first harmonic loads for all components
13

occurred approximately over the angular positions of 1A5 to 230 degreesIn the hull pitch cycle shown in Figure 11. This corresponds to theportion of the cycle in which the hull was passing through its equili-brium value from stem-up to stern-down; i.e., near (i|^ -
^l^cy)= 0, ^ <0.
This is the same portion of the pitch cycle during which the maximumtime-average values per revolution occurred; therefore, the maximumincrease in the time-average loads per revolution and the maximum in-crease in the unsteady loads per revolution tend to add (they are inphase relative to the hull pitch) to yield the maximum increase in peakloads. The smallest absolute values of time-average, peak loads, andfirst harmonic loads occurred near ijj - ^q^ as the hull passed from thestern-down to the stern-up portion of the cycle; i.e., (^ - i>(^) = 0,ii <o.
Figure 12 shows the variation of the ¥^ component with bladeangular position for times in the pitching cycle where the minimtim andmaximum peak loads occur. The effect of pitching motion is most extremeat blade position angles around 135 degrees, where the maximum bladeloading occurs. This explains why the time-average loads and the peakloads occur in phase during the pitching cycle.
The unsteady loads are important from consideration of fatigue ofthe propeller blades, and of the hub mechanism for controllable pitch(CP) propellers. Since a ship may operate for an extended period in a
rough sea, the effect of the ship motions, such as hull pitching, on
unsteady blade loads is significant. The difference between the peakload and the time-average load per revolution is a measure of the un-steady loading. With this difference as a measure of the unsteady load-
ing, the results with hull pitching showed that the unsteady hydrodyna-mic loading for the various components increased by 26 to 38 percentabove their corresponding values for iJj
= ij^^y without hull pitching.
This indicates that the effect of ship motions can significantly in-
crease the unsteady loading on the blades.The difference in the unsteady loading with and without the hull
pitching is probably due to an additional relative velocity componentarising from the motion of the hull during pitching. As the hull passes
through 4; = ^Q]^ the vertical velocity of the hull (and propeller) is a
maximum. As the hull goes from stern-up to stern-down through ij; = ^(^,the upward velocity component relative to the propeller plane tends to
increase above the values at fixed hull pitch at ii = 'J^cw* This tends
to increase the amplitudes of the first harmonic of the tangential
velocity, and thereby increase the unsteady loading (and increase the
peak loading) . The maximum vertical velocity of the propeller for
sinusoidal pitching with('I'i^iax
~'^CW^
~ 1.33 degrees and frequency = 0.8
hertz is approximately 0.29 m/s (0.96 f t/s) . This is equivalent to
additional tangential and radial velocity component ratios (Vj-/V and
Vj-/V, respectively) of 0.082. For ^ fixed at if = 'l^cw (("^tO.yH/V)=
0.199 and (Vj-o.7)l/V = 0.145 (from a harmonic analysis of the wake sur-
vey data). Therefore,
14
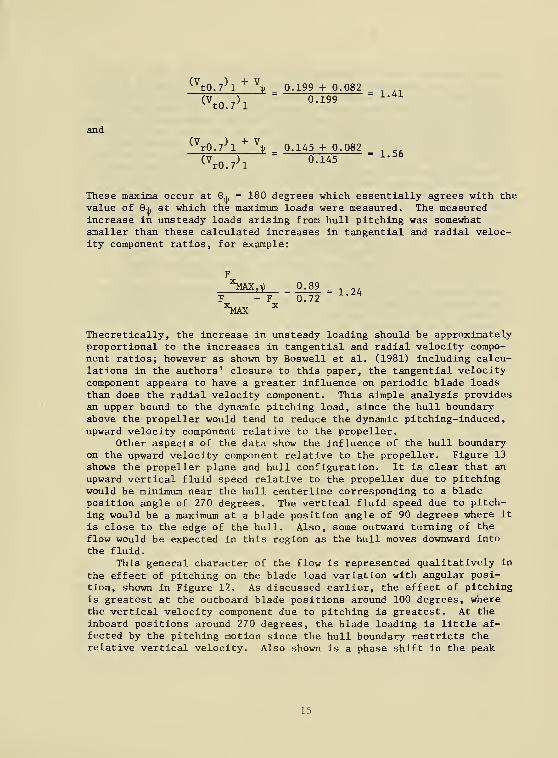
^\o.7^1"*" % ^ 0.199 + 0.082 ^
(V^^ ,), 0.199^'^^
tO.7'1
and(V ) + V' rO.7^1 > _ 0.145 + 0.082 _
<'r0.7>l °-"5
These maxima occur at 0^ = 180 degrees which essentially agrees with the
value of 0^ at which the maximum loads were measured. The measuredincrease in unsteady loads arising from hull pitching was somewhatsmaller than these calculated increases in tangential and radial veloc-ity component ratios, for example:
F
^SlAX,4) ^ 0.89F - F 0.72'SlAX ^
= 1.24
Theoretically, the increase in unsteady loading should be approximatelyproportional to the increases in tangential and radial velocity compo-nent ratios; however as shown by Boswell et al. (1981) including calcu-lations in the authors' closure to this paper, the tangential velocitycomponent appears to have a greater influence on periodic blade loadsthan does the radial velocity component. This simple analysis providesan upper bound to the dynamic pitching load, since the hull boundaryabove the propeller would tend to reduce the dynamic pitching-induced,upward velocity component relative to the propeller.
Other aspects of the data show the influence of the hull boundaryon the upward velocity component relative to the propeller. Figure 13
shows the propeller plane and hull configuration. It is clear that an
upward vertical fluid speed relative to the propeller due to pitchingwould be minimum near the hull centerline corresponding to a bladeposition angle of 270 degrees. The vertical fluid speed due to pitch-
ing would be a maximum at a blade position angle of 90 degrees where it
is close to the edge of the hull. Also, some outward turning of the
flow would be expected in this region as the hull moves downward into
the fluid.This general character of the flow is represented qualitatively in
the effect of pitching on the blade load variation with angular posi-tion, shown in Figure 12. As discussed earlier, the effect of pitchingis greatest at the outboard blade positions around 100 degrees, wherethe vertical velocity component due to pitching is greatest. At the
inboard positions around 270 degrees, the blade loading is little af-fected by the pitching motion since the hull boundary restricts therelative vertical velocity. Also shown is a phase shift in the peak
15

loading between 90 and 135 degrees (also see Figure 11) , which may berelated to the outward turning of the vertical velocity due to the hull.
Table 3 compares the results presented here for hull pitching incalm water with the same type of results presented by Boswell et al.
(1976a, 1976b) for a single-screw transom-stern configuration, and withresults presented by Boswell et al. (1978) and Jessup et al. (1977) fora twin-screw transom-stern configuration. The results presented inTable 3 indicate that the experimental results on these three configu-rations are consistent. The unsteady loads presented in this paperincreased by smaller fractions of their values without hull pitchingthan did the unsteady loads reported by Boswell et al. (1976a, 1976b,1978) ; however, this results from the smaller fractional increase in thevertical velocity component relative to the propeller with hull pitchingof the present model than with the models reported by Boswell et al.
(1976a, 1976b, 1978), The estimated increase in vertical velocity com-ponent due to hull pitching was larger than the measured increase inunsteady loading with hull pitching for all three configurations.
Hull pitching was the only one of the six components of ship mo-tions (surge, heave, sway, roll, pitch and yaw) for which blade loadswere measured. These experiments showed that hull pitching affectsprimarily the peak and unsteady blade loading and that this effectappears to be controlled by the ratio of the maximum vertical velocityof the propeller to the ship speed. It appears that the increases inthe peak and unsteady blade loading due to the vertical velocity compo-nent of the propeller are independent of the type of ship motions pro-ducing this vertical velocity. Heave and roll (for propellers off theship centerline) also produce velocities in the vertical plane of thepropeller. Therefore, the effect of heave and roll on the peak and un-steady blade loading can be deduced from the experimental results withhull pitching by calculating the equivalent hull pitching required toproduce the same vertical velocity component of the propeller as pro-duced by the specified heave and/or roll.
Surge, sway, and yaw do not significantly alter the flow relativeto the propeller in the vertical plane, therefore it is expected thatthese ship motions would have an insignificant influence on the peak orunsteady blade loading. The primary cause of this unsteady blade loadin calm water without ship motions for hulls of the type under consider-ation here is the upward vertical wake velocity component relative to
the propeller plane, therefore any transverse velocity which is smallrelative to this vertical wake velocity is insignificant when vectori-ally added to the vertical wake velocity component.
Blade loads were measured for only one pitching frequency. However,any realistic hull pitching frequency is small relative to the propellerrotational frequency; therefore, pitching frequency should not signifi-cantly alter the trends of the experimental data. The magnitude of the
maximum vertical velocity for a given pitch amplitude is directly pro-portional to pitching frequency; therefore the peak and unsteady com-ponents of blade loading tend to increase as the pitching frequencyincreases.
16

Blade loads were measured for only one amplitude of pitching. How-ever, the maximum speed due to pitching is directly proportional topitching amplitude for a given frequency; therefore, the peak and un-steady blade loading tends to increase as the amplitude of pitching in-creases. At large amplitudes of pitch the propeller may draw air nearthe stem-up position. This would tend to unload the blade in the upperportion of the propeller disk so that the unsteady blade loads wouldincrease but the peak loads would not increase. However, this is notthe portion of the pitch cycle at which the maximum vertical velocity ofthe propeller occurs, therefore it appears that maximum steady loadswould be controlled by the maximum vertical velocity of the propellerrather than by the air drawing.
Based on these results and those presented by Boswell et al. (1976a,
1976b, 1978), the increase in blade loads due to hull pitching can beestimated for transom stern configurations as follows:
1. Time-Average Loads Per Propeller Revolution
Hull pitching increases the maximum time-average loads per revolu-tion by only a small amount over the time-average loads per revolutionwithout hull pitching. This increase can be approximated as follows:
where AL = maximum increase in time-average loads per revolution'^ with hull pitching over the value in calm water
L = time-average load in calm water
L, = time-average load in waves
ill= amplitude of the variation in hull pitch angle in
radians
In practice, this maximum increase in time-average loads per revolution
due to pitching is negligible relative to the corresponding increase due
to waves, as discussed later.
2. Periodic Loads
Hull pitching (in calm water) substantially increases the maximum
periodic blade loads over the corresponding periodic loads without hull
pitching. The primary controlling parameter is the ratio of the verti-
cal velocity of the propeller resulting from the hull pitching to the
ship speed. The maximum periodic loads occur when the velocity of the
propeller and stern are maximum downward. This downward velocity of the
propeller effectively increases the inclination of the inflow relative
to the propeller and thereby increases the periodic loads. Due to the
17

displacement effect of the hull above the propeller, the vertical speedof the propeller relative to the local fluid particles is only 60 per-cent or less of the vertical speed of the propeller. Therefore, forships with high-speed transom sterns with exposed shafts and struts, themaximum periodic blade loads due to hull pitching can be approximatedfrom the corresponding loads without hull pitching as follows:
AL,
0.6 V,
where Al. = maximum increase in periodic loads with hull pitchingover the values without ship motions
L = periodic blade load without ship motions
V = vertical component of spatial average crossflow velocityin propeller plane without ship motions
V = maximum vertical velocity component of the propellerdue to the pitching motions
3. Peak Loads
The maximum values of the periodic variation of loads with angularposition and the time-average loads per angular position occur near thesame point in the pitch cycle. Therefore, the increase in peak loadsdue to hull pitching is approximately the sum of the increases in thesecomponents
:
'PEAK,t(^"
'^hiAX,ii"^
^^MAX,iJ^
The nZ-1, nZ, and nZ+1 harmonics of blade loads directly contributeto the periodic loads on the propeller shaft and bearings. Full scalemeasurements (Tasaki, 1975) Indicate that the amplitudes of periodicbearing loads are modulated by the influences of a rough sea. The maxi-mum amplitudes of these modulated loads at blade rate frequency are
commonly more than a factor of two greater than the corresponding ampli-tudes of the loads measured in a calm sea as- discussed by Lipis (1975)
and Tasaki (1975). In the present investigation, the influence of hull
pitching on periodic bearing loads was investigated by evaluating the
influence of pitching on the pertinent harmonics of blade loads.
In the investigations described by Boswell et al. (1976a, 1976b,
1978) , no analysis was made of the harmonics of blade loads beyond the
dominant first harmonic because of their small amplitudes which were,in many cases, around one percent of the time-average thrust (for
forces) and torque (for moments). However, for evaluating the effectsof waves and pitching on periodic bearing loads, the variations of these
18

quantities with wave and pitching parameters are more important than theactual values of the small, pertinent higher harmonics of blade loads.
Figure 14 shows the variations of the first 10 harmonics of the Fcomponent of blade loading with location through one pitch cycle. Thevalue of each harmonic amplitude is nondimensionalized on its calm watervalue. The variations of the amplitudes of the second, third and fourthharmonic are similar in magnitude to the dominant first harmonic of
blade loading. These components are the major contributors to the bladeloading variation with blade angle, as shown in Figure 9. The ampli-tudes of the fifth through the eighth harmonics show much larger varia-tions with pitch angle relative to the respective time-average values.This result implies that the relatively small, higher harmonics of bladeloading associated with unsteady bearing forces, are very sensitive to
relatively small changes in the wake pattern.
F. Operation in Waves Without Hull Pitching
Figure 15 presents the variations of the peak values per revolution,
time-average values per revolution, and the first harmonic values of the
Fjj and Mjj components of hydrodynamic blade loading with wave height for
operation in waves without hull pitching (Condition 3 in Table 1) . The
Fy and My components showed similar variations as in Figure 15, and the
Fz and M2 components were found to be relatively independent of wave
height. Table 5 summarizes the maximum absolute values of the peak
loads, first harmonic loads, and time-average loads per revolution for
operation in waves without hull pitching.The maximum absolute values of the time-average loads per revolution
^MAX Cincreased by as much as 14 percent above the^ corresponding time-
average loads in calm water without hull pitching Lj,j^. This is quite
different from the corresponding result with hull pitching in calm water
where the time-average loads per revolution increased by a maximum of
only 5 percent above the corresponding time-average loads in calm water
without hull pitching. The variations of the time-average loads per
revolution approximately followed the local wave elevation in the pro-
peller plane so that the maximum and minimum time-average loads per
revolution occurred at approximately 36 degrees of the wave cycle of
encounter before the time at which the wave trough and peak, respective-
ly, were in the propeller plane.
The variations of the time-average loads per revolution with posi-
tion in the wave are consistent with trends reported by McCarthy et al.
(1961). McCarthy et al. measured the low frequency variation of pro-
peller shaft thrust and torque with position in the wave for steady
ahead operation in regular head waves without ship motions and without
a nearby hull. They did not measure individual blade loads; however,
the variations of low frequency shaft thrust and torque are essentially
the same as the variations of the_time-average values per revolution of
blade thrust Fx and blade torque M^. The results of McCarthy et al.
agreed with the results of the present^ investigation in that th£ maxi-
mum values of the thrust coefficient K-j and torque coefficient Kq
19
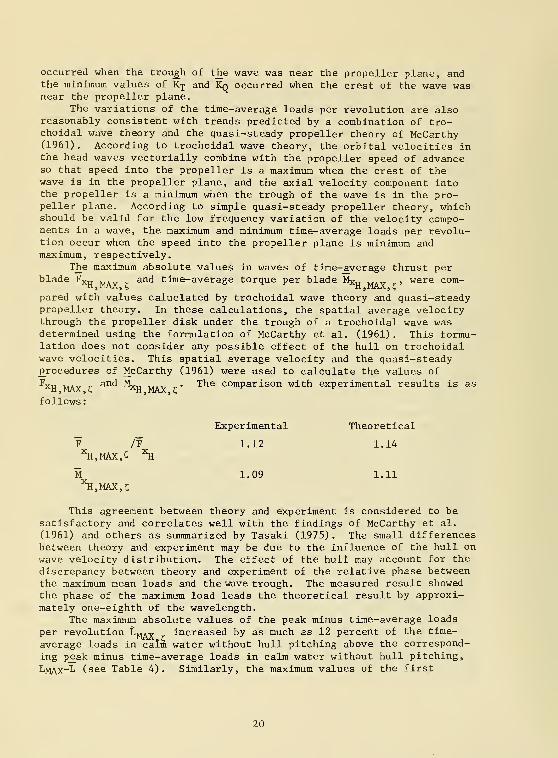
occurred when the trough of the wave was near the propeller plane, andthe minimum values of K'p and Kq occurred when the crest of the wave wasnear the propeller plane.
The variations of the time-average loads per revolution are alsoreasonably consistent with trends predicted by a combination of tro-choidal wave theory and the quasi-steady propeller theory of McCarthy(1961). According to trochoidal wave theory, the orbital velocities inthe head waves vectorially combine with the propeller speed of advanceso that speed into the propeller is a maximum when the crest of thewave is in the propeller plane, and the axial velocity component intothe propeller is a minimum when the trough of the wave is in the pro-peller plane. According to simple quasi-steady propeller theory, whichshould be valid for the low frequency variation of the velocity compo-nents in a wave, the maximum and minimum time-average loads per revolu-tion occur when the speed into the propeller plane is minimum andmaximum, respectively.
T_he maximum absolute values in waves of time-average thrust perblade T^ w^^^ and time-average torque per blade Mxu „.„ , were com-
pared with values caluclated by trochoidal wave theory and quasi-steadypropeller theory. In these calculations, the spatial average velocitythrough the propeller disk under the trough of a trochoidal wave wasdetermined using the formulation of McCarthy et al. (1961). This formu-lation does not consider any possible effect of the hull on trochoidalwave velocities. This spatial average velocity and the quasi-steadyprocedures of McCarthy (1961) were used to calculate the values ofFjj and Mj^ . The comparison with experimental results is as
follows
:
Experimental Theoretical
F /F 1.12 1.14^.MAX,-^ ^M 1.09 1.11^,MAX,?
This agreement between theory and experiment is considered to besatisfactory and correlates well with the findings of McCarthy et al.
(1961) and others as summarized by Tasaki (1975) . The small differencesbetween theory and experiment may be due to the influence of the hull onwave velocity distribution. The effect of the hull may account for the
discrepancy between theory and experiment of the relative phase betweenthe maximum mean loads and the wave trough. The measured result showedthe phase of the maximum load leads the theoretical result by approxi-mately one-eighth of the wavelength.
The maximum absolute values of the peak minus time-average loads
per revolution Lj^jvy ^ increased by as much as 12 percent of the time-
average loads in calm water without hull pitching above the correspond-
ing pe_ak minus time-average loads in calm water without hull pitching,
^MAX~L (see Table 4). Similarly, the maximum values of the first
20

harmonic loads (L)imay» increased as much as 9 percent of the time-average loads in calm water without hull pitching above the correspond-ing first harmonic loads in calm water without hull pitching, (L)-j^. Thevariations of the peak minus time-average loads per revolution and thefirst harmonic loads approximately followed the local wave elevation inthe propeller plane so that their maximum absolute values occurred at
approximately 45 degrees of the cycle of encounter before the time at
which local wave elevation passes through the calm water level fromnegative to positive (? = 0, C>0)
.
The variations of the peak minus time-average loads per revolutionand first harmonic loads are reasonably consistent with trends predictedby trochoidal wave theory. According to computations by McCarthy et al.
(1961) using trochoidal wave theory, the longitudinal components of the
orbital velocities are essentially independent of location in the pro-
peller disk; therefore, the longitudinal components of orbital veloci-ties do not contribute to the circumferential variations of propellerblade loads. Trochoidal wave theory predicts that the vertical compo-nents of the orbital velocities in the head waves reach their maximumvalues in the upward direction at the position where ^ = and ?>0.
The wake into the propeller disk for the present hull is predominantlyan upward velocity due to the inclination of the propeller shaft rela-
tive to the hull (see Figure 6); therefore, at C = 0, i>0 the orbitalvelocity and the wake velocity vectorially combine to produce the maxi-mum upward velocity relative to the propeller, which is equivalent to
the maximum first harmonic of the tangential velocity. The first har-
monic of the tangential wake is the primary cause of the unsteady blade
loads on the present hull operating in calm water without pitching;
therefore, the maximum unsteady loads in trochoidal waves should occur
at ? = 0, i;>0. The measured results show the phase of the maximumunsteady loads leads the predicted result by approximately one-eighth
of a wavelength.The ratio of the maximum variation of blade loading with blade
angular position in waves to the corresponding variation of blade load-
ing in calm water should be proportional to the ratio of the maximum
vertical velocity in waves to the corresponding vertical velocity in
calm water (since the vertical velocity is proportional to the first
harmonic of the tangential component of velocity) . The temporal maxi-
mum upward vertical velocity in the propeller plane (this velocity is
essentially constant over the propeller disk) in a trochoidal wave
corresponding to Condition 3 in Table 1 was calculated using the formu-
lation of McCarthy et al. (1961) to be 0.235 m/s (0.772 f t/s) . This is
equivalent to an additional tangential velocity ratio V^/V of 0.066,
The value of (Vt;0.7)l/V for operation in calm water is 0.199 from the
wake survey results. Therefore,
^^t0.7-'lMAX^^ = 0.199 + 0.066 ^
(\0.7)l/^ " '^'' ''
21

This maximum ratio, which does not consider the effect of the hull onthe vertical component of the trochoidal wave velocities, is predictedto occur when the wave elevation at the propeller plane is increasingthrough the calm water level, i.e., t, = 0, t>0. The measured increasein the variation of loads with blade angular position for operation inwaves was somewhat smaller than this calculated increase in tangentialvelocity; for example:
F /(F -F) = 1.17
(F >1MAV r/(F ), = 1.12X IMAX,^ X 1
This simple analysis is believed to provide an upper bound to the in-
crease in variation of loads with blade angular position due to opera-tion in waves, since the hull boundary above the propeller would tendto reduce the vertical component of the trochoidal wave velocity. Thecorresponding measured increase for other components of blade loadingare presented in Table 5.
The maximum absolute values of the peak loads per revolution in-
creased by as much as 22 percent of the time-average loads in calm waterwithout hull pitching above the corresponding peak loads in calm waterwithout hull pitching (see Table 5) . This increase in peak loads is
made up of the increase in the time-average loads per revolution (up to
14 percent) and the increase in the circumferential variation in loads,
or peak minus time-average loads per revolution (up to 12 percent)
.
The increases in the time-average loads per revolution and the increases
in circumferential variations of loads are thought to arise from dif-
ferent physical characteristics of the flow as discussed previously;
however, the maximum increase in the time-average loads and circumfer-
ential variations of loads occur in the same portion of the wave period.
Therefore, these two separate increases tend to add almost in phase
relative to the wave period so that the maximum increase in peak loads
is almost the algebraic sum of the maximum increases in the time-average
loads per revolution and the maximiun increase in the circumferential
variation of loads.
Figure 16 shows the variation of the F^ component of blade load
with angular position for different times during one wave cycle. The
variation of the circumferential distribution to waves appears to be
more complicated than the corresponding variation due to pitching. This
is attributed to the combined effect of the longitudinal and vertical
velocities induced by the wave. As in the case of pitching, the great-
est magnitude of loading occurs at blade angles around 90 degrees,
corresponding to the outboard position of the blades relative to the
propeller shaft. Also, the phase angle of the maximum load varies with
position relative to the wave, but with the combined effects of mean and
unsteady load variations no clear trends are observed. The variation
22

in first harmonic phase shown in Figure 15 indicates a significant
change in vertical flow direction due to the hull.
Blade loads were measured in regular head waves at only one waveamplitude and wavelength. The experiments showed that the increases in
both the time-average loads per revolution and the unsteady loads due to
waves appears to be controlled by the orbital velocity in a trochoidalwave. It appears that the increase in both the time-average loads per
revolution and the unsteady loads are proportional to the orbital veloc-ity. The orbital velocity, and thus the approximate increase in loads,
is directly proportional to the wave height and inversely proportionalto the square root of the wavelength (Lewis, 1967, McCarthy et al.
,
1961), neglecting any possible influence of the hull on these trends.
The vertical component of the orbital velocity, which controls the
increase in unsteady blade loading due to waves, is independent of the
direction of the waves relative to the ship heading. Therefore, the
increase in unsteady blade loading due to waves is essentially inde-
pendent of the relative direction of the waves. The component of the
orbital velocity in the direction of the ship velocity, which controls
the increase in the time-average loads per revolution due to waves, is
proportional to the cosine of y, the angle between the direction of the
waves and the ship heading. Therefore, the increase in the time-
average loads per revolution is essentially proportional to cos y,
neglecting any possible influence of the hull on these trends.
Based on these results the increases in blade loads due to waves
can be estimated for transom-stern configurations as follows:
1. Time-Average Loads Per Revolution
Waves (without ship motions) substantially increase the maximum
time-average loads per revolution over the corresponding time-average
loads in calm water. The primary controlling parameter is the change
in effective advance coefficient due to the longitudinal component of
orbital wave velocity. The hull boundary above the propeller does not
appear to significantly influence the longitudinal component of orbital
wave velocity. Therefore, the maximum increase in time-average loads
per propeller revolution due to waves can be adequately predicted by
the use of the trochoidal wave theory neglecting the influence of the
hull on the waves, and simple quasi-steady propeller theory using the
open-water characteristics of the propeller.
2. Periodic Loads
Waves (without ship motions) substantially increase the maximumperiodic blade loads over the corresponding periodic loads in calm
water. The primary controlling parameter is the ratio of the vertical
component of the orbital wave velocity in the propeller plane to the
ship speed. The maximum periodic loads occur when the vertical compo-
nent of the orbital wave velocity in the propeller plane is maximumupward. This upward orbital velocity component effectively increases
the inclination of the inflow to the propeller and thereby increases
2 3
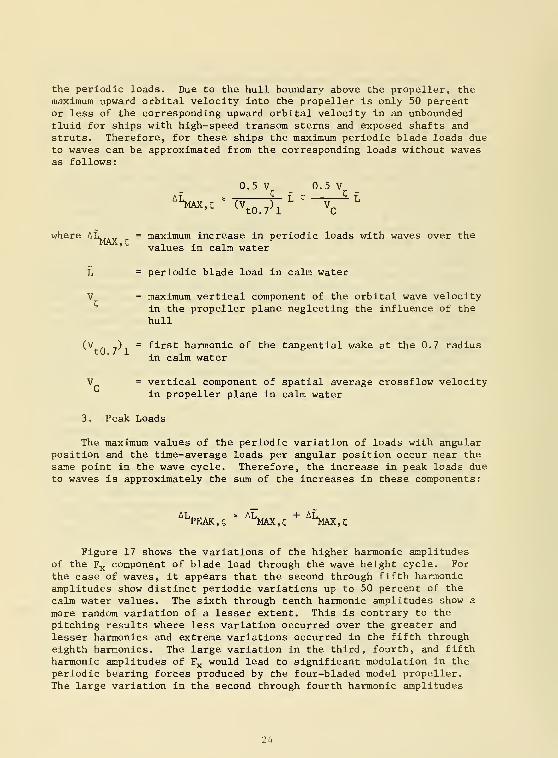
the periodic loads. Due to the hull boundary above the propeller, themaximum upward orbital velocity into the propeller is only 50 percentor less of the corresponding upward orbital velocity in an unboundedfluid for ships with high-speed transom sterns and exposed shafts andstruts. Therefore, for these ships the maximum periodic blade loads dueto waves can be approximated from the corresponding loads without wavesas follows
:
'h1AX,C
0.5 V
^W70.5 V
A r
where At = maximum increase in periodic loads with waves over the' values in calm water
L = periodic blade load in calm water
V = maximum vertical component of the orbital wave velocityin the propeller plane neglecting the influence of the
hull
(V ) = first harmonic of the tangential wake at the 0.7 radiusin calm water
V = vertical component of spatial average crossflow velocityin propeller plane in calm water
3. Peak Loads
The maximum values of the periodic variation of loads with angularposition and the time-average loads per angular position occur near the
same point in the wave cycle. Therefore, the increase in peak loads dueto waves is approximately the sum of the increases in these components:
^^PEAK,? " ^^MAX,C"^ ^^mX,Z
Figure 17 shows the variations of the higher harmonic amplitudesof the Fjj component of blade load through the wave height cycle. Forthe case of waves, it appears that the second through fifth harmonicamplitudes show distinct periodic variations up to 50 percent of the
calm water values. The sixth through tenth harmonic amplitudes show a
more random variation of a lesser extent. This is contrary to the
pitching results where less variation occurred over the greater and
lesser harmonics and extreme variations occurred in the fifth througheighth harmonics. The large variation in the third, fourth, and fifthharmonic amplitudes of F^^ would lead to significant modulation in theperiodic bearing fortes produced by the four-bladed model propeller.The large variation in the second through fourth harmonic amplitudes
24

of F , the amplitudes of which range from 2 to 13 percent of the time-
average value, also explain some of the complexity of the wave forms
shown in Figure 16. These harmonics have consistent variations in phase
angles of up to 45 degrees.
G. Operation in Waves With Hull Pitching
As discussed in the section on experimental conditions and pro-
cedures, for forced pitching in waves the phase of the wave at the pro-
peller $^ was varied relative to the phase of the hull pitching $^.
Three relative phases were evaluated:
a. Wave crest at the propeller plane when the stern of the model
hull is pitched up at its maximum value, "S^ - $^ = (Condition 4 in
Table 1)
,
b. Wave crest at the propeller plane when the stern of the model
hull is pitched down at its maximum values, *r-- ^^ = 180 degrees (Con-
dition 5 in Table 1) , and
c. Wave crest at the propeller plane when the hull pitch is pass-
ing through its mean value (^^^ - ^mtn^'^^ from stern down to stern up,
^C ~^i)
~ ^^ degrees (Condition 6 in Table 1) .
Experiments for each of these conditions were conducted at the
same model speed, propeller rotation speed, pitching period, wave
period of encounter as were the condition in calm water with hull pitch-
ing, and in waves without hull pitching, as described in the preceding
sections (see Table 1). However, in order to ensure a large influence
of the pitching or waves on blade loads while not flooding the model
hull, it was necessary to run each of the four pitching conditions with
a different pitch amplitude ij;^, and each of the four conditions in
waves with a different wave amplitude ^a (see Table 1)
.
The primary objectives of this portion of the experimental program
were:
a. To determine the validity of linearly superimposing the in-
crease in blade loads due to pitching in calm water, and the increase
in blade loads due to waves without hull pitching, to obtain the net
increase in blade loads due to hull pitching in waves,
b. To determine the influence of the phase of the hull pitch
relative to the phase of the wave ($^ - $^l) on the maximum absolute
values of the peak, unsteady and time-average blade loads, and
c. To determine the values of ($^ - (J>^) which result in the
largest values of peak, unsteady and time-average blade loads for dif-
ferent relative values of pitching amplitude iip^ and nondimensional
wave amplitude, C^/Lpp.Therefore, the experimental results will be discussed and interpreted
from the viewpoint of these three objectives.
In order to determine the validity of linearly superimposing the
increase in blade loads due to the pitching only and the increase in
blade loads due to waves only, the experimental results with hull pitch-
ing in calm water and the experimental results in waves without hull
pitching were linearly combined to simulate the blade loads for the

three experimental conditions with hull pitching in waves. The linearsuperposition accounts for the phase differences between the hull pitch-ing and the waves, and for the differences in amplitudes of pitchingand waves for the various experimental conditions. It is assumed inthis linear superposition that the increases in loading due to hullpitching and waves are directly proportional to the amplitude of thehull pitching and the amplitude of the waves, respectively.
From the experiments in calm water with hull pitching (Condition 2in Table 1) the increase in loading due to a unit pitch amplitude is:
From the experiments in waves without hull pitching (Condition 3 inTable 1) the increase in loading due to a unit wave amplitude is:
AL_(t )/c = (L ftj - L)/?.«, C A C, C, A
AL
Linearly superimposing the above increases in loading due to pitchingonly and due to waves only, the predicted loads with pitching amplitude
^A*> wave amplitude ^^*, and with the wave leading the pitch by($^ - i^)T-^/2-n seconds is
Figure 18 compares F^^ component loads calculated by this linearsuperposition procedure with loads measured in waves with hull pitchingfor the three conditions run, $^ - $^ = 0, $^ - $^ = 180, ^^ - <i-^ = 90degrees. Figure 18 shows that the linear superposition gives a reason-ably good estimate of both the magnitudes and the variations with posi-tion in the pitch and wave cycles of the peak loads, unsteady loads, andtime-average loads per revolution. For most conditions the values basedon linear superposition are slightly larger than the measured results.
26
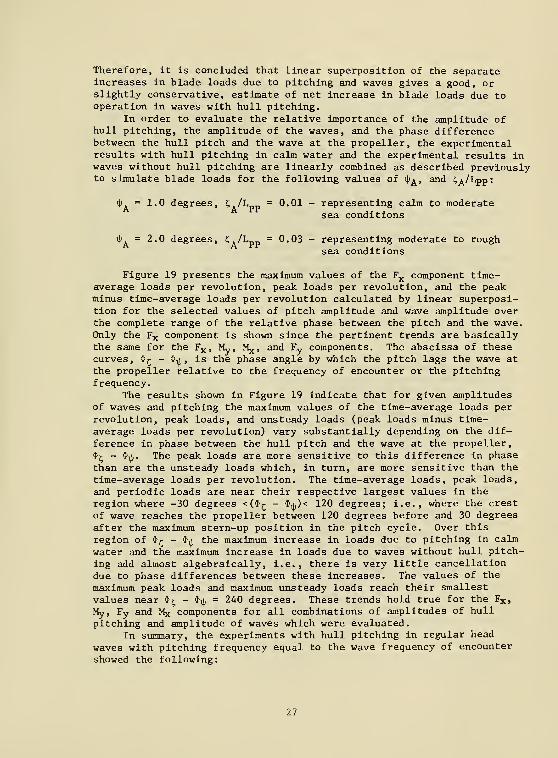
Therefore, it is concluded that linear superposition of the separateincreases in blade loads due to pitching and waves gives a good, orslightly conservative, estimate of net increase in blade loads due tooperation in waves with hull pitching.
In order to evaluate the relative importance of the amplitude ofhull pitching, the amplitude of the waves, and the phase differencebetween the hull pitch and the wave at the propeller, the experimentalresults with hull pitching in calm water and the experimental results inwaves without hull pitching are linearly combined as described previouslyto simulate blade loads for the following values of ij;^, and ?j\/^PP'
^. = 1.0 degrees, C /L = 0.01 - representing calm to moderatesea conditions
^. = 2.0 degrees, C./Lpp = 0.03 - representing moderate to roughsea conditions
Figure 19 presents the maximum values of the F^^ component time-average loads per revolution, peak loads per revolution, and the peakminus time-average loads per revolution calculated by linear superposi-tion for the selected values of pitch amplitude and wave amplitude overthe complete range of the relative phase between the pitch and the wave.Only the Fx component is shown since the pertinent trends are basicallythe same for the F^, My, M^j aiid Fy components. The abscissa of thesecurves, ^c, ~ ^xb* ^^ the phase angle by which the pitch lags the wave at
the propeller relative to the frequency of encounter or the pitchingfrequency.
The results shown in Figure 19 indicate that for given amplitudesof waves and pitching the maximum values of the time-average loads perrevolution, peak loads, and unsteady loads (peak loads minus time-average loads per revolution) vary substantially depending on the dif-ference in phase between the hull pitch and the wave at the propeller,
^l^- $^. The peak loads are more sensitive to this difference in phase
than are the unsteady loads which, in turn, are more sensitive than the
time-average loads per revolution. The time-average loads, peak loads,
and periodic loads are near their respective largest values in the
region where -30 degrees <($r - $^)< 120 degrees; i.e., where the crest
of wave reaches the propeller between 120 degrees before and 30 degreesafter the maximum stern-up position in the pitch cycle. Over this
region of $r -^\b the maximum increase in loads due to pitching in calm
water and the maximum increase in loads due to waves without hull pitch-
ing add almost algebraically, i.e., there is very little cancellationdue to phase differences between these increases. The values of the
maximum peak loads and maximum unsteady loads reach their smallest
values near <I>j^ -$,j,
= 2A0 degrees. These trends hold true for the Fx,
My, Fy and Mx components for all combinations of amplitudes of hull
pitching and amplitude of waves which were evaluated.In summary, the experiments with hull pitching In regular head
waves with pitching frequency equal to the wave frequency of encounter
showed the following
:
27
a. For given amplitudes of waves and pitching the maximum valuesof the time-average loads per revolution, peak loads, and the periodicvariation of loads with angular position vary substantially dependingupon the difference in phase between the hull pitch and the wave at thepropeller. The time-average loads, peak loads, and periodic loads arenear their respective greatest values for any difference in phase where-by the crest of the wave reaches the propeller between 0.3 and -0.1 ofthe period of encounter before the maximum stem-up position.
b. Linear superposition of the increases in blade loads due to
pitching in calm water and due to waves without hull pitching, takinginto account the phase between the waves and the pitching, gives a sat-isfactory, or slightly conservative, estimate of the net increase in
blade loads due to operation in waves with hull pitching. For engineer-ing calculations, it is recommended that the absolute values of the
maximum increases in time-average, peak, and periodic loads due to theseparate influences of waves and hull pitching be added without regardto the relative phase between the wave and the hull pitching.
IV. DISCUSSION
The results presented in this paper showing the effects of hullpitching and waves on the dominant once per propeller revolution varia-
tion of loads provide extensive insight to the flow patterns in the
propeller plane under these conditions. These data and insights should
form a basis for developing and validating a computational procedure for
predicting blade loads under these conditions.The experimental results presented here are applicable to only high
speed transom stern configurations. The Influences of the hull bound-
ary of more complex stern geometries, such as for full stem cargo
ships, are more complex. Experiments of the type described in this
paper would serve as a valuable guide for validating any computational
procedure applied to cargo ships.
The prediction of the modulation of bearing loads due to waves and
pitching cannot be performed using the simple procedures described in
this paper. More elaborate models of the interaction between the pro-
peller wake and the waves and pitching influences may capture the
fundamental nature of the modulation of the bearing loads.
All results presented in this paper are in the absence of cavita-
tion. It is anticipated that if cavitation were sufficiently extensive
to influence blade loads it would reduce the maximum time-average and
periodic loads. Therefore, it is judged that neglecting cavitation
results in a conservative estimate of maximum loads.
28
SUMMARY AND CONCLUSIONS
Fundamental investigations were made of the effects of periodic hullpitching motions and waves on the periodic loads on propeller blades andbearings. These periodic loads were measured during carefully con-trolled model experiments on a twin-screw, transom-stern hull. Theobjective of these experiments was to obtain systematic accurate experi-mental data showing the effects of hull pitching and waves on periodicand time-average blade and bearing loads under carefully controlledexperimental conditions so that the effects of ship motions and waves onperiodic and time-average blade and bearing loads could be isolated.The experiments were conducted under steady ahead operation in calmwater with no ship motions, in calm water with forced sinusoidal pitch-ing of the hull, in regular waves with no ship motions, and in regularwaves with forced sinusoidal pitching of the hull at a frequency equalto the wave frequency of encounter over a range of phases between thepitching motion and wave encounter. An error analysis indicates thatthe experimental results are sufficiently accurate to support the con-clusions drawn. The periodic blade loads were calculated using trochoi-dal wave velocity profiles, and a representation of the propeller basedon a quasi-steady method.
The experimental results show the following:a. The amplitudes of the periodic blade loads are significantly
modulated hull pitching motions and wave encounter.b. The time-average blade loads per propeller revolution vary
significantly with wave encounter but only slightly with hull pitchingmotion.
c. The peak blade loads per revolution vary significantly withhull pitching motions and wave encounter.
d. The individual influences of the wave velocity profile and the
induced velocities due to vertical hull motions can be linearly super-imposed for transom stern configurations.
The results show that the hull significantly alters the amount of
modulation of the shaft frequency loads due to both the periodic ver-
tical motion of the propeller and the trochoidal wave velocity profile
in the absence of the hull. However, trends of shaft frequency loads
are well predicted by simple periodic variations of the velocity into
the propeller, and a simple quasi-steady representation of the propel-
ler. The quasi-steady representation of the propeller is sufficient for
this application because the frequencies of encounter of the waves and
of the hull pitching motions are low relative to the propeller rota-
tional speed; i.e., the reduced frequency is low. Therefore, for engi-
neering purposes, the modulation can be estimated by simple trochoidal
wave velocity profiles, quasi-steady propeller theory, and constant
multiples derived from the experiments presented in this paper.
The experimental results show that the first eight shaft rate
harmonics of blade loads are modulated and increased by hull pitching
motions and waves relative to the respective values in calm water without
hull pitching. Comparable modulations and increases in bearing loads
29

are anticipated, where the number of blades determines the pertinentharmonics of blade loading. However, the data are not sufficient toquantify the modulations of bearing loads due to hull pitching and wavesnor to provide guidance for predicting these modulations.
Trends of the results for both blade loads and bearing loads areconsistent with available full-scale data.
VI. ACKNOWLEDGMENTS
The authors are indebted to many members of the staff of the DavidW. Taylor Naval Ship Research and Development Center. Special appreci-ation is extended to Messrs. Michael Jeffers, Benjamin Wisler, andDouglas Dahmer for development of the on-line data analysis sytem,assembling the servomechanism for accurately controlling the modelpitching relative to the waves, assisting in running the experiments,and analyzing data.
VII. REFERENCES
Boswell, R. J., and M. L. Miller (1968), Unsteady Propeller Loading -
Measurement, Correlation with Theory, and Parametric Study, NSRDCRept 2625.
Boswell, R. J., J. J. Nelka, and S. B. Denny (1976). ExperimentalDetermination of Mean and Unsteady Loads on a Model CP PropellerBlade for Various Simulated Modes of Ship Operation, Eleventh Sym-posium on Naval Hydrodynamics, Mechanical Engineering PublicationsLimited, London and New York, pp. 789-834.
Boswell, R. J., J. J. Nelka, and S. B. Denny (1976). ExperimentalUnsteady and Mean Loads on a CP Propeller Blade on the FF-1088 forSimulated Modes of Operation, DTNSRDC Rept 76-0125, DTIC ADA034804.
Boswell, R. J., S. D. Jessup, and J. J. Nelka (1978). Experimental TimeAverage and Unsteady Loads on the Blades of a CP Propeller Behind a
Model of the DD-963 Class Destroyer, Propellers '78 Symposium , TheSociety of Naval Architects and Marine Engineers Publication S-6,
pp. 7/1-7/28.Boswell, R. J., S. D. Jessup, and K. H. Kim (1981). Periodic Blade
Loads on Propellers in Tangential and Longitudinal Wakes, Propellers'81 Symposium , The Society of Naval Architects and Marine EngineersPublication S-8, also DTNSRDC Rept 81/054.
Brandau, J. H. (1968). Static and Dynamic Calibration of PropellerModel Fluctuating Force Balances, DTMB Rept 2350, also TechnologiaNaval , 1, pp. 48-74.
30

Breslin, J. P. (1972). Propeller Excitation Theory, Proc . 13th Inter-national Towing Tank Conference , Report of the Propeller Committee,App. 2c, 2, pp. 527-540.
Brownell, W. F. , W. L. Asling, and W. Marks (1956). A 51-Foot PneumaticWave-maker and a Wave Absorber, DTMB Rept 1054.
Day, W. G. , A. M. Reed, and W.-C. Lin (1977). Experimental and Predic-tion Techniques for Estimating Added Power Requirements in a Seaway,Proc . 18th American Towing Tank Conference , U.S. Naval Academy,Annapolis, Maryland, I, pp. 121-141.
Dobay, G. F. (1971). Time-Dependent Blade-Load Measurements on a Screw-Propeller, Presented at the 16th American Towing Tank Conference
,
Instituto De Pesquisas Technologicas, Marinhas Do Brasil.Gray, L. M. (1981). Investigation into Modeling and Measurement of
Propeller Cavitation Source Strength at Blade Rate on MerchantVessels, Propellers '81 Symposium , The Society of Naval Architectsand Marine Engineers Publication S-8, pp. 165-180.
Jessup, S. D., R. J. Boswell, and J. J. Nelka (1977). ExperimentalUnsteady and Time Average Loads on the Blades of the CP Propeller ona Model of the DD-963 Class Destroyer for Simulated Modes of Opera-tion, DTNSRDC Rept 77-0110, DTIC ADA-048385.
Keil, H. G, J. J. Blaurock, and E. A. Weitendorf (1972). Stresses in
the Blades of a Cargo Ship Propeller, J^. of Hydronautics , 6, 1,
pp. 2-7.
Lewis, E. V. (1967). Motion of Ships in Waves, Chapter IX, Principlesof Naval Architecture , Edited by J. P. Comstock, The Society of
Naval Architects and Marine Engineers, pp. 607-717.Lipis, B. V. (1975). Hydrodynamics of a Screw Propeller with Motions
of the Vessel (in Russian: Gidrodinamika Grebnogo Vinta pri KachkeSudna) , Publishing House Sudostroyeniye , Leningrad.
Lloyd, A. R. J. M. , and R. N. Andrew (1977). Criteria of Ship Speed in
Rough Weather, Proc . 18th American Towing Tank Conference , U.S.
Naval Academy, Annapolis, Maryland, II, pp. 541-564.
McCarthy, J. H. (1961) . On the Calculation of Thrust and Torque Fluc-
tuations of Propellers in Nonuniform Wake Flow, DTMB Rept 1533.
McCarthy, J. H. , W. H. Norley, and G. L. Ober (1961). The Performanceof a Fully Submerged Propeller in Regular Waves, DTMB Rept 1440.
Oosterveld, M. W. C. (editor) (1978). Report of the Seakeeping Commit-
tee, 15th International Towing Tank Conference , The NetherlandsShip Model Basin, Wageningen, pp. 55-114.
Schwanecke, H. (1975). Comparative Calculations on Unsteady Propeller
Blade Forces, Proc . 14th International Towing Tank Conference ,
Report of the Propeller Committee, App 4, 3, pp. 357-397.
Tasaki, R. (1975). Propulsion Factors and Fluctuating Propeller Loads
in Waves, Proc . 14th International Towing Tank Conference , Report of
Seakeeping Committee, App 7, 4, pp. 224-236.
Tsakonas, S., W. R. Jacobs, and M. R. All (1974). An Exact Linear
Lifting Surface Theory for Marine Propeller in a Nonuniform Flow
Field, J. of Ship Research , 17, 4, pp. 196-207.
Watanabe, K. , N. Heida, T. Sasajima, and T. Matsuo (1973). Propeller
Stress Measurements on the Container Ship HKONE MARU, Shipbuilding
Research Association of Japan , 3, 3, pp. 41-51.
31

NOTATION
c Chord lengthD Propeller diameter(F)jj nth harmonic amplitude of F
^x,y,z Force components on blade in x,y,z directionsJq Effective advance coefficient based on torque identityJj' Effective advance coefficient based on thrust identityKq Torque coefficient, Q/(pn2D5)
% Thrust coefficient, T/(pn2D'^)
L Any of the measured components of blade loadingLpp Length between perpendicularsLy Wavelength(M)n nth harmonic amplitude of M^,y,z Moment components about x,y,z axes from loading on one bladen Propeller revolutions per unit timeR Radius of propellerr Radial coordinate from propeller axisTg Period of encounter of wavesT^ Period of pitchingt Timet(r) Maximum thickness of propeller blade sectionV Model speed or ship speed
y^ Propeller speed of advanceVq Vertical component of the spatial average crossflow velocity
in propeller plane in calm water without ship motionsVj.(r,0^^) Radial component of wake velocity at propeller plane,
positive towards hubVt(r,e^j) Tangential component of wake velocity at propeller plane,
positive counterclockwise looking upstream for starboardpropeller (right-hand rotation)
, positive clockwise lookingupstream for port propeller (left-hand rotation)
(Vt)j^ nth harmonic amplitude of VVy Wave velocityVx(r,0y) Longitudinal component of wake velocity at propeller plane,
positive forwardVw, Maximum vertical velocity component of propeller resulting
from hull pitching motionsWq Taylor wake fraction determined from torque identity
Vf Taylor wake fraction determined from thrust identityWy^ Wake fraction determined from volume mean longitudinal
velocity component through propeller disk determined froma wake survey, (V-V-^) /V
x,y,z Coordinate axes rotating with propeller; see Figure 2
Z Number of blades? Instantaneous wave elevation, positive upward from undisturbed
surface
C^ Wave amplitude
32

0- Angular variable in cycle of wave encounter, Zirt/Tg; 0^ =
when ^ = 0, ^>0
0^ Angular variable in cycle of hull pitching, Zirt/T^; 0^ =
when ii = 0, ^>0Angular coordinate used to define location of blade and vari-ation of loads measured from vertical upward; positive clock-
wise looking upstream for starboard propeller (righ-hand
rotation) ,positive counterclockwise looking upstream for
port propeller (left-hand rotation) , 9 = - Qye„ Angular coordinate of wake velocity measured from upward
vertical; positive counterclockwise looking upstream for
starboard propeller (right-hand rotation),positive clockwise
looking upstream for port propeller (left-hand rotation)
,
6w = - 6
y Angle between the direction of the waves and the ship
centerline
p Mass density of water$j- Phase of wave at the propeller plane based on sine series,
C(t) = C^ sin (0^ + $^)
$^ Phase of hull pitch based on sine series, ^{t) = ^A sin
(©,); +^^l,) _,
(J)(r) Pitch angle of propeller blade section, tan -•- (P/(2irr))
i<i>v M)r, nth harmonic phase angles of F,M based on a cosine series,''»'^"
jg
(F,M) = (F,M) + Z^ (F.M)n cos (ne - ('f'p^^)^)
i|) Pitch of hull, positive stern up
TpA Amplitude of hull pitch angle
Subscripts:CW Value in calm waterExp Experimental valueH Arising from hydrodynamic loading
h Value at hub radius
M Model valueMAX Maximum valueMIN Minimum value
p Port propellerPEAK Peak value including variation of both time-average value per
revolution and variation with blade angular position
s Starboard propeller
x,y,z Component in x,y,z direction
0.7 Value at r = 0.7Rt, Value for operation in waves
i|) Value for operation with hull pitching motion
Superscripts:— Time-average value per revolution
Unsteady value, peak value per revolution minus time-average
value per revolutionRate of change with time
33
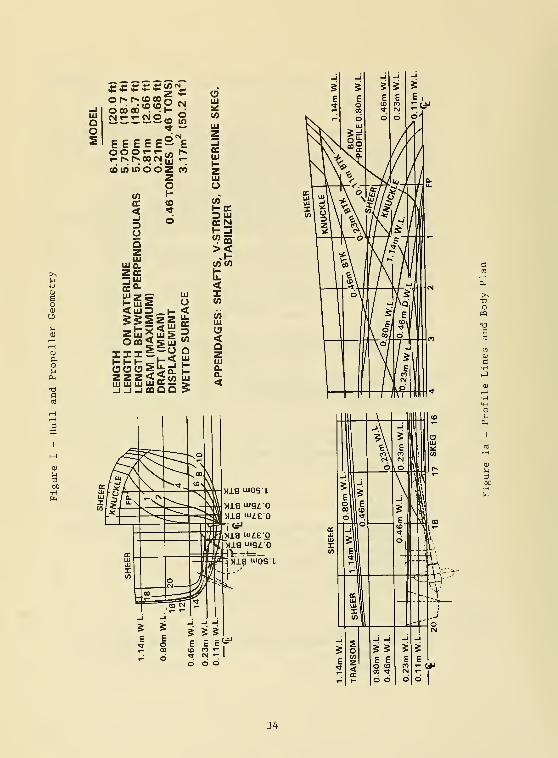
"^ *^ "^ *•> "^f/) e4
or- r««<ooOo
O 00 00 -r—<Vj
Ul
f^'-iiCiStf) (/)
^ UJ
eeeeeS'^eZ-1
?^^«?^{2r^ oc^ 111
1-
z(o LT) unooz enz UJo o
w ^- >
QC (0 (/)
< ^ l-OCDUJ
D ° OCNOQZUJ
UJQ.
1- _l
X.1-
zee 1-^^ LU u.
tt^ <1— UJ 2
LUO
X(A
<UJ 3 1- <^^5zz u.
DC UJ
LENGTH LENGTH
ON
LENGTH
BET
BEAM
(MAXI
DRAFT
(MEA
DISPLACEME
QLUh-HUl
<QZUJa.
<$
Xia mOS L
34

Figure 1 (Continued)
-PROJECTED OUTLINE
7Z^SWEPT OUTLINE-
-EXPANDED OUTLINE
MIDCHORD LINE
DIAMETER, D (m): 0.222NUMBER OF BLADES, Z:4ROTATION: OUTWARD TURNINGHUB-DIAMETER RATIO, D^/D: 0.312
EXPANDED AREA RATIO: 0.775PITCH-DIAMETER RATIO AT 0.7R: 1.111
Figure lb - Schematic Drawing of Propellers
BLADE ON WHICH ' ^FORCES AREMEASURED. cp M,
F ,zBLADE ON WHICH
PROPELLERCENTERLINE
FORCES ARE^.^^ MEASURED
AHEAD (-I-V) AHEAD (+v)
X. F F , X
THE COORDINATE SYSTEMROTATES WITH THE PROPELLER
Figure 2 - Components of Blade Loading
PROPELLERCENTERLINE
35
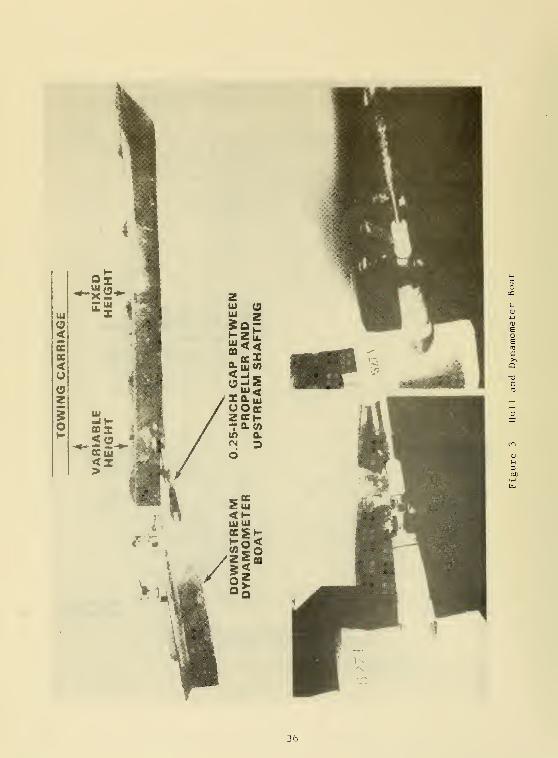
36
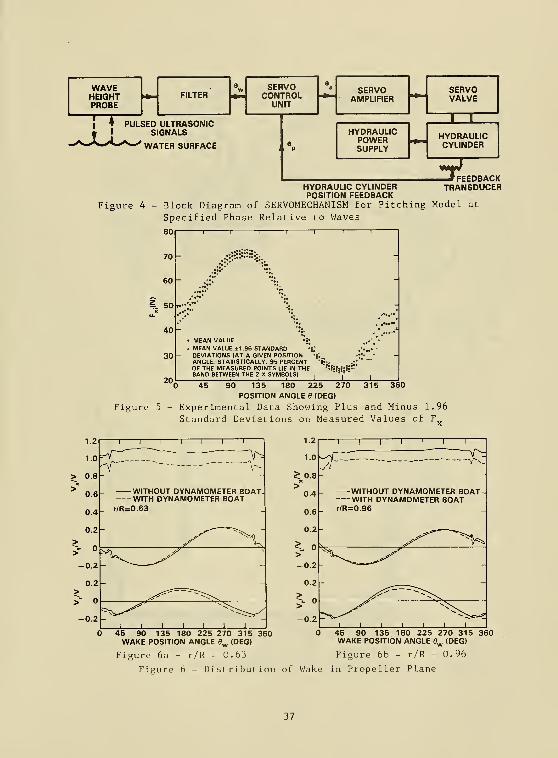
WAVEHEIGHTPROBE
FILTER
it PULSED ULTRASONICI SIGNALS
WATER SURFACE
SERVOCONTROL
UNIT
es SERVO
AMPLIFIER
-
SERVOVALVE
1 1
e1 . p
HYDRAULICPOWERSUPPLY
HYDRAULICCYLINDER
* FEEDBACKHYDRAULIC CYLINDER TRANSDUCER
Figure 4POSITION FEEDBACK
Block Diagram of SERVOMECHANISM for Pitching Model at
Specified Phase Relative to Waves
80 11 1 1 1 1 1 1
MEAN VALUE •§;
MEAN VALUE ±1.96 STANDARD •f,
DEVIATIONS (AT A GIVEN POSITION 'fl
ANGLE, STATISTICALLY. 95 PERCENT •?;..
OF THE MEASURED POINTS LIE IN THE °'!H|it''"BAND BETWEEN THE 2 X-SYMBOLSl
45 90 135 180 225 270 315 360POSITION ANGLE d (DEG)
Figure 5 - Experimental Data Showing Plus and Minus 1.96
Standard Deviations on Measured Values of F^
WITHOUT DYNAMOMETER BOATWITH DYNAMOMETER BOAT
r/R=0.63
45 90 135 180 225 270 315 360WAKE POSITION ANGLE 9^ (DEG)
Figure 6a - r/R ^ 0.63
1.2
1.0
^ 0.8
>0.4
0.6
0.2
21>-0.2
0.2
?°
wr:
WITHOUT DYNAMOMETER BOAT— WITH DYNAMOMETER BOAT_ r/R=0.96
45 90 135 180 225 270 315 360WAKE POSITION ANGLE 6^ (DEG)
Figure 6b - r/R = 0.96
Figure 6 - Distribution of Wake in Propeller Plane
37
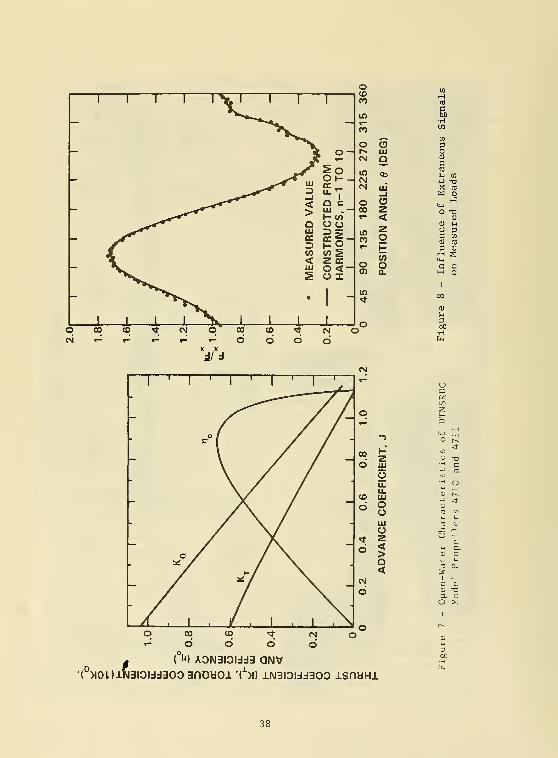
1 1 1 1 'V '
1
-
J)f
°~
^ ^^t^ OI--_^^ LU QC^^,.^f^ D u- T
II
^^^^^"""^ ^ Q c— -''''^ > lU .-^..-r-^ K CO
^^-r-*^ O oo^-''^ LUOC ^1-/^ 3 t-2£ W MS\ < Z OC
v^ UJ o <-^Vv^ s O I
1 1 1 1
•
^ 1 1 1 1
d/ d
o
0) Q,
* ( ^) A3N3IOIdd3 QNV'(°>IOUlN3IOIdd303 3nDa01 '(^>l) iN3l3ldd300 ISnUHl
38
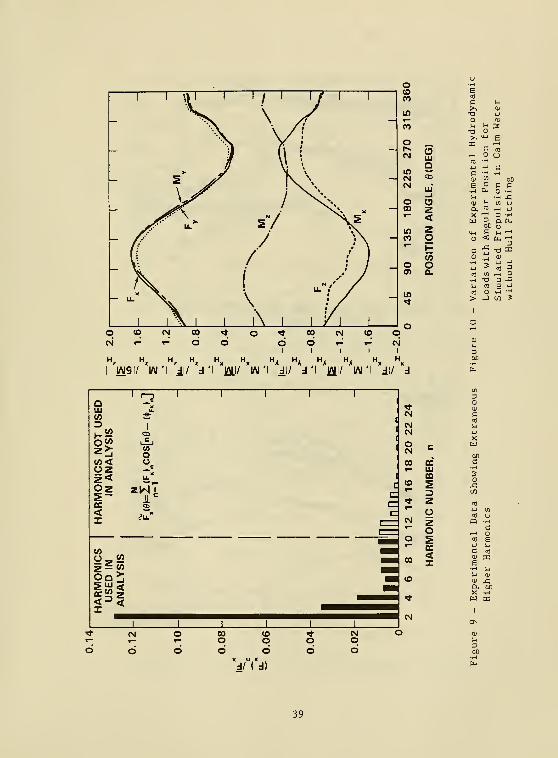
1
' \'1 1,1 7 ' '
- s^ V/ -
>- > lv/ /
^' u.*" sY ^^?"
f /1 /
X (
— u."
1 \| \1 i\ 1 1 V\ 1
o (0 CM 00 't o * 00
OJ * ^ o o o1
o1
C3HI
g— csi =» n< en 00
F c cH -1I-l •H j:;
0) iSi un, t—1 4-J
X >—
<
3 -Hy & a.
o
O < Oh '^
C "5 T3 Xo .*: oj
4J * to 3CO U) ,—
I
O•H 73 3 x;U 03 E 4-1
(TJ O -H •'-I
> -J c/D 3
I/\I9I/ l/M'l dl/ d'l l/\il/ lAI'l dl/ d 'I lAII/ lAI'l dl/ d
rg o 00 (Oo o oCMo
o o o o o^dz-i'-d)
o o
39
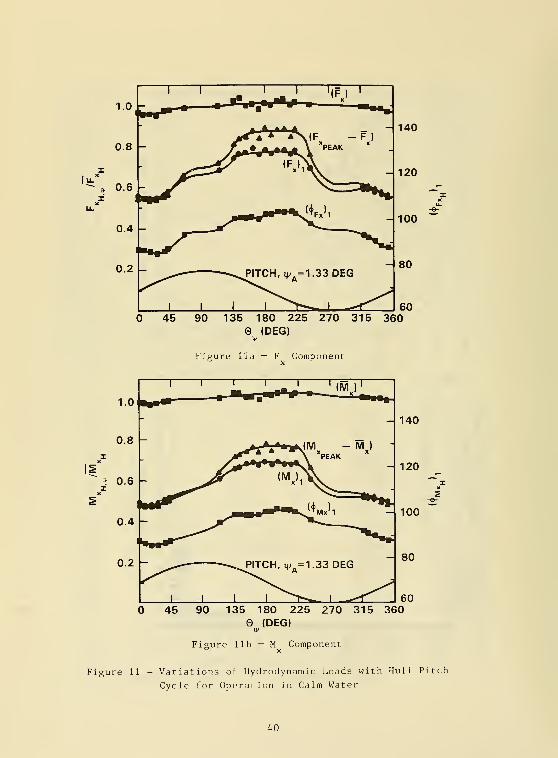
140
120
100
45 90 135 180 225 270 315 360(DEG)
v
Figure 11a — F ComponentX
1
\
1
\ \ HfT
1.0
0.8
3 0.6
0.4
0.2 PITCH, 4. =1.33 DEG
J L
140
120
100
- 80
6045 90 135 180 225 270 315 360
(DEG)
Figure lib — M Component
Figure 11 - Variations of Hydrodynamic Loads with Hull Pitch
Cycle for Operation in Calm Water
40
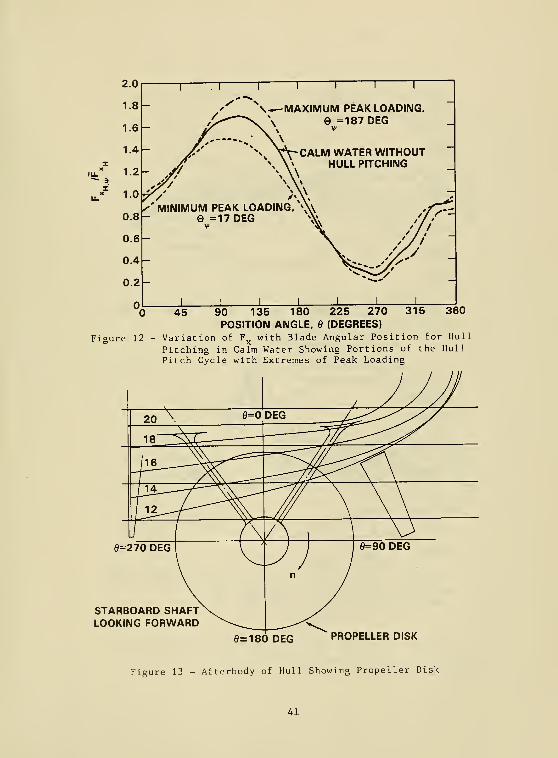
X-K^MAXIMUM PEAK LOADING,
\ =187 DEG
"0 45 90 135 180 225 270 315 360POSITION ANGLE, 6 (DEGREES)
Figure 12 - Variation of F^ with Blade Angular Position for Hull
Pitching in Calm Water Showing Portions of the HullPitch Cycle with Extremes of Peak Loading
STARBOARD SHAFTLOOKING FORWARD
0=180 DEG PROPELLER DISK
Figure 13 - Afterbody of Hull Showing Propeller Disk
41
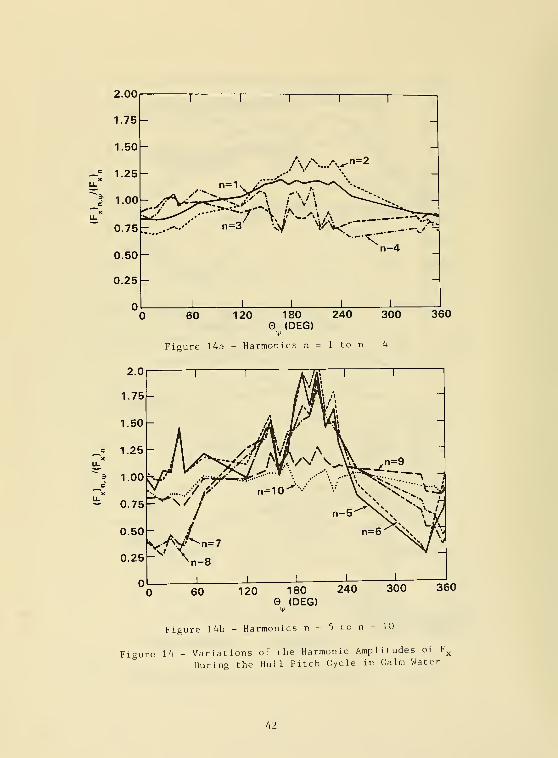
2.00
1.75
1.50
1.25
1.00
0.75
0.50
0.25
/\/\..A^"=2
n=1.
-y^^in=3 vy V'i< ^
•Xn=4
120 180 240(DEG)
360
Figure 14b - Harmonics n = 5 to n - 10
Figure 14 - Variations of the Harmonic Amplitudes of F^
During the Hull Pitch Cycle in Calm Water
42
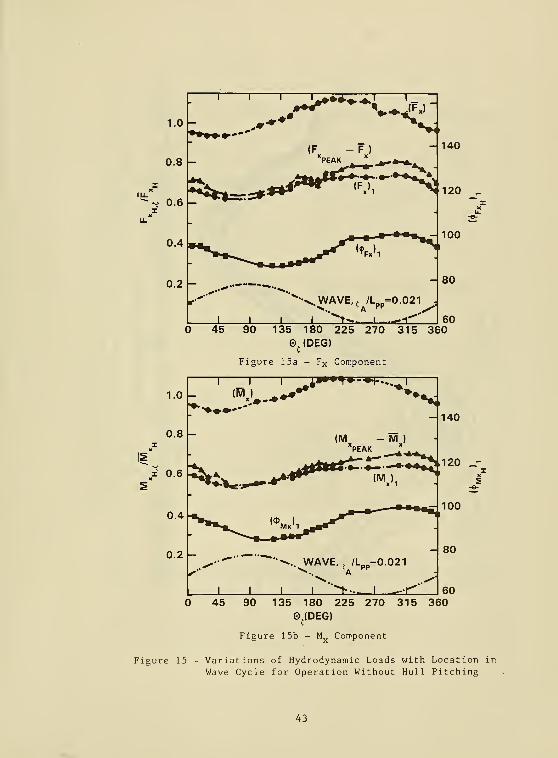
1.0
0.8
0.6
0.4
0.2
2i^_.^*.^*'«*^^**^
1 1 1 r—^—v»^^-^'—
^
{F -F )
"peak
•• .WAVE,^ /L_.=0.021^.. A ,
J I I I^t^^. I „.^1'
140
120 ^
100
- 80
6045 90 135 180 225 270 315 360
0^(DEG)
Figure 15a - Fx Component
1.0
1 _l 1 i»»^»-*l-...^l
7"-•.--
0.8 (M - M )
0.6
0.4****^^>_ '_^£>-''''*"*^
0.2 ~ ^•- ^.. WAVE,, /L =0.021/»• '^. A •^'^
1 1 1 1••>..
1 _-<
- 140
120 _-XXS
- 80
6045 90 135 180 225 270 315 360
0^(DEG)
Figure 15b - M Component
Figure 15 - Variations of Hydrodynamic Loads with Location in
Wave Cycle for Operation Without Hull Pitching
43
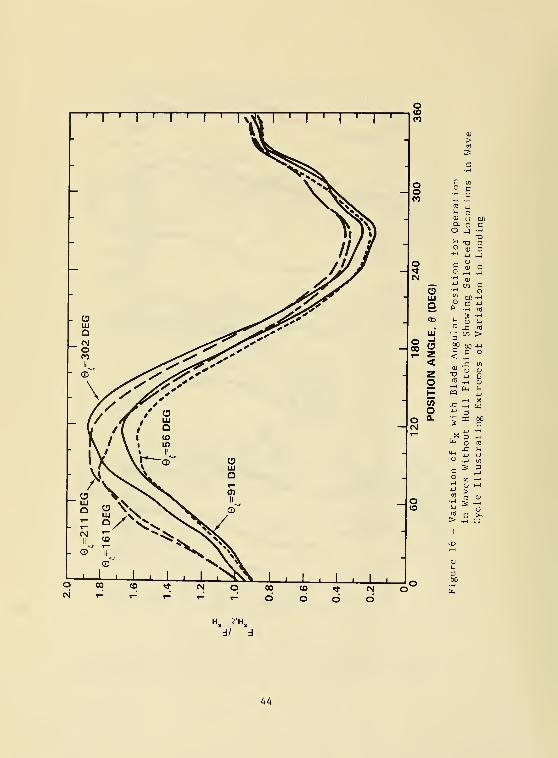
oo 2 (=
CO W -r^
CO 4Ju n<U oQ. oO JV. T3O 01^ z>
o c ^t o ^(N •-I
QJ
C3
or- z
<zo1-
wo
O a.
eg
^ - e
d/ d
44

60 120 180 240 300 360
e^lDEG)
Figure 17a - Harmonics n = 1 to n = 5
180 240 300 36060 120
Fieure 17b - Harmonics n = 6 to n = 10
0^ (DEG)
Figure 17 - Variations of Harmonic Amplitudes o£ F,^ During Wave Cycle
Without Hull Pitching
45
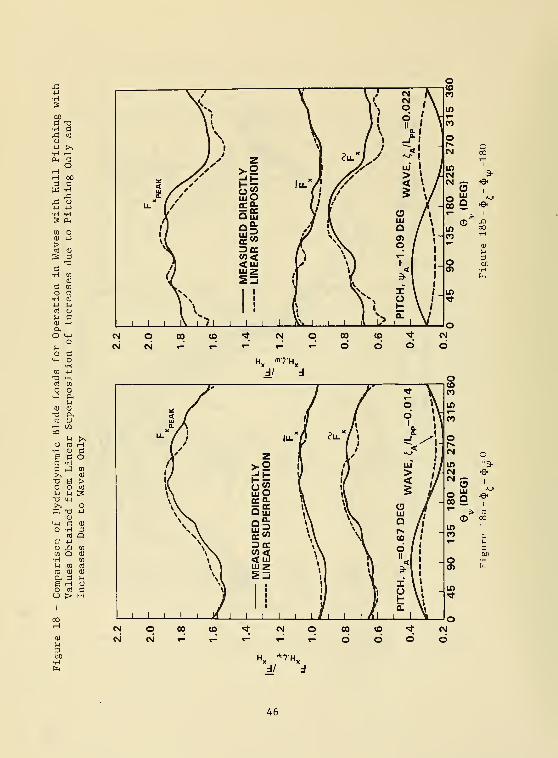
•H axi to
o+J >%•H rHCM COH M3 c
to oa) 4J
td (U
& 3
<U MftO m
13 -Htfl CO
M >>O (C
eCO
C 1-4
TJ So ou u
- Cc o
C 0)
•H 3
WOO)H CO
u m ^cfl 0) ma. 3 s-j
e ^ cj
o nj Cu > MI
d/ d
46

Figure 18 (Continued)
2.2
2.0
1.8
1.6
1.4I
^^1.2
1.0
0.8
MEASURED DIRECTLYLINEAR SUPERPOSITION
45 90 135 180 225 270 315 360(DEG)
Figure 18c - $,-$^90 degrees
47

I
I I I
I
I I I
I
I I I
I
I I I
I
I I l l[
I I I II
I I I
I
I I I
I iM I I I I I I I I I I I I I I I I I I I I
00
I I * I I I ' I I I I I
o(OCO
lOr-co
o(M
^2o —
in I
CO *J'
r- '9'
_ in
CO <o
6 6
d/ d dO S3mVA lAiniAIIXVIAI
d/ d dO S3P IVA lAiniAIIXVIAI
9-
9-
a^ —Ic
o
48
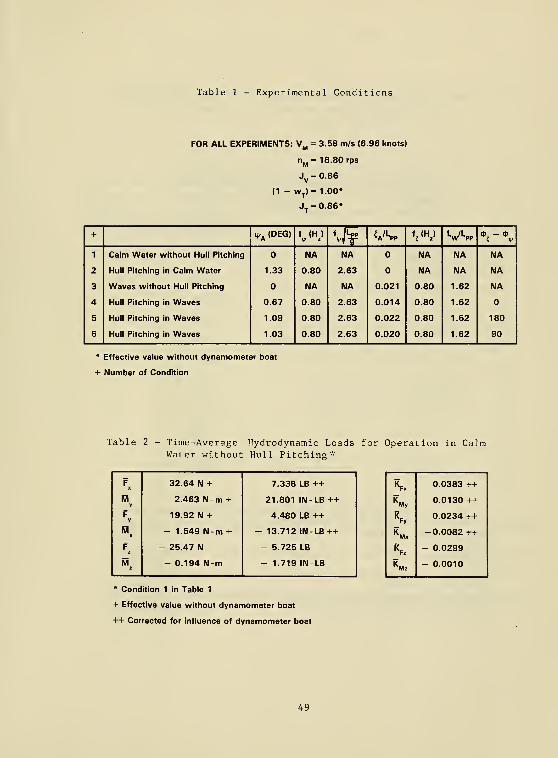
Table 1 - Experimental Conditions
FOR ALL EXPERIMENTS: V^ = 3.58 m/s (6.96 knots)
n^= 18.80 rps
Jy = 0.86
(1 - w^) = 1.00*
J^ = 0.86»
+ H>^ (DEG) f (H) '# ^A/Lpp f^ (H^) VLpP
1 Calm Water without Hull Pitching NA NA NA NA NA
2 Hull Pitching in Calm Water 1.33 0.80 2.63 NA NA NA
3 Waves without Hull Pitching NA NA 0.021 0.80 1.62 NA
4 Hull Pitching in Waves 0.67 0.80 2.63 0.014 0.80 1.62
5 Hull Pitching in Waves 1.09 0.80 2.63 0.022 0.80 1.62 180
6 Hull Pitching in Waves 1.03 0.80 2.63 0.020 0.80 1.62 90
* Effective value without dynamometer boat
+ Number of Condition
Table 2 - Time-Average Hydrodynamic Loads for Operation in CalmWater without Hull Pitching"
F^ 32.64 N + 7.338 LB ++ Kp, 0.0383 ++
My
2.463 N-m + 21.801 IN-LB++ Kmv 0.0130 ++
F 19.92 N + 4.480 LB ++•^Fv
0.0234 ++
M^ - 1.549 N-m + - 13.712 IN-LB++ ^, -0.0082 ++
F2
- 25.47 N - 5.725 LB Kp, - 0.0299
iSi^ - 0.194 N-m - 1.719 IN-LB ^. - 0.0010
* Condition 1 in Table 1
+ Effective value without dynamometer boat
++ Corrected for Influence of dynamometer boat
49
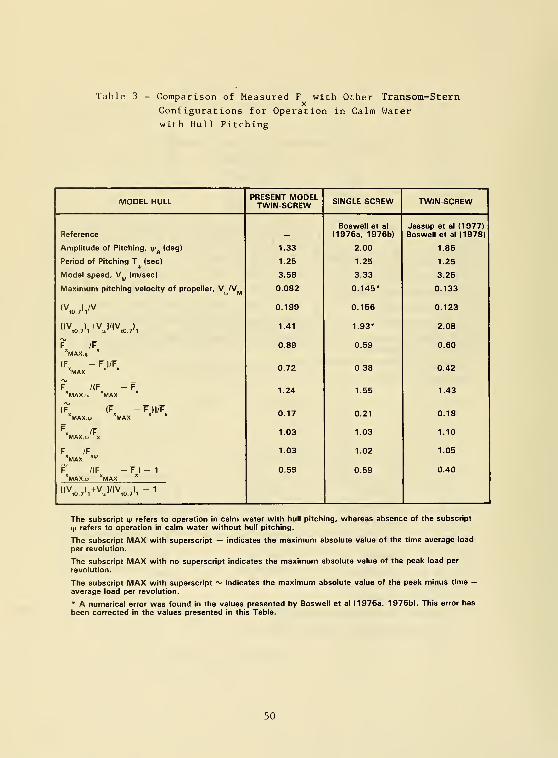
Table 3 - Comparison of Measured F with Other Transom-SternX
Configurations for Operation in Calm Water
with Hull Pitching
MODEL HULL PRESENT MODELTWIN-SCREW SINGLE SCREW TWIN-SCREW
ReferenceBoswell et al
(1976a, 1976b)Jessup et al (1977)Boswell et al (1978)
Amplitude of Pitching, i^^ (deg) 1.33 2.00 1.85
Period of Pitching T (sec) 1.25 1.25 1.25
Model speed, V^^ (m/sec) 3.58 3.33 3.25
Maximum pitching velocity of propeller, V IV^ 0.082 0.145* 0.133
<V.0.7>1'V 0.199 0.156 0.123
t<V,0 7'l+\l/<V,o.7'l 1.41 1.93* 2.08
F /F 0.89 0.59 0.60"max.v-
"
(F - F )/F
"max " *0.72 0.38 0.42
'\J
F /(F - F"max.v. 'max
* 1.24 1.55 1.43
[f" - (F - F )1/F
MAX.v MAX 0.17 0.21 0.18
"mAX.i*, X1.03 1.03 1.10
F /F
^'max "'"1.03 1.02 1.05
f" /(F - F ) - 1 0.59 0.59 0.40"max.ij, "max
"
l<^0.7'l+VJ/(V „^), - 1
The subscript i^ refers to operation in calm water with hull pitching, whereas absence of the subscript
xp refers to operation in calm water without hull pitching.
The subscript MAX with superscript — indicates the maximum absolute value of the time-average load
per revolution.
The subscript MAX with no superscript indicates the maximum absolute value of the peak load per
revolution.
The subscript MAX with superscript ^ indicates the maximum absolute value of the peak minus time —average load per revolution.
* A numerical error was found in the values presented by Boswell et al (1976a, 1976b). This error has
been corrected in the values presented in this Table.
50

Table 4 - Summary of Maximum Values of Hydrodynamic Loads for
Operation in Calm Water with Hull Pitching
LOADING COMPONENT F"h
M F M"h
L„AX..'L 1.03 1.04 1.04 1.05
"-MAX.."^1.91 1.92 1.84 1.82
"-MAX/"^1.71 1.70 1.62 1.61
'L^AX^-Ll/i^AX-L) 1.28 1.31 1.35 1.34
MAX.r^j MAX0.20 0.22 0.22 0.21
MAX.v' MAX1.12 1.13 1.14 1.13
•-MAX 'L 0.89 0.88 0.80 0.78
L„Ay /'"-MAX - L)MAX.i^ MAX
1.25 1.26 1.29 1.28
'W.-"-MAx-L))/!: 0.18 0.18 0.18 0.17
'Di „Ax.yL 0.79 0.77 0.73 0.69
(L),/r 0.66 0.64 0.59 0.59
'DlMAxV^-'l 1.20 1.20 1.24 1.17
IMAX.i^ 1
0.12 0.12 0.13 0.10
L (N OR N-m) 32.65 2.46 19.93 1.55
L refers to any one of the indicated loading components; i.e., F , IVI , F , IVI^.
The subscript \p refers to operation in calm water with hull pitching (Condition 2 in Table 1), whereas
the absence of the subscript ip refers to operation in calm water without hull pitching (Condition 1 in
Table 1).
The subscript MAX with superscript — indicates the maximum absolute value of the time-average load
per revolution.
The subscript MAX with no superscript indicates the maximum absolute value of the peak load per
revolution.
The subscript MAX with superscript ~ indicates the maximum absolute value of the peak minus time-
average load per revolution.
The subscript 1MAX indicates the maximum value of the first harmonic load per revolution.
51

Table 5 - Summary of Maximum Values of Hydrodynamic Loads for
Operation in Waves without the Hull Pitching
LOADING COMPONENT F M F M
Lmax,,/"^ 1.12 1.14 1.08 1.09
Lmax,,/^ 1.90 1.92 1.77 1.77
"-MAX/^1.71 1.70 1.62 1.61
"-MAX,,-L)/(^AX-L) 1.27 1.31 1.24 1.26
<Lmax, - "-MAx'/L 0.19 0.22 0.15 0.16
MAX.i' MAX 1.11 1.13 1.09 1.10
l-MAX,,''^0.81 0.82 0.72 0.70
Lmax./O-max - L) 1.14 1.17 1.16 1.15
<Lmax,, - "-MAX - L))/L 0.10 0.12 0.10 0.09
"-'iMAX,/"-0.74 0.73 0.67 0.65
(U, /L 0.66 0.64 0.59 0.59
•DlMAX./'Dl 1.12 1.14 1.14 1.10
<"-)iMAX,,-<LI,>/L 0.08 0.09 0.08 0.06
L (N OR N-m) 32.65 2.46 19.93 1.55
L refers to any one of the indicated loading components; i.e., F , M , F , M .
X y V X
The subscript t, refers to operation in waves without hull pitching (Condition 3 in Table 1), whereasthe absence of the subscript refers to operation in calm water without hull pitching (Condition 1 in
Table 1).
The subscript MAX with superscript — indicates the maximum absolute value of the time-average load
per revolution.
The subscript MAX with no superscript indicates the maximum absolute value of the peak load perrevolution.
The subscript MAX with superscript '^ indicates the maximum absolute value of the peak minus time-
average load per revolution.
The subscript 1MAX indicates the maximum value of the first harmonic load per revolution.
52

INITIAL DISTRIBUTION
Copies
1 ARMY CHIEF OF RES & DIV
1 ARMY ENGR R&D LAB
2 CHONR1 Code 4381 Lib
1 NRL
4 ONR BOSTON
4 ONR CHICAGO
4 ONR LONDON, ENGLAND
2 USNA1 Lib1 Johnson
1 NAVPGSCOL Lib
1 NROTC & NAVADMINU, MIT
1 NADC
5 NOSC1 1311 Lib1 60051 13111 Lib1 2501/Hoyt1 Nelson
1 NWC
39 NAVSEA3 SEA 05H
5 SEA 05R1 SEA 55
3 SEA 55D
1 SEA 55W3 SEA 56D
1 SEA 56X
3 SEA 56X1
1 SEA 56X2
3 SEA 56X4
1 SEA 56X5
Copies
39 NAVSEA (Continued)1 PMS-3781 PMS-3801 PMS-3811 PMS-3831 PMS-3891 PMS-3911 PMS-3921 PMS-3931 PMS-3971 PMS-3991 PMS-4001 SEA Tech Rep Bath, England
2 DET NORFOLK (Sec 6660)
1 FAC 032C
1 MILITARY SEALIFT COMMAND (M-4EX)
1 NAVSHIPYD/PTSMH
1 NAVSHIPYD/PHILA
1 NAVSHIPYD/NORVA
1 NAVSHIPYD/CHASN
1 NAVSHIPYD/LBEACH
1 NAVSHIPYD/MARE
1 NAVSHIPYD/PUGET
1 NAVSHIPYD/PEARL
12 DTIC
2 HQS COGARD
1 US COAST GUARD (G-ENE-4A)
1 LC/SCI & TECH DIV
8 MARAD1 DIV SHIP DES
1 COORD RES
1 Schubert
53

Copies Copies
8 MARAD (Continued)1 Falls1 Dashnaw1 Hammer1 Lasky1 Siebold
2 MMA1 Lib1 MARITIME RES CEN
2 NASA STIF1 DIR RES
1 NSF ENGR DIV Lib
1 DOT Lib
1 U BRIDGEPORT/URAM
2 U CAL BERKELEY/DEPT NAME1 NAME Lib
1 Webster
1 U CAL SAN DIEGO/ ELLIS
2 UC SCRIPPS
1 Pollack1 Silverman
1 U MARYLAND/GLEN MARTIN INST
1 U MISSISSIPPI/DEPT OF M.E.
4 CIT1 AERO Lib1 Acosta1 Plesset1 Wu
1 CATHOLIC U
1 COLORADO STATE U/Albertson
1 U CONNECTICUT/ Scottron
1 CORNELL U/Sears
1 FLORIDA ATLANTIC U OE Lib
3 HARVARD U1 McKay Lib1 Birkoff1 Carrier
2 U HAWAII/Bretschneider
1 U ILLINOIS/Robertson
2 U IOWA1 IHR/Kennedy1 IHR/Landweber
2 Johns Hopkins U
1 Phillips1 Inst Coop Res
1 U KANSAS CIV ENGR Lib
1 KANSAS ST U ENGR EXP/Lib
1 LEHIGH U FRITZ ENGR LAB Lib
1 LONG ISLAND U
3 U MICHIGAN/DEPT NAME
1 NAME Lib1 Parsons1 Vorus
6 MIT1 BARKER ENGR Lib
2 OCEAN ENGR/Kerwin1 OCEAN ENGR/Leehey1 OCEAN ENGR/Newman1 OCEAN ENGR/Burke
3 U MINNESOTA SAFHL1 Killen1 Song1 Wetzel
2 STATE U MARITIME COLL
S U ARL Lib1 ENGR DEPT1 INST MATH SCI
1 NOTRE DAME ENGR Lib
54

Copies
5 PENN STATE U ARL1 Lib1 Henderson1 Gearhart1 Parkin1 Thompson
1 PRINCETON U/Mellor
1 RENSSELAER/DEPT MATH
1 ST JOHNS U
1 VIRGINIA TECH
3 SWRI1 APPLIED MECH REVIEW1 Abramson1 Burnside
1 BOEING ADV AMR SYS DIV
3 BOLT BERANEK AND NEWMAN1 Brown1 Jackson1 Greeley
1 BREWER ENGR LAB
1 CAMBRIDGE ACOUS/Junger
1 CALSPAN, INC/Ritter
1 STANDFORD U/Ashley
1 STANDFORD RES INST Lib
3 SIT DAVIDSON LAB1 Lib1 Breslin1 Tsakonas
1 TEXAS U ARL Lib
1 UTAH STATE U/Jeppson
2 WEBB INST1 Ward1 Hadler
Copies
1 WHOI OCEAN ENGR DEPT
1 WPI ALDEN HYDR LAB Lib
1 ASME/RES COMM INFO
1 ASNE
1 SNAME
1 AERO JET-GENERAL/Beckwith
1 ALLIS CHALMERS, YORK, PA
1 AVCO LYCOMING
1 BAKER MANUFACTURING
2 BATH IRON WORKS CORP
1 Hansen1 FFG7 PROJECT OFFICE
1 BETHLEHEM STEEL SPARROWS
3 BIRD-JOHNSON CO1 Case1 Ridley1 Norton
2 DOUGLAS AIRCRAFT1 TECHNICAL Lib
1 Smith
2 EXXON RES DIV1 Lib1 Fitzgerald
1 FRIEDE & GOLDMAN/Michel
1 GEN DYN CONVAIRASW-MARINE SCIENCES
3 GIBBS & COX1 TECH Lib1 Olson1 CAPT Nelson
1 GRUMMAN AEROSPACE/ Carl
55

Copies
3 HYDRONAUTICS1 Etter1 Scherer1 Lib
1 INGALLS SHIPBUILDING
1 INST FOR DEFENSE ANAL
1 ITEK VIDYA
1 LITTLETON R & ENGR CORP/Reed
1 LITTON INDUSTRIES
1 LOCKHEED/Waid
1 MARITECH, INC/Vassilopoulis
2 HYDRODYNAMICS RESEARCHASSOCIATES, INC1 Cox1 Valentine
1 NATIONAL STEEL & SHIPBLDG
1 NEWPORT NEWS SHIPBLDG Lib
1 NIELSEN ENGR/Spangler
1 HYDROMECHANICS, INC/Kaplin
1 NAR SPACE/Uj ihara
3 ORI, INC
1 Bullock1 Schneider1 Kobayashi
1 PROPULSION DYNAMICS, INC
1 PROPULSION SYSTEMS, INC
1 SCIENCE APPLICATIONS, INC/Stern
1 GEORGE G. SHARP
1 SPERRY SYS MGMT Lib/ Shapiro
Copies
1
1
2
1
1
SUN SHIPBLDG1 Lib
ROBERT TAGGART
TETRA TECH PASADENA1 Chapkis1 Furuya
TRACOR
UA HAMILTON STANDARD/Cornell
CENTER DISTRIBUTION
Copies Code Name
1 0120 Jewell
1 11 Ellsworth
1 1102.1 Nakonechny
1 15 Morgan
1 1506 Reed
1 1509 Powell
1 152 Lin
1 1521 Day1 1521 Karafiath1 1521 Hurwitz
1 1522 Dobay1 1522 Renuners
1 1522 Wilson
1 154 McCarthy
1 1540.2 Cumming
1 1542 Huang1 1542 Shen
1 1543 Jeffers1 1543 Platzer1 1543 Santore1 1543 Wisler
1 1544 Brockett30 1544 Boswell1 1544 Caster
56

Copies Code Name
1 1544 Fuhs20 1544 Jessup1 1544 Kim
1 156 Cieslowski
1 1561 Feldman1 1561 O'Dea
1 1562 Moran
1 1563 Smith
1 1564 Cox
1 172 Krenzke
1 1720.6 Rockwell
1 19 Sevik1 19 Strasberg
1 1903 Chertock
1 1905 Blake
1 1942 Archibald
1 1962 Zaloumis1 1962 Noonan
1 2814 Czyryca
10 5211.1 Reports Distribution
1 522.1 Lib (C)
1 522.2 Lib (A)
57


DTNSRDC ISSUES THREE TYPES OF REPORTS
1. DTNSRDC REPORTS. A FORMAL SERIES, CONTAIN INFORMATION OF PERMANENT TECH-
NICAL VALUE. THEY CARRY A CONSECUTIVE NUMERICAL IDENTIFICATION REGARDLESS OF
THEIR CLASSIFICATION OR THE ORIGINATING DEPARTMENT.
2. DEPARTMENTAL REPORTS, A SEMIFORMAL SERIES, CONTAIN INFORMATION OF A PRELIM-
INARY, TEMPORARY, OR PROPRIETARY NATURE OR OF LIMITED INTEREST OR SIGNIFICANCE.
THEY CARRY A DEPARTMENTAL ALPHANUMERICAL IDENTIFICATION.
3. TECHNICAL MEMORANDA, AN INFORMAL SERIES, CONTAIN TECHNICAL DOCUMENTATIONOF LIMITED USE AND INTEREST. THEY ARE PRIMARILY WORKING PAPERS INTENDED FOR IN-
TERNAL USE. THEY CARRY AN IDENTIFYING NUMBER WHICH INDICATES THEIR TYPE AND THENUMERICAL CODE OF THE ORIGINATING DEPARTMENT. ANY DISTRIBUTION OUTSIDE DTNSRDCMUST BE APPROVED BY THE HEAD OF THE ORIGINATING DEPARTMENT ON A CASE-BY CASE
BASIS. ^ —
W H I
DOCUMENTCOLLECTION

.>3\'