david yens, ph.d. nycom pasw-spss statistics david p. yens, ph.d. new york college of osteopathic...
TRANSCRIPT

David Yens, Ph.D. NYCOM
PASW-SPSS STATISTICSPASW-SPSS STATISTICS
David P. Yens, Ph.D. New York College of Osteopathic
Medicine, NYIT [email protected]
PRESENTATION 3 Descriptive Statistics Chi-Squared
Risk/Odds Ratio
2010

DESCRIPTIVE STATISTICSDESCRIPTIVE STATISTICSWhen doing data analyses, you
usually want to see the nature of the data before you start. You get this from ◦FREQUENCIES for nonparametric
data and ◦DESCRIPTIVES for parametric data
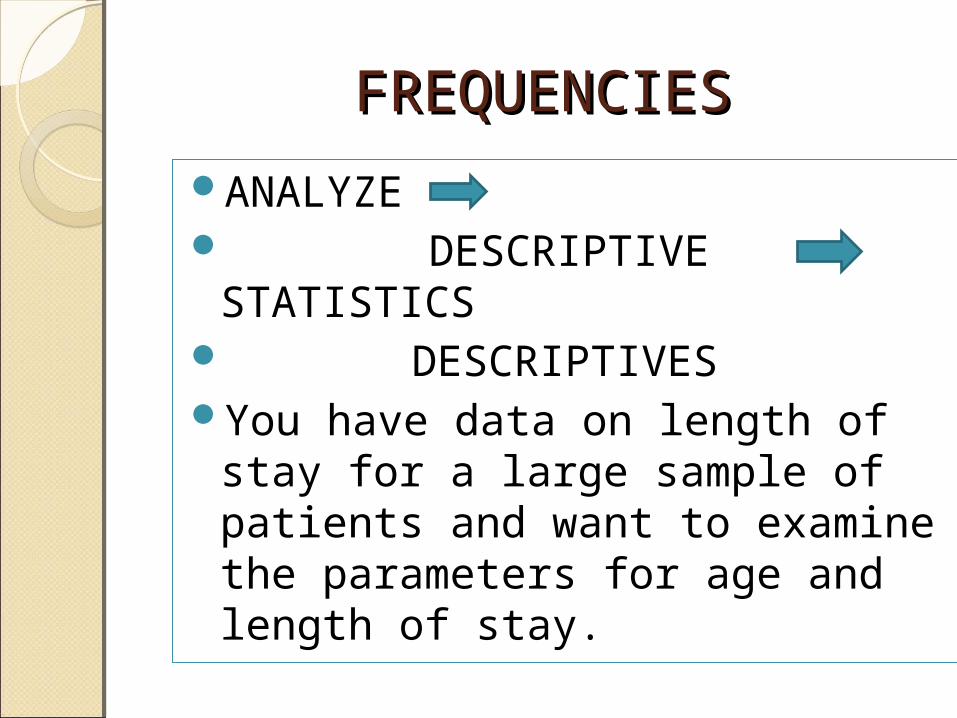
FREQUENCIESFREQUENCIES
ANALYZE DESCRIPTIVE STATISTICS DESCRIPTIVESYou have data on length of stay
for a large sample of patients and want to examine the parameters for age and length of stay.

FREQUENCIESFREQUENCIES
ANALYZE DESCRIPTIVE STATISTICS FREQUENCIESIn your length of stay data you
have included information about gender. How many males and females are in the data?

JOINT FREQUENCIESJOINT FREQUENCIESThe next question might be
whether there is a difference in the number of admissions by gender.

David Yens, Ph.D. NYCOM
CATEGORICAL FREQUENCY CATEGORICAL FREQUENCY DATA: TESTS OF SIGNIFICANCEDATA: TESTS OF SIGNIFICANCECHI-SQUARED (χ2 )
◦Contingency table◦Test of association; compares proportions◦Assesses signal-to-noise ratio◦Based on the differences between observed
and values and expected values◦Most often used with 2 x 2 tables◦Yates’ correction◦Fisher’s exact test
David Yens, Ph.D. NYCOM
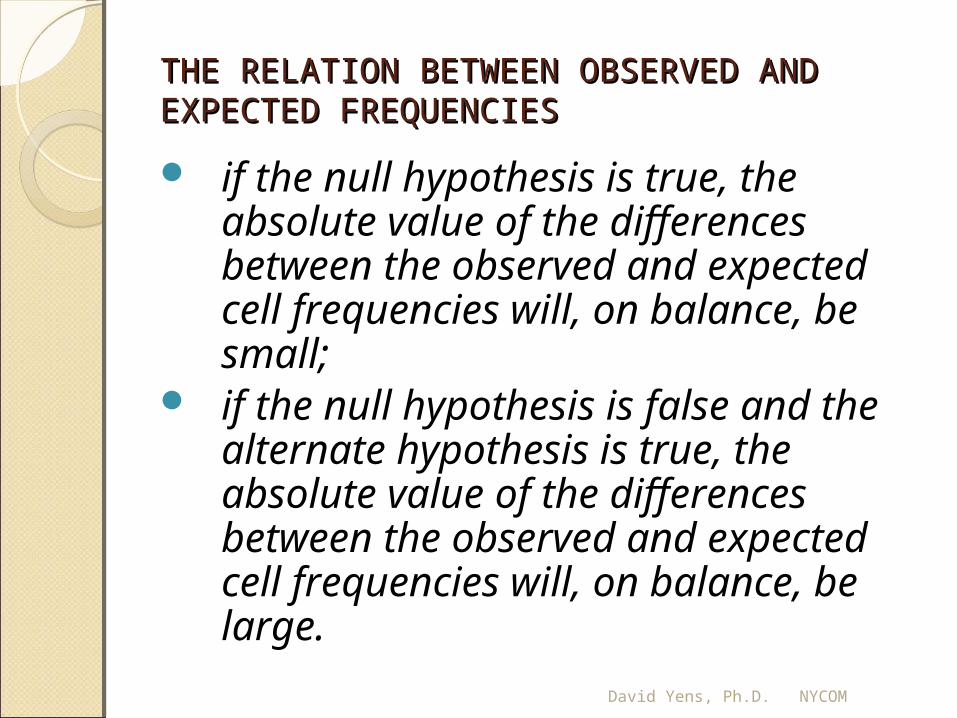
THE RELATION BETWEEN OBSERVED AND THE RELATION BETWEEN OBSERVED AND EXPECTED FREQUENCIESEXPECTED FREQUENCIES
if the null hypothesis is true, the absolute value of the differences between the observed and expected cell frequencies will, on balance, be small;
if the null hypothesis is false and the alternate hypothesis is true, the absolute value of the differences between the observed and expected cell frequencies will, on balance, be large.
David Yens, Ph.D. NYCOM
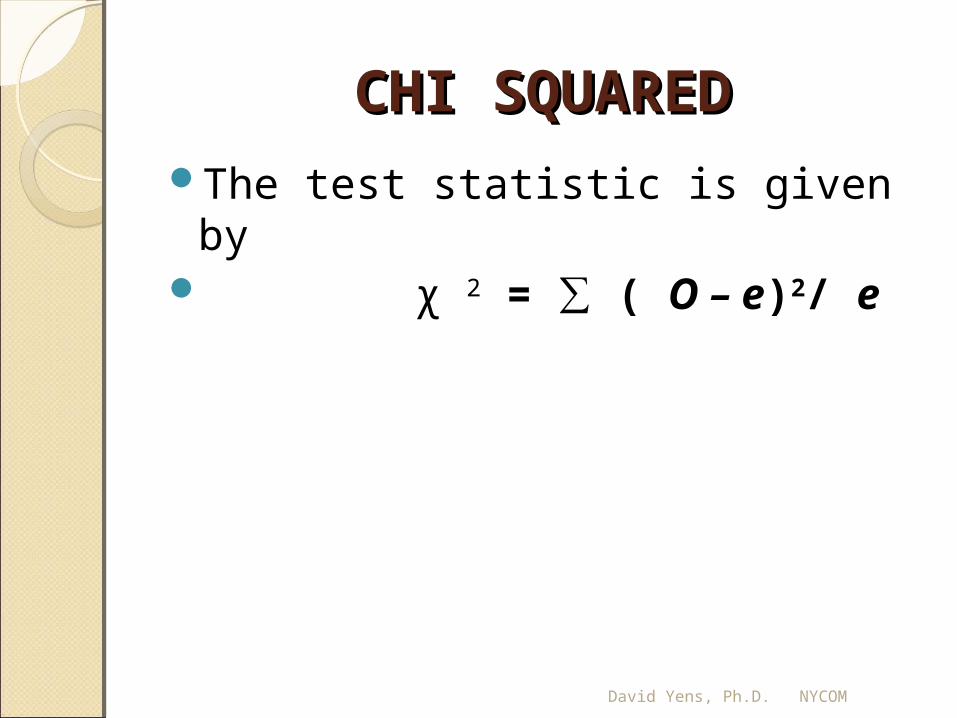
CHI SQUAREDCHI SQUAREDThe test statistic is given by χ 2 = ∑ ( O – e)2/ e

David Yens, Ph.D. NYCOM
CATEGORICAL FREQUENCY DATA: CATEGORICAL FREQUENCY DATA: TESTS OF SIGNIFICANCETESTS OF SIGNIFICANCE
CHI-SQUARED 2x2 A table in which frequencies correspond to two
variables. (One variable is used to categorize rows, and a second variable is used to categorize columns.)
Contingency tables have at least two rows and at least two columns.
Test of association; compares frequencies
◦ Based on the differences between observed and values and expected values
◦ Most often used with 2 x 2 tablesTreatment Control
Positive 15 5 20
Negative 10 20 30
25 25 50

David Yens, Ph.D. NYCOM
2x2 CHI-SQUARED2x2 CHI-SQUARED
First, we create a 2x2 contingency table, as shown below. Assume that in the treatment group 15 subjects had a positive response and 10 and a negative response, and for the control group 5 subjects had a positive response and 20 had a negative response. The letters on the table at the left identify the letters used in the formula below; the sample data table is on the right.
For a 2x2 table, the critical value is 3.84. If the Chi-Squared you calculate is > 3.84, the result is significant at p<.05.Treatment Control
A B A+BPositive Outcome 15 5 20
C D C+DNegative Outcome 10 20 30
A+C B+D N 25 25 50
))()()((
2)2/|(|2
DBCADCBA
NBCADN

SPSS CROSSTABULATIONSPSS CROSSTABULATIONANALYZE DESCRIPTIVE STATISTICS CROSSTABS
Note that for a Chi-Squared analysis an expected cell frequency of 5 or more is preferred. If less than 5, use Fisher’s Exact Test or Yates’ correction

David Yens, Ph.D. NYCOM
Yates’ Correction for Small Yates’ Correction for Small NumbersNumbers
Used if expected frequency for a cell is <5
χ 2 = Σ [|Oi – Ei|-.5]2/Ei

David Yens, Ph.D. NYCOM
Fisher’s Exact TestFisher’s Exact Test
For full computation for values as extreme or more extreme than the one observed, must compute the probability for each extreme case and sum the probabilities
Fisher’s Exact Test – for a 2x2 analysis with small numbers in each cell:
!!!!!
)!()!()!()!(
DCBAN
DBCADCBAP

PROBLEMPROBLEMUsing a database of toothbrushing
activity by children, we would like to know whether there is a difference between brushing activity by boys and girls. The data contain gender and whether or not they brush daily.
These are frequency data and appropriate for crosstabs with a Chi-Squared statistic.
(See Chapt. 7 of IBM SPSS)

DATA LAYOUTDATA LAYOUT Gender Daily Brushing M Y M N M N M N M Y M N M N F Y F Y F Y F Y F N F Y F Y F Y

OUTPUTOUTPUTF M
Count 1 5 6
Expected Count 3.2 2.8 6.0 Note small% within DailyBrushing 16.7% 83.3% 100.0% expected count% within Gender 12.5% 71.4% 40.0%
% of Total 6.7% 33.3% 40.0%
Count 7 2 9
Expected Count 4.8 4.2 9.0
% within DailyBrushing 77.8% 22.2% 100.0%
% within Gender 87.5% 28.6% 60.0%
% of Total 46.7% 13.3% 60.0%
Count 8 7 15
Expected Count 8.0 7.0 15.0
% within DailyBrushing 53.3% 46.7% 100.0%
% within Gender 100.0% 100.0% 100.0%
% of Total 53.3% 46.7% 100.0%
Value df
Asymp. Sig. (2-sided)
Exact Sig. (2-sided)
Exact Sig. (1-sided)
Pearson Chi-Square 5.402a 1 .020
Continuity Correctionb 3.225 1 .073
Likelihood Ratio 5.786 1 .016
Fisher's Exact Test .041 .035 Due to small expected cellN of Valid Cases 15 counts, this is best
Total
Chi-Square Tests
a. 4 cells (100.0%) have expected count less than 5. The minimum expected count is 2.80.
b. Computed only for a 2x2 table
DailyBrushing * Gender Crosstabulation
Gender
TotalDailyBrushing NO
YES

CROSSTABULATIONCROSSTABULATIONANALYZE DESCRIPTIVE STATISTICS CROSSTABSCrosstabs provides access to other
analyses:◦ Risk Ratios and Odds Ratios (pp. 114-
116)◦ Relative Risk: The ratio of incidence in
exposed (or group) of persons to incidence in nonexposed (other group) persons
◦ Odds Ratio – The odds that a case is exposed divided by the odds that a control is exposed

RELATIVE RISKRELATIVE RISKRELATIVE RISK (Cohort studies)
Ratio of the risk of disease in exposed individuals to the risk of disease in nonexposed individuals
Relative Risk =
David P. Yens, Ph.D. NYCOM
osednNonIncidenceI
nExposedIncidenceI
exp=
)/(
)/(
dcc
baa
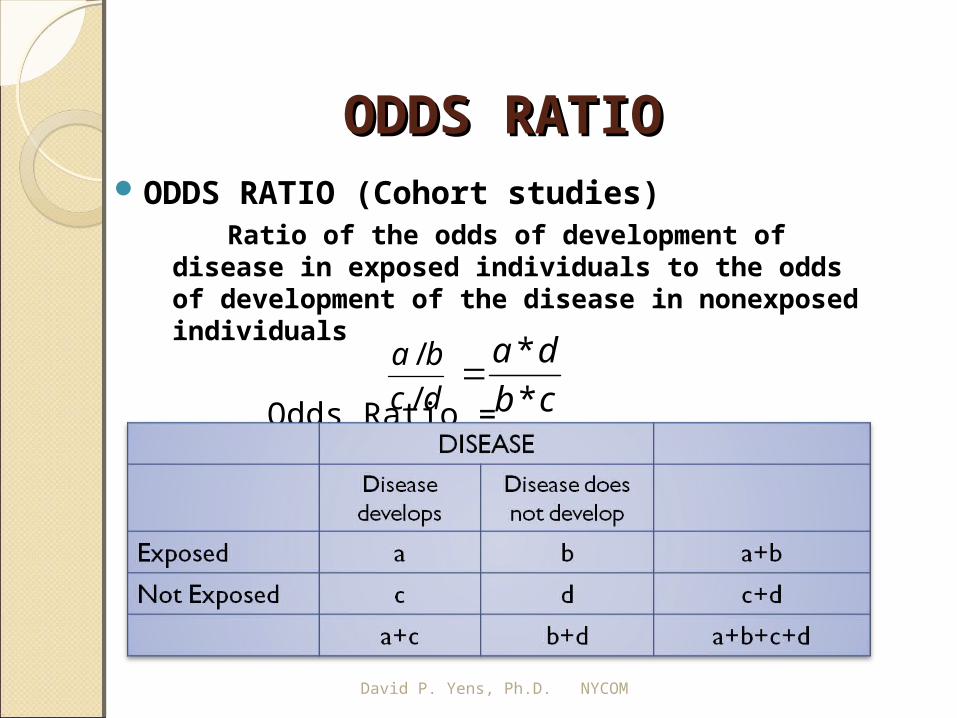
ODDS RATIOODDS RATIOODDS RATIO (Cohort studies)
Ratio of the odds of development of disease in exposed individuals to the odds of development of the disease in nonexposed individuals
Odds Ratio =
David P. Yens, Ph.D. NYCOM
dc
ba
/
/
cb
da
*
*

PROBLEMPROBLEM Consider the data taken from a study that attempts to
determine whether the use of electronic fetal monitoring (EFM) during labor affects the frequency of cesarean section deliveries. The 5824 infants included in the study, 2850 were electronically monitored and 2974 were not. The outcomes are as follows:
Calculate the odds ratio associated with EFM exposure.
EFM Exposure
Cesarean Delivery
Yes No Total
Yes 358 229 587
No 2492 2745 5237
Total 2850 2974 5824
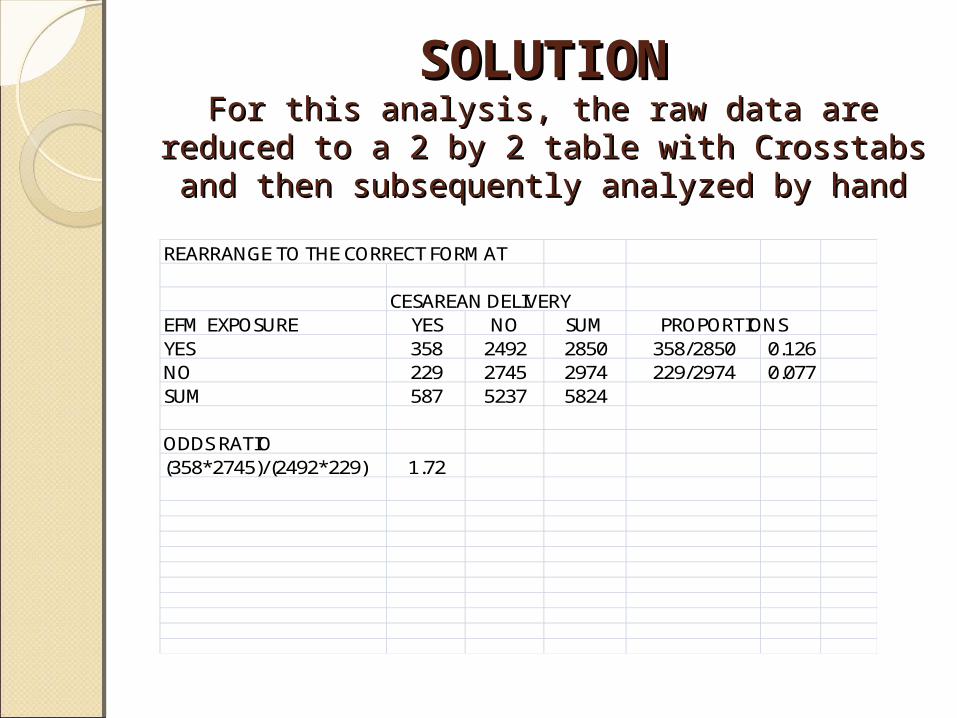
SOLUTIONSOLUTIONFor this analysis, the raw data are reduced to a For this analysis, the raw data are reduced to a
2 by 2 table with Crosstabs and then 2 by 2 table with Crosstabs and then subsequently analyzed by handsubsequently analyzed by hand
REARRANGE TO THE CORRECT FORMAT
CESAREAN DELIVERYEFM EXPOSURE YES NO SUMYES 358 2492 2850 358/2850 0.126NO 229 2745 2974 229/2974 0.077SUM 587 5237 5824
ODDS RATIO(358*2745)/(2492*229) 1.72
PROPORTIONS

CROSSTABULATIONCROSSTABULATIONANALYZE DESCRIPTIVE STATISTICS CROSSTABSCrosstabs provides access to other
analyses:◦Kappa – provides measure of agreement
between 2 judges: Cohen's kappa measures the agreement between the evaluations of two raters when both are rating the same object. A value of 1 indicates perfect agreement. A value of 0 indicates that agreement is no better than chance. Kappa is available only for tables in which both variables use the same category values and both variables have the same number of categories.

CROSSTABULATIONCROSSTABULATIONANALYZE DESCRIPTIVE STATISTICS CROSSTABSCrosstabs provides access to
other analyses:◦The 2 by 2 tables also provide the
basis for several other epidemiological computations
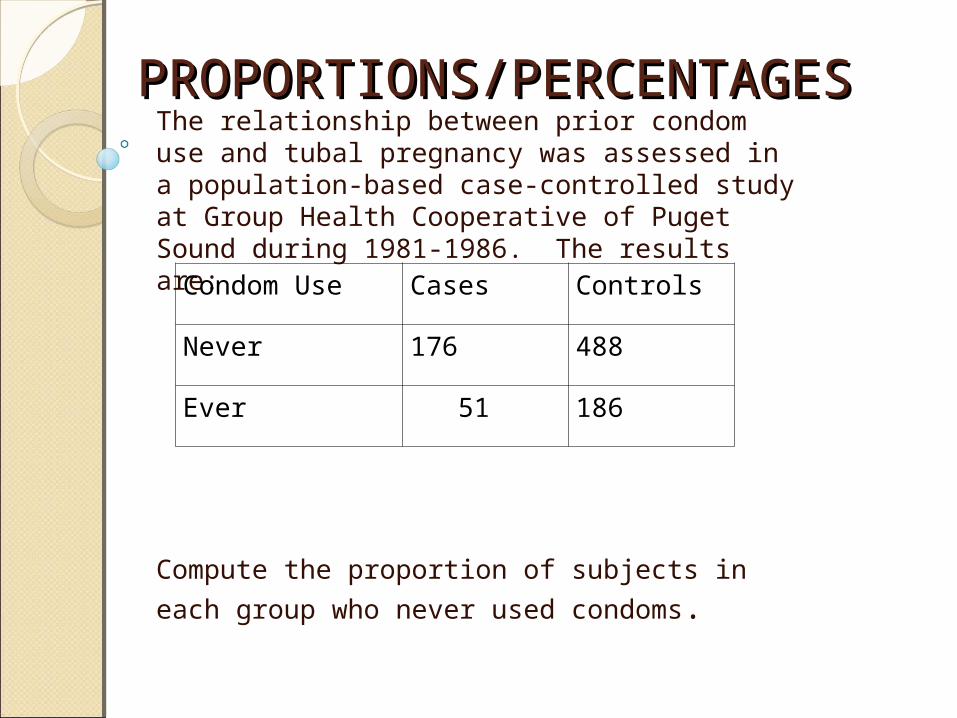
PROPORTIONS/PERCENTAGESPROPORTIONS/PERCENTAGESThe relationship between prior condom use and tubal pregnancy was assessed in a population-based case-controlled study at Group Health Cooperative of Puget Sound during 1981-1986. The results are:
Compute the proportion of subjects in each
group who never used condoms.
Condom Use Cases Controls
Never 176 488
Ever 51 186

COMPUTATION OF PROPORTION
CONDOM USE CASES CONTROLS SUMNever 176 488 664Ever 51 186 237SUM 227 674 901
Proportion who never used: Cases 176/227 0.775Controls 488/674 0.724
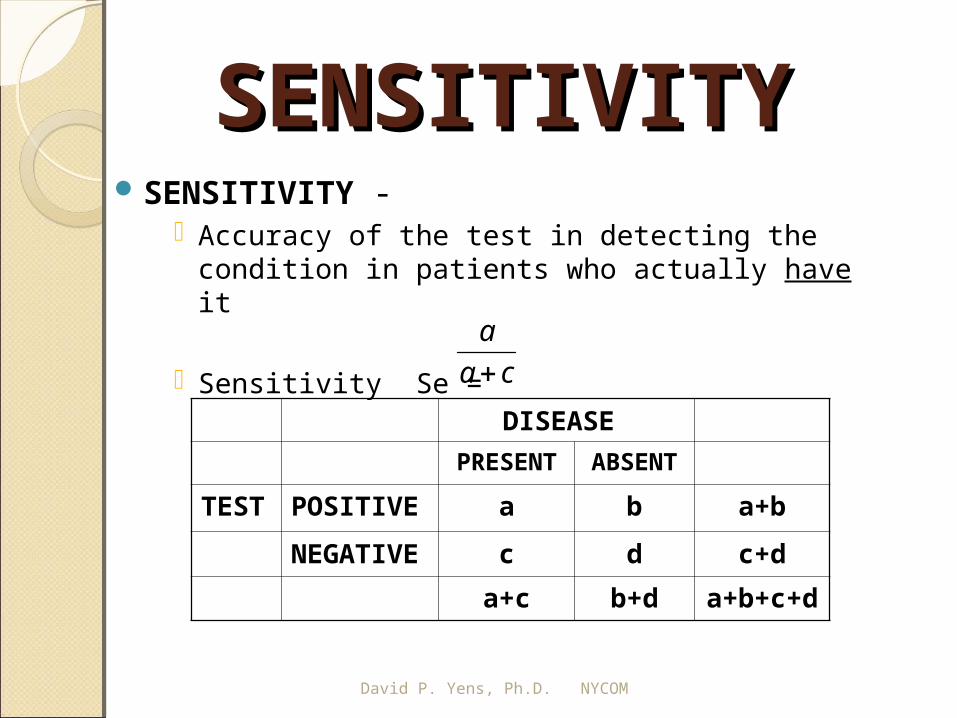
SENSITIVITYSENSITIVITYSENSITIVITY -
Accuracy of the test in detecting the condition in patients who actually have it
Sensitivity Se =
DISEASE
PRESENT ABSENT
TEST POSITIVE a b a+b
NEGATIVE c d c+d
a+c b+d a+b+c+d
ca
a
David P. Yens, Ph.D. NYCOM

SPECIFICITYSPECIFICITYSPECIFICITY -
How well the test correctly identifies patients who do not have the condition
Specificity Sp =
DISEASE
PRESENT ABSENT
TEST POSITIVE a b a+b
NEGATIVE c d c+d
a+c b+d a+b+c+d
David P. Yens, Ph.D. NYCOM
db
b

PROBLEMPROBLEM
Consider the following data:
Calculate the sensitivity and specificity of X-ray as a screening test for tuberculosis.
SOLUTION:SENSITIVITY = 22/30 = .73SPECIFICITY = 1739/1790 = .97
TuberculosisX-Ray No Yes TotalNegative 1739 8 1747Positive 51 22 73Total 1790 30 1820
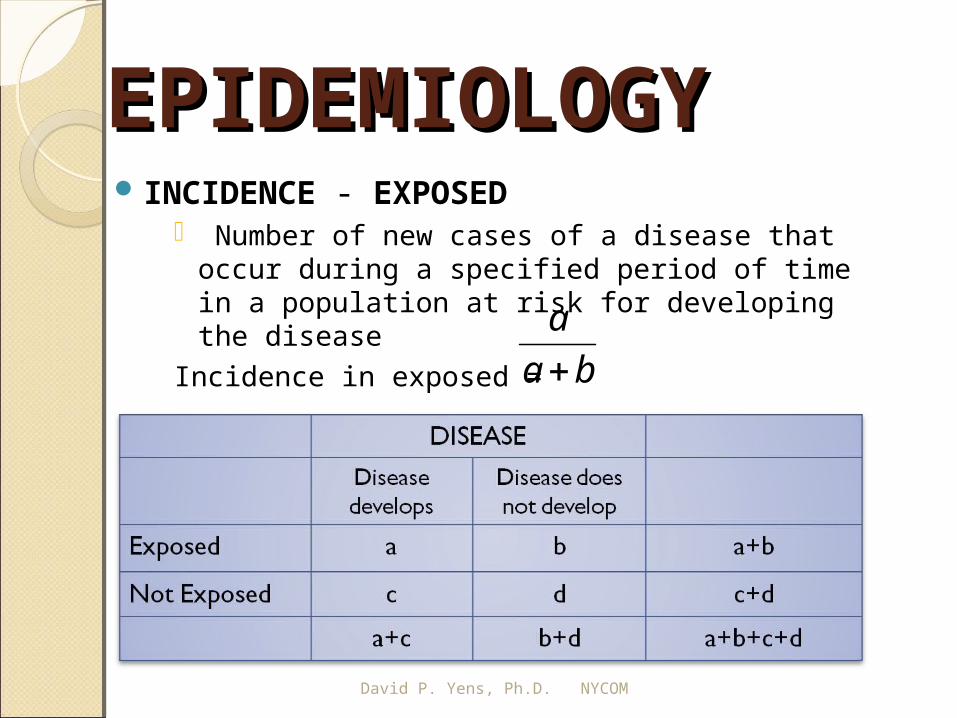
EPIDEMIOLOGYEPIDEMIOLOGY INCIDENCE - EXPOSED
Number of new cases of a disease that occur during a specified period of time in a population at risk for developing the disease
Incidence in exposed =
David P. Yens, Ph.D. NYCOM
ba
a

EPIDEMIOLOGYEPIDEMIOLOGY INCIDENCE - NONEXPOSED
Number of new cases of a disease that occur during a specified period of time in a population at risk for developing the disease
Incidence in Nonexposed =
David P. Yens, Ph.D. NYCOM
dc
c

EPIDEMIOLOGYEPIDEMIOLOGYPREVALENCE -
Proportion of patients in a given population who have a given disease
Prevalence, P =
DISEASE
PRESENT ABSENT
TEST POSITIVE a b a+b
NEGATIVE c d c+d
a+c b+d a+b+c+d
dcba
ca
David P. Yens, Ph.D. NYCOM
dcba
ca

EPIDEMIOLOGYEPIDEMIOLOGYLIKELIHOOD RATIO -
The odds that a test result occurs in patients with the disease versus those without the disease
Positive Likelihood Ratio, LR+ = -----------------
DISEASE
PRESENT ABSENT
TEST POSITIVE a b a+b
NEGATIVE c d c+d
a+c b+d a+b+c+d
dcba
ca
David P. Yens, Ph.D. NYCOM
ca
a
db
b

SEESEE YOU IN 2 YOU IN 2 WEEKSWEEKS