dawn methodology report, 2011 update...• dawn methodology report 2011 update (this report), •...
TRANSCRIPT
Drug Abuse Warning Network Methodology Report, 2011 Update
U.S. DEPARTMENT OF HEALTH AND HUMAN SERVICES Substance Abuse and Mental Health Services Administration
Center for Behavioral Health Statistics and Quality

2 D A W N M E T H O D O L O G Y R E P O R T , 2 0 1 1 U P D A T E
ACKNOWLEDGMENTS
This report was prepared by the Center for Behavioral Health Statistics and Quality (CBHSQ), Substance Abuse and Mental Health Services Administration (SAMHSA), U.S. Department of Health and Human Services (HHS), and by RTI International (a trade name of Research Triangle Institute, Research Triangle Park, NC). Work by RTI was performed under Contract No. HHSS283200700002I.
PUBLIC DOMAIN NOTICE
All material appearing in this publication is in the public domain and may be reproduced or copied without permission from SAMHSA. Citation of the source is appreciated. However, this publication may not be reproduced or distributed for a fee without the specific, written authorization of the Office of Communications, SAMHSA, HHS.
RECOMMENDED CITATION
Center for Behavioral Health Statistics and Quality (2013). Drug Abuse Warning Network Methodology Report, 2011 Update. Rockville, MD: Substance Abuse and Mental Health Services Administration.
ELECTRONIC ACCESS
This publication may be downloaded from http://store.samhsa.gov. Or please call SAMHSA at
1-877-SAMHSA-7 (1-877-726-4727) (English and Español).
ORIGINATING OFFICE
Center for Behavioral Health Statistics and Quality Substance Abuse and Mental Health Services Administration
1 Choke Cherry Road, Rockville, MD 20857
April 2013
D A W N M E T H O D O L O G Y R E P O R T , 2 0 1 1 U P D A T E 3
CONTENTS
Section Page
Introduction 7
1. Summary of DAWN Methodology, 2011 Update 9
1.1 2011 hospital participation and response rates ............................................................ 9
1.2 Determination of sample size for response rate calculation ....................................... 12
1.3 Population estimates .................................................................................................. 13
1.4 Analytic groups ........................................................................................................... 13
2. Overview of DAWN Data Program 15
2.1 Overview of DAWN ..................................................................................................... 15
2.2 Hospitals eligible to participate in DAWN ................................................................... 15
2.3 ED visits eligible for inclusion in DAWN ..................................................................... 15 2.4 Drugs reported for DAWN ED visits ........................................................................... 15
2.5 DAWN estimates of ED visits ..................................................................................... 16
2.6 DAWN public use files ................................................................................................ 16
2.7 Uses of DAWN data .................................................................................................... 16
3. Information Collected by DAWN 19
3.1 Approach to DAWN data collection ............................................................................ 19
3.2 ED visits eligible for DAWN ........................................................................................ 19
3.3 Case types in DAWN .................................................................................................. 20
3.4 Key data items ............................................................................................................ 23 3.4.1 Patient demographics .................................................................................... 24 3.4.2 Visit characteristics ........................................................................................ 25 3.4.3 Drugs and drug categories ............................................................................ 25 3.4.4 Visit disposition .............................................................................................. 26
4. Development of the ED Component of DAWN 29
4.1 DAWN ED sample design overview ........................................................................... 29 4.1.1 Sample frame of hospitals ............................................................................. 29 4.1.2 Metropolitan areas represented in DAWN ..................................................... 29 4.1.3 Metropolitan-level stratification ...................................................................... 30 4.1.4 Hospital size and ownership stratification...................................................... 30 4.1.5 Sample size and sample allocation ............................................................... 31
4.2 Data collection procedures ......................................................................................... 31 4.2.1 Review of ED medical records ...................................................................... 31
4 D A W N M E T H O D O L O G Y R E P O R T , 2 0 1 1 U P D A T E
4.2.2 Selection of ED medical records ................................................................... 32 4.3 Data preparation ......................................................................................................... 32
4.4 ED data and statistical processing ............................................................................. 32 4.4.1 ED data processing ....................................................................................... 33 4.4.2 DAWN sample maintenance ......................................................................... 33 4.4.3 Weights and adjustments .............................................................................. 34 4.4.4 Sequential process of developing and applying weights and
adjustments ................................................................................................... 35
5. DAWN Publications and Data Dissemination 37
5.1 Analytic groups ........................................................................................................... 37
5.2 Drug lists ..................................................................................................................... 38
5.3 Estimates of visits versus drugs ................................................................................. 39
5.4 Standardized rates ...................................................................................................... 39
5.5 Population estimates used to calculate rates ............................................................. 40
5.6 Measures of precision and error ................................................................................. 40 5.7 Suppression ................................................................................................................ 41
5.8 Cross-year comparisons ............................................................................................. 42
5.9 DAWN public use files ................................................................................................ 42
6. Quality Assurance/Quality Control 45
6.1 Minimization of nonsampling error .............................................................................. 45 6.1.1 Maintaining data quality during data collection and data preparation ........... 45 6.1.2 End-of-year data quality review ..................................................................... 45
6.2 Minimization of sampling error .................................................................................... 46
6.3 Quality control on released reports and tables ........................................................... 46
7. Data Limitations 47
7.1 Limitations of survey data ........................................................................................... 47 7.2 Limitations of using extant medical records................................................................ 47
7.3 Limitations on toxicology test finding .......................................................................... 48
8. History of DAWN, 1970–2012 49
D A W N M E T H O D O L O G Y R E P O R T , 2 0 1 1 U P D A T E 5
List of Figures
Figure 1. Type of case decision tree .......................................................................................... 22 Figure 2. DAWN ED case form .................................................................................................. 23
List of Tables
Table 1. Drug-related ED visits and drugs, by type of case, 2011 ........................................... 10 Table 2. DAWN sample characteristics, 2011 .......................................................................... 12 Table 3. U.S. population, by age and sex, 2011 ....................................................................... 13 Table 4. DAWN analytic groups ................................................................................................ 38 Table 5. Data items in the data quality review spreadsheet ..................................................... 46

D A W N M E T H O D O L O G Y R E P O R T , 2 0 1 1 U P D A T E 7
INTRODUCTION
This publication describes the methodologies used by the Drug Abuse Warning Network (DAWN), a program of the Center for Behavioral Health Statistics and Quality (CBHSQ), Substance Abuse and Mental Health Services Administration (SAMHSA), to collect, prepare, and analyze information on drug-related emergency department (ED) visits in the United States. An understanding of the methodology behind the collection and processing of DAWN data allows data users to better evaluate the validity, representativeness, and meaning of the findings. The methods described here were initiated in 2004 and are current as of 2011. Comparisons across data collection years can only be made for 2004–2011. Due to changes introduced to core survey features—such as the design of the sample, protocol for selecting charts to review, and the eligibility criteria for being a DAWN case in 2004—DAWN data for 2004 and forward are not comparable to data for earlier years (2003 and earlier).
This report is organized into eight parts:
1. Summary of DAWN Methodology, 2011 Update—Methodological highlights of the 2011 data collection year.
2. Overview of the DAWN data program—Brief summary of DAWN and its purpose. 3. Information collected by DAWN—What constitutes a drug-related ED visit and the data
items collected for each visit. 4. Development of the ED component of DAWN—How DAWN data on drug-related ED visits
are collected and processed to make representative national and metropolitan area estimates using survey data.
5. DAWN publications and data dissemination—How DAWN data are organized, summarized, and presented to address different statistical and analytic goals.
6. Quality assurance/quality control—Methods and procedures used to ensure that DAWN data are as accurate, precise, and reliable as possible.
7. Data limitations—DAWN collects data on ED visits from a sample of hospitals and relies solely on existing medical records maintained by these hospitals; as a result, there are some limitations to consider when interpreting results.
8. History of DAWN, 1970–2012—How DAWN came into existence and has been maintained for over 40 years.
For convenience, the 2011 DAWN ED Annual Report includes as attachments all methodological documents related to the 2011 data collection year. These attachments include the following:
• DAWN Glossary, 2011 Update, • DAWN Methodology Report 2011 Update (this report), • Guide to DAWN Trend Tables, 2011 Update (including link to 2011 Trend Tables), and • 2007–2011 ED Reference Guide (instructions for DAWN Field Reporters).
8 D A W N M E T H O D O L O G Y R E P O R T , 2 0 1 1 U P D A T E
These items individually as well as additional information about DAWN are provided on the DAWN Web site.1 Available at the site are
• annual reports for 2004 through 2011 that summarize overall DAWN ED findings; • short reports that highlight DAWN findings on specialized topics for the nation and select
metropolitan areas; • detailed tables of DAWN estimates for the Nation and select metropolitan areas for the
years 2004 through 2011; • additional, more detailed methodology and design reports; • background information on SAMHSA, CBHSQ, and the contractors responsible for DAWN
data collection and analysis; • Multum Lexicon Licensing Agreement (terms for use of the Multum Lexicon, © 2012); • Details on the Drug Reference Vocabulary (DRV, drug name coding system used by
DAWN); and • links to other materials on the SAMHSA Web site.
1 DAWN documents can be found on the DAWN Web site, http://www.samhsa.gov/data/DAWN.aspx.

D A W N M E T H O D O L O G Y R E P O R T , 2 0 1 1 U P D A T E 9
1. SUMMARY OF DAWN METHODOLOGY, 2011 UPDATE
This section documents the participation of sampled hospitals in 2011 and other survey methodology information relevant for the Drug Abuse Warning Network (DAWN) data collection year 2011. Additional detail on the basic DAWN data collection and survey methodology is provided in subsequent sections.
1.1 2011 hospital participation and response rates
DAWN relies on a longitudinal probability sample of hospitals located throughout the United States, including Alaska and Hawaii. To be eligible for selection into the DAWN sample, a hospital must be a non-Federal, short-stay, general surgical and medical hospital located in the United States, with at least one 24-hour emergency department (ED).
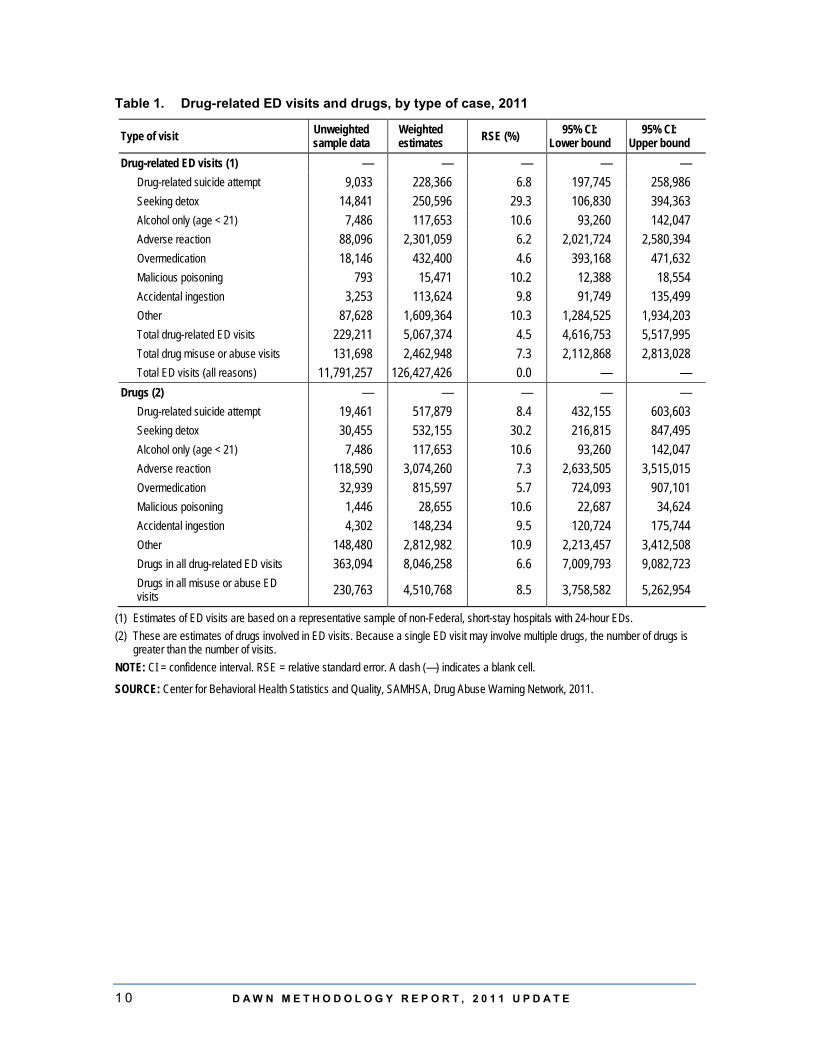
For data collection year 2011, data were collected from a representative sample of hospitals in the Nation and select metropolitan areas. Over 5 million ED visit charts out of a universe of 12.2 million charts at reporting hospitals were reviewed.2 Data submitted by 233 participating hospitals on 229,211 drug-related ED visits were used in estimation (Table 1).3
Estimates for the entire universe of DAWN-eligible hospitals in the United States are produced by applying poststratified weights to the data received from the participating sampled hospitals. Thus, for 2011, a total of 229,211 submitted cases was extrapolated to an estimate of 5,067,374 drug-related ED visits. Considering the margin of error, this estimate may range from 4,616,753 to 5,517,995 drug-related ED visits out of the approximately 126 million total ED visits estimated for the universe of DAWN-eligible hospitals. Of these approximately 5.1 million drug-related visits, 2.5 million were considered to involve drug misuse or abuse, with the balance primarily involving adverse reactions and accidental ingestions.
2 DAWN draws a systematic sample of eligible charts to review. 3 Not all hospitals reporting to DAWN are part of the current sample. These hospitals’ data are provided to
them for local use. Therefore, the number of drug-related ED visits used in estimation is smaller than the total number identified.
1 0 D A W N M E T H O D O L O G Y R E P O R T , 2 0 1 1 U P D A T E
Table 1. Drug-related ED visits and drugs, by type of case, 2011
Type of visit Unweighted sample data
Weighted estimates RSE (%) 95% CI:
Lower bound 95% CI:
Upper bound Drug-related ED visits (1) — — — — —
Drug-related suicide attempt 9,033 228,366 6.8 197,745 258,986 Seeking detox 14,841 250,596 29.3 106,830 394,363 Alcohol only (age < 21) 7,486 117,653 10.6 93,260 142,047 Adverse reaction 88,096 2,301,059 6.2 2,021,724 2,580,394 Overmedication 18,146 432,400 4.6 393,168 471,632 Malicious poisoning 793 15,471 10.2 12,388 18,554 Accidental ingestion 3,253 113,624 9.8 91,749 135,499 Other 87,628 1,609,364 10.3 1,284,525 1,934,203 Total drug-related ED visits 229,211 5,067,374 4.5 4,616,753 5,517,995 Total drug misuse or abuse visits 131,698 2,462,948 7.3 2,112,868 2,813,028 Total ED visits (all reasons) 11,791,257 126,427,426 0.0 — —
Drugs (2) — — — — — Drug-related suicide attempt 19,461 517,879 8.4 432,155 603,603 Seeking detox 30,455 532,155 30.2 216,815 847,495 Alcohol only (age < 21) 7,486 117,653 10.6 93,260 142,047 Adverse reaction 118,590 3,074,260 7.3 2,633,505 3,515,015 Overmedication 32,939 815,597 5.7 724,093 907,101 Malicious poisoning 1,446 28,655 10.6 22,687 34,624 Accidental ingestion 4,302 148,234 9.5 120,724 175,744 Other 148,480 2,812,982 10.9 2,213,457 3,412,508 Drugs in all drug-related ED visits 363,094 8,046,258 6.6 7,009,793 9,082,723 Drugs in all misuse or abuse ED visits 230,763 4,510,768 8.5 3,758,582 5,262,954
(1) Estimates of ED visits are based on a representative sample of non-Federal, short-stay hospitals with 24-hour EDs. (2) These are estimates of drugs involved in ED visits. Because a single ED visit may involve multiple drugs, the number of drugs is
greater than the number of visits. NOTE: CI = confidence interval. RSE = relative standard error. A dash (—) indicates a blank cell.
SOURCE: Center for Behavioral Health Statistics and Quality, SAMHSA, Drug Abuse Warning Network, 2011.
D A W N M E T H O D O L O G Y R E P O R T , 2 0 1 1 U P D A T E 1 1
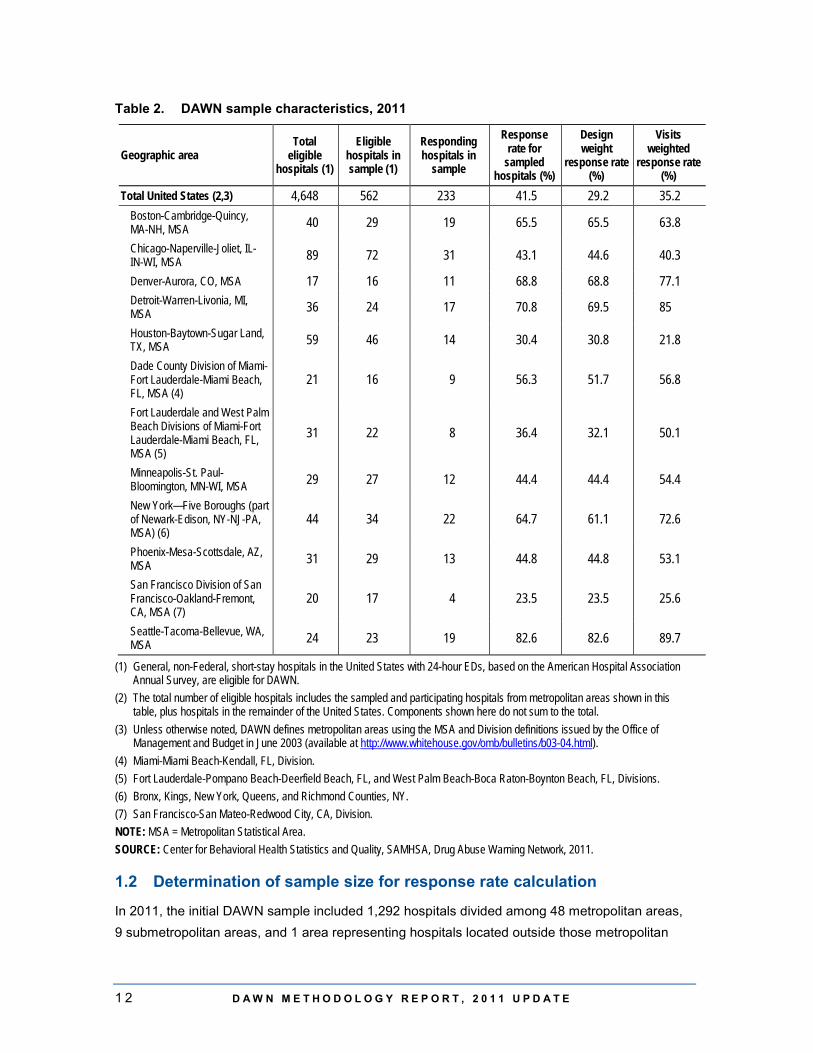
Table 2 lists hospital, design, and visit response rates for the Nation and the 12 metropolitan statistical areas (MSAs) that had sufficient participation in 2011 to warrant separate estimates. The national hospital response rate was 41.5 percent; the design weight response rate was 29.2 percent; and the visits weighted response rate was 35.2 percent. At the metropolitan area level, the hospital response rate ranged from 23.5 percent to 82.6 percent; the design weight response rate ranged from 23.5 percent to 82.6 percent; and the visit weighted response rate ranged from 21.8 percent to 89.7 percent.
1 2 D A W N M E T H O D O L O G Y R E P O R T , 2 0 1 1 U P D A T E
Table 2. DAWN sample characteristics, 2011
Geographic area Total
eligible hospitals (1)
Eligible hospitals in sample (1)
Responding hospitals in
sample
Response rate for
sampled hospitals (%)
Design weight
response rate (%)
Visits weighted
response rate (%)
Total United States (2,3) 4,648 562 233 41.5 29.2 35.2 Boston-Cambridge-Quincy, MA-NH, MSA 40 29 19 65.5 65.5 63.8
Chicago-Naperville-Joliet, IL-IN-WI, MSA 89 72 31 43.1 44.6 40.3
Denver-Aurora, CO, MSA 17 16 11 68.8 68.8 77.1 Detroit-Warren-Livonia, MI, MSA 36 24 17 70.8 69.5 85
Houston-Baytown-Sugar Land, TX, MSA 59 46 14 30.4 30.8 21.8
Dade County Division of Miami-Fort Lauderdale-Miami Beach, FL, MSA (4)
21 16 9 56.3 51.7 56.8
Fort Lauderdale and West Palm Beach Divisions of Miami-Fort Lauderdale-Miami Beach, FL, MSA (5)
31 22 8 36.4 32.1 50.1
Minneapolis-St. Paul-Bloomington, MN-WI, MSA 29 27 12 44.4 44.4 54.4
New York—Five Boroughs (part of Newark-Edison, NY-NJ-PA, MSA) (6)
44 34 22 64.7 61.1 72.6
Phoenix-Mesa-Scottsdale, AZ, MSA 31 29 13 44.8 44.8 53.1
San Francisco Division of San Francisco-Oakland-Fremont, CA, MSA (7)
20 17 4 23.5 23.5 25.6
Seattle-Tacoma-Bellevue, WA, MSA 24 23 19 82.6 82.6 89.7
(1) General, non-Federal, short-stay hospitals in the United States with 24-hour EDs, based on the American Hospital Association Annual Survey, are eligible for DAWN.
(2) The total number of eligible hospitals includes the sampled and participating hospitals from metropolitan areas shown in this table, plus hospitals in the remainder of the United States. Components shown here do not sum to the total.
(3) Unless otherwise noted, DAWN defines metropolitan areas using the MSA and Division definitions issued by the Office of Management and Budget in June 2003 (available at http://www.whitehouse.gov/omb/bulletins/b03-04.html).
(4) Miami-Miami Beach-Kendall, FL, Division. (5) Fort Lauderdale-Pompano Beach-Deerfield Beach, FL, and West Palm Beach-Boca Raton-Boynton Beach, FL, Divisions. (6) Bronx, Kings, New York, Queens, and Richmond Counties, NY. (7) San Francisco-San Mateo-Redwood City, CA, Division. NOTE: MSA = Metropolitan Statistical Area. SOURCE: Center for Behavioral Health Statistics and Quality, SAMHSA, Drug Abuse Warning Network, 2011.
1.2 Determination of sample size for response rate calculation
In 2011, the initial DAWN sample included 1,292 hospitals divided among 48 metropolitan areas, 9 submetropolitan areas, and 1 area representing hospitals located outside those metropolitan
D A W N M E T H O D O L O G Y R E P O R T , 2 0 1 1 U P D A T E 1 3
areas. Response rates and nonresponse bias were assessed to determine which of these areas had sufficient participation to warrant separate estimates. In 2011, a total of 12 areas (9 metropolitan areas and 3 submetropolitan areas) was determined to be able to support separate estimates. Oversampled hospitals in the areas that could not support separate estimates were treated as if they were not sampled. For 2011, this has the effect of reducing the sample from 1,292 hospitals to 562 hospitals, the number used for purposes of computing the overall response rates.
1.3 Population estimates
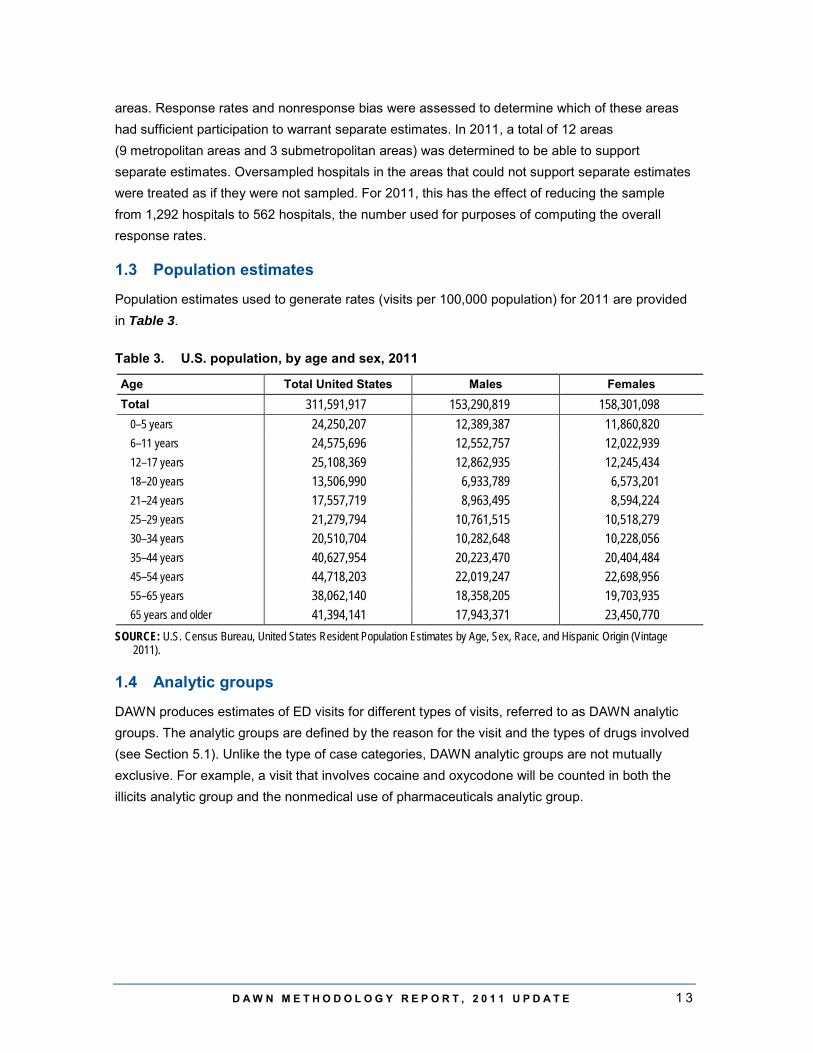
Population estimates used to generate rates (visits per 100,000 population) for 2011 are provided in Table 3.
Table 3. U.S. population, by age and sex, 2011
Age Total United States Males Females Total 311,591,917 153,290,819 158,301,098
0–5 years 24,250,207 12,389,387 11,860,820 6–11 years 24,575,696 12,552,757 12,022,939 12–17 years 25,108,369 12,862,935 12,245,434 18–20 years 13,506,990 6,933,789 6,573,201 21–24 years 17,557,719 8,963,495 8,594,224 25–29 years 21,279,794 10,761,515 10,518,279 30–34 years 20,510,704 10,282,648 10,228,056 35–44 years 40,627,954 20,223,470 20,404,484 45–54 years 44,718,203 22,019,247 22,698,956 55–65 years 38,062,140 18,358,205 19,703,935 65 years and older 41,394,141 17,943,371 23,450,770
SOURCE: U.S. Census Bureau, United States Resident Population Estimates by Age, Sex, Race, and Hispanic Origin (Vintage 2011).
1.4 Analytic groups
DAWN produces estimates of ED visits for different types of visits, referred to as DAWN analytic groups. The analytic groups are defined by the reason for the visit and the types of drugs involved (see Section 5.1). Unlike the type of case categories, DAWN analytic groups are not mutually exclusive. For example, a visit that involves cocaine and oxycodone will be counted in both the illicits analytic group and the nonmedical use of pharmaceuticals analytic group.

1 4 D A W N M E T H O D O L O G Y R E P O R T , 2 0 1 1 U P D A T E
The total number of ED visits for the seven analytic groups related to drug misuse or abuse are as follows:
• ED visits resulting from medical emergencies involving drug misuse or abuse – 2,462,948 visits: – ED visits involving illicit drugs – 1,252,500 visits;
– ED visits involving use of alcohol in combination with other drugs – 606,653 visits;
– ED visits involving underage drinking – 188,706 visits;
– ED visits involving nonmedical use of pharmaceuticals – 1,244,872 visits;
– ED visits resulting from drug-related suicide attempts – 228,366 visits; and
– ED visits for the purpose of seeking detox services – 250,596 visits.
Estimates for ED visits related to adverse reactions to and accidental ingestions of pharmaceuticals, medications, and other health-related products available over the counter are also produced. These groups are not related to drug abuse or misuse and are as follows:
• ED visits resulting from an adverse reaction to a drug – 2,301,059 visits; and • ED visits resulting from accidental ingestion of a drug – 113,624 visits (of these, 77,074
visits were by patients aged 5 and under).
D A W N M E T H O D O L O G Y R E P O R T , 2 0 1 1 U P D A T E 1 5
2. OVERVIEW OF DAWN DATA PROGRAM 2.1 Overview of DAWN
DAWN is a public health surveillance system that reports on drug-related visits to hospital EDs.4 DAWN is used to monitor trends in drug misuse and abuse, identify the emergence of new substances and drug combinations, assess health hazards associated with drug use and abuse, and estimate the impact of drug use, misuse, and abuse on the Nation's health care system.
2.2 Hospitals eligible to participate in DAWN
DAWN's target sample frame consists of all non-Federal, short-stay, general medical and surgical hospitals in the United States that have one or more EDs open 24 hours a day. DAWN employs a multistage sampling design for the selection of EDs for analysis. Stratified simple random sampling with oversampling in selected metropolitan areas is used to select the hospitals.
2.3 ED visits eligible for inclusion in DAWN
A DAWN case is any ED visit involving recent drug use. DAWN cases are identified through the review of ED medical records in participating hospitals. DAWN captures both ED visits that are directly caused by drugs and those in which drugs are a contributing factor but not the direct cause of the ED visit. These criteria encompass all types of drug-related events, including accidental ingestion and adverse reaction, as well as drug misuse or abuse. Within each hospital, 50 percent to 100 percent of the days of the month are systematically selected, and a census of ED visits is selected for review for these days.
2.4 Drugs reported for DAWN ED visits
DAWN collects data on all types of drugs—illegal drugs, prescription and over-the-counter medications, dietary supplements, and both pharmaceutical and nonpharmaceutical inhalants. DAWN notes whether alcohol is involved in addition to drug(s) for patients of all ages. Because alcohol is considered an illicit drug for minors, alcohol abuse without the involvement of other drugs is considered a drug-related ED visit for patients under the age of 21. DAWN does not report current medications (i.e., medications and pharmaceuticals taken regularly by the patient as prescribed or indicated) that are deemed by the ED medical staff to be unrelated to the ED visit.
DAWN classifies drugs using a modified version of the Multum Lexicon, © 2012, a drug vocabulary and classification tool originated by Multum Information Services, Inc. DAWN has adapted the Lexicon to allow for the inclusion of illegal drugs, inhalants, and alternative medicines that are reported to DAWN.
4 Drug-related visits are defined by DAWN as any ED visit related to recent drug use. Additional detail on
DAWN’s definition of drug-related visits is provided in Section 3.2.
1 6 D A W N M E T H O D O L O G Y R E P O R T , 2 0 1 1 U P D A T E
2.5 DAWN estimates of ED visits
Annually, DAWN produces estimates of drug-related visits to hospital EDs for the Nation as a whole and for selected metropolitan areas. DAWN Trend Tables contain weighted estimates of drug-related ED visits that are the result of drug misuse or abuse, adverse reactions to drugs, and accidental ingestion of drugs. Among visits resulting from drug misuse or abuse, separate estimates are made of visits involving illicit drugs, nonmedical use of pharmaceuticals, and alcohol. Estimates are also made of ED visits resulting from drug-related suicide attempts, ED visits made by patients seeking detoxification services, and visits involving alcohol (with or without other drugs) for patients under the age of 21. For each of these types of visits, estimates are available by patient sex, age group, and race/ethnicity. Estimates are also provided for each visit's disposition (e.g., treated and released, admitted to the hospital intensive or critical care unit [ICU], died). Estimates are made of the different types of drugs involved in each of these categories of visits. These sets of estimates are prepared for the Nation as a whole and for selected metropolitan areas where hospital participation was high enough to produce reliable results.
DAWN Trend Tables containing ED estimates are available at the DAWN Web site.5 The document Guide to the DAWN Trend Tables provides guidance on accessing these tables, understanding their content, and locating data items of interest.6
2.6 DAWN public use files
The DAWN public use file (PUF) containing ED visit-level data is available through the Substance Abuse and Mental Health Data Archive (SAMHDA).7 The SAMHDA site offers a query capacity to build tables online using the DAWN PUF data as well as the means to download data files. The presentation Analyzing the Drug Abuse Warning Network (DAWN) Data available at the DAWN Web site provides guidance on accessing, interpreting, and analyzing DAWN PUF data. Additional detailed documentation for the DAWN PUF is also available at the SAMHDA site. The weights needed to produce estimates representative of the Nation and select metropolitan areas are provided in the DAWN PUF. A lengthier description of SAMHDA's services is provided in Section 5.9 of this document.
2.7 Uses of DAWN data
DAWN is a major component of the Nation's capacity to monitor trends in the morbidity and mortality associated with drug misuse and abuse. DAWN is the only national data system providing estimates of the number of ED admissions associated with drug misuse and abuse and the particular drugs involved both for the United States as a whole and also for selected metropolitan areas. Additionally, DAWN is the only national data collection system on drug abuse
5 DAWN documents can be found on the DAWN Web site at http://www.samhsa.gov/data/DAWN.aspx. 6 Guide to the DAWN Trend Tables is available as an attachment to the DAWN ED Annual Reports and as
a freestanding document at the DAWN Web site. 7 DAWN data can be found on the SAMHDA Web site at http://www.icpsr.umich.edu/icpsrweb/SAMHDA/.
D A W N M E T H O D O L O G Y R E P O R T , 2 0 1 1 U P D A T E 1 7
with the capacity to monitor specific and relatively infrequently used substances of abuse (e.g., club drugs, phencyclidine [PCP], or medications used to treat attention deficit hyperactivity disorder [ADHD]) as they emerge and diffuse across population groups and geographic areas.
Within the Substance Abuse and Mental Health Services Administration (SAMHSA), DAWN data help SAMHSA to target program resources to areas of greatest need and to assess program impact. For example, as part of its intervention programming, SAMHSA uses DAWN data to monitor adverse events associated with buprenorphine treatment for opiate addiction. Additionally, DAWN data are used by the Center for Behavioral Health Statistics and Quality (CBHSQ) to prepare reports on topics of interest to the public health community, to provide regular updates to SAMHSA and other federal agencies on trends in drug involvement, and to respond to ad hoc inquiries from public health researchers. DAWN estimates are used to monitor trends in major substances of abuse (e.g., heroin, cocaine, marijuana); to assess alcohol use by minors that results in ED visits; to identify emerging new drugs of abuse (e.g., synthetic cannabinoids, "bath salts"); and to identify the misuse and abuse potential of prescription and over-the-counter drugs. The DAWN Web site provides a complete listing of all publicly available reports developed by SAMHSA using DAWN data.
Outside of SAMHSA, DAWN is used by national, state, and local health professionals, policymakers, law enforcement officers, and pharmacologists to understand the consequences of drug use and abuse and to identify emerging trends and changing patterns of drug use. The White House Office of National Drug Control Policy uses DAWN data to monitor national trends; the Drug Enforcement Administration uses it for surveillance, diversion control, and intelligence; and, at the direction of the Food and Drug Administration, the pharmaceutical industry uses it to conduct post-marketing surveillance of prescription and over-the-counter pharmaceuticals, monitor adverse events associated with medications, and assess the abuse potential that drives labeling and scheduling decisions. State and local professionals, including law enforcement and the Community Epidemiology Work Group, use DAWN to assess changes in local trends and patterns of drug use.

D A W N M E T H O D O L O G Y R E P O R T , 2 0 1 1 U P D A T E 1 9
3. INFORMATION COLLECTED BY DAWN 3.1 Approach to DAWN data collection
DAWN data are collected through a retrospective review of ED medical records for patients treated in the ED. Patients or families are never interviewed. The review of source records is performed by a trained DAWN Reporter in each member facility. Depending on the needs of the facility, the DAWN Reporter may be an employee of the hospital or an employee of the DAWN operations contractor. For each facility that participates in DAWN, the designated DAWN Reporter reviews all medical records to find ED visits related to drug use. The DAWN Reporter submits an electronic case report to the DAWN system for each ED visit that meets the specific case selection criteria. DAWN Reporters also track, on a copy of the ED registration log, their progress in reviewing the universe of ED visits. Because of the volume in some EDs, a sample of medical records is obtained rather than reviewing a census. This subsampling introduces another component of variance that is accounted for in the weighting and estimation process.
3.2 ED visits eligible for DAWN
A DAWN case is any ED visit where the patient was treated in the ED for a condition that was induced by or related to recent drug use. The patient chart is reviewed by the DAWN Reporter to determine if there is evidence that a drug(s) is involved. The patient ED chart has three key areas, and this evidence may come from any one of these areas: patient's chief complaint; physician's, nurse's, and/or other appropriate clinician's assessment; and/or diagnosis detail. The drug use must be implicated in the ED visit, but it does not need to be the direct cause. The reason a patient used a drug is not a factor in determining whether the ED visit is a DAWN case. Only drugs that are determined to be involved are recorded in the DAWN system. Unrelated drugs that are simply "on board" are not recorded.
As a result of these criteria and approaches, DAWN includes ED visits associated with substance abuse and misuse, both intentional and accidental, as well as ED visits related to the use of drugs for legitimate therapeutic purposes and under a doctor's direction. The DAWN visit eligibility criteria are intended to be broad and inclusive and to have few exceptions. They take into account the fact that documentation in medical records varies in clarity and completeness across hospitals and among clinicians within hospitals. The criteria are designed to minimize the potential for DAWN Reporter judgments that could cause data to vary systematically and unexpectedly across different data collectors and hospitals. In addition, the criteria allow for the capture of a diverse set of drug-related visits that can be aggregated or disaggregated to serve a variety of analytical purposes and the interests of multiple audiences.
2 0 D A W N M E T H O D O L O G Y R E P O R T , 2 0 1 1 U P D A T E
There are a few clearly delineated exceptions to the DAWN eligibility criteria. An ED visit is not a DAWN visit if
• there is no evidence of recent drug use; • the patient left the ED without being treated; • the patient consumed a nonpharmaceutical substance but did not inhale it; • the patient has a history of drug use but no recent use; • alcohol is the only substance involved, and the patient is an adult (aged 21 or older); • all the drugs mentioned in the ED record are not related to the ED visit (e.g., list of current
medications); • drugs identified in toxicology testing are not related to the visit, and the medical record
does not contain any additional drug-related information that would make the visit a DAWN case; or
• the patient is being treated as a consequence of undermedication (i.e., taking too little of a drug).
3.3 Case types in DAWN
By design, DAWN's broad case criteria yield a diverse set of visits. To bring order to this heterogeneous mix of ED visits, DAWN Field Reporters assign each visit to one of eight case types.8 The eight case types are as follows:
• drug-related suicide attempt; • patient seeking detoxification; • alcohol use only, in patients younger than 21; • adverse reaction; • overmedication; • malicious poisoning (e.g., drug-facilitated sexual assault, product tampering); • accidental ingestion; and • other.
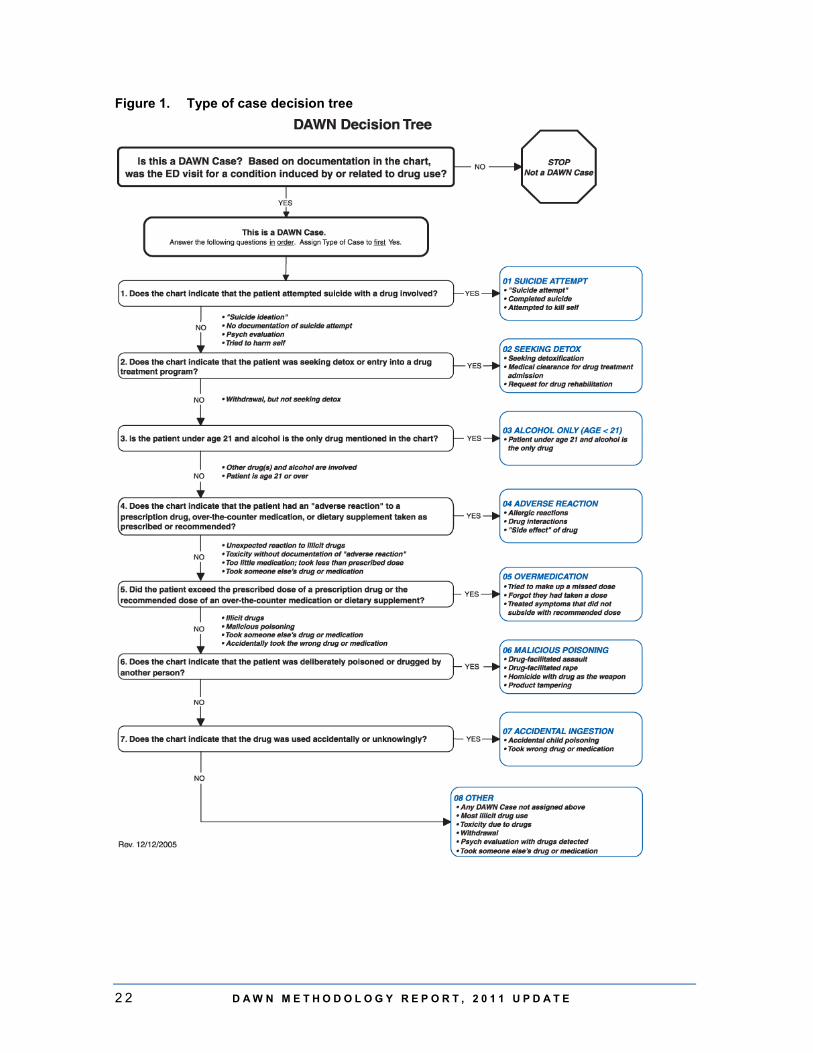
Each ED visit is assigned to a single case type. Because many ED visits meet the criteria for more than one case type, the case types are assigned based on an algorithm depicted in the DAWN Decision Tree (Figure 1). Each ED visit is assigned to the first applicable case type. To assist DAWN Reporters with case assignment, a series of questions and decision rules is included with the DAWN Decision Tree; detailed instructions are included in the 2007–2011 ED Reference Guide.9
8 DAWN Reporters are responsible for reviewing ED visit records, deciding if a visit is eligible for DAWN,
and, if so, recording select data items for the visit. Additional information on collection of DAWN data is provided in Section 3.2.
9 The 2007–2011 ED Reference Guide is available at the DAWN Web site (http://www.samhsa.gov/data/DAWN.aspx).

D A W N M E T H O D O L O G Y R E P O R T , 2 0 1 1 U P D A T E 2 1
The final category in the decision tree, Other, is reserved for DAWN visits that do not meet any of the rules for classification into one of the first seven types. Most cases of drug abuse are classified as Other. This approach, which never directly identifies drug abuse, comes from the recognition that medical records frequently lack explicit documentation of substance abuse. This lack of documentation may occur for several reasons. First, the distinctions among use, misuse, and abuse are often subjective. Second, if there is a low index of suspicion for drug abuse in some types of patients (e.g., older adults), ED physicians may be unlikely to label those types of patients as drug abusers. Third, ED staff may be concerned that the patient's insurance company will disallow coverage if the visit is related to substance abuse.
The case type of a visit, in combination with the types of drugs involved, is used to construct groupings of visits that have similar characteristics—for example, visits for drug abuse involving illicit drugs. Section 5.1 provides additional details on how visits are grouped for the purpose of analyses.
2 2 D A W N M E T H O D O L O G Y R E P O R T , 2 0 1 1 U P D A T E
Figure 1. Type of case decision tree
D A W N M E T H O D O L O G Y R E P O R T , 2 0 1 1 U P D A T E 2 3
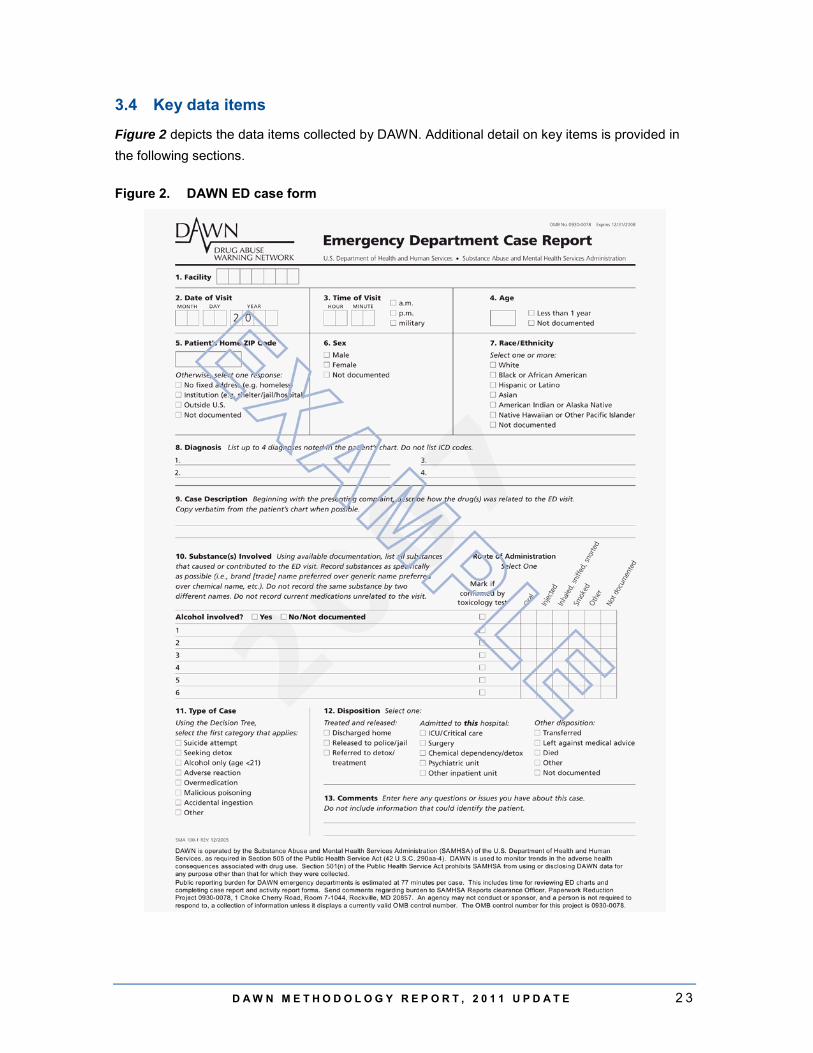
3.4 Key data items
Figure 2 depicts the data items collected by DAWN. Additional detail on key items is provided in the following sections.
Figure 2. DAWN ED case form
2 4 D A W N M E T H O D O L O G Y R E P O R T , 2 0 1 1 U P D A T E
3.4.1 Patient demographics
DAWN collects information on basic patient demographics: sex, age, race/ethnicity, and patient home ZIP code. The ZIP code variable has space to indicate if the patient was homeless, institutionalized, or from outside the United States and, therefore, has no home ZIP code.
For reporting purposes, age is typically collapsed into the following groups:
• 0-5 • 6-11 • 12-17 • 18-20 • 21-24 • 25-29 • 30-34 • 35-44 • 45-54 • 55-64 • 65 and older
The age categories used for reporting ED visits reflect critical junctures in drug use. For example, patients aged 5 and under are reported separately to facilitate study of visits involving accidental ingestion. Patients aged 12 to 17 are considered to be in their formative years, and understanding the nature of their drug use is important for prevention efforts. Patients under the age of 21 are reported separately to facilitate study of topics such as underage drinking. Patients aged 18 to 20 are reported separately from those aged 21 to 24 to isolate drug-taking behaviors before and after the critical age of 21. Older patients are grouped in wider categories where age differences are not as critical to intervention and treatment. As a consequence, the age categories are not evenly sized—for example, the age group 30 to 34 covers 5 years, whereas the age group 35 to 44 covers 10 years. The size of an age group is an important consideration when comparing estimates of ED visits for different age categories.
ED records vary in the level and type of detail provided. Although sex, age, and ZIP code are usually present in patients' ED records, race/ethnicity is often missing or insufficient (e.g., "European"). Although it is possible to record multiple race/ethnicities, for reporting purposes race/ethnicity is collapsed into a single variable with five levels:
• non-Hispanic White, • non-Hispanic Black, • Hispanic, • race/ethnicity not tabulated above, and • race/ethnicity undocumented.
D A W N M E T H O D O L O G Y R E P O R T , 2 0 1 1 U P D A T E 2 5
3.4.2 Visit characteristics
DAWN collects detailed information about each visit. The data items include
• date and time of visit; • type of visit (e.g., suicide attempt, seeking detox, adverse reaction); • up to 22 drugs or substances for every visit; • diagnoses reflecting one or more conditions for which the patient was treated, as
determined by the clinician after evaluation in the ED; and • disposition, or the location or facility to which an ED patient was referred, transferred, or
released at the conclusion of the ED visit.
DAWN Reporters also provide a brief description of the visit, drawn directly from the ED record, which includes the reason for the visit and any other information necessary to document that the visit is a DAWN case.
3.4.3 Drugs and drug categories
For the purpose of DAWN, a drug is any substance that is (a) used as a medication or in the preparation of medication; (b) an illicit substance that causes addiction, habituation, or a marked change in consciousness; or (c) both. Substances reportable to DAWN include illicit drugs (e.g., club drugs, cocaine, heroin, marijuana, stimulants, and alcohol when used by a minor10), nonpharmaceutical inhalants,11 prescription drugs (e.g., drugs for ADHD, antibiotics, antidepressants, antipsychotics, anticoagulants, beta blockers, birth control pills, hormone replacement, insulin, muscle relaxants, pain relievers, sleeping aids), drugs used in treatment of medical conditions (e.g., respiratory therapy, chemotherapy, radiation therapy), vaccines, dietary supplements, vitamins, and other over-the-counter pharmaceutical products.
Using the DAWN Drug Reference Vocabulary (DAWN DRV), DAWN is able to identify more than 3,300 individual drugs (which map to more than 19,000 individual brands and street names). The DAWN DRV is a comprehensive drug vocabulary and classification system based on the Multum Lexicon, © 2012, that has been modified to meet DAWN's unique requirements. The DRV includes codes for brand (trade) names, generic names, chemical names, metabolites, nonspecific drug terms, and street terms for legal and illegal substances, including prescription and over-the-counter pharmaceuticals and selected nonpharmaceuticals that are abused by inhalation.
DAWN Reporters collect the most specific information about each drug that is available in the ED record. Up to 22 drugs implicated in a visit are assigned a code using the DRV. Because multiple
10 Alcohol use by a minor with no other drug involvement is eligible for DAWN. Alcohol use by an adult must
be accompanied by another drug to be eligible for DAWN. 11 To be reportable as an illicit drug, a nonpharmaceutical substance must be intentionally consumed by
inhalation, sniffing, or snorting, and it must have a psychoactive effect when inhaled. Carbon monoxide is excluded from the inhalants. Cases involving accidental exposures to inhalants (e.g., exposure to paint fumes while one is painting a closet) are excluded.
2 6 D A W N M E T H O D O L O G Y R E P O R T , 2 0 1 1 U P D A T E
substances can be reported for each DAWN case, the total number of drugs exceeds the total number of DAWN cases reported.
The DRV provides the flexibility needed to accommodate the varying level of drug detail provided in ED records. A drug might be recorded in the ED records by its brand name (e.g., OxyContin®), a generic name (e.g., oxycodone), or by the class to which it belongs (e.g., an unspecified narcotic pain reliever). Each of these has a code in the DRV. Narcotic pain relievers are mapped to the larger grouping "Opioid/opiate Pain Relievers," which is part of the broader category "Pain Relievers," which is one of the categories among "Central Nervous System Agents." Illicit drugs and other DAWN-reportable substances are maintained in a similar tiered structure in the DRV.
The Multum Lexicon is updated every 2 months to incorporate new products and, occasionally, to introduce new drug categories. Through the end of data collection year 2011, the DAWN DRV was updated to incorporate those changes as well as include any drugs reported by EDs that were not in the Multum Lexicon (e.g., imported drugs, new combinations of illicit drugs). At the end of each data year, all the drug data received from EDs—the current year's data and data from all previous years—were coded using the most recent DRV. This process ensures that estimates of visits by drug across years are comparable.
Additional information on the Multum Lexicon, © 2012, the DAWN DRV, and the Multum Licensing Agreement governing use of the Lexicon can be found on the DAWN Web site.12 Readers interested in exploring the DRV and the manner in which it classifies drugs may obtain the full set of DAWN DRV tables in the relational database named "DAWN_DRV.mdb."13 Queries are used to join tables and display relationships between different drugs and drug groupings. The DRV is also available as a spreadsheet named "DAWN__Final_Table.xls."
3.4.4 Visit disposition
The visit disposition records where the patient went after leaving the ED. There are three major categories: treated and released, admitted to this hospital, and other dispositions. Additional detail is provided with subcategories.
12 DAWN documents can be found on the DAWN Web site
(http://www.samhsa.gov/data/dawn/MultumLicenseAgreement.pdf). 13 These files and DRV documentation are available at the DAWN Web site at
http://www.samhsa.gov/data/dawn/DRV/Drug%20Reference%20Vocabulary.zip.

D A W N M E T H O D O L O G Y R E P O R T , 2 0 1 1 U P D A T E 2 7
Treated and released includes three categories:
• Discharged home—In this context, "home" refers to the patient's personal residence. For students residing at nearby universities, home means their university; for travelers who get sick on the road, it may mean their hotel or wherever they are staying.
• Released to police/jail—Patients who are released to police/jail were usually brought to the ED by the police for treatment of an acute medical problem or for medical clearance before being placed in the jail population.
• Referred to detox/treatment—The chart indicates that the patient was referred to a substance abuse treatment or detox program, facility, or provider other than the chemical dependency/detox unit maintained at the hospital.
Admitted to this hospital includes five categories of inpatient units:
• intensive or critical care unit (ICU), • surgical unit, • chemical dependency/detox unit, • psychiatric unit, and • other inpatient units.14
Other disposition includes five categories:
• Transferred—The patient was transferred to another health care facility. • Left against medical advice—The patient left the treatment setting without a physician's
approval. • Died—The patient died after being admitted to the ED but before being discharged,
admitted, or transferred. • Other—The discharge status is documented in the patient's chart but does not fit into any
of the preceding categories. • Not documented—The patient's discharge status was not documented in the medical
chart.
Visit dispositions may be reported using the three major categories or 13 subcategories, as noted above. A third way of reporting disposition that often appears in DAWN reports and tables groups ED visits based on whether there is any indication in the ED record that the patient received some type of follow-up treatment. "Evidence of follow-up" includes patients who were referred to detox/treatment, admitted to the hospital (any unit), or transferred. "No evidence of follow-up" includes patients with any other disposition.
14 This code may be applied if the inpatient unit was not specified or does not match one of the preceding
units. Also included herein are "combo" units, e.g., a unit that offers both psychiatric and detox services.

D A W N M E T H O D O L O G Y R E P O R T , 2 0 1 1 U P D A T E 2 9
4. DEVELOPMENT OF THE ED COMPONENT OF DAWN
4.1 DAWN ED sample design overview
The statistical and methodological design of the current DAWN system was introduced in data collection year 2004. A new stratified simple random sample of hospitals was drawn at that time from among the universe of eligible hospitals in the Nation; oversampling was conducted in selected metropolitan areas.15 For each participating sampled hospital and for each month of the year, days of the month are systematically selected and all ED visits for these days are reviewed for eligibility as DAWN cases. Data collection following the new sampling plan was fully implemented for the first time in the 2004 data collection year, and the original sample of hospitals has been followed longitudinally since then. That is, each year since 2004, new hospitals are given the opportunity to be sampled into the longitudinal panel of hospitals.
4.1.1 Sample frame of hospitals
The DAWN sampling frame was built from among all hospitals meeting the DAWN criteria for eligible hospitals (i.e., non-Federal, short-stay, general medical and surgical hospitals in the United States that have one or more EDs open 24 hours a day, 7 days a week) that appeared on the 2001 American Hospital Association (AHA) Annual Survey Database (ASDB).16 A probability sample proportionate to the number of ED visits in each facility was drawn from among eligible hospitals.
4.1.2 Metropolitan areas represented in DAWN
Samples were drawn from the initial frame to provide the capability to make estimates for the Nation as well as selected metropolitan areas. The metropolitan areas are referred to as oversampled areas (OS areas) or DAWN metropolitan areas. Two goals guided the selection of the DAWN metropolitan areas. The first was to preserve the ability to represent the 21 areas that had been part of DAWN since its inception. The second was to improve population and geographic coverage beyond these 21 legacy areas. Accordingly, the design ensured representation of the original 21 legacy areas plus the 5 most populous MSAs in each of the 9 census divisions. Oversamples were selected in a total of 48 MSAs; in 4 of those 48 MSAs, additional oversamples were drawn to allow reporting for subareas within those MSAs. Resources available to DAWN have allowed for data collection in only a portion of the OS areas.
15 The redesign of the DAWN ED component is described in detail in DAWN: Development of a New
Design, which is available at the DAWN Web site (http://www.samhsa.gov/data/DAWN.aspx). 16 The 24-hour status of hospitals is not contained on the AHA file and is determined by contacting
otherwise eligible hospitals directly.

3 0 D A W N M E T H O D O L O G Y R E P O R T , 2 0 1 1 U P D A T E
4.1.3 Metropolitan-level stratification
The DAWN sample design was conceived to provide the statistical infrastructure to produce reliable and representative estimates for the Nation and a portion of DAWN metropolitan areas (OS areas), depending on available resources and interest. To accomplish this objective, a subset of the hospitals within each OS area was identified a priori as having a dual purpose in estimation. Referred to as dual-purpose hospitals, these designated hospitals can contribute either to an estimate for the OS area in which they are located or to the estimate for the remainder area outside of OS areas. Dual-purpose hospitals carry two probabilities of selection (POS) and two stratum identifiers. One POS/stratum is associated with membership in an OS area oversample, and the other is associated with membership in the remainder area sample.17
Each data year, the response rates and nonresponse patterns for each OS area are reviewed to determine data quality. Those OS areas with acceptable data quality are allowed to stand on their own as the basis for separate estimates; they are referred to as stand-alone OS areas. If it is determined on the basis of response rates and bias analyses that an OS area cannot stand alone, the design provides that the OS area is eliminated as a separate area but becomes part of the remainder area.
DAWN national-level estimates are the sum of the estimates for stand-alone OS areas plus the remainder area. The formula for the national estimate is
where ai is the estimate for stand-alone OS area i, N is the number of stand-alone OS areas, and b is the remainder area estimate inclusive of dual-purpose hospitals in OS areas that do not stand alone.
4.1.4 Hospital size and ownership stratification
Sampled hospitals in each of the OS areas were stratified by hospital size (up to four categories, on the basis of the number of ED visits18) and ownership type (public and private). The stratification plan included an additional geographic construct to represent the remainder of the United States outside the OS areas. Hospitals in the remainder area were divided into 24 strata on
17 Hospitals in the four MSAs with submetropolitan area oversampling can have up to three nonzero
POS/strata: (a) POS/stratum for membership in the MSA, (b) POS/stratum for membership in the submetropolitan area, and (c) POS/stratum for membership in the remainder area.
18 In DAWN metropolitan areas, size categories were determined independently for each OS area. The number of hospitals determined the unique size categories: fewer than four hospitals were placed in one size category; four to seven hospitals were placed in two size categories; and eight or more hospitals were placed in four size categories. Areas outside of DAWN metropolitan areas were organized into three size categories.
ba
1ii +
∑=
N
D A W N M E T H O D O L O G Y R E P O R T , 2 0 1 1 U P D A T E 3 1
the basis of four regions (Northeast, South, Midwest, West), three size categories, and ownership type.
4.1.5 Sample size and sample allocation
Each hospital in the DAWN sample was selected through a random process, which theoretically could have been repeated many times, resulting in many hypothetical samples. Sampling variance, or the margin of error, refers to the extent to which these samples were likely to have varied. Two measures of this variability are the standard error (SE) and the relative standard error (RSE), which is defined as the SE of the estimate divided by the estimate itself. The precision of an estimate is inversely related to the sampling variance, as measured by the RSE. The greater the RSE value, the lower the precision. DAWN is designed to have estimates for major drug categories (i.e., all drug-related ED visits plus ED visits for cocaine, heroin, and marijuana), wherein the RSEs are less than or equal to 10 percent for metropolitan area estimates and less than or equal to 15 percent for national estimates. Sample sizes for each metropolitan area and the Nation were set using these targeted precision levels in combination with the theory of optimal allocation for stratified samples.
4.2 Data collection procedures
This section documents the methodologies used to collect DAWN data. The DAWN operations contractor (DOC) is responsible for collecting DAWN data. Additional detail on data collection methodology is available in the 2007–2011 ED Reference Guide.19
4.2.1 Review of ED medical records
DAWN ED data are collected directly from the medical records of patients treated in the ED. The review is done after the ED visit is completed. Patients, their families, and clinical staff are never interviewed. The data are collected by trained DAWN Reporters who review ED medical records to identify ED visits related to recent drug use. For each DAWN case, an electronic case report is completed (Figure 2, in Section 3, depicts the data elements collected). Case reports are submitted electronically using the Electronic Hospital Emergency Reporting System (eHERS), a customized system developed specifically for DAWN. DAWN Reporters also submit an activity report detailing their progress in reviewing the ED charts, and they report the monthly census of all ED visits made to the hospital. Data collection is performed on an ongoing basis as soon after the ED visit as possible.
The majority of DAWN ED data are collected on site at hospitals by a DAWN Reporter who reviews paper or electronic records. A growing number of hospitals have centralized electronic medical records systems that can be accessed from the outside. In these cases, DAWN Reporters
19 The 2007–2011 ED Reference Guide is available at the DAWN Web site
(http://www.samhsa.gov/data/DAWN.aspx).
3 2 D A W N M E T H O D O L O G Y R E P O R T , 2 0 1 1 U P D A T E
access the systems via remote access from the DOC's headquarters. A secured transmission line is maintained for this purpose by the DOC.
4.2.2 Selection of ED medical records
The original DAWN redesign protocol called for direct review of all available ED records. After careful review and testing, however, it was established that a sample of ED visits could be used to produce sufficiently precise estimates in comparison to a census of visits provided that the cost savings be redirected toward recruiting additional hospitals. In 2008, a protocol was developed for drawing a systematic sample of each ED's medical records based on the date of the ED visit. In those EDs with sampling, the DAWN Reporter is sent a list each month of designated dates for chart review, and the charts for all the ED visits occurring on the designated dates are reviewed for drug-related visits. By 2010, sampling of ED records had been introduced in all larger hospitals and many smaller ones.
A vast majority of sampled records are reviewed, but there are some instances when they are not. Unintentional gaps in chart review may occur due to such factors as a DAWN Reporter's unexpected absence or circumstances at the hospital that preclude review of some ED records (e.g., limitations on the hours or days that a DAWN Reporter may access ED records, removal of records from facility). A similar method of within-hospital visit weighting is used to compensate for both intentional sampling of ED records as well as unintentional gaps in record review (see Section 4.4.3).
4.3 Data preparation
The DOC performs numerous reviews that begin at the point of entry and continue through the final delivery of the data to SAMHSA. Automated systems check DAWN case data to confirm eligibility of cases submitted and for case type discrepancies. In addition, edit programs are run to identify range and consistency errors. "Unknown" drugs entered by the DAWN Reporter are reviewed by CBHSQ; when possible, they are upcoded to extant codes or new drug codes are added to the DRV, when appropriate. At the end of every data collection year, an extensive data review is conducted. Statistical process control (SPC) is used to evaluate the monthly counts of ED visits, charts reviewed, and cases reported for each ED. If any monthly count of visits, charts, or cases is identified as inconsistent by SPC, that count is investigated via communication with contacts from the ED. The results of the investigation are documented and sent along with the final delivery. As a final step, the SPC results and monthly counts for each ED are reviewed by the DOC, the Data Analysis Contractor (DAC), and representatives from CBHSQ.
4.4 ED data and statistical processing
The DOC prepares the database as described in Section 4.3, at which point the annual data files and the current DRV are transferred to the DAC. The DAC performs a number of data quality and data processing steps to prepare the file for weighting and for developing estimates (see
D A W N M E T H O D O L O G Y R E P O R T , 2 0 1 1 U P D A T E 3 3
Section 4.4.1). Sample maintenance is then performed (see Section 4.4.2). Weights and adjustments are then developed (see Section 4.4.3). Section 4.4.4 describes the sequential processing steps for developing and applying weights and adjustments.
4.4.1 ED data processing
Because up to 22 drugs may be reported for each visit, the DAC begins its processing by ensuring that no duplicate drugs are recorded for a visit. The DRV, the database that defines how drugs are classified and mapped to drugs, is applied to the microdata received from the DOC to derive drug IDs and the standard drug list (SDL) classification associated with each drug.20 The resulting drug IDs for a visit are compared with one another to ensure that a drug appears only once for a visit.21 After the initial deduplication, codes for mouthwash and alcohol are deduplicated. Lastly, a check is run to ensure there are no cases that involve only alcohol for respondents aged 21 or older. The data are classified originally on a brand level and then are processed to a drug ID level; a final step is to flatten the data file to a visit level. Discrepancies or irregularities are resolved through discussion among the DOC, the DAC, and the DAWN team at CBHSQ.
4.4.2 DAWN sample maintenance
As noted above, the initial DAWN sample was selected from a sampling frame created from the 2001 AHA ASDB. Because DAWN is a longitudinal survey, maintenance is conducted every year to ensure that the sample remains representative of the target population of eligible hospitals. Over time, new hospitals will be opened, some will close, some will merge with other hospitals, and some will "demerge" to form two or more smaller hospitals. Some hospitals no longer maintain 24-hour EDs and become ineligible; others open them and become eligible. Each year the sampling frame is updated to reflect new, closed, merged, and demerged hospitals on the basis of information in the most current AHA ASDB. Since 2004, a master file has been maintained of the changes to the frame and originally sampled hospitals, plus information on all new frame and sampled hospitals. All variables in the AHA master file are assigned consistent names from year to year, even if there are variable name changes in later AHA ASDBs. Conversely, documentation accompanying the AHA ASDB each year is carefully reviewed to ensure that variables with the same name still mean what they did in earlier years.
Newly eligible hospitals identified on the most current ASA ASDB, and confirmed for having a 24-hour ED, are provided the opportunity to be selected into the sample on the basis of the sampling fraction of the stratum in which each newly eligible hospital is located.
20 This version of the annual data is referred to as the "microdata" because it includes one record for every
brand of drug mentioned in a visit. There are up to 22 records for each visit. 21 Identical drug IDs can result when different brand codes map to the same drug ID. When the duplicate
drug ID is removed, the brand code associated with it will be lost because only one brand is retained for each unique drug ID in the visit-level file. The detailed information on all brands is retained in the brand-level file and can be retrieved, if needed.
3 4 D A W N M E T H O D O L O G Y R E P O R T , 2 0 1 1 U P D A T E
4.4.3 Weights and adjustments
Each year, weights and adjustments are calculated and applied to the collected data to ensure that the survey results represent the target population. Sampling weights are first calculated as the inverse of the probability of selection and then adjusted for variable nonresponse by a procedure known as poststratification, or benchmark adjustment. For steps involving within-hospital adjustments, the processing is carried out at the facility/month level; that is, adjustments are made to data for each month within each facility within each hospital. The derivation of weights to adjust for unequal POS, nonresponse, and other sources of bias is processed at the hospital/stratum/region level.
Probabilities of selection. DAWN hospitals are selected using stratified simple random sampling with oversampling in DAWN metropolitan areas. A hospital can have up to three POSs: a remainder-level POS, a division-level POS, and an OS area–level POS (see Section 4.1.3). Decisions about which POS to use are made after an analysis of response rate and nonresponse bias is conducted for each OS area.
Within-hospital weighting adjustment. Charts may be intentionally sampled, or there may be unintentional gaps due to problems in collecting data or obtaining access to records (see Section 4.2.2). To compensate for within-hospital nonresponse, the DAWN weighting plan includes a nonresponse adjustment factor for each month of data collection within each facility; it is equal to the number of ED visits divided by the number of charts reviewed for each of 12 months in the data collection year. The within-hospital weights are applied to the by-month count of visits. That is, the visit counts for a given facility/month are first summed for each drug and then multiplied by the corresponding within-hospital adjustment factor for that facility/month. The weighted totals are then summed over all facilities and months to give a total weighted visit count for each drug for each hospital.
Weighting adjustment for hospital nonresponse. Hospital-level nonresponse occurs when hospitals fail to provide valid data for at least 3 months of the data collection year. To minimize the impact of hospital nonresponse, the DAWN weighting plan includes nonresponse adjustment factors that are developed and applied within each weighting class. Weighting classes are formed on the basis of the aforementioned sampling stratification schemes. Within each weighting class, the nonresponse adjustment factor is calculated as the sum of the sampled hospital weights divided by the sum of the weights of the responding hospitals. The hospital nonresponse adjustment factors are checked to make sure the adjustments are within reasonable bounds. If a nonresponse adjustment factor is too large, adjacent weighting classes are collapsed, and new nonresponse adjustment factors are calculated.
When the hospital-level nonresponse adjustment factors are finalized, a nonresponse-adjusted sampling weight is then calculated as the product of the nonresponse adjustment factor and the sampling weight. For each weighting class, a verification check is conducted to ensure that the
D A W N M E T H O D O L O G Y R E P O R T , 2 0 1 1 U P D A T E 3 5
sum of the nonresponse-adjusted sampling weights is equal to the sum of the sampled hospital weights.
Weighting adjustment for population benchmarks (poststratification). The DAWN weighting plan also includes a poststratification adjustment factor that reconciles the weighted number of total visits for responding hospitals with the number of total visits from the most recent AHA ASDB. DAWN uses a ratio adjustment within strata to implement this adjustment.
Within each stratum, the adjustment factor is calculated as the ratio of the AHA count of total visits to the weighted sum of total visits for responding hospitals. The factors are verified to ensure they are within reasonable bounds. If they are out of bounds (either too small or too large), adjacent poststratification strata are collapsed, and new poststratification adjustment factors are calculated.
When the poststratification adjustment factors are finalized, a poststratified weight is then calculated. The final weight is calculated as the product of the poststratification adjustment factor and the nonresponse-adjusted sampling weight. For each poststratification stratum, a validity check is conducted to ensure that the sum of the poststratified weighted total visits is equal to the corresponding AHA count of total visits from each stratum.
Estimates for the entire universe of DAWN-eligible hospitals in the United States are produced by applying poststratified weights to the data received from the sampled hospitals.
4.4.4 Sequential process of developing and applying weights and adjustments
The order of processing the weights and adjustments is as follows:
1. Identify the design strata. Variance estimation strata are formed on the same basis as the design strata, where selected strata are collapsed to ensure that there are at least two hospitals in each estimation stratum.
2. Compute hospital-level, design-based weights on the basis of design-based selection probabilities.
3. Apply an initial weight adjustment to correct for minor discrepancies in the selection probabilities.
4. Define variance estimation strata. 5. Define weighting classes that are sufficiently large and internally homogeneous for
nonresponse adjustment. These usually are combinations of variance estimation strata. 6. Compute nonresponse adjustments within weighting class. 7. Define poststratification classes (may be similar to nonresponse weighting classes). 8. Compute poststratification adjustment factors on the basis of reported visits for
responding hospitals and poststratum totals from the AHA frame. 9. Prepare an output file with each of the hospital-level weights and weight adjustment
factors listed individually for quality control (QC) review. 10. Compute the final case weights.

3 6 D A W N M E T H O D O L O G Y R E P O R T , 2 0 1 1 U P D A T E
11. Conduct QC of weights. 12. Perform QC review.
D A W N M E T H O D O L O G Y R E P O R T , 2 0 1 1 U P D A T E 3 7
5. DAWN PUBLICATIONS AND DATA DISSEMINATION
DAWN issues both regular and ad hoc reports, tables, and related data products. In addition, DAWN PUFs are available on the SAMHDA Web site. This section describes the characteristics of these data products and the standards DAWN uses to compile data, present estimates, and produce data files.
5.1 Analytic groups
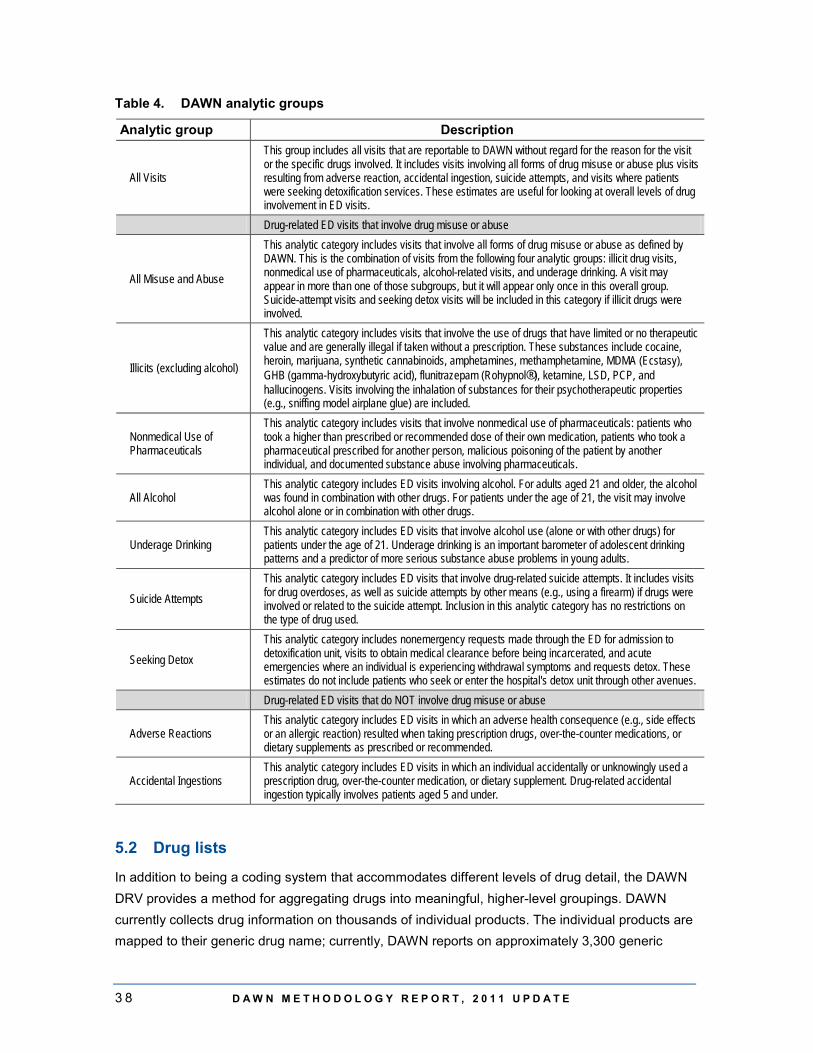
For the purpose of analysis, DAWN developed a set of categories to use when reporting on ED visits. Referred to as "analytic groups," these categories combine visits with similar characteristics to produce summary statistics. The DAWN analytic groups and their definitions are provided in Table 4. The analytic groups fall into one of three types: all visits (regardless of intent), visits where there is an indication of some type of drug misuse or abuse, and visits where there is no indication of misuse or abuse.
Because of DAWN's focus on drug misuse and abuse, this topic is addressed by several analytic groups, including all drug misuse or abuse, all visits involving illicit drugs, visits involving nonmedical use of pharmaceuticals, visits involving alcohol for patients of all ages, and visits involving alcohol for patients under the age of 21. Also isolated for analysis are visits involving drug-related suicide attempts and visits made by patients seeking detoxification services. The subgroups under "All Misuse and Abuse" in Table 4 are not mutually exclusive because a single visit can involve multiple types of drugs. For example, an ED visit involving marijuana and oxycodone would be grouped with other visits involving illicit drugs, as well as with visits involving nonmedical use of pharmaceuticals.
Annually, DAWN produces comprehensive sets of tables, the DAWN Trend Tables, that provide estimates and rates of drug-related ED visits by type of drug, patient sex and age, visit disposition, and other characteristics; each table includes estimates and rates for the current year and all prior years. A complete set of tables is produced for each analytic group listed in Table 4. Each set is reproduced for the Nation and for metropolitan areas with sufficiently high levels of participation (see Table 1). A more detailed description of the DAWN Trend Tables is provided in the Guide to the DAWN Trend Tables.22
22 The Guide to the DAWN Trend Tables is available as an attachment to the DAWN ED Annual Reports
and as a freestanding document at the DAWN Web site (http://www.samhsa.gov/data/DAWN.aspx).
3 8 D A W N M E T H O D O L O G Y R E P O R T , 2 0 1 1 U P D A T E
Table 4. DAWN analytic groups
Analytic group Description
All Visits
This group includes all visits that are reportable to DAWN without regard for the reason for the visit or the specific drugs involved. It includes visits involving all forms of drug misuse or abuse plus visits resulting from adverse reaction, accidental ingestion, suicide attempts, and visits where patients were seeking detoxification services. These estimates are useful for looking at overall levels of drug involvement in ED visits.
Drug-related ED visits that involve drug misuse or abuse
All Misuse and Abuse
This analytic category includes visits that involve all forms of drug misuse or abuse as defined by DAWN. This is the combination of visits from the following four analytic groups: illicit drug visits, nonmedical use of pharmaceuticals, alcohol-related visits, and underage drinking. A visit may appear in more than one of those subgroups, but it will appear only once in this overall group. Suicide-attempt visits and seeking detox visits will be included in this category if illicit drugs were involved.
Illicits (excluding alcohol)
This analytic category includes visits that involve the use of drugs that have limited or no therapeutic value and are generally illegal if taken without a prescription. These substances include cocaine, heroin, marijuana, synthetic cannabinoids, amphetamines, methamphetamine, MDMA (Ecstasy), GHB (gamma-hydroxybutyric acid), flunitrazepam (Rohypnol®), ketamine, LSD, PCP, and hallucinogens. Visits involving the inhalation of substances for their psychotherapeutic properties (e.g., sniffing model airplane glue) are included.
Nonmedical Use of Pharmaceuticals
This analytic category includes visits that involve nonmedical use of pharmaceuticals: patients who took a higher than prescribed or recommended dose of their own medication, patients who took a pharmaceutical prescribed for another person, malicious poisoning of the patient by another individual, and documented substance abuse involving pharmaceuticals.
All Alcohol This analytic category includes ED visits involving alcohol. For adults aged 21 and older, the alcohol was found in combination with other drugs. For patients under the age of 21, the visit may involve alcohol alone or in combination with other drugs.
Underage Drinking This analytic category includes ED visits that involve alcohol use (alone or with other drugs) for patients under the age of 21. Underage drinking is an important barometer of adolescent drinking patterns and a predictor of more serious substance abuse problems in young adults.
Suicide Attempts This analytic category includes ED visits that involve drug-related suicide attempts. It includes visits for drug overdoses, as well as suicide attempts by other means (e.g., using a firearm) if drugs were involved or related to the suicide attempt. Inclusion in this analytic category has no restrictions on the type of drug used.
Seeking Detox This analytic category includes nonemergency requests made through the ED for admission to detoxification unit, visits to obtain medical clearance before being incarcerated, and acute emergencies where an individual is experiencing withdrawal symptoms and requests detox. These estimates do not include patients who seek or enter the hospital's detox unit through other avenues.
Drug-related ED visits that do NOT involve drug misuse or abuse
Adverse Reactions This analytic category includes ED visits in which an adverse health consequence (e.g., side effects or an allergic reaction) resulted when taking prescription drugs, over-the-counter medications, or dietary supplements as prescribed or recommended.
Accidental Ingestions This analytic category includes ED visits in which an individual accidentally or unknowingly used a prescription drug, over-the-counter medication, or dietary supplement. Drug-related accidental ingestion typically involves patients aged 5 and under.
5.2 Drug lists
In addition to being a coding system that accommodates different levels of drug detail, the DAWN DRV provides a method for aggregating drugs into meaningful, higher-level groupings. DAWN currently collects drug information on thousands of individual products. The individual products are mapped to their generic drug name; currently, DAWN reports on approximately 3,300 generic
D A W N M E T H O D O L O G Y R E P O R T , 2 0 1 1 U P D A T E 3 9
drugs. The DAWN Trend Tables provide estimates and rates using a shorter list of approximately 500 drugs, known as the "standard drug list." The tables in the DAWN ED Annual Reports highlight approximately 100 drugs selected from the standard drug list.
5.3 Estimates of visits versus drugs
All estimates provided in DAWN publications and tables are calculated using data that have been weighted as described in Section 4.4. Estimates for any variable of interest are determined by first summing the case totals within facility/month, applying the within-hospital weight, summing to the hospital level, applying the final hospital weight, and summing over all hospitals.
The DAWN ED Annual Reports, short reports, and the DAWN Trend Tables include predominantly estimates at the ED visit level—that is, how many visits involved a certain drug. Another measure is the total number of drugs reported. Because most ED visits involve more than one drug, the total drug reports will always exceed the total drug-related ED visits. To illustrate the difference, consider a visit involving oxycodone and aspirin. Both drugs are pain relievers. This visit will count as one visit involving oxycodone and one visit involving aspirin. When reporting the number of visits involving pain relievers in general, this visit will be counted just once even though two types of pain relievers were involved.
5.4 Standardized rates
DAWN ED Annual Reports and the DAWN Trend Tables include population-based rates as well as estimates. Rates are standardized measures that are helpful when comparing levels of drug-related ED visits for different years, types of visits, and demographic groups. DAWN rates for years and types of visits are based on the whole population; for example, there were 790.4 ED visits involving drug misuse or abuse per 100,000 population in 2011 compared with 552.9 visits in 2004. For specific age groups and sexes, the denominator is limited to the population in that age group or sex. For age in particular, rates are important because the size of the underlying population differs considerably across DAWN age groups (see Section 3.4.1). For example, in 2011, there were 13.5 million individuals aged 18 to 20 in the United States and 40.6 million aged 35 to 44. Accordingly, the estimated number of ED visits involving drug misuse or abuse was 239,281 visits for those aged 18 to 20 and 432,957 visits for those aged 35 to 44. To allow comparison between the two age groups, standardized rates are calculated as the number of ED visits per 100,000 persons in that age group. In this example, while the estimated number of visits was much lower for persons aged 18 to 20, the rate of visits was substantially higher: 1,771.5 for persons aged 18 to 20 compared with 1,065.7 visits for persons aged 35 to 44. Because they are reported as percentages, the RSEs provided in DAWN tables apply equally to the estimates and the rates.

4 0 D A W N M E T H O D O L O G Y R E P O R T , 2 0 1 1 U P D A T E
5.5 Population estimates used to calculate rates
The U.S. Census Bureau issues population estimates for each decennial year. Each year between decennials, estimates for the current year as well as estimates for all years since the last decennial are reissued. Each year's reissued estimates are referred to as "Vintage 20xx." Every reporting year, DAWN recalculates rates for all years (2004 through current data collection year) using the most recent census population estimates for all data collection years.23 For DAWN reporting years 2004–2009, the population data were based on the 2000 decennial census. For DAWN reporting years 2010 and 2011, population counts were based on the 2010 decennial census. Population estimates used to generate DAWN rates are as of July in the data collection year as reported in the Postcensal Resident Population National Population Dataset, National Estimates by Demographic Characteristics—Single Year of Age, Sex, Race, and Hispanic Origin, Monthly Population Estimates series. Estimates at the metropolitan area level were drawn from the Postcensal Resident Population County Population Datasets, County Estimates by Demographic Characteristics—Age, Sex, Race, and Hispanic Origin, State Datasets series.
The 2011 DAWN data series included estimates and rates for 2004–2011. The estimates and rates for 2004–2010 that were issued as part of the 2011 series replaced previously issued estimates and rates for those years. As a matter of record, the 2004–2010 DAWN data issued as part of the DAWN 2010 series used a different method for estimating population because Vintage estimates for 2010 were not available at the time of publication of the 2010 DAWN data series. This methodology is described in the DAWN Methodology Report, 2010 Update.
5.6 Measures of precision and error
Each hospital in the DAWN sample was selected through a random process, which theoretically could have been repeated many times, resulting in many hypothetical samples. Sampling error refers to the extent to which these samples vary. Two measures of this variability are the SE and the RSE, which is defined as the SE of the estimate divided by the estimate itself. The precision of an estimate is inversely related to the sampling variance, as measured by the RSE. The greater the RSE value, the lower the precision.
For example, if 10,000 estimated visits involve a given drug, and this estimate has an SE of 500 visits, then the RSE value is 5 percent:
RSE = SE/Estimate
RSE = 500/10,000
23 The most current population estimates for earlier years (e.g., population estimates for 2004 that were
issued in 2010) may be different than those issued earlier (e.g., population estimates for 2004 that were issued in 2009). The most currently issued population estimates are used in DAWN rate calculations, and the newly calculated rates replace previously published rates. Differences in the rates at the national level are usually insignificant, but differences at the metropolitan area level may be larger and more noticeable.
D A W N M E T H O D O L O G Y R E P O R T , 2 0 1 1 U P D A T E 4 1
RSE = 0.050
RSE% = 5.0% (RSE × 100%).
In addition to RSEs, confidence intervals (CIs) are often included in tables published by DAWN. The 95 percent CI is calculated as
CI = Estimate ± (1.96 × RSE × Estimate),
where 1.96 comes from the table of normal distribution z-values and means that 95 percent of the normal distribution lies within 1.96 standard deviations of the mean.
Applying the formula to the example above, the 95 percent CI would be
10,000 ± (1.96 × 0.05 × 10,000) = 10,000 ± 980.0
Lower limit: 10,000 − 980 = 9,020
Upper limit: 10,000 + 980 = 10,980
95% CI: 9,020 to 10,980.
If repeated samples were drawn from the same population of hospitals, using the same sampling and data collection procedures, then 95 percent of the time the true population values would fall between 9,020 and 10,980.
Both between- and within-hospital variance components are accounted for in the variance estimation process. Within-hospital variance is estimated using a replication strategy by which two random replicates are created within each hospital, and the variance between the two replicates represents the within-hospital contribution. Typically, this component is considerably smaller than the between-hospital variance, which is calculated as the variance between weighted hospital totals within each stratum.
Variance estimates reported in the DAWN Trend Tables are determined using the Taylor series linearization variance estimation method available in SUDAAN® software. This method is particularly appropriate for analyzing cluster data, such as those that are generated by the DAWN sampling plan.
5.7 Suppression
DAWN uses a set of criteria to determine whether estimates can be released to the public. Data may be suppressed to protect patient confidentiality or to ensure that published findings meet statistical standards of reliability for survey results. In all published materials, estimates are suppressed according to the following rules:
4 2 D A W N M E T H O D O L O G Y R E P O R T , 2 0 1 1 U P D A T E
• The RSE of the estimate is greater than 50 percent—When the RSE is greater than 50 percent, the lower bound of the 95 percent CI approaches or includes the value zero. A CI that includes zero means that the estimate is not statistically different from zero at this precision level.
• The estimate is based on fewer than 30 ED visits—Estimates based on a small number of cases are typically suppressed because the RSE is greater than 50 percent. Estimates that do meet RSE criteria for publication but are based on fewer than 30 ED visits (weighted or unweighted) are deemed too unreliable for publication. Such estimates are also suppressed to protect patient privacy.
It is mathematically possible that an estimate could have no sampling error and an RSE of zero. This occurs when the number of ED visits being estimated is small, all the hospitals contributing to that estimate were selected with certainty, and the absence of any sampled hospital is due to nonresponse. In most cases, an estimate with an RSE of zero is suppressed on the basis of the small number of cases. In the unlikely event that an estimate is published with an RSE of zero, it is most appropriate to interpret the RSE as signifying that the necessary data were not available to approximate the sampling error.
5.8 Cross-year comparisons
In DAWN ED Annual Reports and the DAWN Trend Tables, comparisons in the estimates of ED visits between years are presented in the form of percentage differences, calculated as the current estimate minus an earlier year's estimate divided by that estimate. For shorter-term comparisons, percent changes are calculated for the current year compared with last year and the current year compared with 2 years ago. For longer-term comparisons, estimates for the current year are compared with those for 2004.24 The percent change is reported only if the difference is statistically significant at the p < 0.05 level.
Tests for the significance of differences between two years' estimates consider the variance of each year's estimate and the covariance between the two. Hospitals that appear in both samples and provide data in both years will contribute to the covariance and thus decrease the overall sampling variance beyond the combined contribution of the two samples. That is, the variance estimation process used to establish significance takes into account any overlap between hospitals that participated in both years.
5.9 DAWN public use files
SAMHDA has primary responsibility for the collection, analysis, and dissemination of behavioral health data collected by SAMHSA. SAMHDA promotes the access and use of SAMHSA's substance abuse and mental health data by providing public-use data files and documentation for
24 Due to data limitations in 2004, long-term comparisons for ED visits resulting from adverse reactions are
made between 2005 and the current year.
D A W N M E T H O D O L O G Y R E P O R T , 2 0 1 1 U P D A T E 4 3
download and online analysis tools to support a better understanding of this critical area of public health. DAWN data are made available at the SAMHDA site as soon as the data are released by SAMHSA. Data are available in the following formats: SPSS, SAS, Stata, ASCII, and tab delimited. PDF and HTML codebooks are available online for all years.
Activities and services SAMHDA performs in support of public-use versions of data and documentation include the following:
• disclosure analysis to ensure that respondents remain anonymous, • standardization of documentation and data formats, • development of customized Web page for data system, • online analysis tools to query restricted-use versions of data, • searchable bibliography of publications based on SAMHDA data, and • staff participation at approved outreach functions.
The SAMHDA Web site was first published on December 3, 1997. The University of Michigan's Inter-University Consortium for Political and Social Research is under contract to CBHSQ to disseminate data and to maintain the SAMHDA Web site and bibliography of publications.

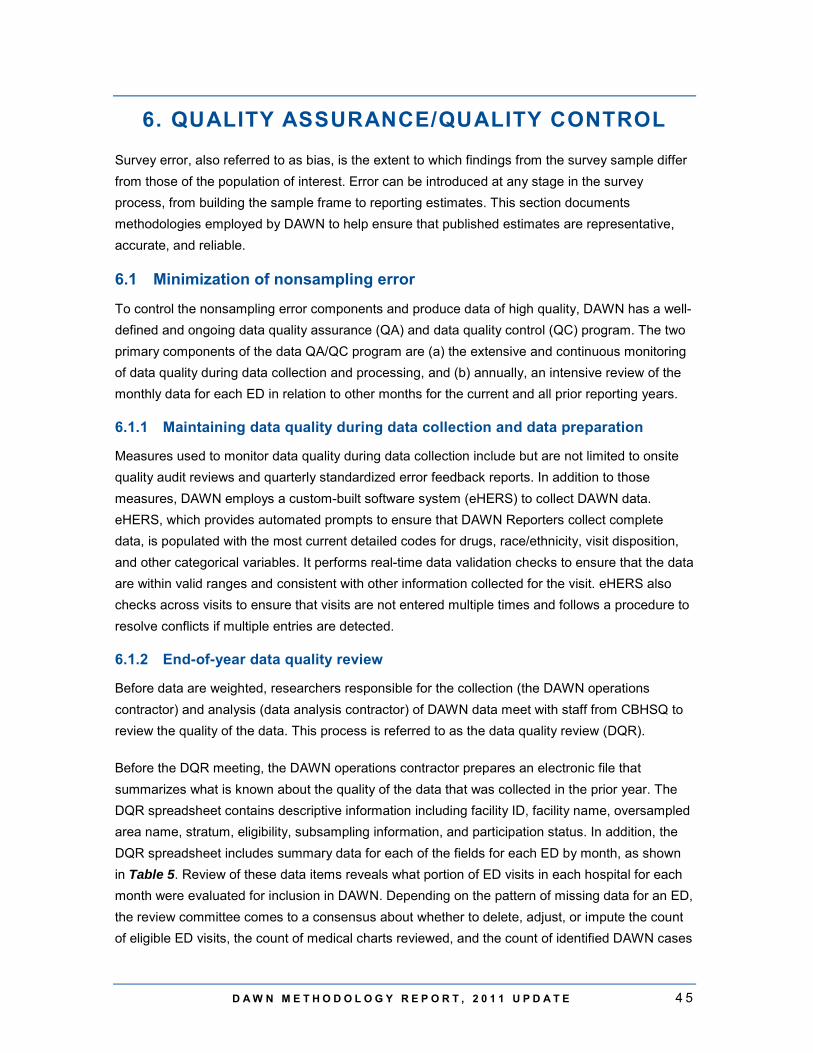
D A W N M E T H O D O L O G Y R E P O R T , 2 0 1 1 U P D A T E 4 5
6. QUALITY ASSURANCE/QUALITY CONTROL
Survey error, also referred to as bias, is the extent to which findings from the survey sample differ from those of the population of interest. Error can be introduced at any stage in the survey process, from building the sample frame to reporting estimates. This section documents methodologies employed by DAWN to help ensure that published estimates are representative, accurate, and reliable.
6.1 Minimization of nonsampling error
To control the nonsampling error components and produce data of high quality, DAWN has a well-defined and ongoing data quality assurance (QA) and data quality control (QC) program. The two primary components of the data QA/QC program are (a) the extensive and continuous monitoring of data quality during data collection and processing, and (b) annually, an intensive review of the monthly data for each ED in relation to other months for the current and all prior reporting years.
6.1.1 Maintaining data quality during data collection and data preparation
Measures used to monitor data quality during data collection include but are not limited to onsite quality audit reviews and quarterly standardized error feedback reports. In addition to those measures, DAWN employs a custom-built software system (eHERS) to collect DAWN data. eHERS, which provides automated prompts to ensure that DAWN Reporters collect complete data, is populated with the most current detailed codes for drugs, race/ethnicity, visit disposition, and other categorical variables. It performs real-time data validation checks to ensure that the data are within valid ranges and consistent with other information collected for the visit. eHERS also checks across visits to ensure that visits are not entered multiple times and follows a procedure to resolve conflicts if multiple entries are detected.
6.1.2 End-of-year data quality review
Before data are weighted, researchers responsible for the collection (the DAWN operations contractor) and analysis (data analysis contractor) of DAWN data meet with staff from CBHSQ to review the quality of the data. This process is referred to as the data quality review (DQR).
Before the DQR meeting, the DAWN operations contractor prepares an electronic file that summarizes what is known about the quality of the data that was collected in the prior year. The DQR spreadsheet contains descriptive information including facility ID, facility name, oversampled area name, stratum, eligibility, subsampling information, and participation status. In addition, the DQR spreadsheet includes summary data for each of the fields for each ED by month, as shown in Table 5. Review of these data items reveals what portion of ED visits in each hospital for each month were evaluated for inclusion in DAWN. Depending on the pattern of missing data for an ED, the review committee comes to a consensus about whether to delete, adjust, or impute the count of eligible ED visits, the count of medical charts reviewed, and the count of identified DAWN cases
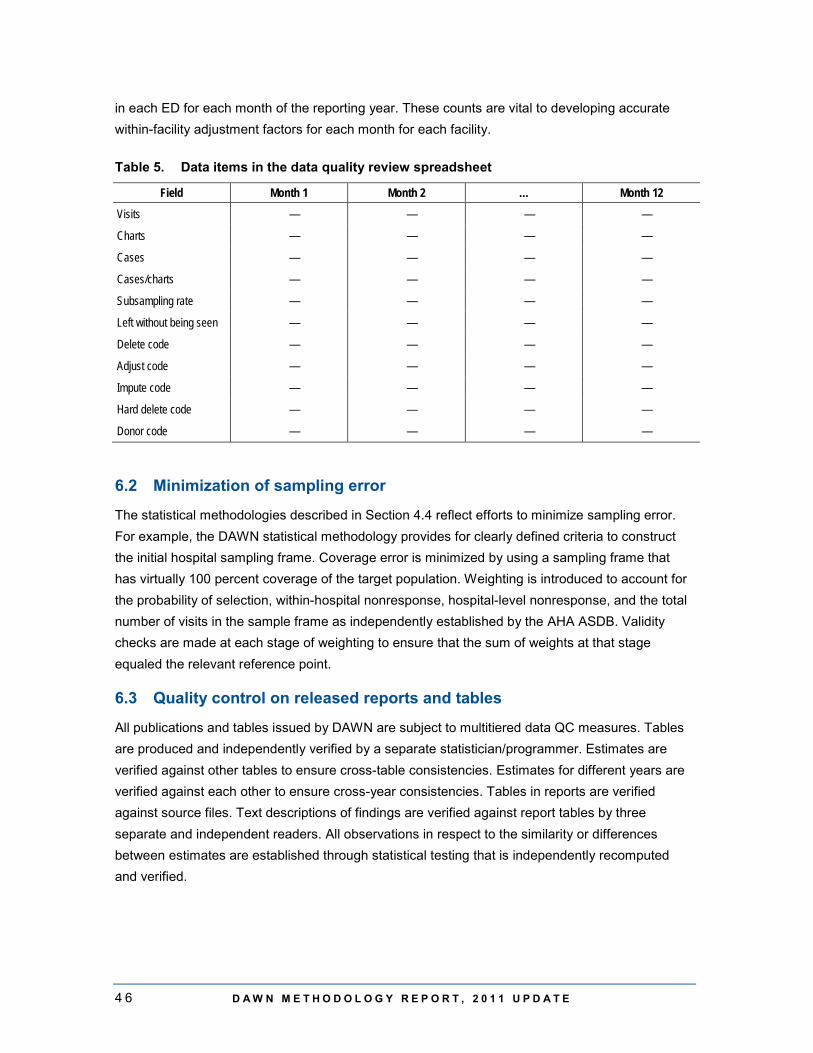
4 6 D A W N M E T H O D O L O G Y R E P O R T , 2 0 1 1 U P D A T E
in each ED for each month of the reporting year. These counts are vital to developing accurate within-facility adjustment factors for each month for each facility.
Table 5. Data items in the data quality review spreadsheet
Field Month 1 Month 2 … Month 12
Visits — — — —
Charts — — — —
Cases — — — —
Cases/charts — — — —
Subsampling rate — — — —
Left without being seen — — — —
Delete code — — — —
Adjust code — — — —
Impute code — — — —
Hard delete code — — — —
Donor code — — — —
6.2 Minimization of sampling error
The statistical methodologies described in Section 4.4 reflect efforts to minimize sampling error. For example, the DAWN statistical methodology provides for clearly defined criteria to construct the initial hospital sampling frame. Coverage error is minimized by using a sampling frame that has virtually 100 percent coverage of the target population. Weighting is introduced to account for the probability of selection, within-hospital nonresponse, hospital-level nonresponse, and the total number of visits in the sample frame as independently established by the AHA ASDB. Validity checks are made at each stage of weighting to ensure that the sum of weights at that stage equaled the relevant reference point.
6.3 Quality control on released reports and tables
All publications and tables issued by DAWN are subject to multitiered data QC measures. Tables are produced and independently verified by a separate statistician/programmer. Estimates are verified against other tables to ensure cross-table consistencies. Estimates for different years are verified against each other to ensure cross-year consistencies. Tables in reports are verified against source files. Text descriptions of findings are verified against report tables by three separate and independent readers. All observations in respect to the similarity or differences between estimates are established through statistical testing that is independently recomputed and verified.

D A W N M E T H O D O L O G Y R E P O R T , 2 0 1 1 U P D A T E 4 7
7. DATA LIMITATIONS 7.1 Limitations of survey data
Information on drug-related ED visits in DAWN is based on a sample and is, therefore, subject to sampling variability. The SE measurements and CIs provided for all estimates reflect the sampling variability that occurs (a) by chance because only a sample rather than the entire universe is surveyed, and (b) by nonresponse. As in any survey, nonresponse is of concern because it creates larger-than-expected sampling errors plus the opportunity for unpredictable biases. DAWN addresses these issues in the short term by always reporting SEs based on the actual sample of respondents and for the long term by continuing its efforts to raise the hospital participation rate.
7.2 Limitations of using extant medical records
Although every effort is made during the data collection phase to collect data accurately and precisely, extant medical records vary in specificity and detail. Factors that may affect the reliability and accuracy of the findings include the following:
• DAWN data collectors attempt to identify, with a high degree of specificity, the exact drugs involved in an ED visit, but extant medical records vary in specificity and detail. If extant medical records include only a general description of a drug (e.g., "benzodiazepines"), the drug is grouped in a general category (e.g., "benzodiazepines not otherwise specified").
• DAWN relies on the assessment made by ED medical staff to determine which drugs are related to the visit and records only those drugs indicated as being related.
• DAWN does not assess the medical reasons for the visit, and it cannot be assumed that a drug was the direct cause of the medical emergency. For example, a soporific may have caused the patient to fall asleep while driving and have an accident.
• Use of illicit drugs is assumed to constitute drug abuse. The determination of nonmedical use of pharmaceuticals, though, must be supported by information provided by medical personnel in the ED records.
• In cases where multiple pharmaceuticals are involved, it is not necessary that both drugs are misused. The medical emergency might stem from the interaction between two pharmaceuticals, one of which was used nonmedically and the other of which was taken as prescribed.
• While DAWN seeks to report only the drugs that are related to the ED visit, some unrelated drugs may be included if ED records fail to indicate that they were obtained through a legitimate prescription, were taken as prescribed or indicated, and were unrelated to the ED visit. For example, anecdotal evidence suggests that ED records may mention methadone but fail to indicate that the patient was enrolled in a methadone treatment program and that the methadone was unrelated to the medical emergency leading to the ED visit.
• Information on race and ethnicity is often poorly documented in extant ED records. In addition, some hospitals consider race/ethnicity to be private information and will not
4 8 D A W N M E T H O D O L O G Y R E P O R T , 2 0 1 1 U P D A T E
make it available to DAWN Field Reporters. Overall, about 15 percent of visits each year do not contain race/ethnicity information. DAWN does not produce rates (visits per 100,000 population) for race/ethnicity groups because these missing data will result in the understatement of visits by race/ethnicity category. This might affect racial/ethnic groups differentially and produce misleading findings.
7.3 Limitations on toxicology test finding
Although DAWN documents whether a drug was positively confirmed by toxicology testing, DAWN does not require that all drugs reported for the ED visit be confirmed by laboratory testing. Toxicology tests are not used consistently across EDs, and some toxicology tests are not specific enough to identify particular drugs. Furthermore, a positive toxicology test is not necessarily evidence of recent drug involvement in an ED visit if it is a current medication or a drug that persists in the system long after it was used. For this reason, DAWN requires that the involvement of drugs be mentioned in the ED record, not just in the toxicology testing results, for the visit to be considered a DAWN case.
D A W N M E T H O D O L O G Y R E P O R T , 2 0 1 1 U P D A T E 4 9
8. HISTORY OF DAWN, 1970–2012
DAWN is a public health surveillance system that has monitored drug-related ED visits to hospitals since the early 1970s. DAWN was initially established by the U.S. Drug Enforcement Administration. DAWN was transferred to the U.S. Department of Health and Human Services (HHS) in 1980. Within HHS, the National Institute on Drug Abuse (NIDA) conducted DAWN from 1980 to 1992. For the period 1992 through 2011, CBHSQ (formerly the Office of Applied Studies) of SAMHSA was responsible for DAWN operations and reporting. CBHSQ ceased performing DAWN data collection as of the end of calendar year 2011, and the responsibility for collection of data on drug-related ED visits was passed to the National Center for Health Statistics (NCHS). NCHS incorporated DAWN data elements into the National Hospital Care Survey (NHCS). NCHS is observing DAWN conventions and methodologies to the greatest extent possible so that data collected via DAWN for the years 2004–2011 can be compared with the data collected by the NHCS for later years. For example, given its sample design and size, the drug-related ED visits data collected through NHCS will be representative of the nation but not the DAWN metropolitan areas. Additional information on NHCS and its collection of information on drug-related ED visits is available at the NHCS Web site.25
Since its inception, DAWN has relied on data collected from a sample of hospitals. However, over the years, the exact survey methodology has been adjusted to improve the quality, reliability, and generalizability of the information produced by DAWN. When NIDA assumed responsibility for DAWN in 1980, implementation of a sample of hospitals to produce representative estimates for the Nation and for selected metropolitan areas became a priority. This sample, refreshed with annual maintenance, continued to support DAWN estimates for the contiguous United States and 21 metropolitan areas until 2002. Major population shifts and changes in the hospital industry between 1980 and 2002 made apparent the need for a redesign of the sample of hospitals. Many other features of DAWN (e.g., definition of a DAWN visit to include all drug-related medical emergencies and not merely those involving misuse or abuse) were also introduced at that time.26
In the redesign in 2003, DAWN's goal remained to produce national as well as metropolitan area–level estimates. Retention of the original 21 metropolitan areas was important because of the ongoing demand for DAWN estimates by public health professionals in those areas. In addition, inclusion of major population centers in each of the nine census divisions was deemed important to improve DAWN's geographic and population coverage. A total of 48 metropolitan areas was identified for inclusion in DAWN. The composition of these metropolitan areas was based on the
25 Further information on NHCS and its data are available at http://www.cdc.gov/nchs/nhcs.htm. 26 Additional detail on the 2003 redesign is available in the following publication: Substance Abuse and
Mental Health Services Administration, Center for Behavioral Health Statistics and Quality. (2002). Drug Abuse Warning Network: Development of a new design (methodology report) (DAWN Series M-4, DHHS Publication No. SMA 02-3754). Rockville, MD: Author.
5 0 D A W N M E T H O D O L O G Y R E P O R T , 2 0 1 1 U P D A T E
definitions issued by the Office of Management and Budget (OMB) in June 2003. For consistency, DAWN has maintained the 2003 definitions, even if counties were added in subsequent years.
Between 1980 and 2003, OMB had substantially enlarged the coverage areas for 4 of the original 21 metropolitan areas. Users of DAWN statistics in these 4 areas—Los Angeles, Miami, New York, and San Francisco—remained interested in obtaining estimates for the areas covered by the original 21 metropolitan areas. To address the needs of these users, DAWN subdivided these metropolitan areas according to their earlier composition and planned oversamples in the subdivided portions. That is, for each of these areas, there were an oversample for the metropolitan area as defined in 2003 and also additional oversampling in the submetropolitan areas. When participation is high enough, separate estimates are made for the submetropolitan areas as well as the entire metropolitan area.
In 2000, DAWN adopted the Multum Lexicon, © 2012, a drug vocabulary and classification tool developed and maintained by Lexi-Comp, Inc., a private firm that distributes the Lexicon and regular updates through its Web site. While the use of the Lexicon is free of charge, a licensing agreement specifies the terms required of users. In accordance with the licensing agreement, DAWN publications, tabulations, and software applications cite the Multum Lexicon as the source and basis for the system DAWN uses to code drugs.
The DAWN survey relies on a longitudinal probability sample of hospitals located throughout the United States. To be eligible for selection into the DAWN sample, a hospital must be a non-Federal, short-stay, general surgical and medical hospital located in the United States, with at least one 24-hour ED. This sampling strategy was first implemented in the 2004 data collection year and has been followed since that year.