day 3 key account masterclass – global best practice day 3 by professor malcolm mcdonald cranfield...
Post on 19-Dec-2015
214 views
TRANSCRIPT

Key Account Masterclass – global best practice
Day 3Day 3
by
Professor Malcolm McDonald
Cranfield School of Management

2. Global Key Account Management
The objectives for this module are: to provide a guide to the current world class practice
of major account management to provide a framework for understanding the
development of major customer relationships to provide a planning framework for improving major
customer managementOutputs/deliverables focus on and augment best practice major customer
management improve understanding of the techniques involved in
the process

Programme
Key account definition
Modelling key accounts
Defining and selecting key accounts
Key account analysis and planning
Organisational and skills issues

Challenges
Market maturity
Globalisation
Customer power
© Professor Malcolm McDonald, Cranfield School of Management

Customer power
Big customers are getting bigger
Customers are rationalising their supplier base
Customers have become more sophisticated
Customers want tailor-made solutions
The cost of serving customers is increasing
Suppliers and customers are developing new ways of working together
© Professor Malcolm McDonald, Cranfield School of Management

BiscuitManufacturer
Board/Packaging
SpecialityAdhesives
Metal Bearings
24
76
16
64
14
39
18
44
BiscuitManufacturer
Board/Packaging
SpecialityAdhesives
Metal Bearings
1972 1996
% of totalsupplier
sales
From: Profitable Customers, Charles Wilson
Sales to the top 5 customers as a % of total supplier sales (1972 - 96)
Increasing customer concentration...

Customer power
Big customers are getting bigger
Customers are rationalising their supplier base
Customers have become more sophisticated
Customers want tailor-made solutions
The cost of serving customers is increasing
Suppliers and customers are developing new ways of working together
© Professor Malcolm McDonald, Cranfield School of Management

Increasing costs of interfacing with customers
Supplier to the print industry (turnover £200M)
Interface costs £'000 per customer
(adj. for inflation)
1980 1996
Top 10% of customers
60
140
1980 1996
Bottom 10% of customers
159
Costs of the frontline (Sales, service, trade promotions etc.(1980 v 1996)
Source: Profitable Customers, by Charles Wilson

From ‘Key Account Management’
Cranfield University School of Management, 1996
Suppliers are still interested principally in volume
Whilst they are interested in the potential for
‘added value’, most still do not measure account
profitability
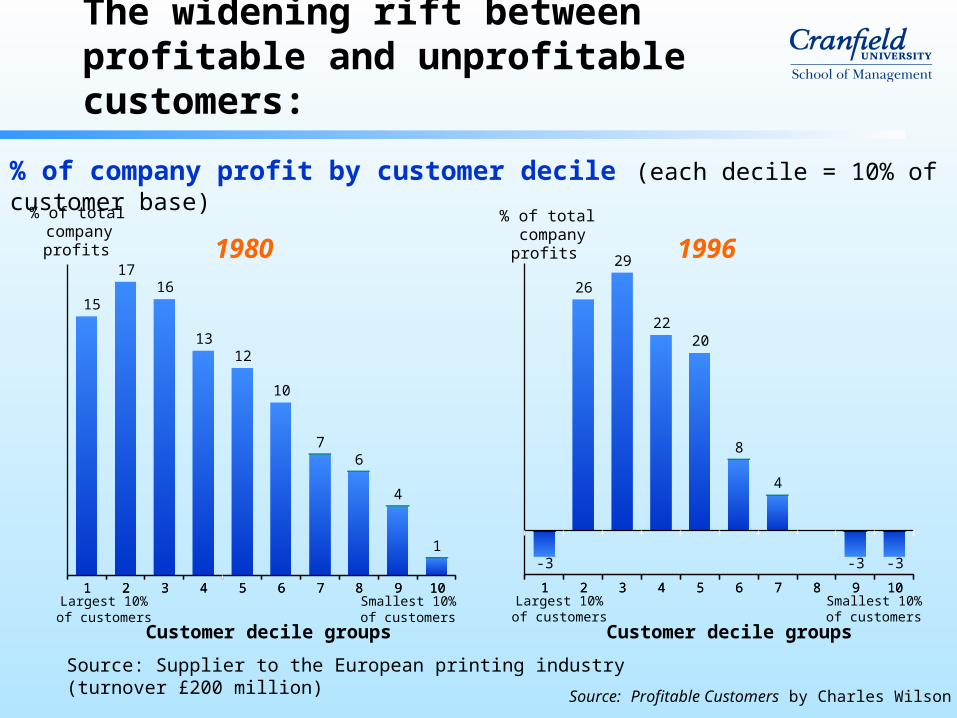
The widening rift between profitable and unprofitable customers:
Source: Supplier to the European printing industry (turnover £200 million)
1980
1 2 3 4 5 6 7 8 9 10
15
1716
1312
10
76
4
1
1 2 3 4 5 6 7 8 9 10
% of total companyprofits
Largest 10%of customers
Smallest 10%of customers
Customer decile groups
1 2 3 4 5 6 7 8 9 10
-3
26
29
2220
8
4
-3 -3
1 2 3 4 5 6 7 8 9 10
% of total company
profits
Largest 10%of customers
Smallest 10%of customers
Customer decile groups
1996
% of company profit by customer decile (each decile = 10% of customer base)
Source: Profitable Customers by Charles Wilson

Customer account profitability analysis
The key phrase is Attributable Costing
The objective is to highlight the financial impact
of the different ways in which customers are
serviced
© Professor Malcolm McDonald, Cranfield School of Management

Creating closer relationships with supply chain partners
Marketing
Operations
InformationSystems Sales Purchasing
Marketing
Operations
InformationSystems
FromFrom
Supplier Customer
D
I
R
E
C
T
O
R
S
D
I
R
E
C
T
O
R
S
© Professor Malcolm McDonald, Cranfield School of Management

Creating closer relationships with supply chain partners
InformationSystems
Operations
Marketing
Operations
InformationSystems
Marketing
Key-AccountCo-ordination
Supplier
To
SupplierDevelopment
Customer
Directorsselling company
Directorsbuying company
© Professor Malcolm McDonald, Cranfield School of Management

Preliminary selection of key accounts

Key account preliminary categorisation
Top 15 (in volume/revenue generated)
Next 30
Next 55
A
B
C
© Professor Malcolm McDonald, Cranfield School of Management

Key account preliminary categorisation
Realisation of fullest potentialof both organisations
Confidence in relationship, stable& highly evaluated by both sides
Integrated
Interdependent
Basic
Degree ofcollaboration
KAM relationship stage Needs of parties toKAM relationship
Low: transactional
High: collaborative
Reduction of risk,ability to forecast
Operational, efficienttransactions
Cooperative
© Professor Malcolm McDonald, Cranfield School of Management

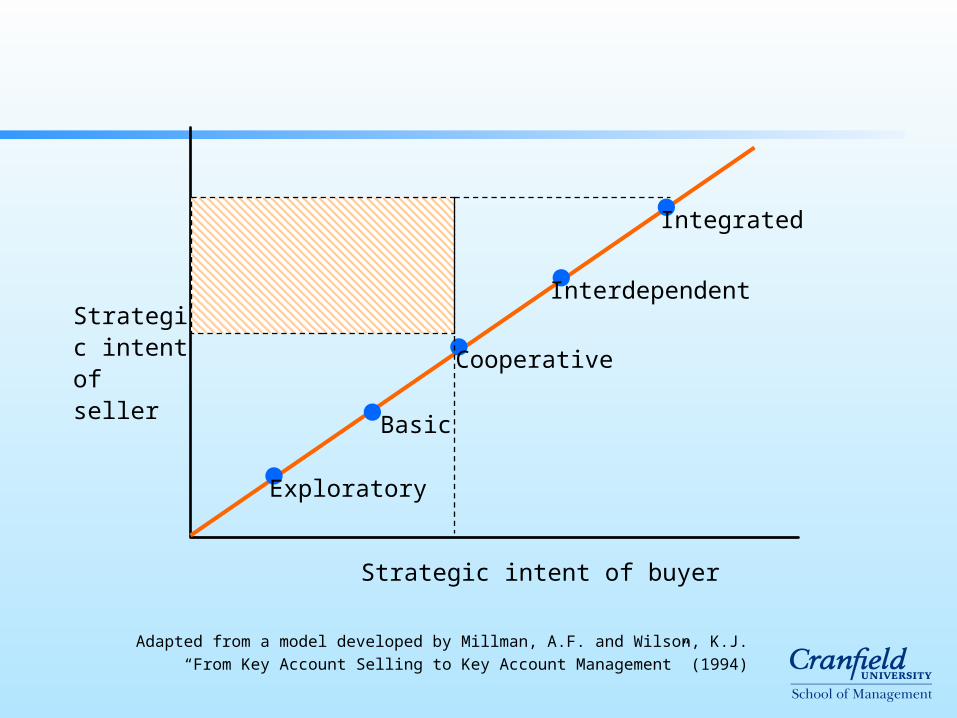
Exploratory
Basic
Cooperative
Interdependent
Integrated
Strategic intent of seller
Strategic intent of buyer
Adapted from a model developed by Millman, A.F. and Wilson, K.J.
“From Key Account Selling to Key Account Management” (1994)
The relational development model

Exploratory KAM
Selling company Buying company
Managers
Clerks
Operators
Directors
Supervisors
Managers
Clerks
Operators
Directors
Supervisors
Key CustomerContact
Key AccountManager
Cranfield University School of Management 1996

• Pre trading
• Customer potentially qualifies as Key Account
• Both sides exploring
• Signaling important
• Seller needs to be patient & prepared to invest
• Reputations critical
Exploratory KAM

Selling company Buying company
Board BoardAdmin AdminOps OpsKey Account Mgr
Key Customer
Contact
Cranfield University School of Management 1996
Basic KAM

• Transactional: emphasis on efficiency • Driven by price, success measured by price• Probably multi-sourcing • Easy to exit • Single point of contact• Business relationship only • Very little information sharing• Reactive rather than proactive• Probably low common interest• Organisation suits selling company• Reward structure of KAMgrs paramount• Small chance of growing business• Can be stable state or trial stage
Basic KAM

Cranfield University School of Management 1996
Co-operative KAM
Selling company Buying company
Service
Key Customer Contact & Key Account Manager
Inbound logistics &Order processing/Customer service
Directors
Accounts
Marketing Marketing
Service
Directors
Accounts
ProductionProduction

• Selling company adds value to relationship
• Based on assumption/experience of delivery performance
• May be preferred supplier
• Exit not particularly difficult
• Multi-function contacts
• Relationship still mainly with buyer
• Organisation mainly standard
• Limited visits to customer
• Limited information sharing
• Forecasting rather than joint strategic planning
• Not really trusted by customer
Co-operative KAM

Selling company Buying company
Managers Managers
Operations Operations
Administration Administration
Board Board
KeyAccount
Mgr
Purchasing Manager
Cranfield University School of Management 1996
Interdependent KAM

• Both acknowledge importance to each other• Principal or sole supplier • Exit more difficult • Larger number of multi-functional contacts • Developing social relationships • High volume of dialogue• Streamlined processes• High level of information exchange, some sensitive• Better understanding of customer• Development of trust • Pro-active rather than reactive• Prepared to invest in relationship• Wider range of joint and innovative activity • Joint strategic planning, focus on the future• Opportunity to grow business
Interdependent KAM
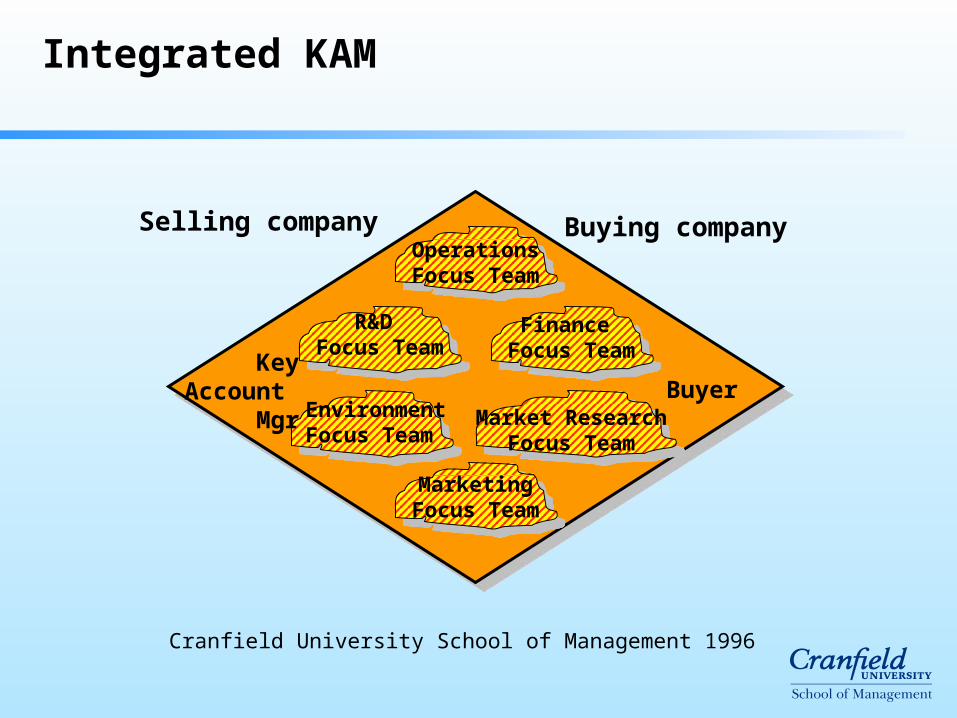
Operations Focus Team
Finance Focus Team
R&D Focus Team
EnvironmentFocus Team
Market Research Focus Team
MarketingFocus Team
Buying company
KeyAccount
Mgr
Selling company
Buyer
Cranfield University School of Management 1996
Integrated KAM

• Real partnership: complementary, mutually dependent• Few in number• Sole supplier, poss handling secondary suppliers• High exit barriers, exit is traumatic • Individual organisations subsidiary to team socially • Dedicated, cross-boundary functional/project teams• Open information sharing on sensitive subjects• Transparent costing systems• Assumption of mutual trustworthiness, at all levels• Abstention from opportunistic behaviour• Lowered protection against opportunism• Joint long-term strategic planning• Better profits for both
Integrated KAM
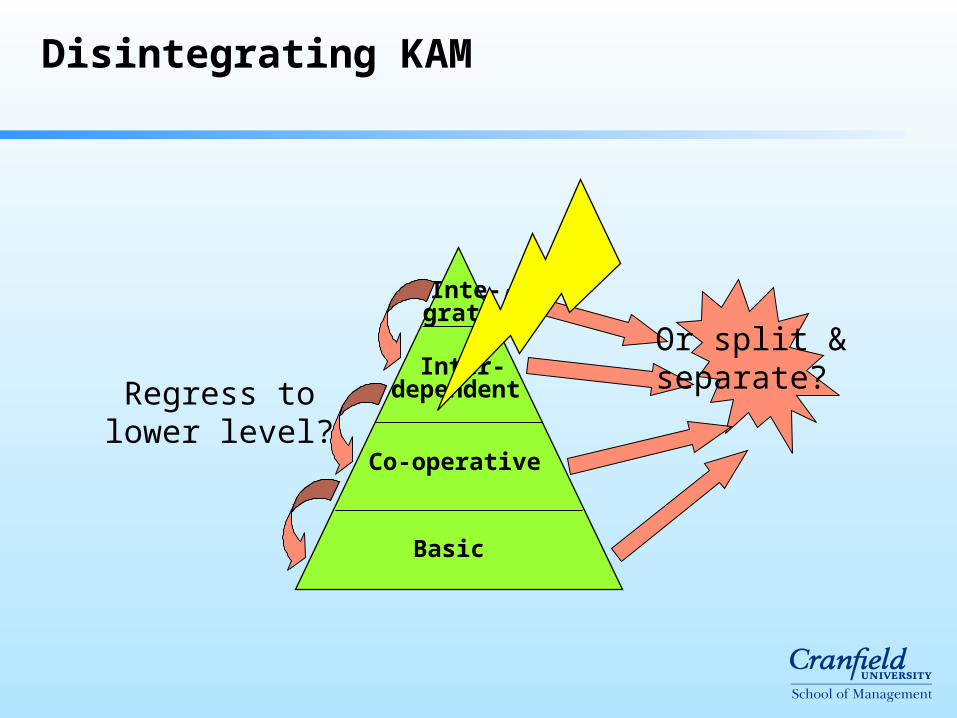
Inte-grated
Inter-dependent
Co-operative
Basic
Regress to lower level?
Or split & separate?
Disintegrating KAM

• Occurs at any level
• Rarely caused by price problems
• Often change in key personnel
• Key Account Manager’s approach or lack of skills
• Failure to forge multi-level links
• Breach of trust
• Prolonged poor performance against agreed programme
• Changing market positions
• Changing culture, organisation, ownership, role
• Complacency
• Financial disappointment?
Disintegrating KAM

Many activities cross the boundaries - especially information based activities such as:Sales Forecasting, Capacity Planning, Resource Scheduling, Pricing, etc
Support ActivitiesInfrastructure
Human ResourceManagement
Product & TechnologyDevelopment
Procurement Value Added - Cost= Profit
- Legal, Accounting, Financial Management
- Personnel, Pay, Recruitment, Training, Manpower Planning, etc
- Product and Process Design, Production Engineering, Market Testing, R&D, etc
- Supplier Management, Funding, Subcontracting, Specification
INBOUNDLOGISTICS
OPERATIONS OUTBOUNDLOGISTICS
SALES &MARKETING
SERVICING
eg.Quality ControlReceivingRaw Material Controletc
eg.ManufacturingPackagingProduction ControlQuality ControlMaintenanceetc
eg.Finishing GoodsOrder HandlingDespatchDeliveryInvoicingetc
eg.Customer mgmtOrder TakingPromotionSales AnalysisMarket Researchetc
eg.WarrantyMaintenanceEducation / TrainingUpgradeetc
Primary Activities

Design
Cost generated by decisions
Time
Cost (%)Cost (%)
Increase of expenses
Potential saving
Industrial prototype Production
100
90
75
15
5
Impact of an upstream action

Customer Retention
Source: Bain & Co, © Bain & Co 1990
0
20
40
60
80
100%
1st January 31st December
Percentageof Customers
CustomerRetentionRate (85%)
Customer retention is the best measure
Retention Rate: =
No. of customers at year end who were customers at the beginning of the year
No. of customers at the beginning of the yearx 100

Retaining customers is extremely profitable
Source: Bain Customer Retention Model, Bain & Company
© Copyright Bain & Company 1990
CustomerProfit
0 1 2 3 4 5 6
Price premium
Referrals
Reducedoperating costs
Increased purchases/balance growth
Base profit
AcquisitionCost
Year
Retaining customers is extremely profitable

How much profit a customer generates over time
Source: Harvard Business Review Sept. - Oct. 1990
Year
(51)
30
42 4449
55
(60)
(40)
(20)
0
20
40
60
0 1 2 3
Pro
fit
per
Cu
sto
mer
($)
4 5
Credit Card

How much profit a customer generates over time
-300
-200
-100
0
100
200
300
1 2 3 4 5
Year
Industrial Laundry
Source: Harvard Business Review Sept. - Oct. 1990
144166
192222
256
Pro
fit p
er C
usto
mer
($)

Lifetime values of customers
Source: Wilson M. Marketing Improvements Group
ADefection rate((% customer
lost each year)
BRelationship Life
expectancy(years)
CAnnual Value
(units of value)
D = B + CLifetime Value(units of value)
20%
10%
5%
2.5%
5
10
20
40
3000
3000
3000
3000
15000
30000
60000
120000
ThereforeTherefore
Halving customer defection rate doubles rate of future turnover-
lifetime value of customer

A credit card company’s defection curve
The net present value of the profit streams a customer generates over the average customer life. At 10% defection rate for example, the average customer life is ten years (1 divided by the defection rate). The customer value is the net present value of the profit streams for ten years.
*
Source: Harvard Business Review Sept. - Oct. 1990
0
200
400
600
800
$1000
40% 30% 20% 10% 5% 0%50%
2.5 3.3 5. 10. 202 Years
Defection Rate
Averagecustomer years
$20$70$38
$134
$300
$525
5% fewerdefectionsincreases
value by 95%
Cu
sto
mer
Val
ue*

Reducing defections 5% boosts profits 25% to 85%
Calculated by comparing the net present values of the profit stratems for the average customer life at current defection rates with the net values of the profit streams for the average customer life at 5% lower defection rates.
*
Source: Harvard Business Review Sept. - Oct. 1990
Auto-
serv
ice ch
ain
Branc
h de
posit
s
Credit
card
Credit
insu
ranc
e
Insu
ranc
e br
oker
age
Indu
stria
l dist
rib’n
Indu
stria
l laun
dry
Office
-bldg
. mgm
t.
Softw
are
30
8575
25
5045 45
4035
20
40
60
80
100
0
% I
ncr
eas
es i
n C
ust
om
er V
alu
e*

Why customers stop buying
1% Die, retire or are terminated
3% Transfer to other jobs, companies or locations
5% Give their business to other friends
9% Competitive reasons
14% Product dissatisfaction
68% Attitude of supply company
Research by Miller Business Systems

Thought startersThought starters
To what extent do you measure
customer retention by segment?

Thought startersThought starters
To what extent do you measure the
impact on profitability of each % point
increase in retention segment?

Key account strategies
Invest in Jointinformationsystems andfocus teams
High
LowVigilance
andmotivation
Invest indevolved
relationships
Maintenance &Consistency
Exploratory KAM InvestExploratory KAM Investin tailoring productin tailoring product
Basic KAM Invest inBasic KAM Invest inbuilding relationshipsbuilding relationships
Cooperative KAM Invest inCooperative KAM Invest inimproving processes improving processes
Basic KAMBasic KAM
Co-operative KAMCo-operative KAM
Cu
stom
er
Att
ract
iven
ess
Stage of KAM relationship
Interdependent KAMInterdependent KAM
Integrated KAMIntegrated KAM
Adapted from: “Key Account Management”, Cranfield University School of Management, 1996

High Low
High
Low
Supplier’s business strength with customer
Customerattractiveness
Strategic:invest
Volume: manage for cash
Bread & butter: maintain
Future stars: selectively invest
Key customer
Developed from McDonald, Millman & Rogers, 1996
Customer portfolio strategy matrix

K.A. AttractivenessFactors
10-7 6-4 3-0 X weight
Volume/value 15
Growth/potential % 30
Profit potential% 40
‘soft’ factors 15
100

High
Low
Relative Customer Satisfaction
LowHigh
XXKey Account Selection Matrix Tool - KA Selection Matrix
Chart
Display Spend:
Display Group:National
National
Spend with UsSpend with Us
Customer: College Group Relative Customer Satisfaction: 0.80 Account Attractiveness: 4.40 SpendCustomer: College Group Relative Customer Satisfaction: 0.80 Account Attractiveness: 4.40 Spend
Show GroupsShow Groups
RedrawRedraw
Acc
ou
nt
Att
ract
iveness
2
4 127
10
3
8
6
5
1
SupplementaryService Elements
1 Alexander Smith $14,000,0002 Ash & Williams $13,000,0003 College Group $12,000,0004 F T Group $9,900,0005 Harpers $7,600,0006 Parker $9,400,0007 Quality Insurers $16,200,0008 Randsome $14,500,0009 Royal & Co $6,400,00010 Thompson Group $32,000,00011 Tudor Rose $8,000,00012 Woods $11,500,000
Customers on ChartXX
IDID
NameName
Maximum SpendMaximum Spend
SupplementaryService Elements
Relationship StageXX
Co-operative
Basic
Exploratory Integrated
Interdependent
11
9
http://www.TheMarketingProcessCo.com
_______________

High Low
High
Low
Supplier’s business strength with customer
Customerattractiveness
Strategic:invest
Volume: manage for cash
Bread & butter: maintain
Future stars: selectively invest
Key customer
Developed from McDonald, Millman & Rogers, 1996
Customer portfolio strategy matrix

Customer account profitability
“The total sales revenue generated from a customer or customer group, less all the costs that are incurred in servicing that customer or customer group.”
(Ward - Strategic Management Accounting)€

Why calculate CAP ?
Knowing absolute profitability of customers assists in the decision: do we want to keep this customer? If so, on what terms?
Knowing the relative profitability of customers helps in strategic decisions on allocation of resources
Knowing the factors affecting customer profitability enables informed decisions to be taken in negotiations, and in pitching for new business.

Customer profitability – some questions
How much does the customer buy in a year? What is the direct cost of those goods? Standard products or bespoke? Is it steady work, or seasonal peaks? How many orders do they place in a year? By what mechanism? How many
of these are ‘emergency’ orders? Small quantities or large? How many times do our salespeople have to visit them? Do we have to maintain stock for them, or do we make to order? How many delivery sites? Where? What delivery terms? How many invoices do we raise to them? How many credit notes? Do they pay promptly? What are our credit control costs? How much does it
cost us to finance their debts? How much after-sales service do they need? What is likely to change in the future?

CAP: A basic model
Gross Sales Value (GSV)
Net Sales Value (NSV)
Production Contribution
Marketing Contribution
Customer Gross Profitability
Customer Contribution toCompany Overhead Profit
Trade Discount/Terms of Trade
(Sales)Marketing Costs
DistributionService Costs
Other CustomerRelated Costs
Production CostsIndirectDirect
• Sales Calls• In-store and Co-operative Promotions• Bonuses• Merchandising
Customer Related Costs (Direct)
• Sales Force Mgt• National Advertising Campaign
Overhead Costs (Indirect)
• Transportation• Packaging Utilisation• Stockholding*• Warehousing*• Refusals• Backorders
Customer Related Costs (Direct)
• Order Processing and Progressing• Stock Holding• Warehousing
Untraceable Costs
* Only in Certain Circumstances

Customer account profitability
Remember: in the early stages of the lifecycle, many of your customers may be unprofitable to service. Consider the likely impact over the whole lifecycle!

Customer lifetime value
NPV of future cashflows over the customer’s lifetime– Lifetime revenue
• For how long?
• What amounts per year?
– Costs to service
– Discount rate

Valuing Key Customer Accounts
Background/Facts• Risk and return are positively correlated, ie. as risk increases, investors expect a higher return. Risk is measured by the volatility in returns, ie. the likelihood of making a very good return or losing money. This can be described as the quality of returns. All assets are defined as having future value to the organisation. Hence assets to be valued include not only tangible assets like plant and machinery, but intangible assets, such as Key Customer Accounts. The present value of future cashflows is one of the most acceptable methods to value assets including key customer accounts. The present value is increased by:- increasing the future cash flows- making the future cash flows ‘happen’ earlier- reducing the risk in these cash flows, ie. (hence the required return) improving the certainty of these cash flows

Suggested Approach• Identify your key customer accounts. It is helpful if they can be classified on a vertical axis (a kind of thermometer) according to their attractiveness to your company. ‘Attractiveness’ usually means the potential of each for growth in your profits over a period of between 3 and 5 years. Based on your current experience and planning horizon that you are confident with, make a projection of future cashflows. It is normal to select a period such as 3 or 5 years. Identify the key factors that are likely to either increase or decrease these future cash flows. We suggest identifying the top 5 factors. Use your judgement to rank your customers according to the likelihood of the events leading to those factors occurring. This will help you to identify the relative risk of your key customer accounts. Ask your accountant to provide you with the overall required return for your company: this is often referred to as the weighted average cost of capital (WACC), or cost of capital.

Now identify the required rate of return for each of your key accounts based on the WACC. (WACC is the return required from the average customer). A higher required rate will apply for more risky customers and a lower rate for less risky customers. Your ranking of customers above will help you to decide the required return based on your understanding of the risk of each of these key customers. We recommend a range of plus or minus 30% of WACC provided by your accountant. Thus, (assuming your WACC is, say, 10%) in a matrix such as the one shown in Figure 1, you and your financial advisor may decide to use say, 8.5% for accounts in Box 1, ie. a 15% reduction on the WACC, 11.5% for those in Box 2, (ie. a 15% premium over the WACC), 13% for accounts in Box 3 (ie. a 30% premium over the WACC) and 10% for accounts in Box 4. Discount the future cash flows identified above using the risk adjusted rates to arrive at a value for your customers. An aggregate positive net present value indicates that you are creating shareholder value – ie. achieving actual overall returns greater than the weighted average cost of capital, having taken into account the risk associated with future cashflows.

2
LowHigh
Relative Strength
3
1 4Low
High
Key A/CAttractiveness
Figure 1Sri Srikanthan, Professor Malcolm McDonald, June 2001

Basic Customer Profitability Analysis
Shareholder Value
Total Value of Customer (FCF + Relationship Marketing aspects)
Marketing strategies for customer
retention
Economic value of
Customer
Linking CRM to shareholder value

How organisations build value
Requiredreturn
Risk
ReturnSuper profits - creates shareholder value
Destroys shareholder value

The total value of the key account
Economic Risk
Relationship Benefits
+Customer Lifetime Value
=Total
Value of Customer
Has three elements:1. Customer lifetime value 2. Other benefits from the relationship 3. The risk of the key account
― the probability of securing (1) and (2)

Calculating customer lifetime value
Yr 1 Yr 2 Yr 3 Yr 4 Customer profit £100 £100 £100 £100
Corporate discount rate 10% 10% 10% 10% Net present value £91 £83 £75 £68
CUSTOMER LI FETI ME VALUE (1)
£317

Customer Lifetime Value
Demanding customers
LIFETIME REVENUES
High Low
COSTSTO
SERVE
High
Low
Revenue Drivers:……………..
……….…….
……………….
………………..
Cost Drivers:…………………
…………………
…………………
…………………. Most profitable customers
Least profitable customers
Uncommitted or commodity customers

Measuring Customer Lifetime Value using risk-adjusted discount rates
Yr 1 Yr 2 Yr 3 Yr 4 Customer profit £100 £100 £100 £100
Corporate discount rate 10% 10% 10% 10% Net present value £91 £83 £75 £68
CUSTOMER LI FETI ME VALUE (1)
£317
Risk-adjusted discount rate 15% 15% 15% 15% Net present value £87 £76 £67 £57
CUSTOMER LI FETI ME VALUE (2)
£287

Key account risk
Defection or migration Volatile purchasing patterns Negative word of mouth Default / fraud / litigation Slow payment
Then, there are the PROFIT LEAKS: the things that suppliers themselves cause:– Using lots of our valuable time (sales, service, technical)– Using lots of our valuable services (that we offered them)– Demanding emergency support at peak times– Sorting out the errors we made (and not paying our invoices
meantime)

Factors reducing customer defection risk
Relationship Factor Worst Case Best Case
Longevity of relationship (in years)
0.5 16
Number of business lines
3 10
Quality of relationship (1 to 5)
1 5
Number of contacts at client
2 8
Measure

Customer Risk Scorecard
Relationship Risk Factor
Value Probability of Renewal
A. Relationship dimensions 1. Longevity of relationship (years to date) 2. Number of business lines purchased
B. Account Relationship 1. Quality of relationship (where 1 = poor and 5 = excellent) 2. Number of contacts at client
1
3
4
6
40%
60%
90%
90%

The relationship risk scorecard
Relationship Risk Factors
Minimum value
Maximum value
Assigned Probability
Overall relationship with the company 1. Number of relationships with other business units
0 3 0=40%, 1=60%, 2=80%, >2=90%
2. Number of business lines within this business unit
3 10 1=40%, 2=50%, 3=60%, 4=70%, 5 to 10=80%, >10=90%
3. Longevity of relationship (in years)
0.5 16 <3=40%, 3=60%, 4=70%, 5=80%, >5=90%
Account Relationship 4. Company’s relationship with broker (where 1=very poor, 2=poor, 3=fair, 4=good, 5=excellent)
1 5 1=40%, 2=60%, 3=70%, 4=80%, 5=90%
5. Quality and warmth of company/client relationship (where 1=very poor, 2=poor, 3=fair, 4=good , 5=excellent)
1 5 1=40%, 2=60%, 3=70%, 4=80%, 5=90%
6. Number of relationship contacts company has at client
2 8 1=50%, 2=60%, 3=80%, More than 3=90%
7. Number of relationship contacts client has at company
3 10 1=50%, 2=60%, 3=80%, More than 3=90%
Understanding of client 8. How good was our understanding of their company (where 1=very poor, 2=poor, 3=fair, 4=good, 5=excellent)
1 5 1=40%, 2=60%, 3=70%, 4=80%, 5=90%
9. How good was our understanding of their industry (where 1=very poor, 2=poor, 3=fair, 4=good, 5=excellent)
1 5 1=40%, 2=60%, 3=70%, 4=80%, 5=90%

Measuring Customer Lifetime Valueusing forecast probability
Yr 1 Yr 2 Yr 3 Yr 4 Customer profit £100 £100 £100 £100
Probability % 90% 90% 75% 75% Probability-adjusted profit £90 £90 £75 £75
Corporate discount rate 10% 10% 10% 10% Net present value £82 £75 £56 £51
CUSTOMER LI FETI ME VALUE (3)
£264

• May be at risk if the relationship goes badly
• May be obtained anyway, even without the relationship
• But the relationship increases the probability of benefit
Calculating the probability of relationship benefits
Economic Risk
Relationship Benefits
+Customer Lifetime Value
=Total
Value of Customer

Managing key relationships profitably
• Implement key account management strategies based on lifetime value:
Manage defection of profitable customers • Manage acquisition of unprofitable customers
MANAGE:Cost reduction if
appropriate e.g. buy over Internet.
Discuss costs with customers.
LIFETIME REVENUES
High Low
COSTSTO
SERVE
High
Low
RETAIN:Defend from
competition, erect barriers to exit,
share data, longer-term contracts,
relationship pricing
COST REDUCTION:Reduce costs to
serve, visit frequency, cheaper
channels. Then, increase revenue. Possibly, divest
INVESTIGATE:Increase share of
spend. If not possible, contain
costs to serve.

Paths to value creation
Requiredreturn
Risk
Return
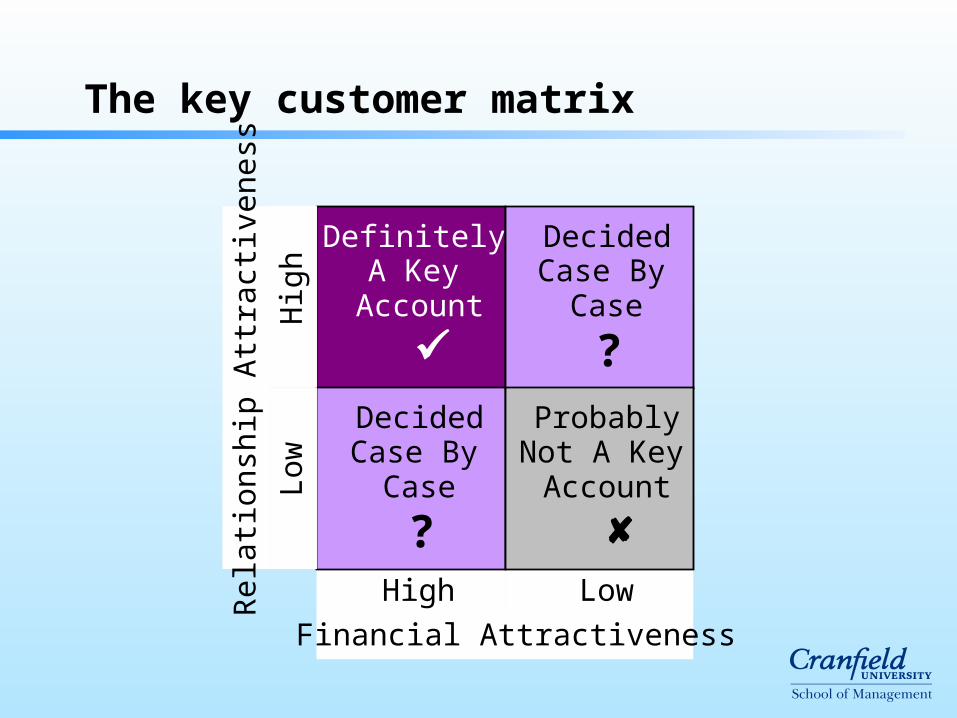
The key customer matrix
Low High
Definitely A Key
Account
Decided Case By
Case
?
Decided Case By
Case
? Probably
Not A Key Account
Rel
atio
nshi
p A
ttrac
tive
ness
Hig
h L
ow
Financial Attractiveness
Exploratory
Basic
Cooperative
Interdependent
Integrated
Strategic intent of seller
Strategic intent of buyer
Adapted from a model developed by Millman, A.F. and Wilson, K.J.
“From Key Account Selling to Key Account Management” (1994)

High Low
High
Low
Supplier’s business strength with customer
Customerattractiveness
Strategic:invest
Volume: manage for cash
Bread & butter: maintain
Future stars: selectively invest
Key customer
Developed from McDonald, Millman & Rogers, 1996
Customer portfolio strategy matrix

Key Account AnalysisKey Account Analysis

Business Partnership Process
11
22
33
44
55
66
77
88
Market / segmentselection criteria
Defining and selectingtarget key accounts
Industry driving forcesanalysis
Client’s annual reportsummary and financialanalysis
Client’s internal valuechain analysis
Client’s buying process and information needsanalysis
Our sales history withthe client
Competitive analysis
Client’s objectivesanalysis
99
For each key account
Client’s
Basic
CSF
Analysis
Process
Ourobjectives,strategiesand planfor T + 3
The ApplicationsPortfolio Analysis
Strategic High Potential
Key Operational Support
GainingAdvantage
AvoidingDisadvantage

Forces driving industry competition
Industry competitorsIntense rivalry if:Numerous or similar sized competitorsSlow industry growthHigh fixed costsLack of differentiationDiverse nature of competitorsHigh strategic stakesHigh exit barriers
(Rivalry among existing firms)
Suppliers
Powerful if:Few suppliers
No substitutes
Industry not important
Customer of supplier group
Supplier group’s products are differentiated
Threat to forward integration
Customers
Powerful if:Large proportions of seller’s sales
High proportion of buyer’s costs
Undifferentiated products
Low buyer switching costs
Threat of backward integration
Seller’s product not important to quality of buyer’s product
Potential entrants
Threat of new entrants
Barriers to entryEconomies of scale
Product differentiationCapital requirements
Switching costsAccess to distribution channels
Cost disadvantages additional to scaleGovernment policy
Entry deterring priceExperience
Threat of substitute products or services
Substitute

Macroenvironment
Macro-environment
Sector micro-environment
Company

Macroenvironment influences: STEEP
TechnologicalEcological
Political & legal
Economic Social

Microenvironment influences
Suppliers Customers
Current competitors
Potential substitutesNew entrants

Porter’s five forces of competitive intensity
Threat of
New entrants to market
Power ofBuyers
(customers)
Threat ofPotential substitutes
Power ofSuppliers
Professor Michael PorterHarvard Business School
Current competitors
Customer
Competitive intensity

Business Partnership Process
11
22
33
44
55
66
77
88
Market / segmentselection criteria
Defining and selectingtarget key accounts
Industry driving forcesanalysis
Client’s annual reportsummary and financialanalysis
Client’s internal valuechain analysis
Client’s buying process and information needsanalysis
Our sales history withthe client
Competitive analysis
Client’s objectivesanalysis
99
For each key account
Client’s
Basic
CSF
Analysis
Process
Ourobjectives,strategiesand planfor T + 3
The ApplicationsPortfolio Analysis
Strategic High Potential
Key Operational Support
GainingAdvantage
AvoidingDisadvantage

Annual Report Summary
5 CONCLUSIONS / OPPORTUNITIES
4 STRATEGIES
3 OBJECTIVES
2 MAJOR PROBLEMS / ISSUES
1 MAJOR ACHIEVEMENTS

Financial Analysis
Descriptionof Indicators
Current Ratio Measures the liquidity of a company - does it have enough money to pay the bills?Net Profit Margin Measures the overall profitability of a company by showing the percentage of sales retained as profit
after taxes have been paid. If this ratio is acceptable, there probably is no need to calculate the Gross Profitor Operating Profit Margins
Return on Assets Evaluates how effectively a company is managed by comparing the profitability of a company and its investments
Collection Period Measures the activity of debtors. Prolonged collection period means that a company’s funds are financingcustomers and not contributing to cash flow of the company
Stock Turnover Evaluates how fast funds are flowing through Cost of Goods Sold to produce profit. If stock turns overfaster, it is not in the plant as long before it is saleable as a product.
FinancialRatioIndicator
Formula Source CompanyStanding
IndustryStanding
Does it appear asthoughimprovementis needed?Yes NoA
nn
ua
lR
ep
ort
CurrentRatio
Net ProfitMargin
Return onAssets
CollectionPeriod
StockTurnover
Current AssetsCurrent Liabilities
Net ProfitNet Sales
Net Profit
Debtors LessBad Debts
Cost of Goods Sold
Stock
Are there anyinitial thoughtsabout how ourorganisation’sproducts/servicescan help?
Total Assets
Average Day’s sales

The value chain
Firm infrastructure
Human resource management
Technology development
Procurement
InboundLogistics
Operations OutboundLogistics
MarketingAnd sales
Service
Support Activities
Primary activities
M A
R G
IN
Infrastructure
Human ResourceManagement
Product & TechnologyDevelopment
Procurement
- Legal, Accounting, Financial Management
- Personnel, Pay, Recruitment, Training, Manpower Planning, etc
- Product and Process Design, Production Engineering, Market Testing, R&D, etc
- Supplier Management, Funding, Subcontracting, Specification
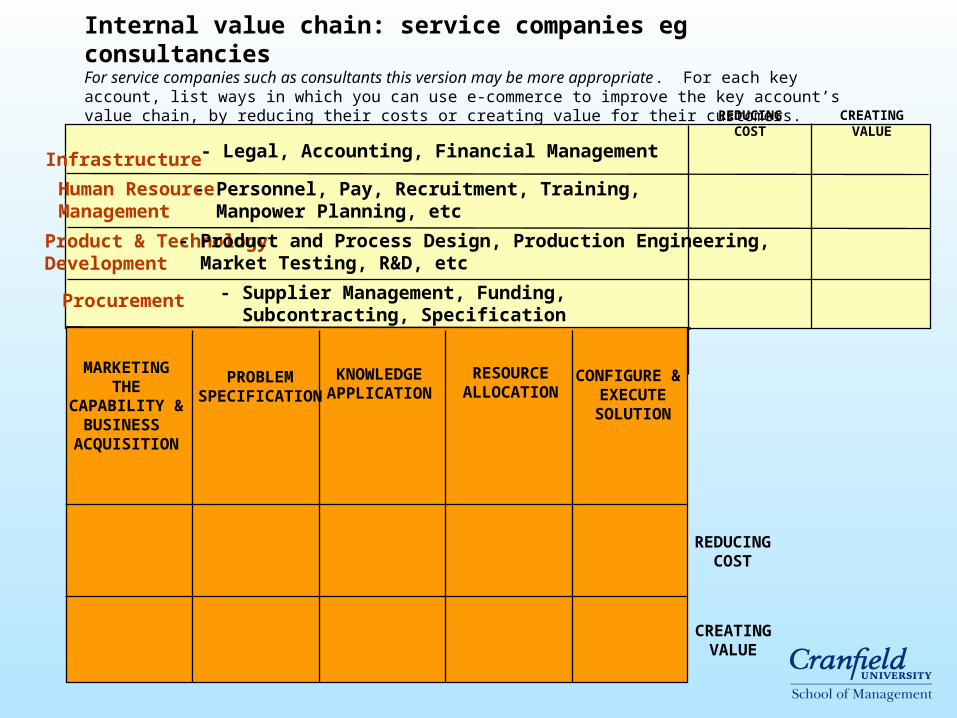
Internal value chain: service companies eg consultanciesFor service companies such as consultants this version may be more appropriate. For each key account, list ways in which you can use e-commerce to improve the key account’s value chain, by reducing their costs or creating value for their customers.
MARKETINGTHE
CAPABILITY &BUSINESS
ACQUISITION
PROBLEMSPECIFICATION
KNOWLEDGEAPPLICATION
RESOURCEALLOCATION
CONFIGURE & EXECUTESOLUTION
REDUCINGCOST
CREATINGVALUE
REDUCING COST CREATING VALUE

Sources of differentiation in the value chain
InboundLogistics
Operations OutboundLogistics
MarketingAnd sales
Service
Handling thatminimizes damage
Unique product featuresConforms to specsLow defect rateResponsiveness todesign change
High sales force coverageSuperior technical literatureBest credit termsPersonal relations withbuyers
Rapid installationHigh service qualityWide service coverage
Rapid and timely deliveryAccurate order processingCareful handling to reduce damage

Value Chain Analysis Summary
Increased RevenueIncreased Sales VolumeEnhanced Product Line
Tangible Benefits Analysis &Comment
ProductSolution
Cost DisplacementReduced Labour CostsReduced Equipment CostsReduced Maintenance CostsLowered Stock CostsReduced Energy Costs
Cost AvoidanceReduced New Personnel RequirementEliminate Planned New Equipment
Intangible BenefitsCustomer Good WillImproved Decision- Making

Adapted from J. Robinson, C.W. Farris and Y. Wind, Industrial Buying and Creative Marketing, Allyn and Bacon, 1967
Customer Analysis FormSalespersonProducts
Date of analysisDate of reviews
CustomerAddress Telephone numberBuy class new buy straight re-buy modified re-buy
Factors for consideration 123
priceperformanceavailability
456
back-up servicereliability of supplierother users’ experience
789
guarantees and warrantiespayment terms, credit or discountother, eg. past purchases, prestige, image, etc.
Member of Decision Making Unit(DMU)
Buy Phase
1 Recognises need or problemand works out general solution
2 Works out characteristics andquantity of what is needed
3 Prepares detailed specification
4 Searches for and locates potentialsources of supply
5 Analyses and evaluates tenders,plans, products
6 Selects supplier
7 Places order
8 Checks and tests products
Production
Name
Sales &Marketing
Research &Development
Finance &Accounts
Purchasing DataProcessing
Other

Competitive Comparison
Other
Promotion Support
Sales Support
Terms
Price/Discounts
Delivery
Availability
Product Range
Product Quality
ImplicationsCompetitorYouImportance Rating

Competitive Comparison (continued)
Importance Rating Rating (by customer) (customer view)A - Very important (Essential) 1 - Consistently/fully meets
needsB - Important (Desirable) 2 - Meets needs
inconsistentlyC - Low Importance 3 - Fails to meets needs
Competitor Strategy
CompetitorStrategy
1.
2.
3.

Business Partnership Process
11
22
33
44
55
66
77
88
Market / segmentselection criteria
Defining and selectingtarget key accounts
Industry driving forcesanalysis
Client’s annual reportsummary and financialanalysis
Client’s internal valuechain analysis
Client’s buying process and information needsanalysis
Our sales history withthe client
Competitive analysis
Client’s objectivesanalysis
99
For each key account
Client’s
Basic
CSF
Analysis
Process
Ourobjectives,strategiesand planfor T + 3
The ApplicationsPortfolio Analysis
Strategic High Potential
Key Operational Support
GainingAdvantage
AvoidingDisadvantage

Applications whichare critical to
achieving futurebusiness strategy
Strategic
Applications whichmay be critical inachieving future
business strategy
High Potential
Applications uponwhich the
organisationcurrently depends
for success
Key Operational
Applications whichare valuable but
not criticalto success
Support
Creating
Advantage
Avoiding
Disadvantage
The application portfolio
Adapted from Professor Chris Edwards, Cranfield School of Management

Key account objectives Key account objectives
and strategy settingand strategy setting

Business Partnership Process
11
22
33
44
55
66
77
88
Market / segmentselection criteria
Defining and selectingtarget key accounts
Industry driving forcesanalysis
Client’s annual reportsummary and financialanalysis
Client’s internal valuechain analysis
Client’s buying process and information needsanalysis
Our sales history withthe client
Competitive analysis
Client’s objectivesanalysis
99
For each key account
Client’s
Basic
CSF
Analysis
Process
Ourobjectives,strategiesand planfor T + 3
The ApplicationsPortfolio Analysis
Strategic High Potential
Key Operational Support
GainingAdvantage
AvoidingDisadvantage

Developing strategic plans for strategic customers: the process
Understand the customer’s external environment
Understand the customer’s internal capabilities & resources
Work out the customer’s strategies and its critical success factors for us
Understand our internal capabilities & resources
Work out our objectives & strategies, plus key actions
Agree a process to produce a strategic customer plan

The contents of a KAM strategic marketing plan (T+3)
Purpose statement
Financial summary
KA overview
Client’s CSF analysis summary
Applications portfolio summary
Assumptions
Objectives and strategies
Budget

Programme guidelines suggested for different positioning on the directional policy matrix
Maintain or increasedominance
Differentiation - lineexpansion
Lead - Aggressivepricing for share
Aggressivemarketing
Broadendistribution
Tight control - go forscale economies
Expand, invest (organicacquisition, joint venture)
Expand - invest
Upgrade managementin key functional areas
Fund growth
Reduce in process -extend credit
Maintain or slightlymilk for earnings
Prune for less successfuldifferentiate for segments
Stabilise prices / raise
Limit
Hold widedistribution pattern
Emphasise cost reductionviz. variable costs
Maximise capacityutilisation
Focus on specificprojects
Maintain, reward efficiency,tighten organisation
Limit fixed investment
Tighten Credit- reduceaccounts receivableincrease inventory turn
Maintain selectivity-segment
Emphasise productquality
Maintain or raise
Maintain selectively
Segment
Tight control
Increase productivitye.g. specialisation
Invest selectively
Allocate key managers
Invest selectively
Reduce
Forego share for profit
Aggressively prune
Raise
Minimise
Gradually withdrawdistribution
Aggressively reducefixed & variable
Free up capacity
None
Cut back organisation
Minimise & divestopportunistically
Aggressively reduce
Invest selectivelyin share
Differentiation - lineexpansion
Aggressive - price forshare
Aggressivemarketing
Limited coverage
Tight - but not at expenseof entrepreneurship
Invest
Invest
Invest
Fund growth
Invest
Products
Market Share
Price
Distribution
Promotion
Cost Control
R & D
Production
Personnel
Investment
Working Capital
Investfor growth
Maintain marketposition, manage
for earnings SelectiveManagefor cash
Opportunisticdevelopment

Skill Requirements for Key Skill Requirements for Key Account ManagementAccount Management

Exploratory
Basic
Cooperative
Interdependent
Integrated
Strategic intent of seller
Strategic intent of buyer
Adapted from a model developed by Millman, A.F. and Wilson, K.J.
“From Key Account Selling to Key Account Management” (1994)
The progression of the role of the key account manager

Blake and Mouton
1/9The customers
friend
9/9The problem
solver
1/1The order
taker
9/1The pressure
salesman
5/5Compromise
“Method” approach
Concern for customer
Concern for making the sale
9
1
91

High
Low
High Low
Our attractiveness to account
Accountattractiveness
Businessmanager
Entrepreneur
Project manager
Tactician
Account Portfolio Matrix

Significant differences
Buying companies valued...
– integrity
– Trust
Selling companies valued…
– Selling skills
– Negotiating skills

The Buyers’ View of Sellers (78%)
The enemy Untrustworthy Pushy Aggressive Manipulative
Unreliable Devious Opinionated Arrogant Poor Listeners Big Talkers
Only 18% saw the salesperson in positive terms
Source: Negotiation Resource International ‘Buyer Behaviours’, 2001(2000 purchasers over 2 years)

Developing key account professionals
Commercial awareness
Interpreting business performance
Advanced marketing techniques
Business planning/strategy
Finance
Project management
Interpersonal skills

Some key findings from KAM research
Key account management is a strategic activity
KAM is fashionable, but difficult
KAM can develop beyond partnership to synergy
There are mismatches between suppliers and customers
KAM does reduce costs and improve quality but these are rarely measured
A key account manager needs far more skills than a sales person
KAM needs a customer-focused organisation

Appendix 1Appendix 1

Practical ExercisesPractical Exercises

Step 1 List no more than seven key accounts.
Step 2 List Attractiveness Factors (to be used to evaluate the profit potential of all key accounts.
Step 3 List the criteria to be used to score each account under the columns 1, 2 and 3 (eg. if you say size or volume is a factor, what is a really attractive volume (column 1) What is a medium volume (column 2) and what is a poor volume (column 3).
Step 4 Decide which of these factors are more or less important by allocating a weight to each one.
Step 5 Score each key account from step 1 above, multiply the score by the
weight and arrive at an ‘Attractiveness’ score for all selected Key accounts.
Step 6 Place each key account on a ‘thermometer’, on which the lowest point is just below the lowest ‘attractiveness’ score and on which the highest point is just above the highest ‘attractiveness’ score.

Key account management business strengths - SWOT analysis
1
2
3
4
5
You Comp A Comp B Comp C Comp D
Total 100
1
2
3
4
5
1. KEY ACCOUNT DESCRIPTIONIt should be a specific part of the business and should be very important to your company
2. CRITICAL SUCCESS FACTORSIn other words, how does this customer select its suppliers?
3. WEIGHTING(How importantis each of theseCSFs? Scoreout of 100)
1
2
3
4
5
THREATS
5. OPPORTUNITIES / THREATSWhat are the few things outside your direct control that have had, and will have, an impact on this part of your business?
6. In what specific ways can your company help the customer to deal with the key issues it faces?
OP
PO
RT
UN
ITIE
S
4. STRENGTHS / WEAKNESSES ANALYSISHow would your customers score you and each of your main competitors out of 10 on each of the CSFs?Multiply the score by the weight.
Total score

Step 1 Select a key account and describe a specific part of this customer’s business and the specific product(s) that your company do/could supply
Step 2 Specify the customer’s critical success factors. In other words, what criteria does the customer use when selecting suppliers?
Step 3 Specify how relatively important each of these factors are to the customer (weighting).
Step 4 Score your company and at least two major competitors out of ten on each of these critical success factors. Multiply the score for each CSF by the weighting and arrive at a total score for your company and the two selected competitors.
Step 5 List the major opportunities and threats facing this customer.
Step 6 Specify in what ways your company can improve its competitive position or help the customer take advantage of the opportunities or overcome its threats.

Strategic management planning exercise - SWOT analysis for a key account
1
2
3
4
5
You Comp A Comp B Comp C Comp D
Total 100
1
2
3
4
5
1. SEGMENT DESCRIPTIONIt should be a specific part of the business and should be very important to the organisation
2. CRITICAL SUCCESS FACTORSIn other words, how do customers choose?
3. WEIGHTING(How importantis each of theseCSFs? Scoreout of 100)
1
2
3
4
5
THREATS
5. OPPORTUNITIES / THREATSWhat are the few things outside their direct control that have had, and will have, an impact on this part of their business?
6. KEY ISSUES THAT NEED TO BE ADDRESSEDWhat are the really key issues from the SWOT that need to be addressed?O
PP
OR
TU
NIT
IES
4. STRENGTHS / WEAKNESSES ANALYSISHow would their customers score them and their main competitors out of 10 on each of the CSFs?Multiply the score by the weight.
Total score

Step 1 Select a key account and describe a specific part of this customer’s business.
Step 2 Specify the critical success factors of the key account’s customers. In other words, how do their customers choose a supplier?
Step 3 Specify how relatively important each of these factors are to the key account’s customers (weighting).
Step 4 Score your key account and at least one of their major competitors out of ten on each of these critical success factors. Multiply the score for each CSF by the weighting and arrive at a total score for the key account and for at least one selected competitor.
Step 5 List the major opportunities and threats facing this customer.
Step 6 Specify in what ways your company can improve the key account’scompetitive position and help it to take advantage of its opportunities or overcome its threats.

Value Chain Analysis
Select a Key Account and examine its value chain.The objective is to identify ways in which your companycould help the customer to:
- increase revenue (eg. increase volume enhance their product line)
- displace costs (eg. reduce labour costsreduce equipment costsreduce maintenance costsreduce stock levelsreduce energy costs etc.)
- avoid costs (eg. reduce new personnel requirementeliminate planned new equipment etc.)
- gain other (eg. increase customer goodwill benefits improve decision making etc.)

The value chain
Firm infrastructure
Human resource management
Technology development
Procurement
InboundLogistics
Operations OutboundLogistics
MarketingAnd sales
Service
Support Activities
Primary activities
M A
R G
IN

Sources of differentiation in the value chain
InboundLogistics
Operations OutboundLogistics
MarketingAnd sales
Service
Handling thatminimizes damage
Unique product featuresConforms to specsLow defect rateResponsiveness todesign change
High sales force coverageSuperior technical literatureBest credit termsPersonal relations withbuyers
Rapid installationHigh service qualityWide service coverage
Rapid and timely deliveryAccurate order processingCareful handling to reduce damage
Key Account Buying Process Analysis
Select a Key Account and, using the form provided (please amend it if you wish to reflect the reality of your key account’s buying process), specify the individuals and groups who have any impact on the buying process. Please include users, deciders, buyers, influencers and gatekeepers, if appropriate.
Specify the kind of information required by each individual or group at different stages of the buying process.
Draw conclusions for action for your company

Adapted from J. Robinson, C.W. Farris and Y. Wind, Industrial Buying and Creative Marketing, Allyn and Bacon, 1967
Customer Analysis FormSalespersonProducts
Date of analysisDate of reviews
CustomerAddress Telephone numberBuy class new buy straight re-buy modified re-buy
Factors for consideration 123
priceperformanceavailability
456
back-up servicereliability of supplierother users’ experience
789
guarantees and warrantiespayment terms, credit or discountother, eg. past purchases, prestige, image, etc.
Member of Decision Making Unit(DMU)
Buy Phase
1 Recognises need or problemand works out general solution
2 Works out characteristics andquantity of what is needed
3 Prepares detailed specification
4 Searches for and locates potentialsources of supply
5 Analyses and evaluates tenders,plans, products
6 Selects supplier
7 Places order
8 Checks and tests products
Production
Name
Sales &Marketing
Research &Development
Finance &Accounts
Purchasing DataProcessing
Other

The contents of a key accountStrategic plan (T+3)
Bearing in mind that a strategic marketing plan should have the following key contents, specify what you believe should be the contents of all your company’s KA strategic plans. Mission or Purpose Statement Financial Summary Market overview
– what the market is– how it works– key segments
SWOT Analyses (on segments) Portfolio Summary (of SWOTs)
– prioritisation of objectives and strategies Budget (for 3 years)

How advanced is your key account practice?
How well do you know your key accounts?Score out of 10:Score out of 10:DO YOU1. Know your company’s proportion of customer spend?2. Know their financial health (ratios etc.)3. Know their strategic plan?4. Know their business process (logistics, purchasing, manufacturing, etc.)?5. Know their key customers/segments/products?6. Know which of your competitors they use, why and how they rate them?7. Know what they value/need form their suppliers?8. Allocate attributable (interface) costs to accounts/customer groups?9. Know the real profitability of the top ten and bottom ten accounts/customer
groups?10. Know how long it takes to make a profit on a major new customer?

Appendix 2Appendix 2