dayton ashrae chapter climate change & ozone depletion tom werkema march 10, 2008
Post on 21-Dec-2015
215 views
TRANSCRIPT
Dayton ASHRAE Chapter
Climate Change & Ozone Depletion
Tom Werkema
March 10, 2008
Agenda
1. Climate Science – Known & Unknowns
2. Climate International
3. Climate Country Specific
4. Ozone Science
5. Ozone International
6. Ozone Country Programs
7. Industry Response
8. Personal Responses to Climate Change
Climate Change Science
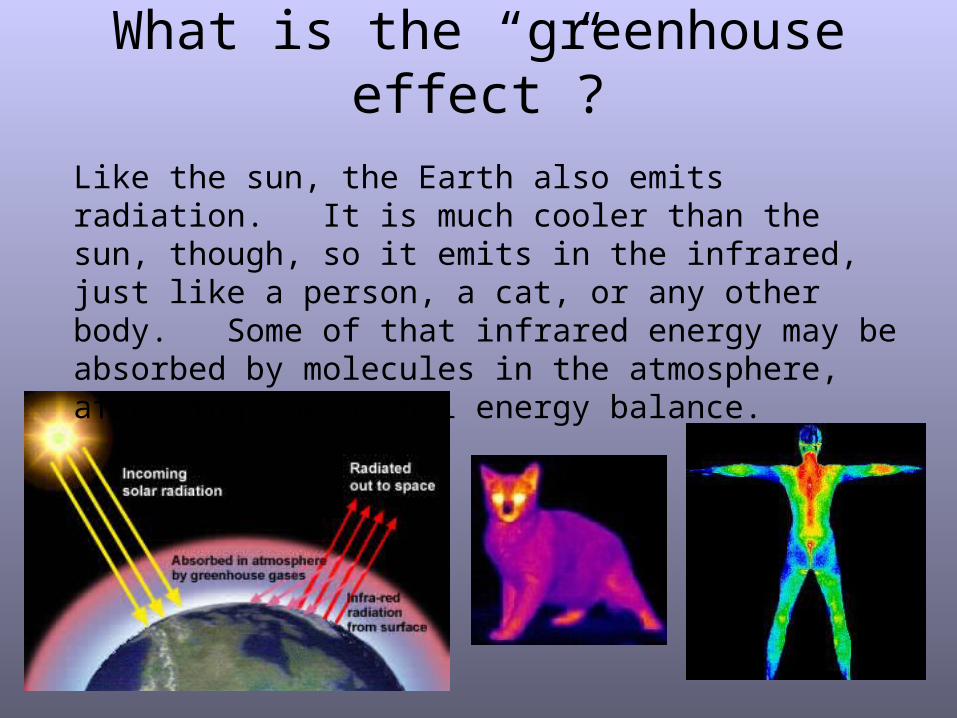
Like the sun, the Earth also emits radiation. It is much cooler than the sun, though, so it emits in the infrared, just like a person, a cat, or any other body. Some of that infrared energy may be absorbed by molecules in the atmosphere, affecting the global energy balance.
What is the “greenhouse effect”?
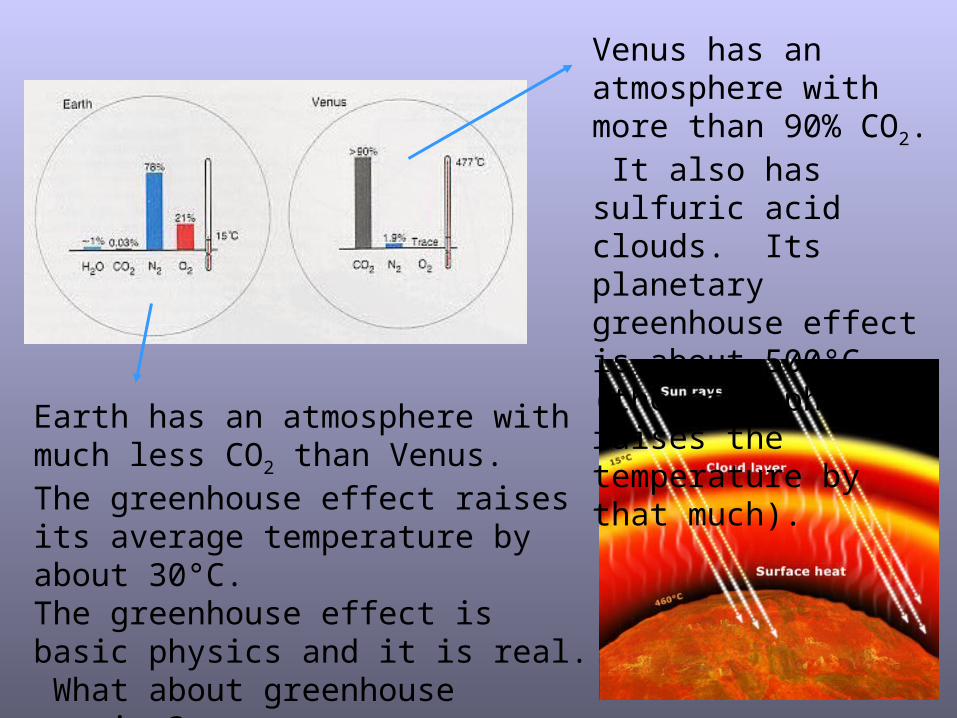
Venus has an atmosphere with more than 90% CO2. It also has sulfuric acid clouds. Its planetary greenhouse effect is about 500°C (the atmosphere raises the temperature by that much).
Earth has an atmosphere with much less CO2 than Venus. The greenhouse effect raises its average temperature by about 30°C. The greenhouse effect is basic physics and it is real. What about greenhouse warming?
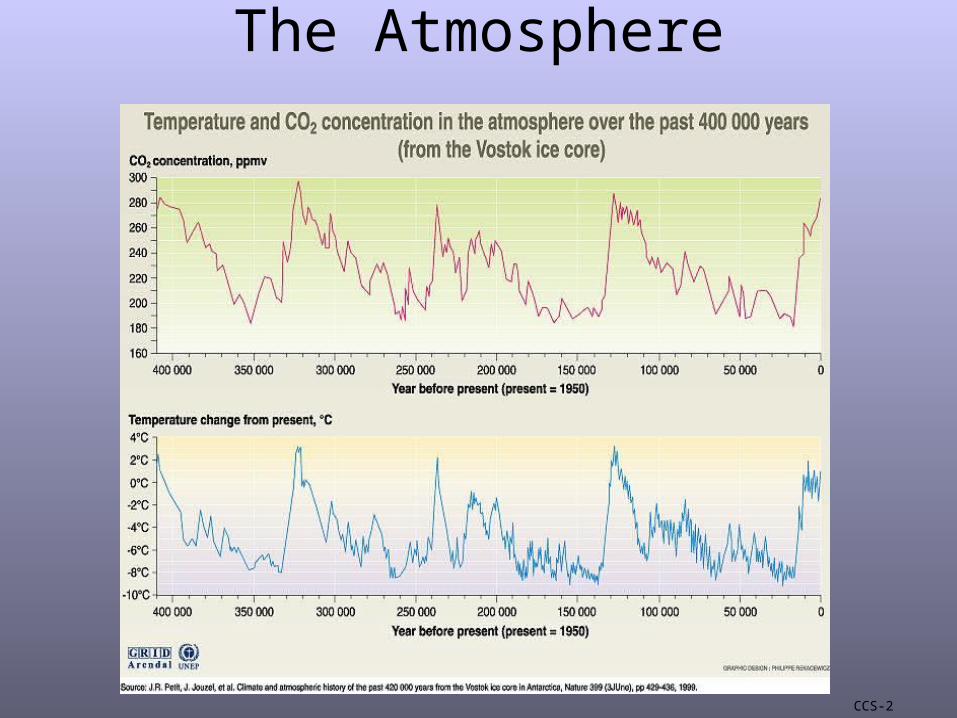
The Atmosphere
CCS-2
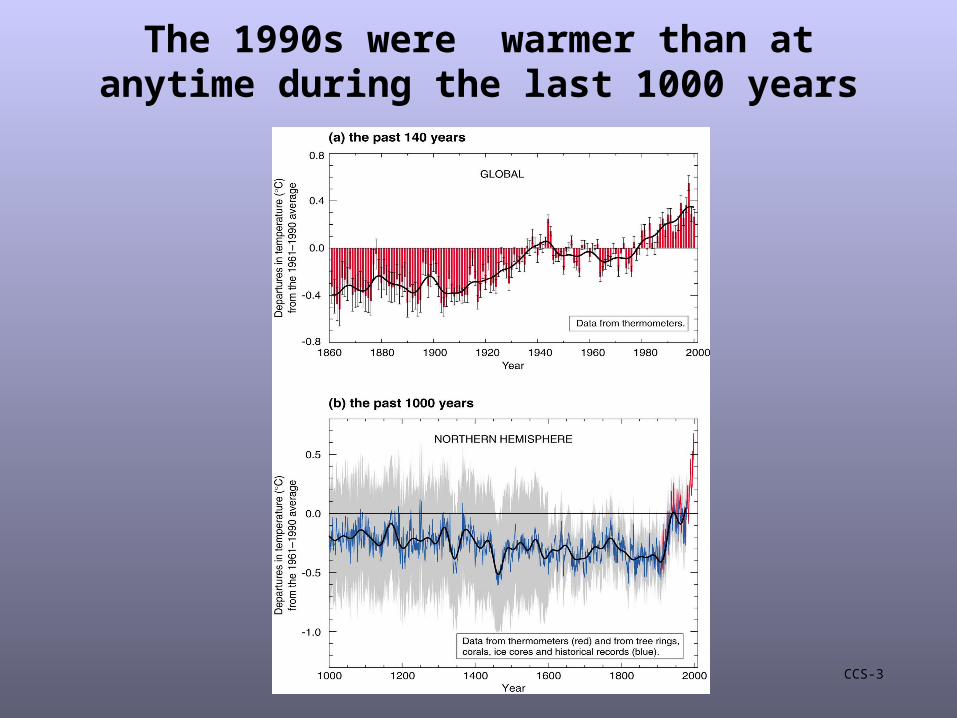
The 1990s were warmer than at anytime during the last 1000 years
CCS-3
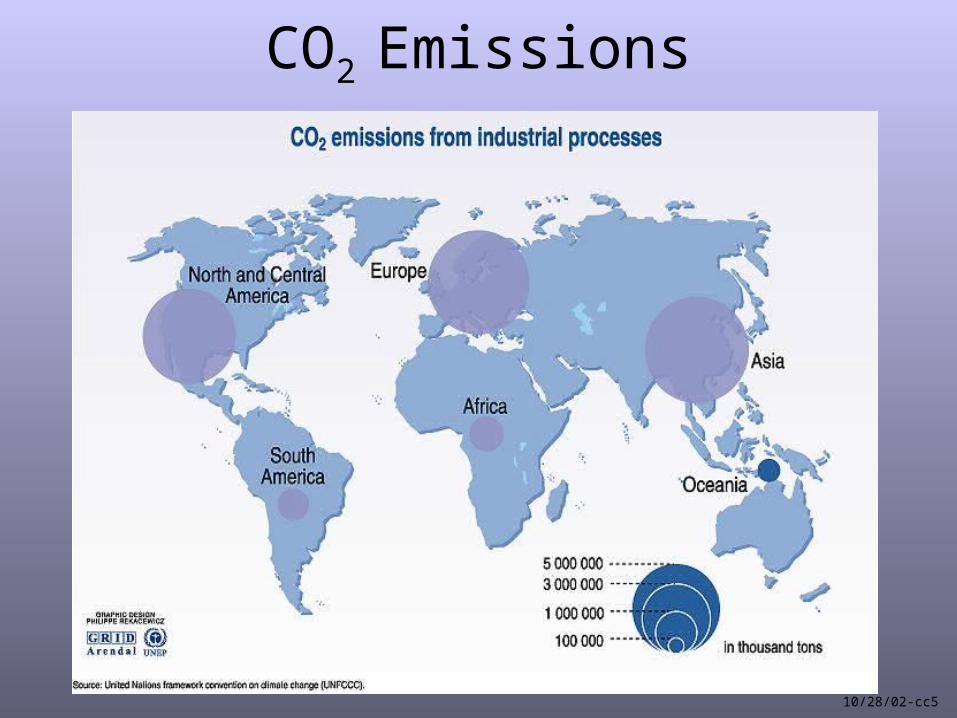
CO2 Emissions
10/28/02-cc5
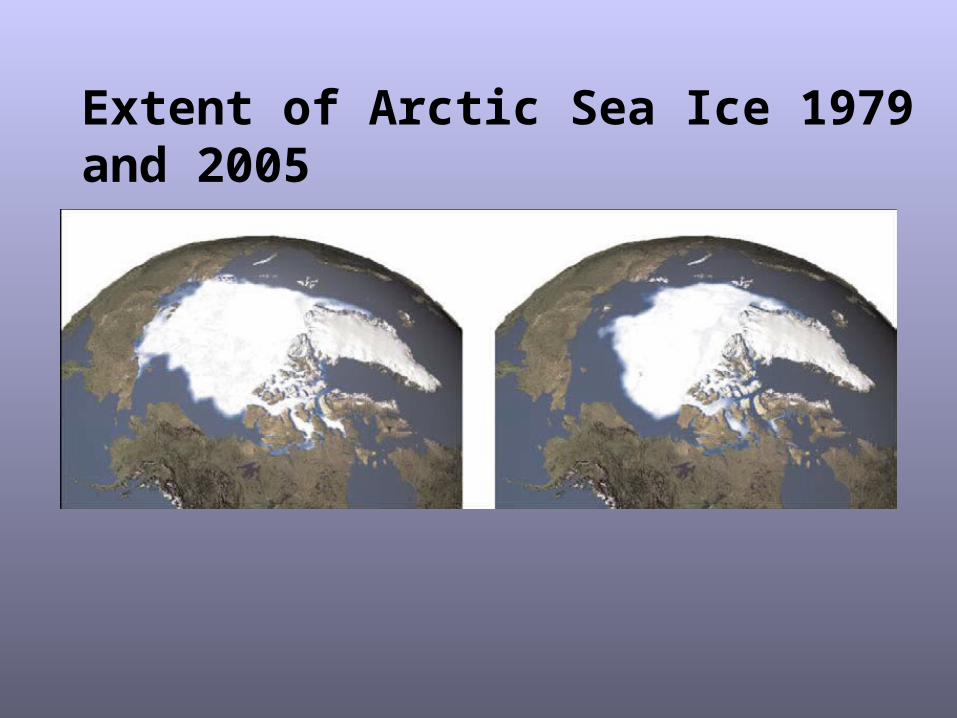
Extent of Arctic Sea Ice 1979 and 2005
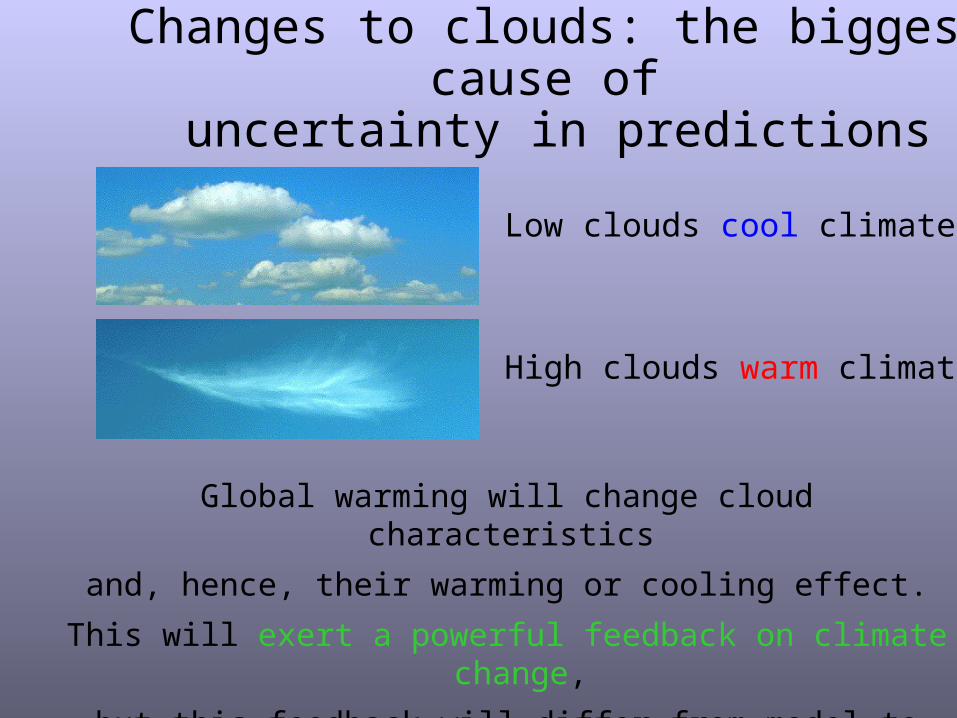
Changes to clouds: the biggest cause of uncertainty in predictions
Low clouds cool climate
High clouds warm climate
Global warming will change cloud characteristics
and, hence, their warming or cooling effect.
This will exert a powerful feedback on climate change,
but this feedback will differ from model to model.
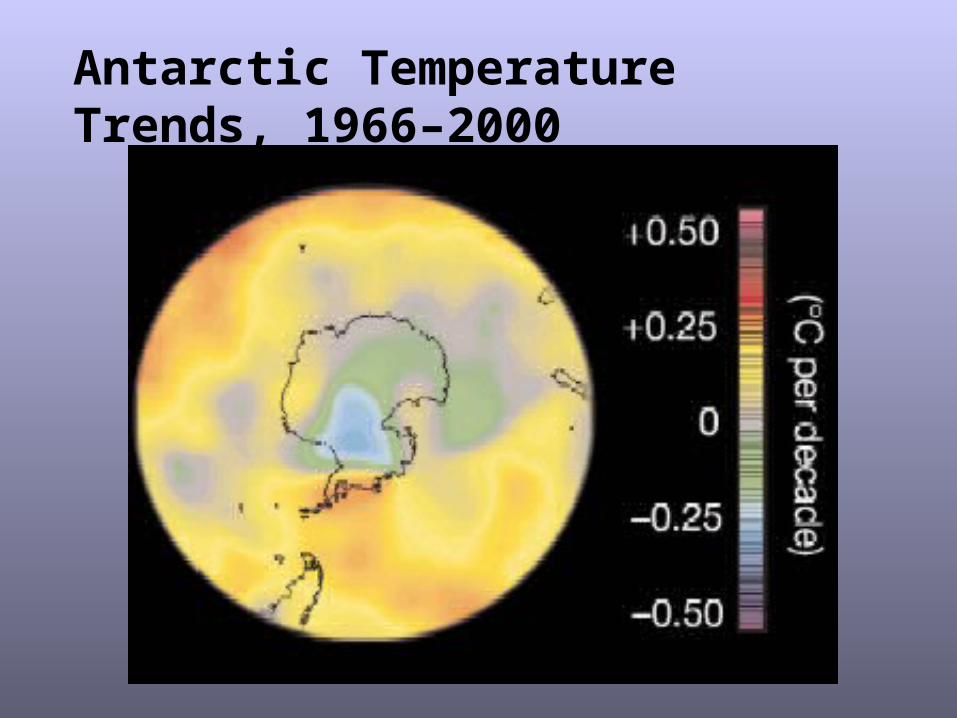
Antarctic Temperature Trends, 1966–2000
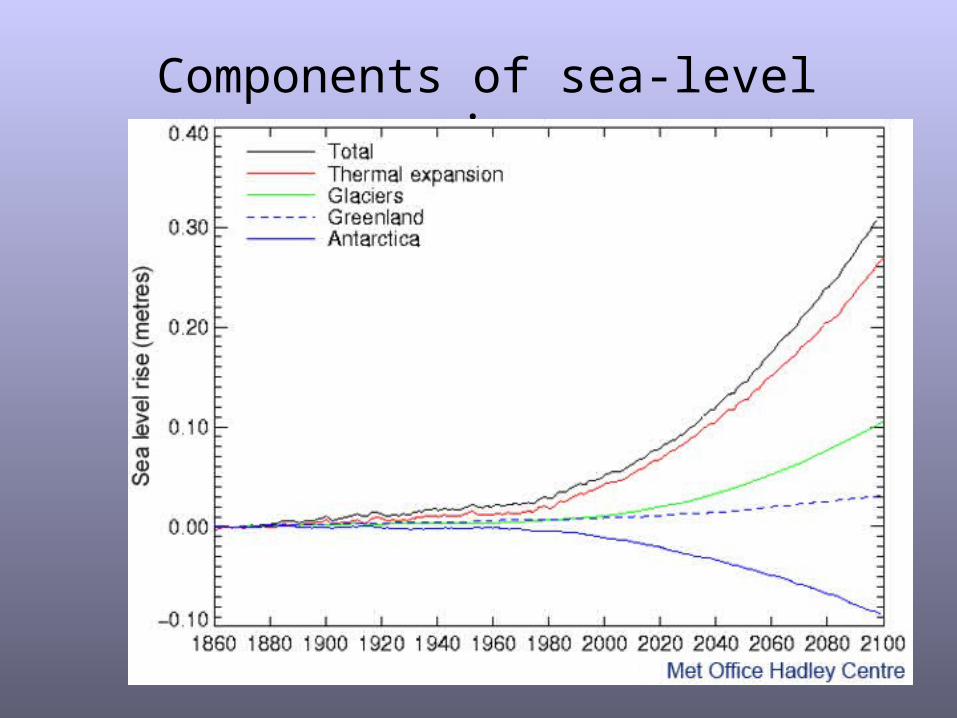
Components of sea-level rise
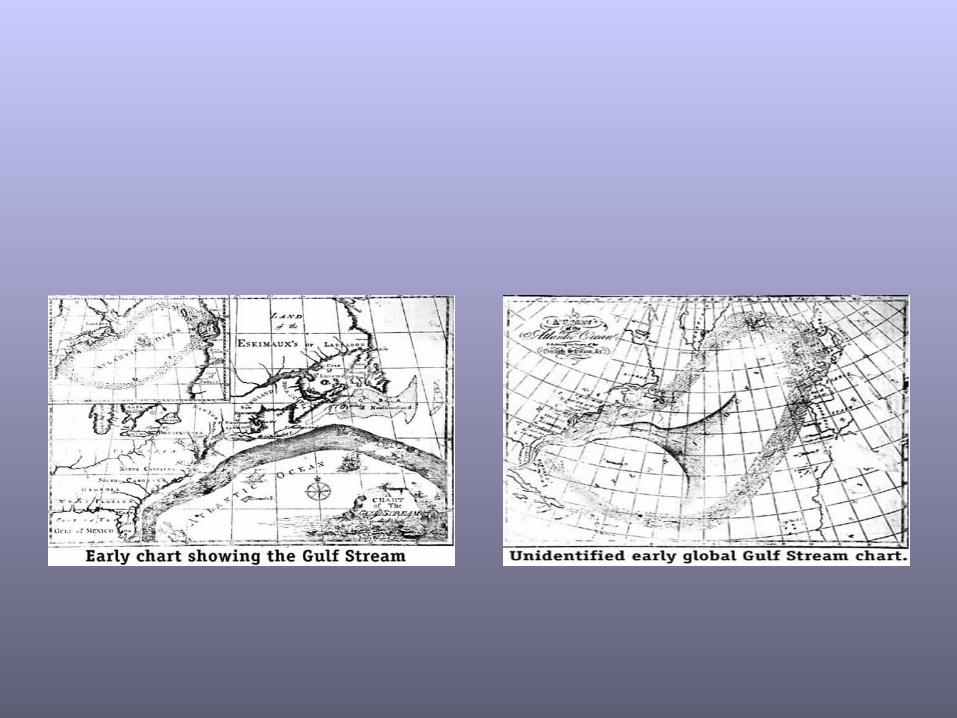
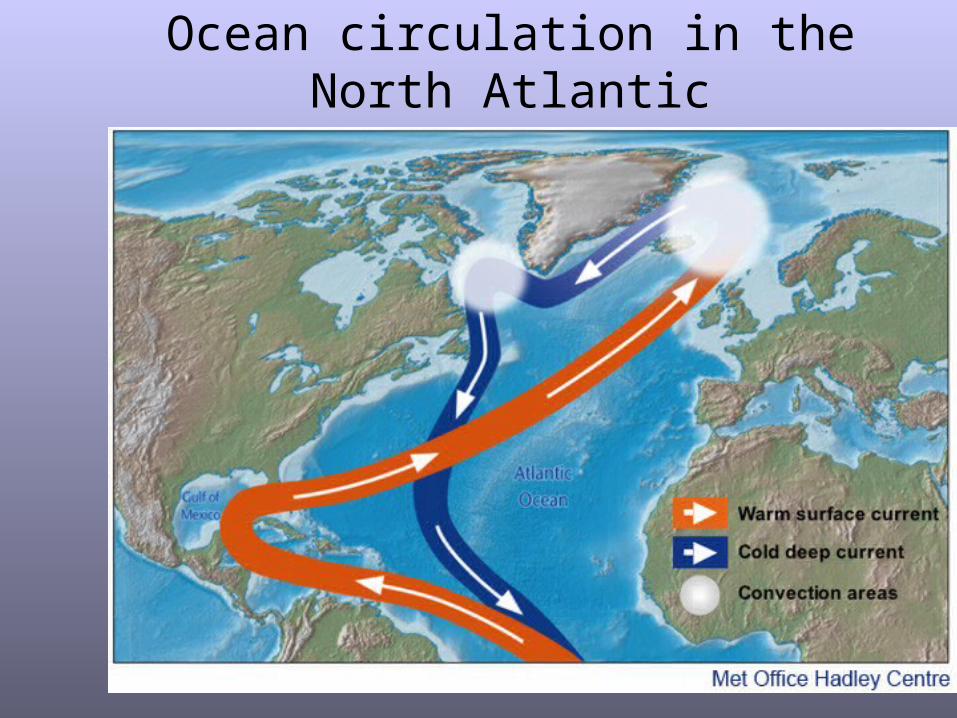
Ocean circulation in the North Atlantic
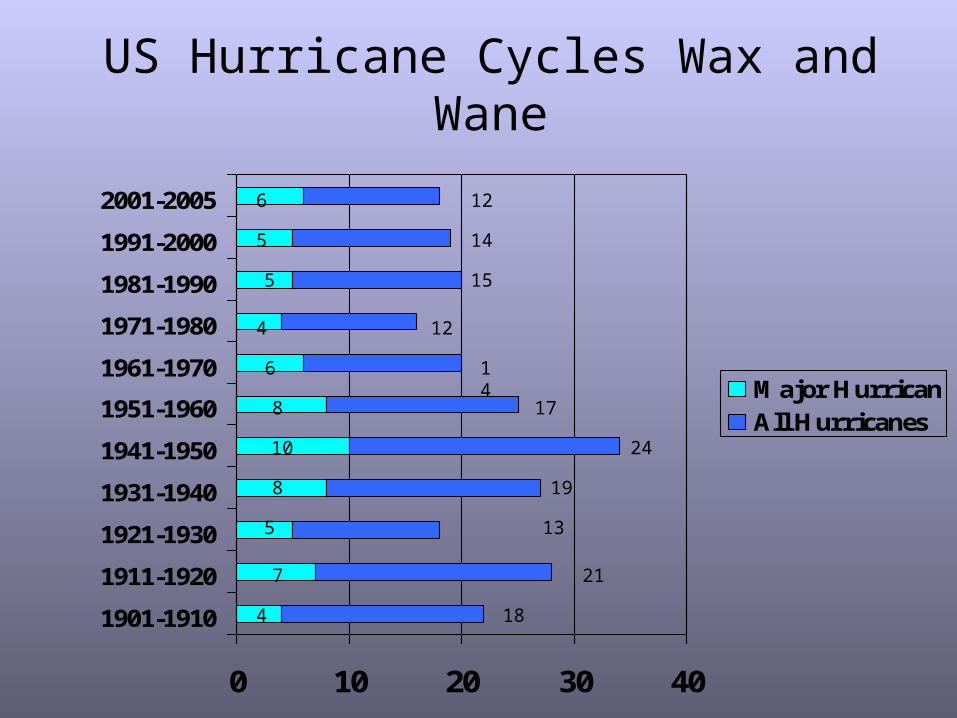
0 10 20 30 40
1901-1910
1911-1920
1921-1930
1931-1940
1941-1950
1951-1960
1961-1970
1971-1980
1981-1990
1991-2000
2001-2005
Major HurricanAll Hurricanes
US Hurricane Cycles Wax and Wane
4 18
7 21
5 13
8 19
10 24
8 17
6 14
4 12
5 15
5 14
6 12
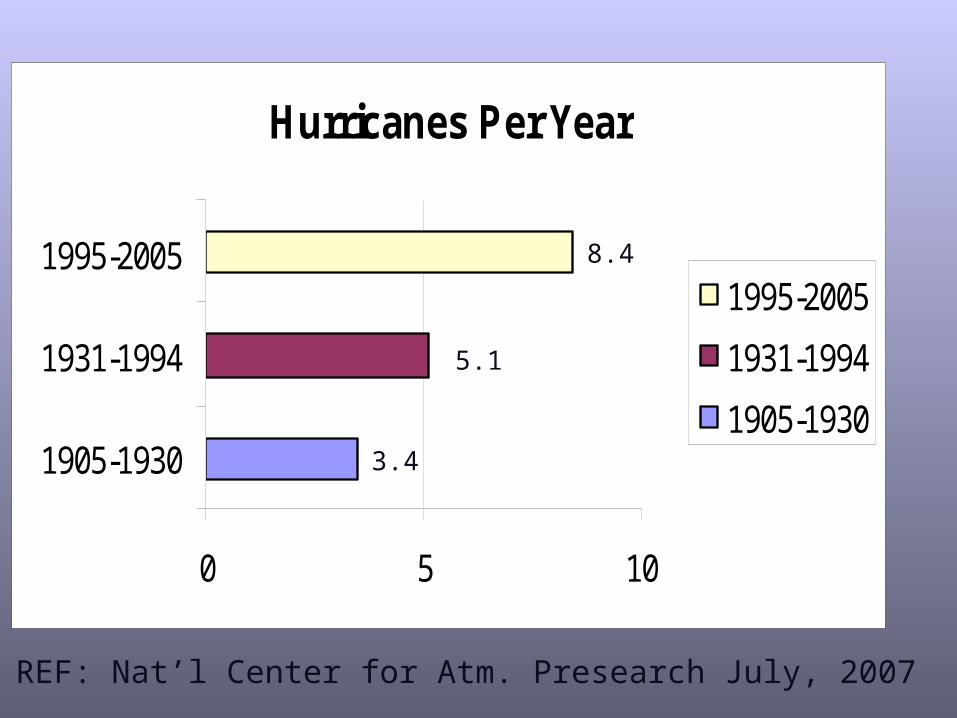
Hurricanes Per Year
0 5 10
1905-1930
1931-1994
1995-20051995-2005
1931-1994
1905-1930
REF: Nat’l Center for Atm. Presearch July, 2007
8.4
5.1
3.4
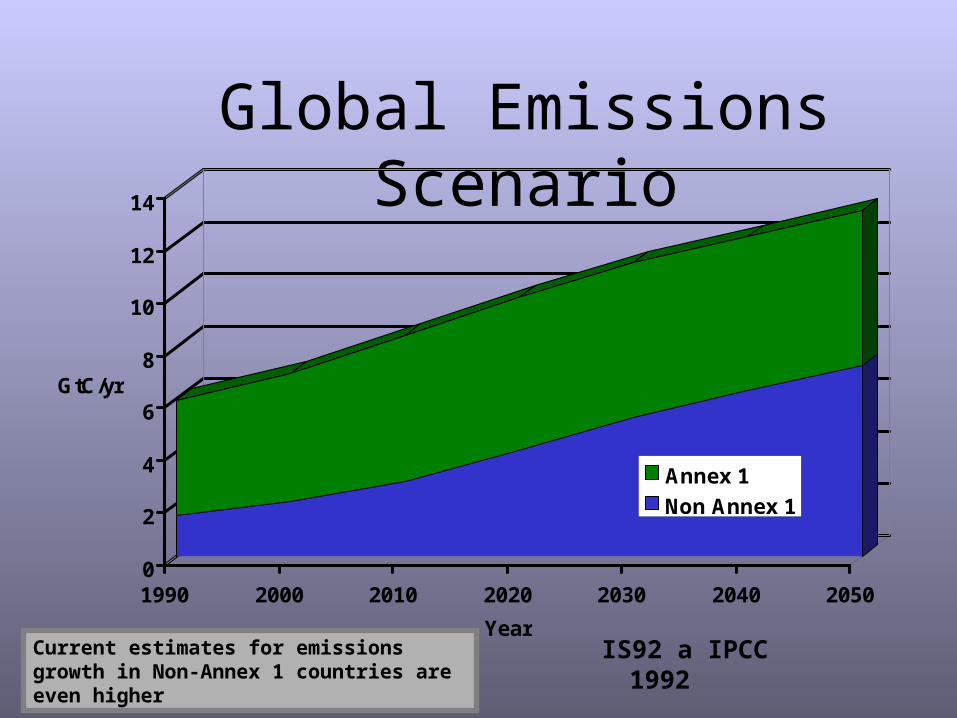
Global Emissions Scenario
IS92 a IPCC 1992
0
2
4
6
8
10
12
14
GtC/yr
1990 2000 2010 2020 2030 2040 2050
Year
Annex 1
Non Annex 1
Current estimates for emissions growth in Non-Annex 1 countries are even higher
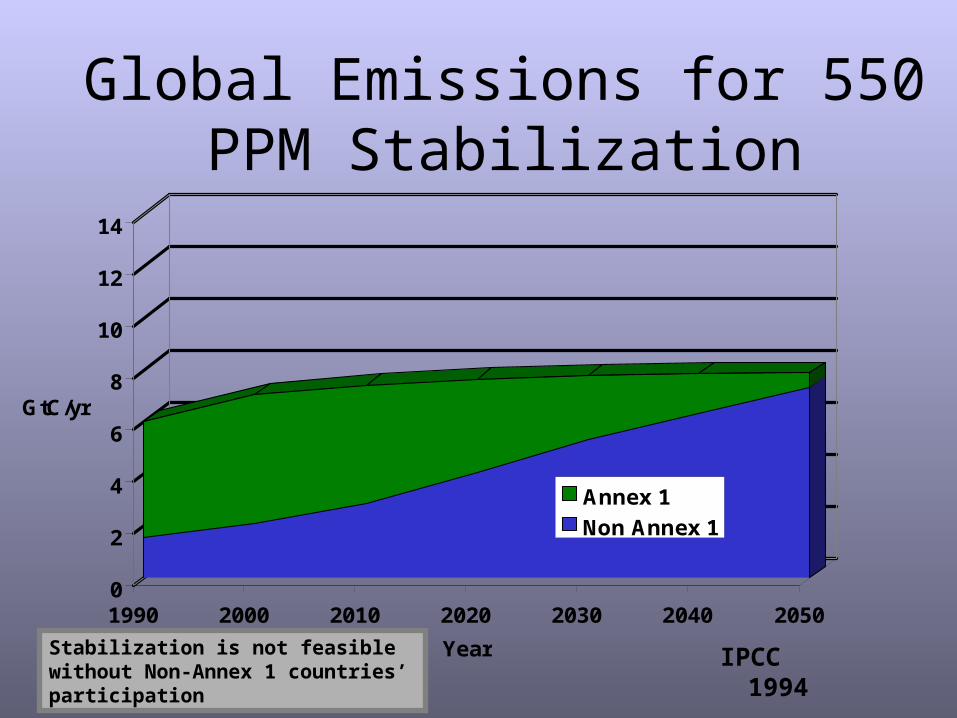
Global Emissions for 550 PPM Stabilization
IPCC 1994
0
2
4
6
8
10
12
14
GtC/yr
1990 2000 2010 2020 2030 2040 2050
Year
Annex 1
Non Annex 1
Stabilization is not feasible without Non-Annex 1 countries’ participation
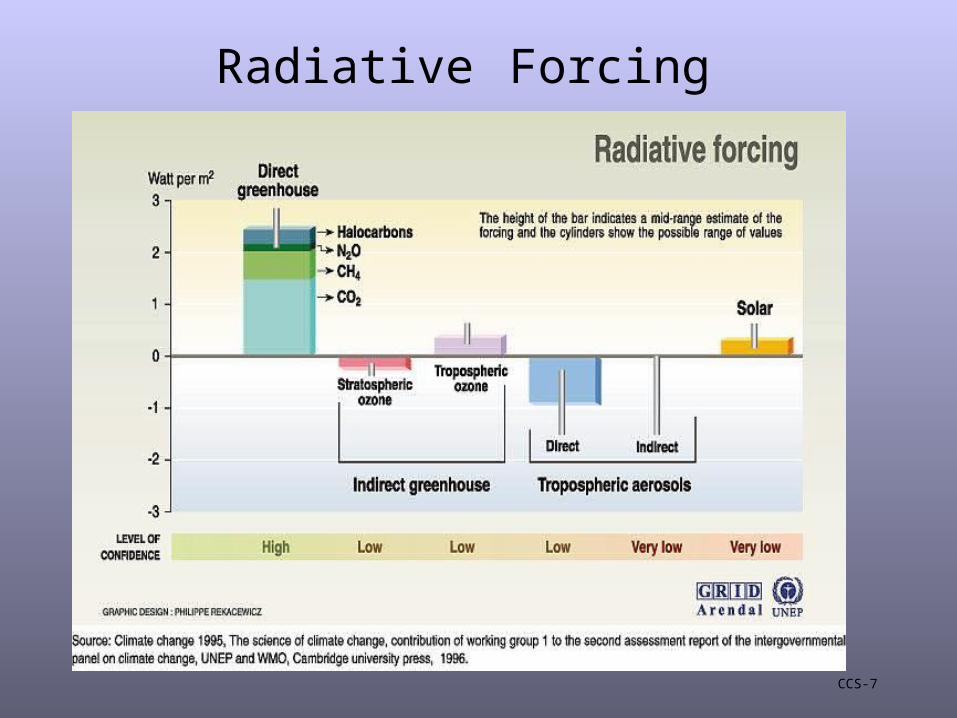
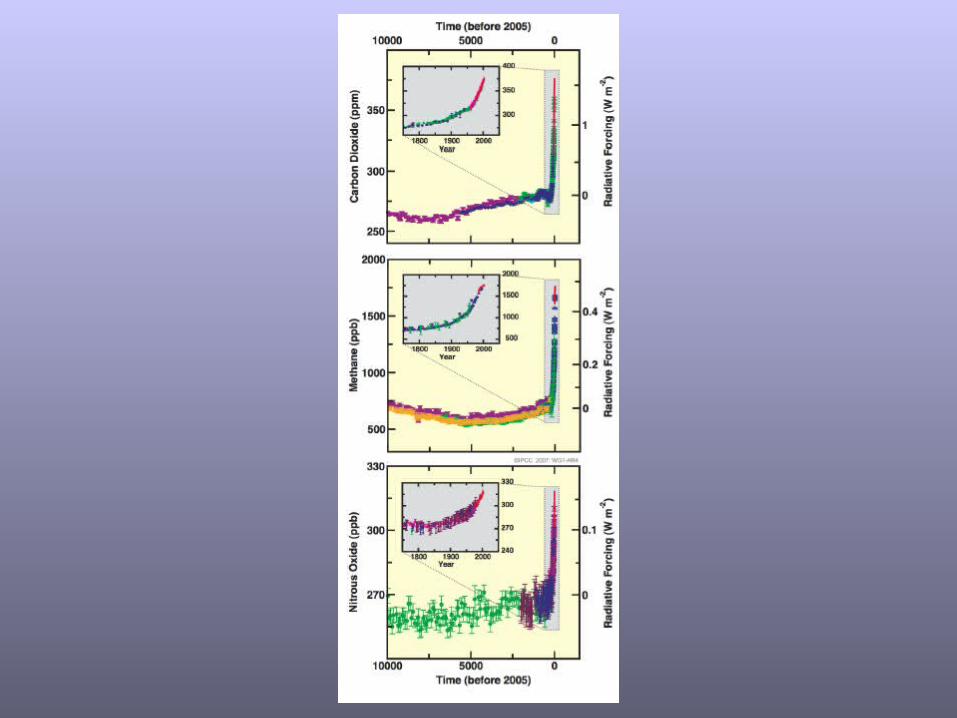
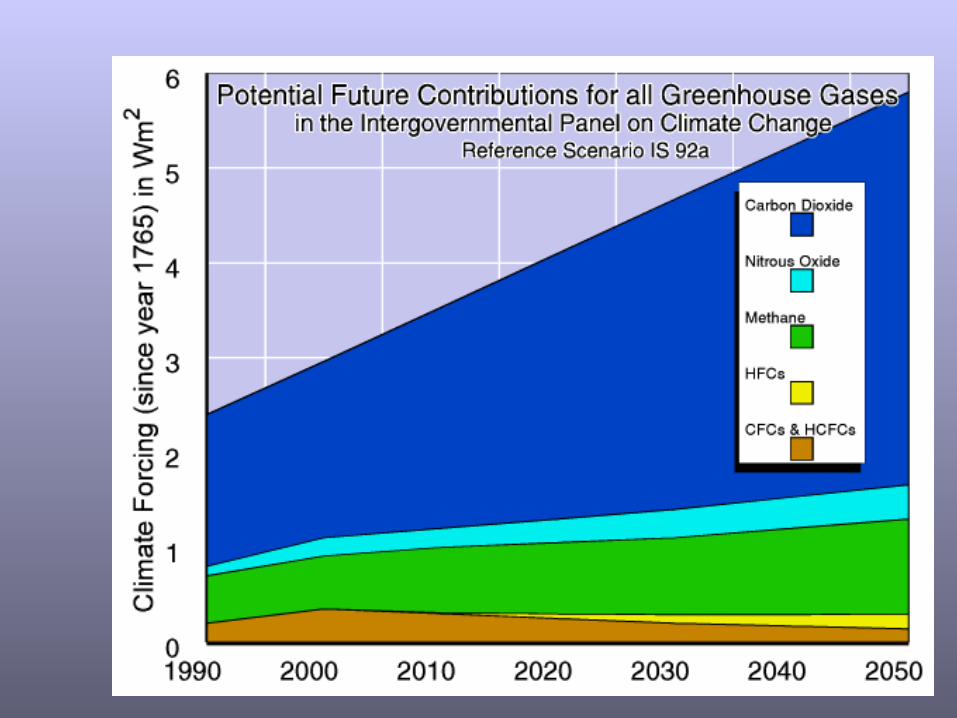
Radiative Forcing
CCS-7
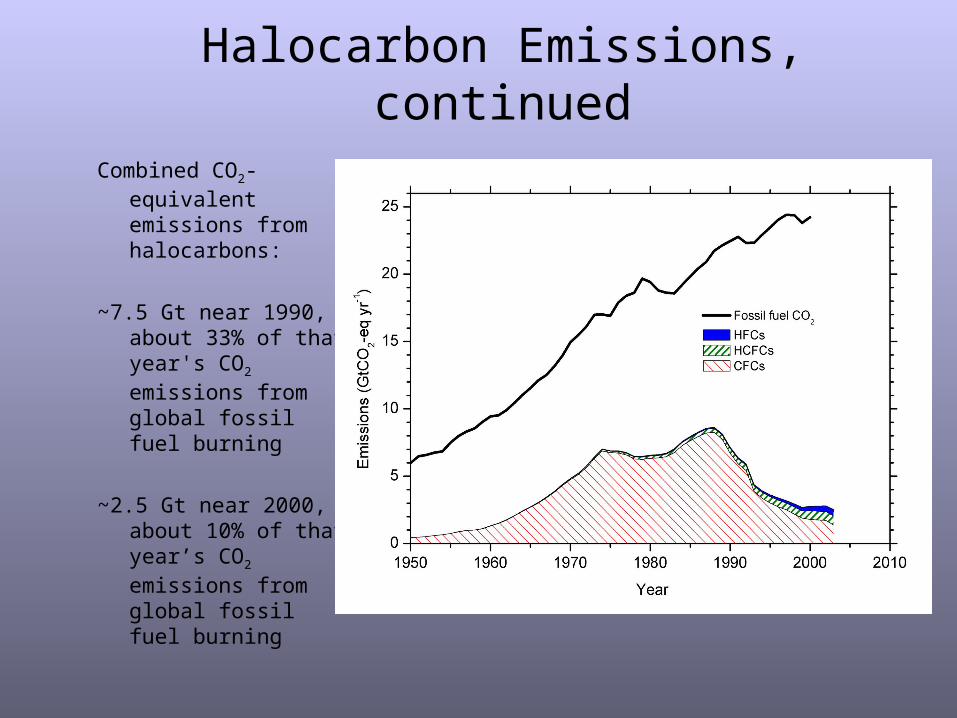
Halocarbon Emissions, continued
Combined CO2-equivalent emissions from halocarbons:
~7.5 Gt near 1990, about 33% of that year's CO2 emissions from global fossil fuel burning
~2.5 Gt near 2000, about 10% of that year’s CO2 emissions from global fossil fuel burning
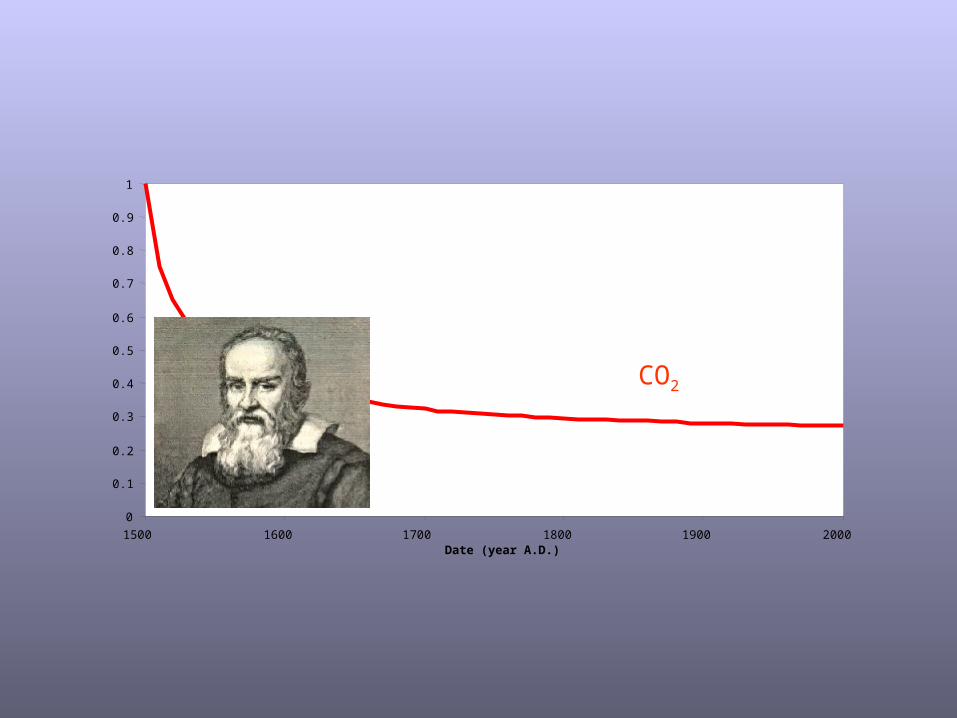
0
0.1
0.2
0.3
0.4
0.5
0.6
0.7
0.8
0.9
1
1500 1600 1700 1800 1900 2000 Date (year A.D.)
CO2
0
0.1
0.2
0.3
0.4
0.5
0.6
0.7
0.8
0.9
1
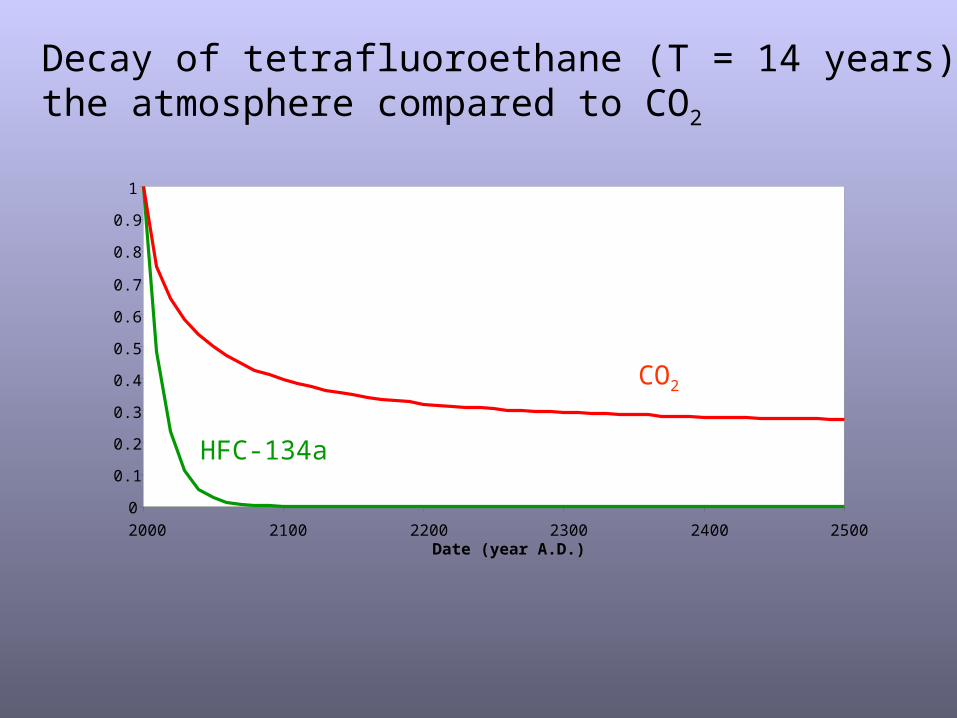
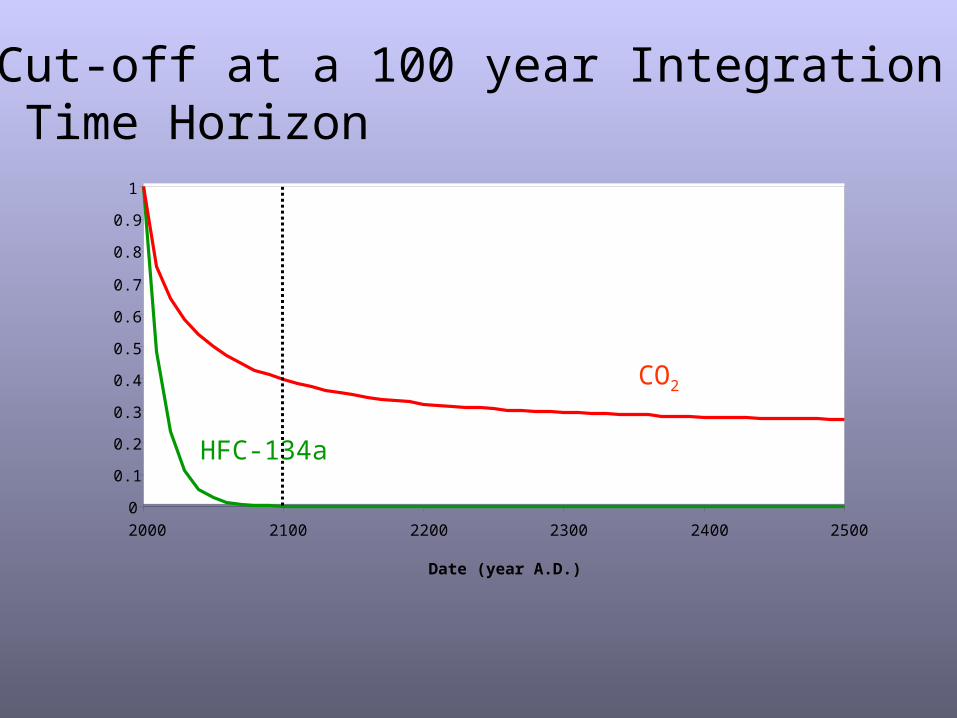
2000 2100 2200 2300 2400 2500 Date (year A.D.)
HFC-134a
CO2
Decay of tetrafluoroethane (T = 14 years) inthe atmosphere compared to CO2
0
0.1
0.2
0.3
0.4
0.5
0.6
0.7
0.8
0.9
1
2000 2100 2200 2300 2400 2500
Date (year A.D.)
HFC-134a
CO2
Cut-off at a 100 year Integration Time Horizon
Climate Change International
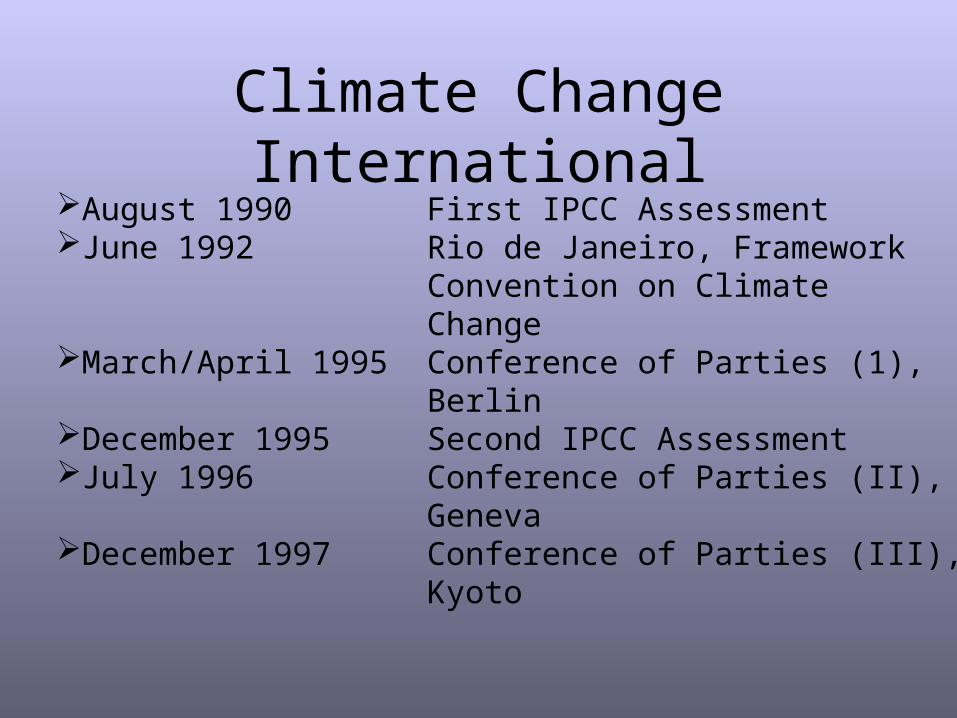
Climate Change InternationalAugust 1990June 1992
March/April 1995
December 1995July 1996
December 1997
First IPCC AssessmentRio de Janeiro, FrameworkConvention on ClimateChangeConference of Parties (1),BerlinSecond IPCC AssessmentConference of Parties (II),GenevaConference of Parties (III),Kyoto
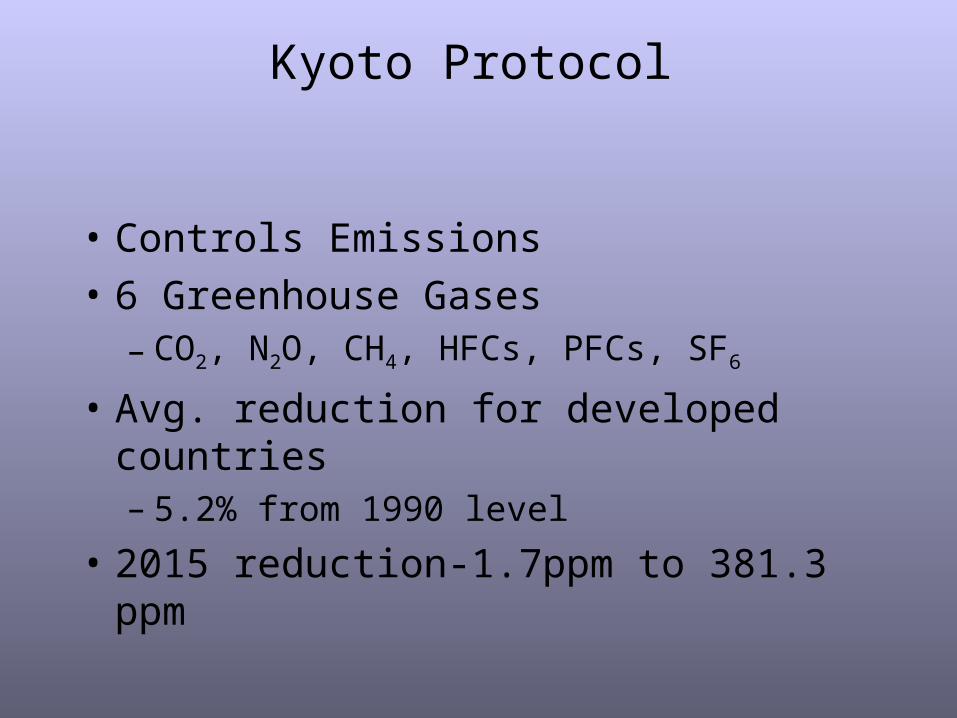
Kyoto Protocol
• Controls Emissions
• 6 Greenhouse Gases– CO2, N2O, CH4, HFCs, PFCs, SF6
• Avg. reduction for developed countries– 5.2% from 1990 level
• 2015 reduction-1.7ppm to 381.3 ppm
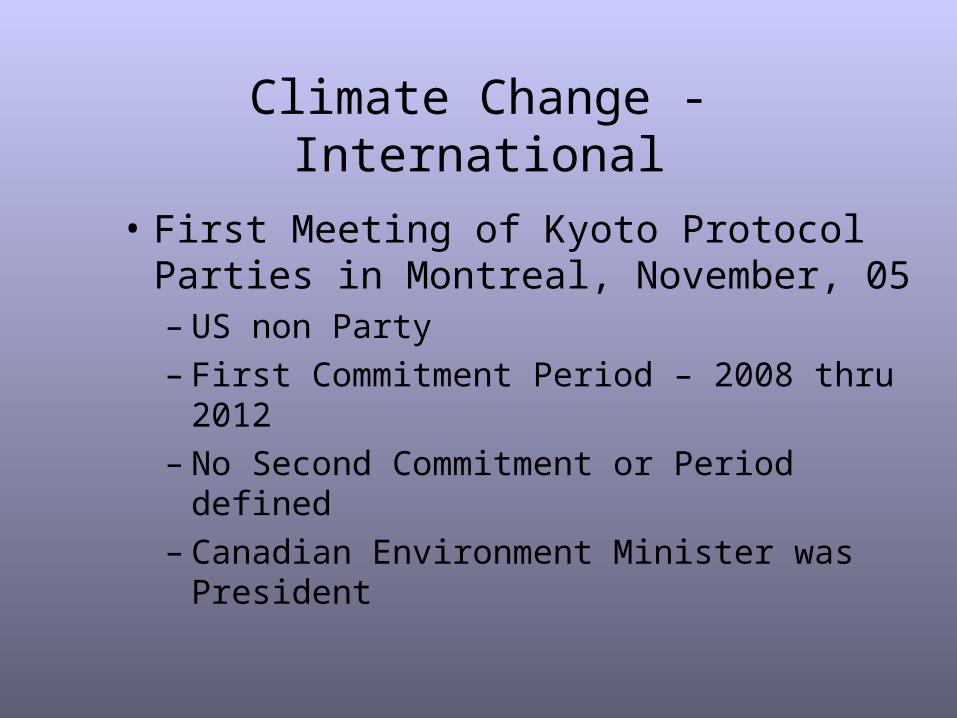
Climate Change - International
• First Meeting of Kyoto Protocol Parties in Montreal, November, 05– US non Party– First Commitment Period – 2008 thru 2012– No Second Commitment or Period defined– Canadian Environment Minister was President
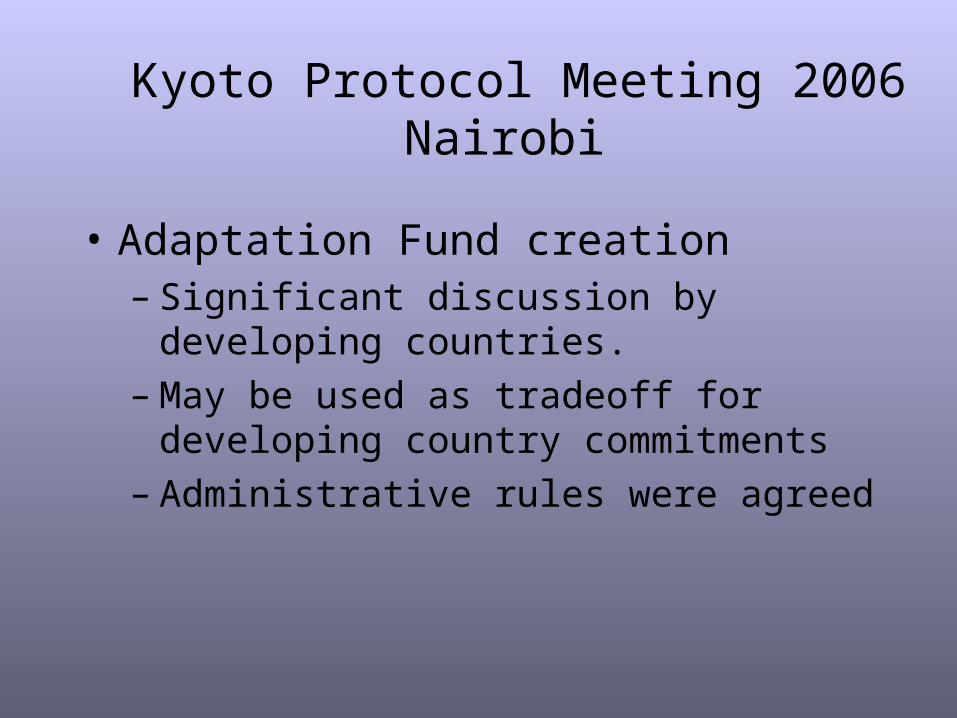
Kyoto Protocol Meeting 2006 Nairobi
• Adaptation Fund creation– Significant discussion by developing countries. – May be used as tradeoff for developing country
commitments– Administrative rules were agreed
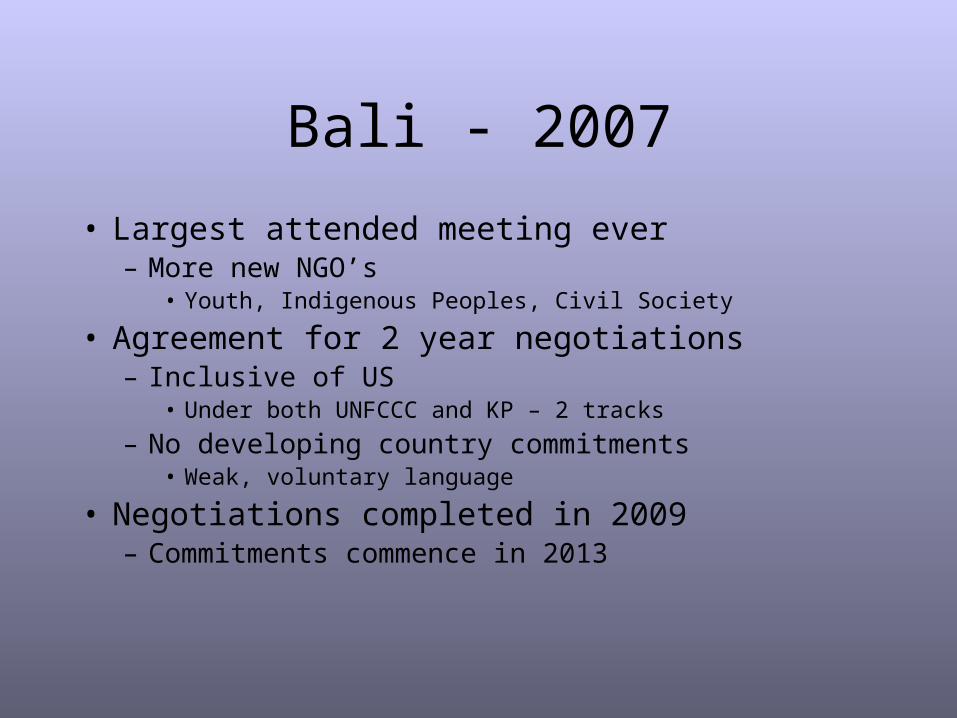
Bali - 2007
• Largest attended meeting ever– More new NGO’s
• Youth, Indigenous Peoples, Civil Society
• Agreement for 2 year negotiations– Inclusive of US
• Under both UNFCCC and KP – 2 tracks
– No developing country commitments• Weak, voluntary language
• Negotiations completed in 2009– Commitments commence in 2013
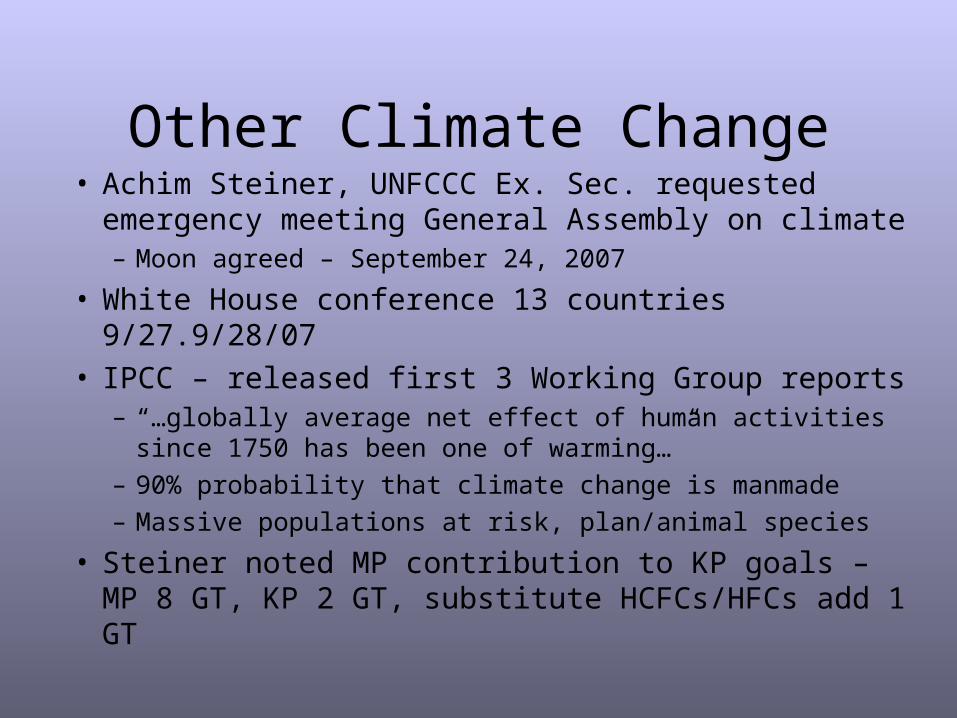
Other Climate Change• Achim Steiner, UNFCCC Ex. Sec. requested
emergency meeting General Assembly on climate– Moon agreed – September 24, 2007
• White House conference 13 countries 9/27.9/28/07• IPCC – released first 3 Working Group reports
– “…globally average net effect of human activities since 1750 has been one of warming…”
– 90% probability that climate change is manmade
– Massive populations at risk, plan/animal species
• Steiner noted MP contribution to KP goals – MP 8 GT, KP 2 GT, substitute HCFCs/HFCs add 1 GT
Other Climate Change
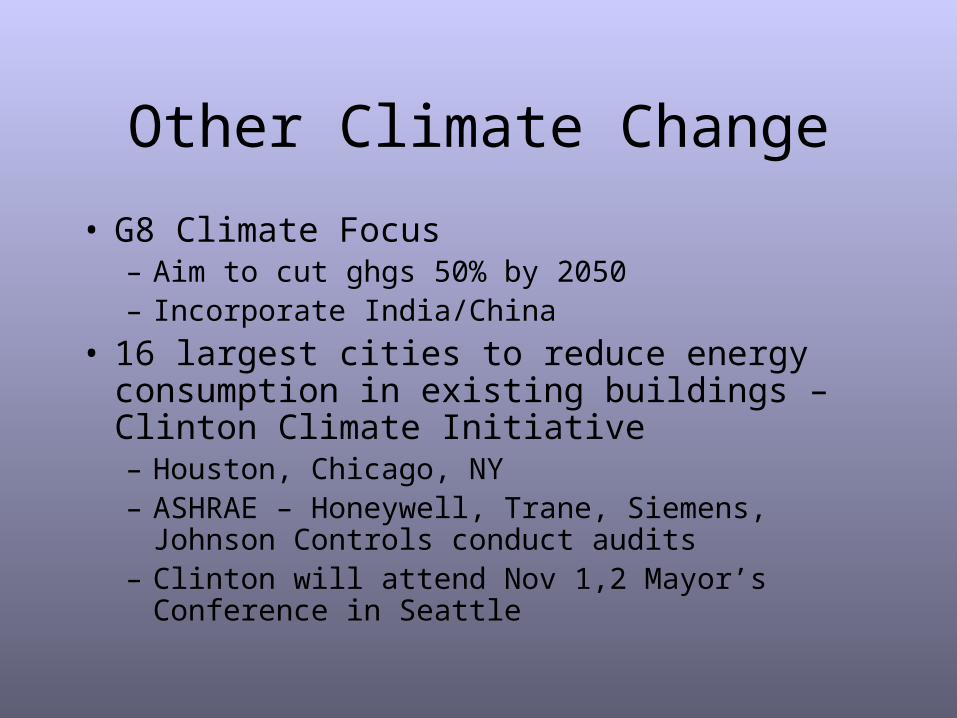
• G8 Climate Focus– Aim to cut ghgs 50% by 2050– Incorporate India/China
• 16 largest cities to reduce energy consumption in existing buildings –Clinton Climate Initiative– Houston, Chicago, NY– ASHRAE – Honeywell, Trane, Siemens, Johnson
Controls conduct audits– Clinton will attend Nov 1,2 Mayor’s Conference in
Seattle
Country Climate Programs
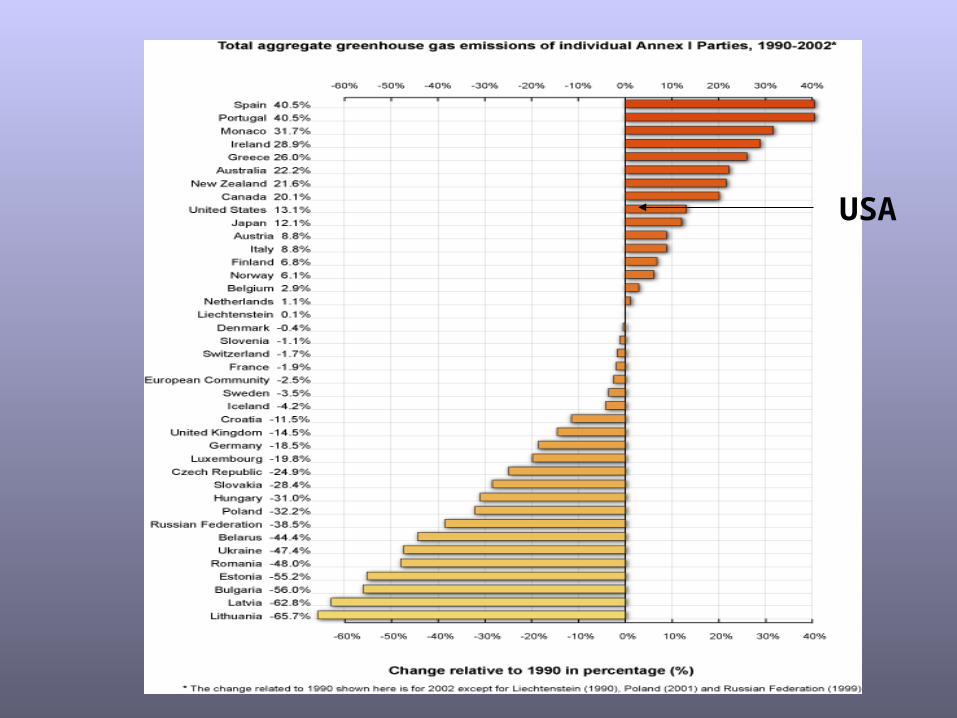
USA
EU F Gas Regulation
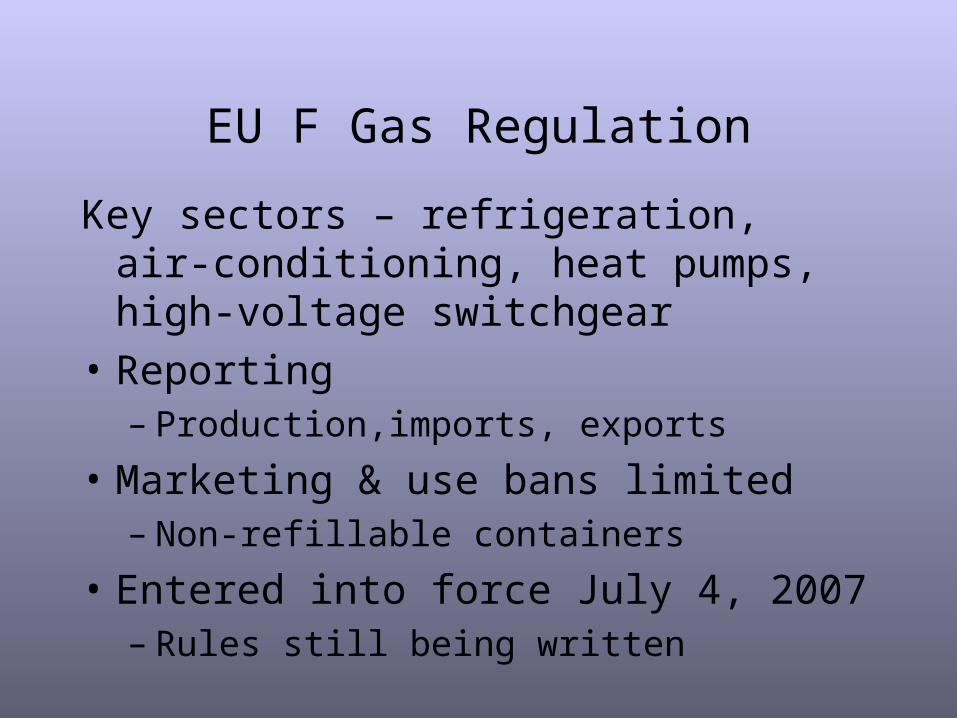
Key sectors – refrigeration, air-conditioning, heat pumps, high-voltage switchgear
• Reporting– Production,imports, exports
• Marketing & use bans limited– Non-refillable containers
• Entered into force July 4, 2007– Rules still being written
EU F Gas Regulation
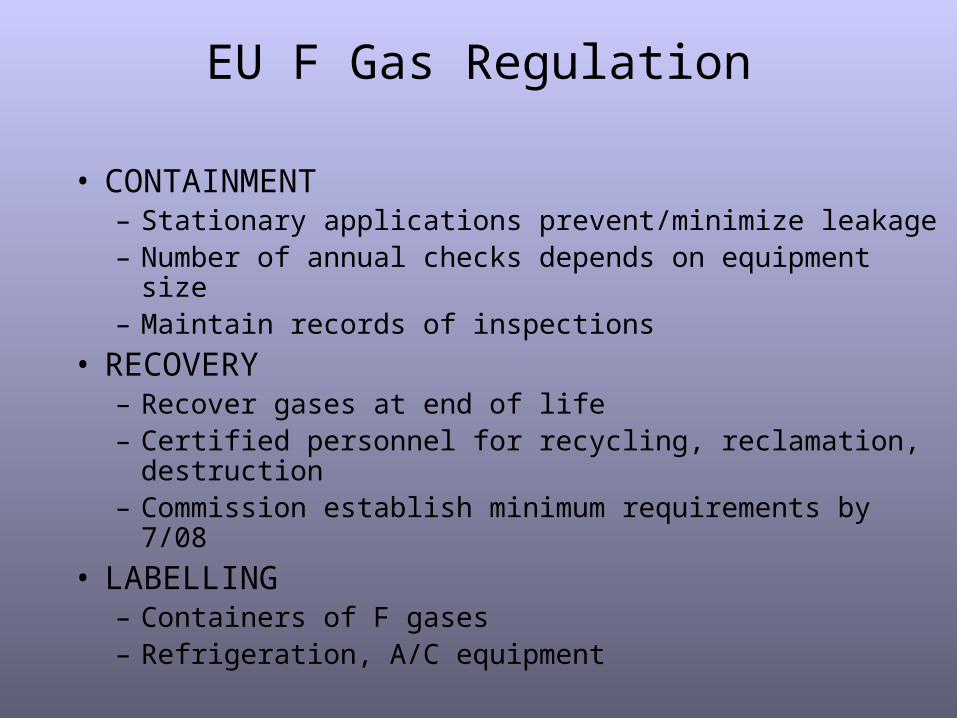
• CONTAINMENT– Stationary applications prevent/minimize leakage– Number of annual checks depends on equipment size– Maintain records of inspections
• RECOVERY– Recover gases at end of life– Certified personnel for recycling, reclamation, destruction– Commission establish minimum requirements by 7/08
• LABELLING– Containers of F gases– Refrigeration, A/C equipment
EU F Gas Regulation
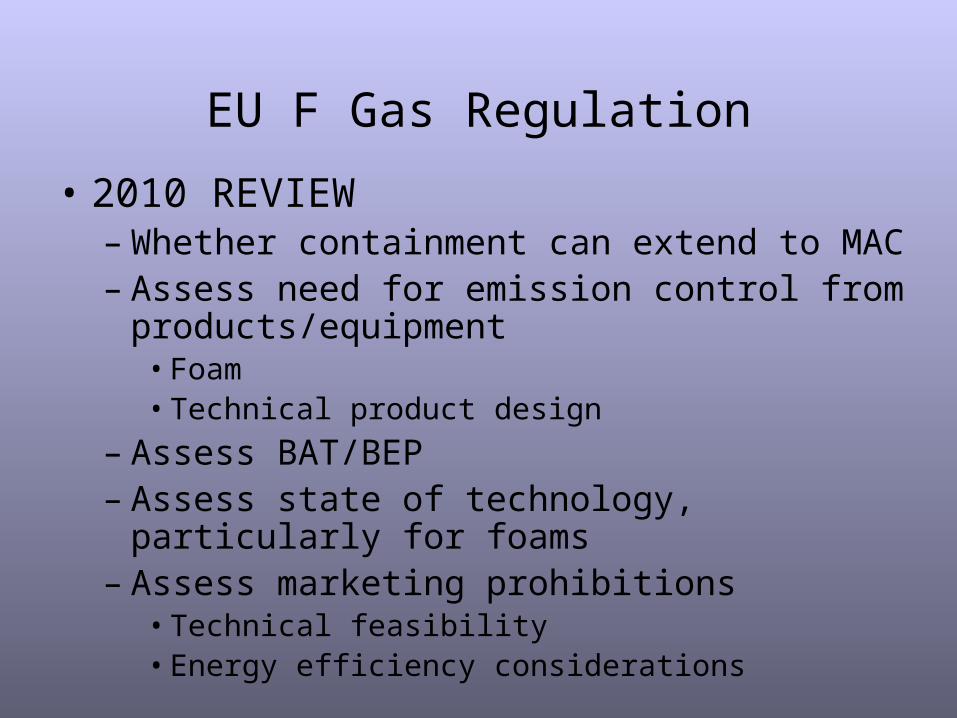
• 2010 REVIEW– Whether containment can extend to MAC– Assess need for emission control from
products/equipment• Foam • Technical product design
– Assess BAT/BEP– Assess state of technology, particularly for foams– Assess marketing prohibitions
• Technical feasibility• Energy efficiency considerations
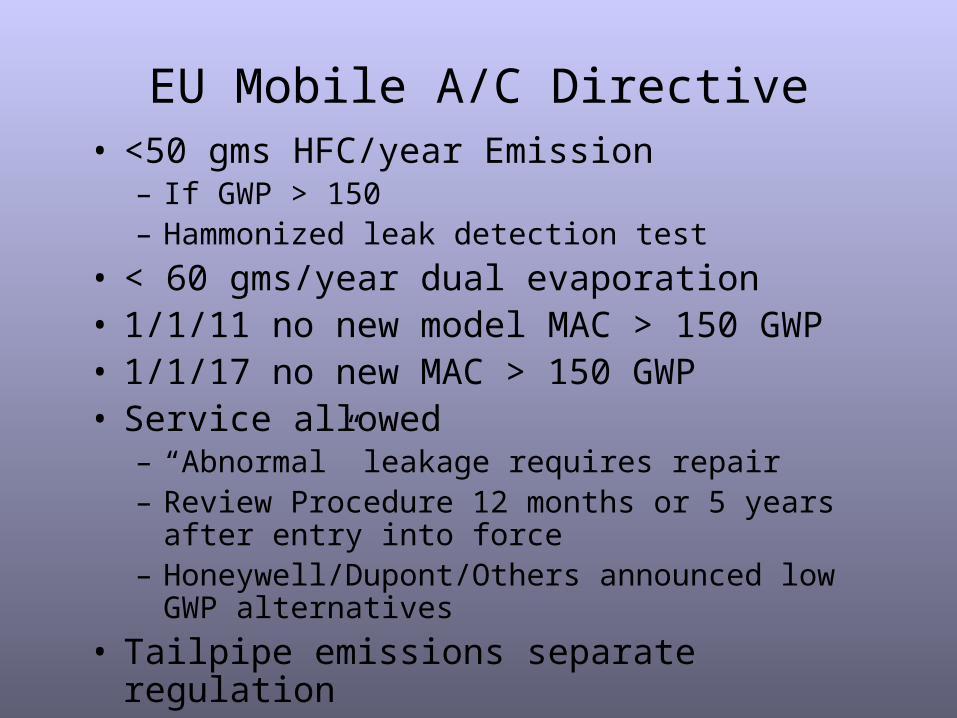
EU Mobile A/C Directive• <50 gms HFC/year Emission
– If GWP > 150– Hammonized leak detection test
• < 60 gms/year dual evaporation• 1/1/11 no new model MAC > 150 GWP• 1/1/17 no new MAC > 150 GWP• Service allowed
– “Abnormal” leakage requires repair– Review Procedure 12 months or 5 years after entry into
force– Honeywell/Dupont/Others announced low GWP
alternatives
• Tailpipe emissions separate regulation
EU Emissions Trading
2005-7 covers: energy, oil steel & paper
2008 covers all large emittersMS allocate individually
EU is bringing aviation into ETS.
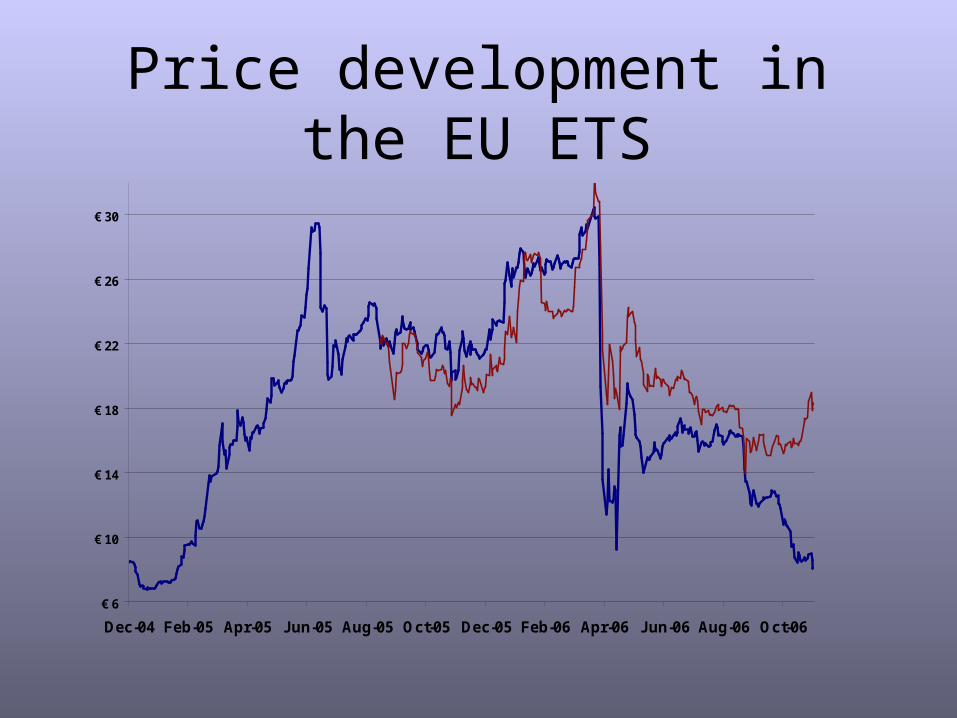
Price development in the EU ETS
€ 6
€ 10
€ 14
€ 18
€ 22
€ 26
€ 30
Dec-04 Feb-05 Apr-05 J un-05 Aug-05 Oct-05 Dec-05 Feb-06 Apr-06 J un-06 Aug-06 Oct-06
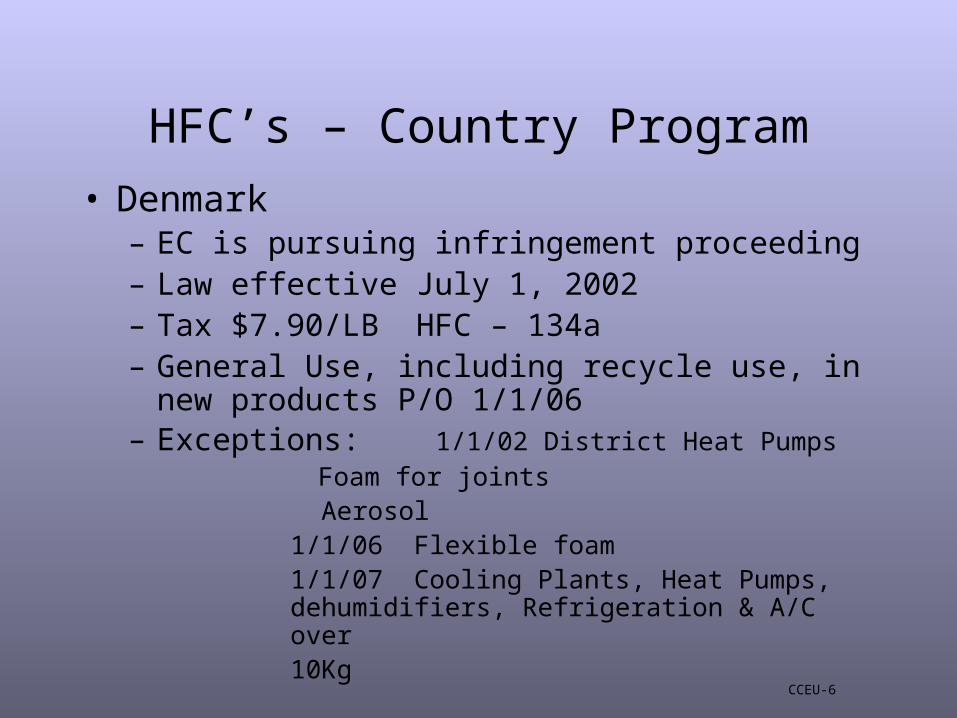
HFC’s – Country Program
• Denmark– EC is pursuing infringement proceeding– Law effective July 1, 2002– Tax $7.90/LB HFC – 134a– General Use, including recycle use, in new products
P/O 1/1/06– Exceptions: 1/1/02 District Heat Pumps
Foam for joints Aerosol
1/1/06 Flexible foam1/1/07 Cooling Plants,
Heat Pumps, dehumidifiers, Refrigeration & A/C over
10Kg CCEU-6
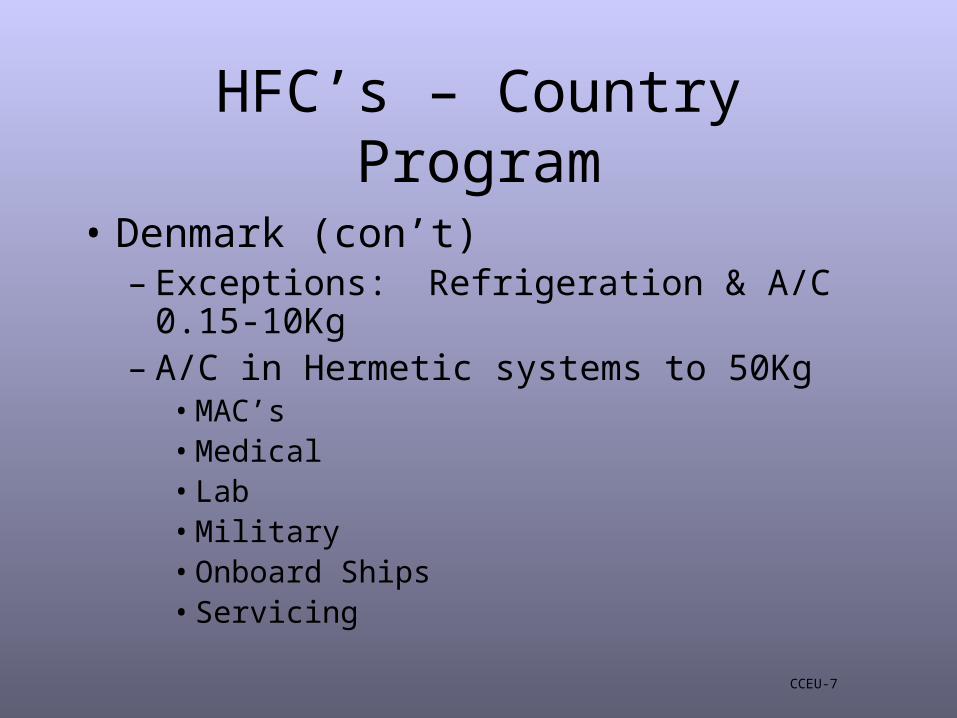
HFC’s – Country Program
• Denmark (con’t)– Exceptions: Refrigeration & A/C 0.15-10Kg– A/C in Hermetic systems to 50Kg
• MAC’s• Medical• Lab• Military• Onboard Ships• Servicing
CCEU-7
HFC’s Country Programmes
• Norway– 180 NKr per ton CO2 equivalent
– Norwegian Industry Attempted to Overturn• Got Agreement as “Deposit”
CCEU-9
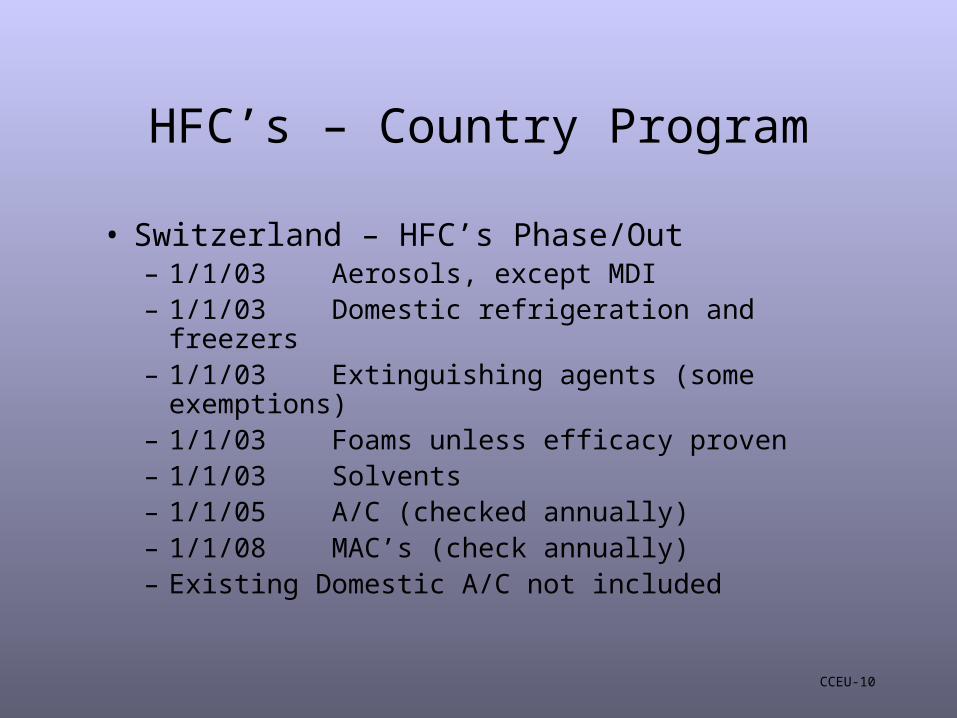
HFC’s – Country Program
• Switzerland – HFC’s Phase/Out– 1/1/03 Aerosols, except MDI– 1/1/03 Domestic refrigeration and freezers– 1/1/03 Extinguishing agents (some exemptions)– 1/1/03 Foams unless efficacy proven– 1/1/03 Solvents– 1/1/05 A/C (checked annually)– 1/1/08 MAC’s (check annually)– Existing Domestic A/C not included
CCEU-10
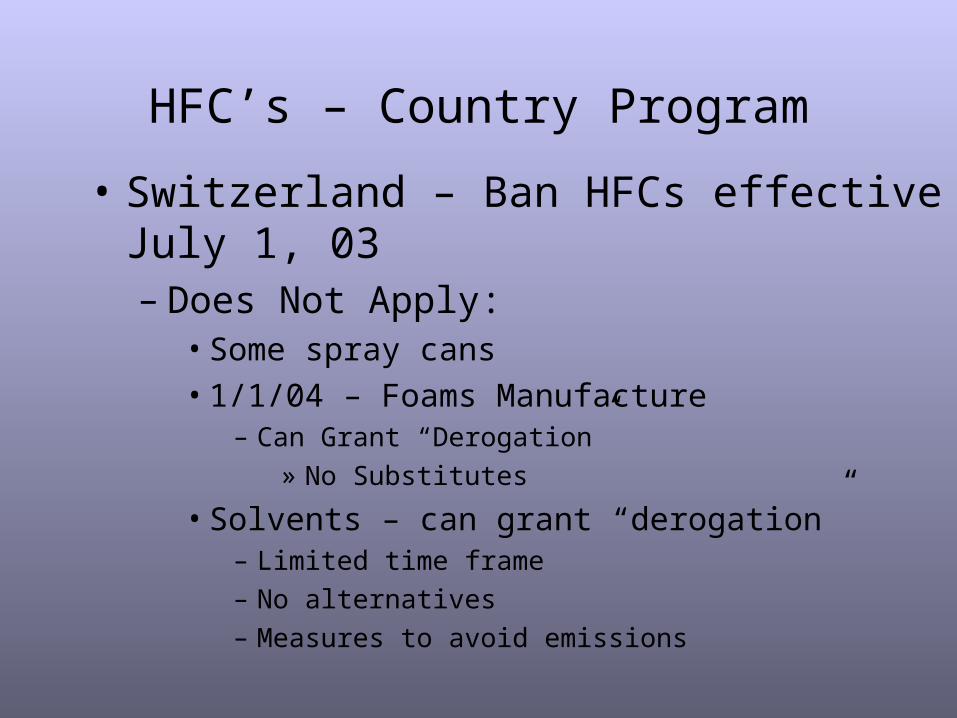
HFC’s – Country Program
• Switzerland – Ban HFCs effective July 1, 03– Does Not Apply:
• Some spray cans
• 1/1/04 – Foams Manufacture– Can Grant “Derogation”
» No Substitutes
• Solvents – can grant “derogation”– Limited time frame
– No alternatives
– Measures to avoid emissions
Canada
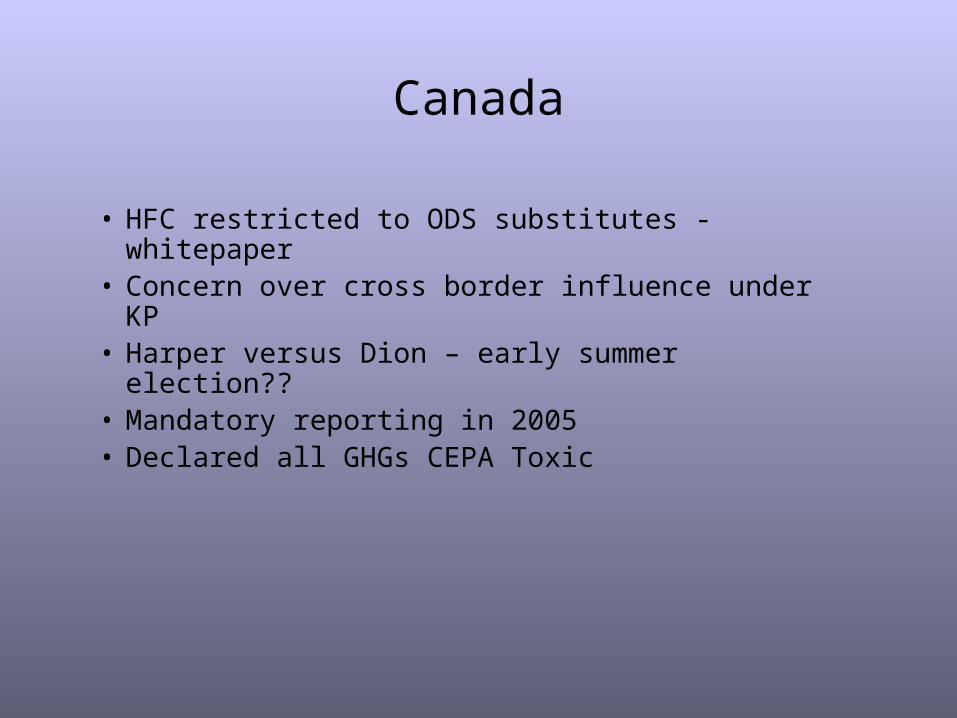
• HFC restricted to ODS substitutes - whitepaper• Concern over cross border influence under KP• Harper versus Dion – early summer election??• Mandatory reporting in 2005• Declared all GHGs CEPA Toxic
Canada
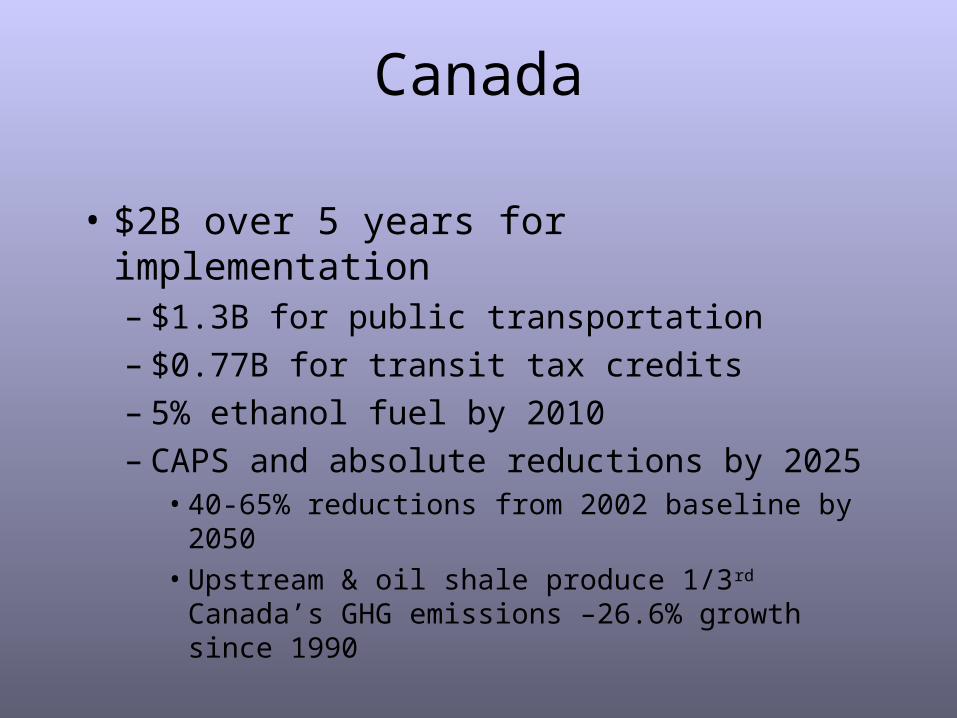
• $2B over 5 years for implementation– $1.3B for public transportation– $0.77B for transit tax credits– 5% ethanol fuel by 2010– CAPS and absolute reductions by 2025
• 40-65% reductions from 2002 baseline by 2050
• Upstream & oil shale produce 1/3rd Canada’s GHG emissions –26.6% growth since 1990
Canada
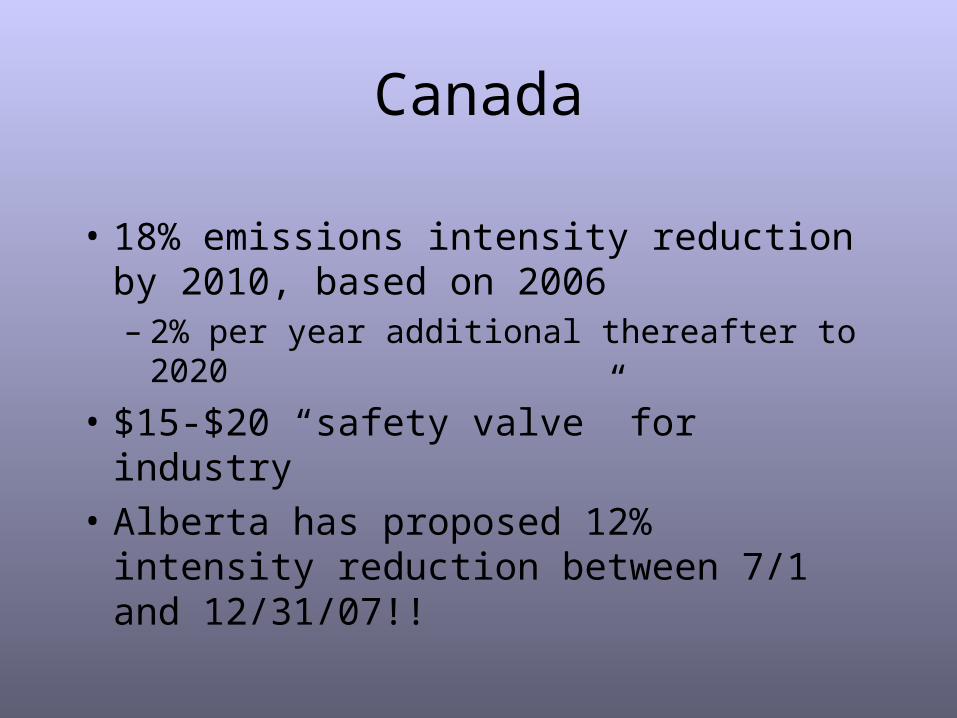
• 18% emissions intensity reduction by 2010, based on 2006– 2% per year additional thereafter to 2020
• $15-$20 “safety valve” for industry
• Alberta has proposed 12% intensity reduction between 7/1 and 12/31/07!!
Why not Kyoto?
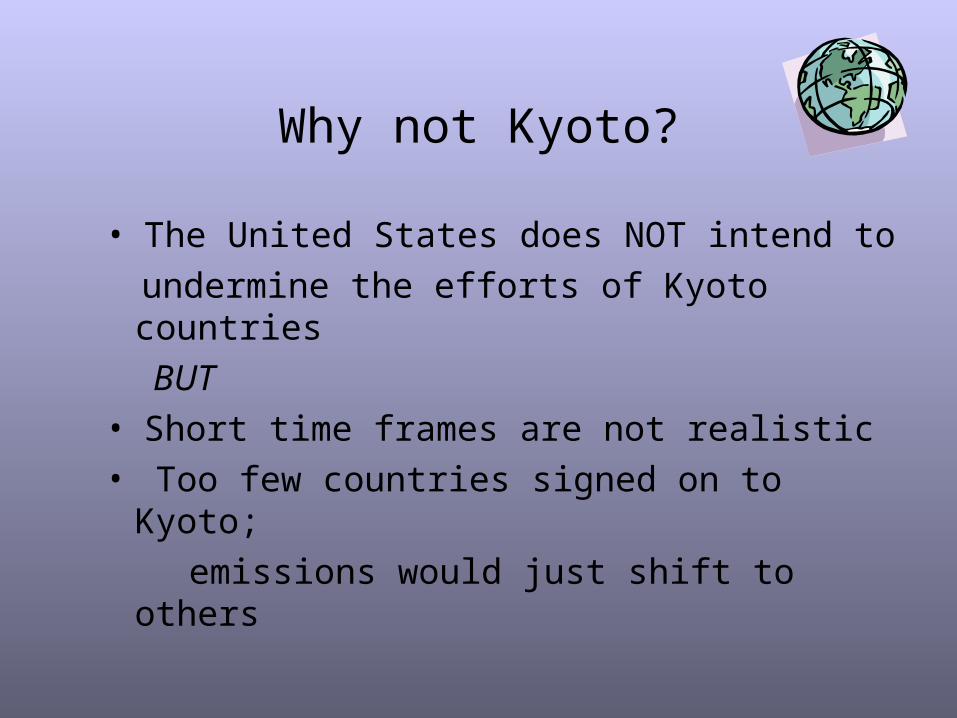
• The United States does NOT intend to
undermine the efforts of Kyoto countries
BUT
• Short time frames are not realistic
• Too few countries signed on to Kyoto;
emissions would just shift to others
• Climate change is a serious issue• It took decades to develop and may
take decades to address• Real, global environmental progress
requires economic growth
The key is to invest in cleaner,
more efficient technologies
What is the U.S. view?
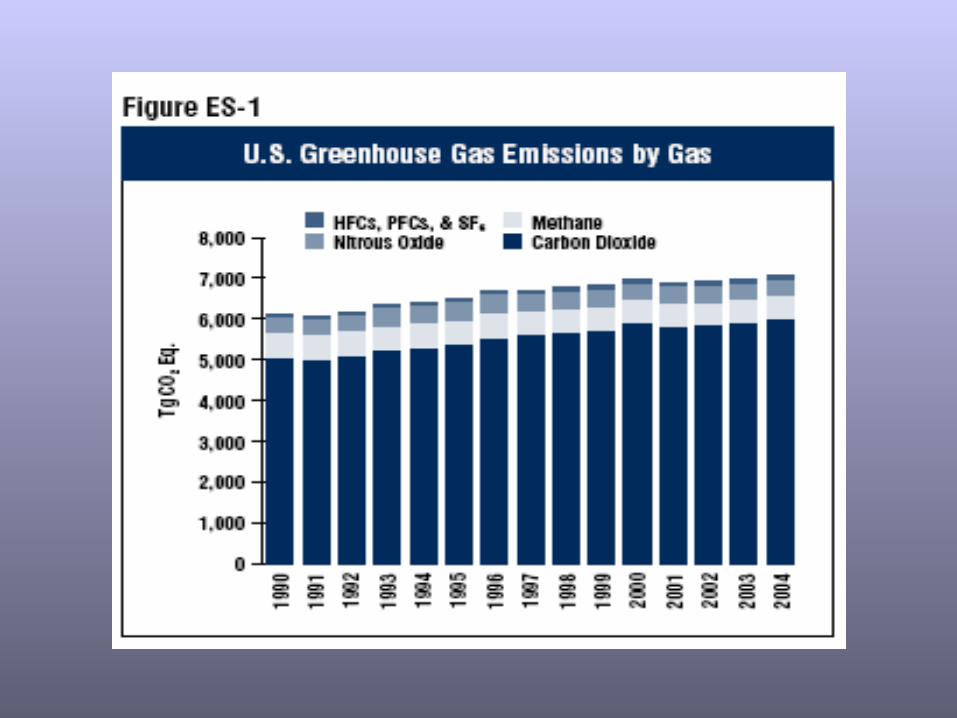
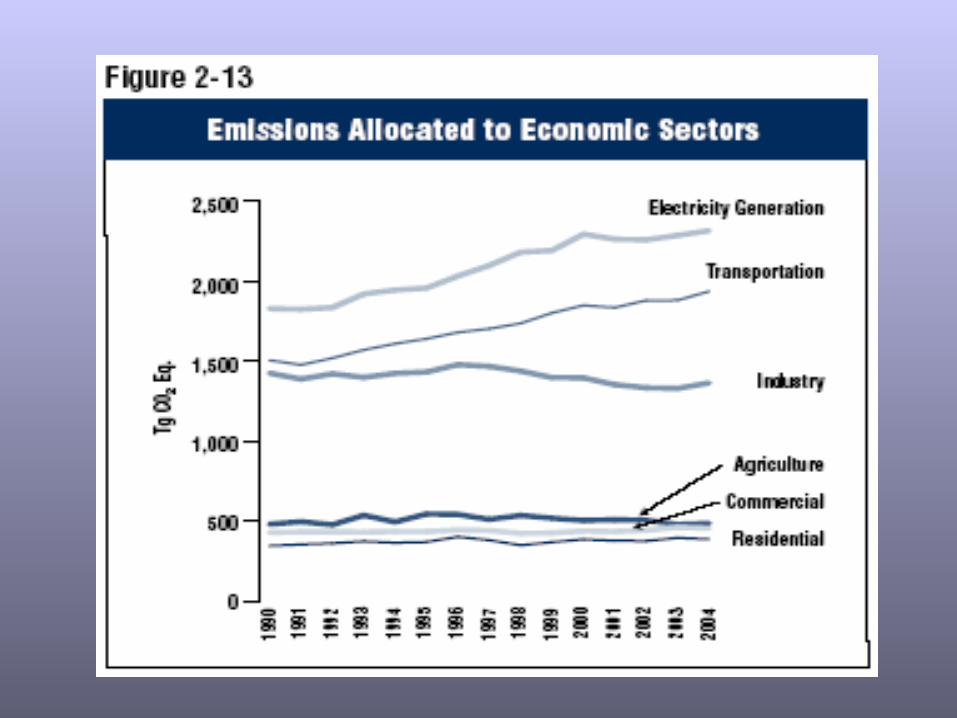
US Climate Change – 2006 emission
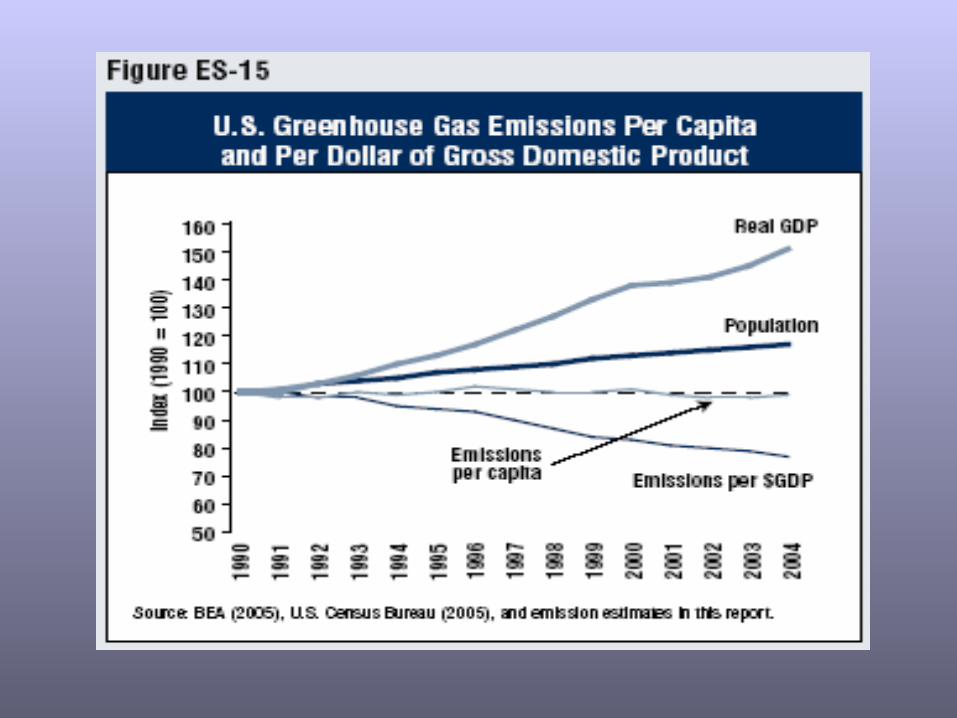
• Since 1990, intensity down 2% per year
• Total emissions have grown 0.9%/yr– 14.4% increase– KP – 7% decrease– CO2 – 83.8%, CH4 8.6%, N2O 5.4%,
HFCs+PFCs+SF6 2.2%
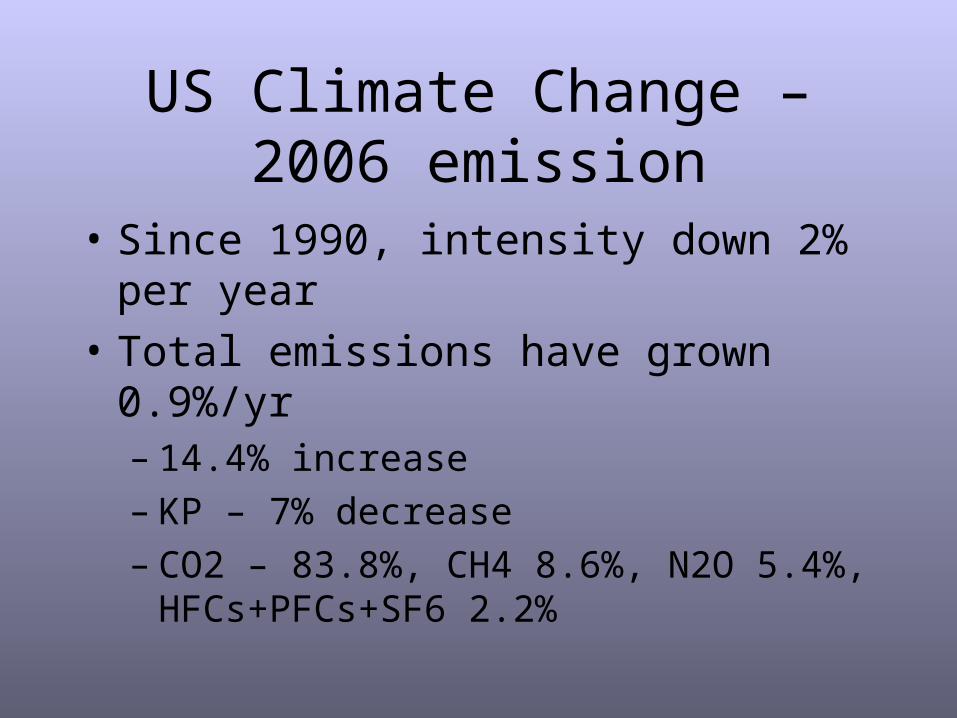
US Residential Energy Use - 2001
48%
6%
17%
5%
24%
Space Heating
Air Conditioning
Water Heating
Refrigerators
Other Appliances& Lighting
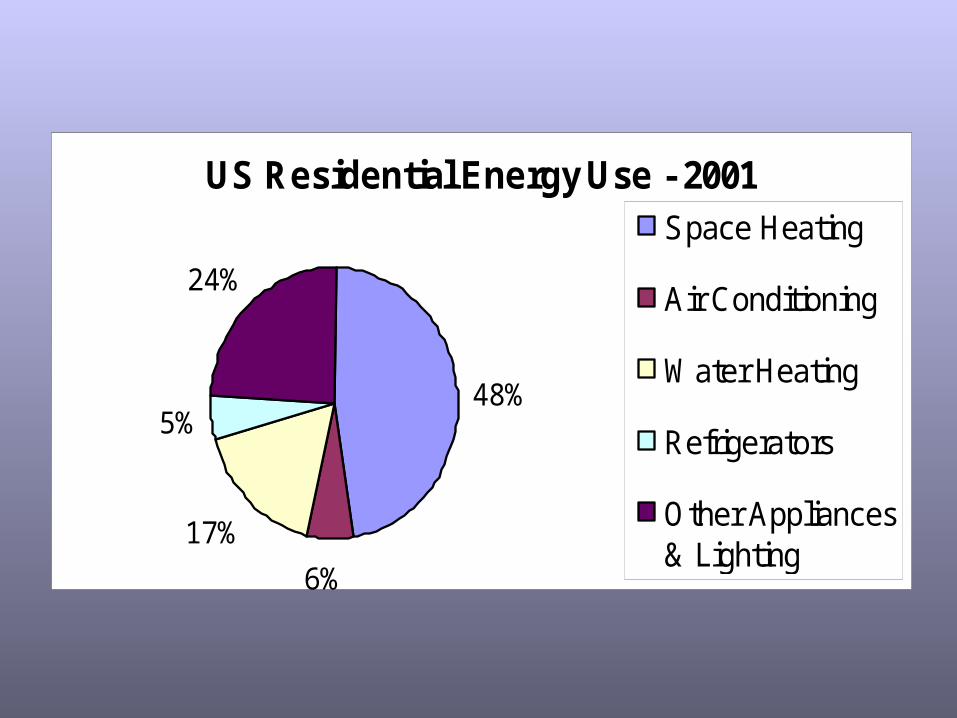
US Commercial Buildings Energy Use 1995
32%
7%
3%15%
23%
4%
3%
6%7%
HeatingCooling VentilationWater HeatingLightingCookingRefrigerationOffice EquipmentOther
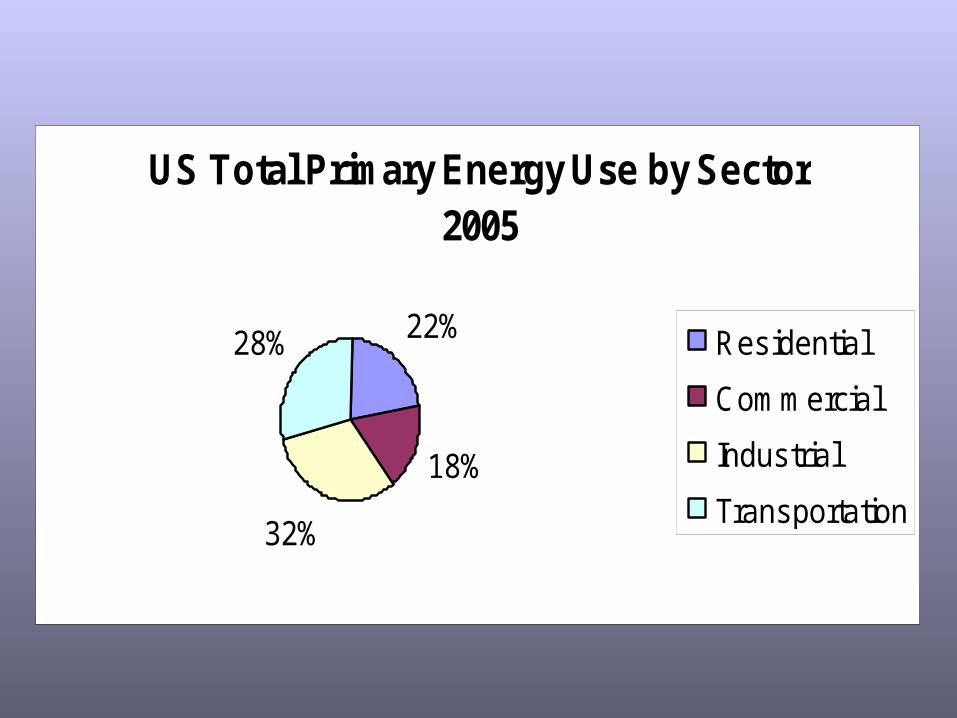
US Total Primary Energy Use by Sector 2005
22%
18%
32%
28% Residential
Commercial
Industrial
Transportation
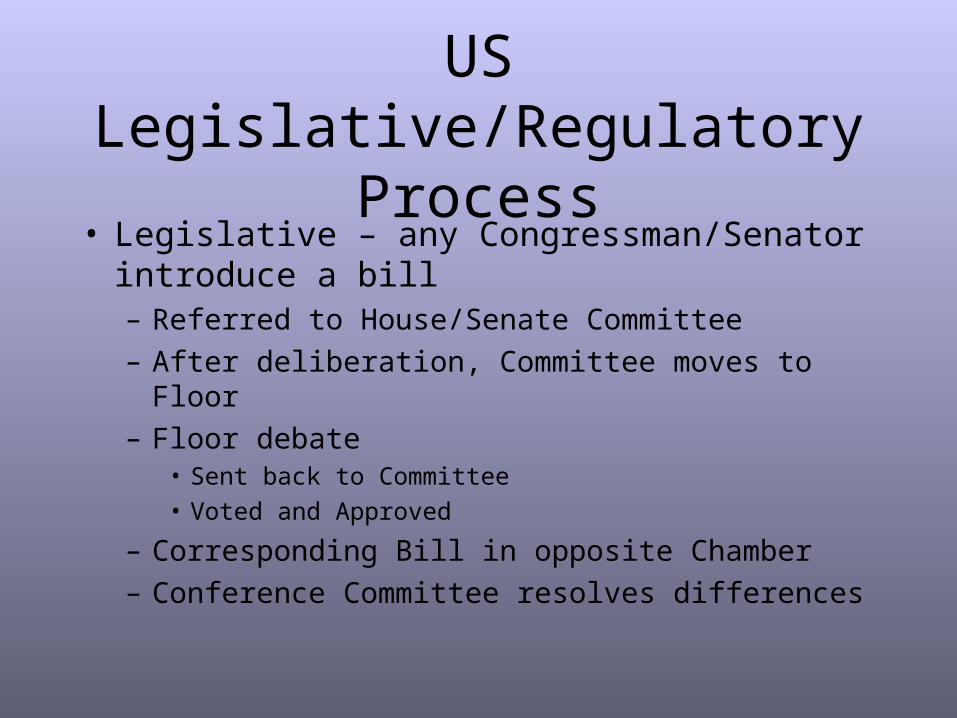
US Legislative/Regulatory Process
• Legislative – any Congressman/Senator introduce a bill– Referred to House/Senate Committee
– After deliberation, Committee moves to Floor
– Floor debate• Sent back to Committee
• Voted and Approved
– Corresponding Bill in opposite Chamber
– Conference Committee resolves differences
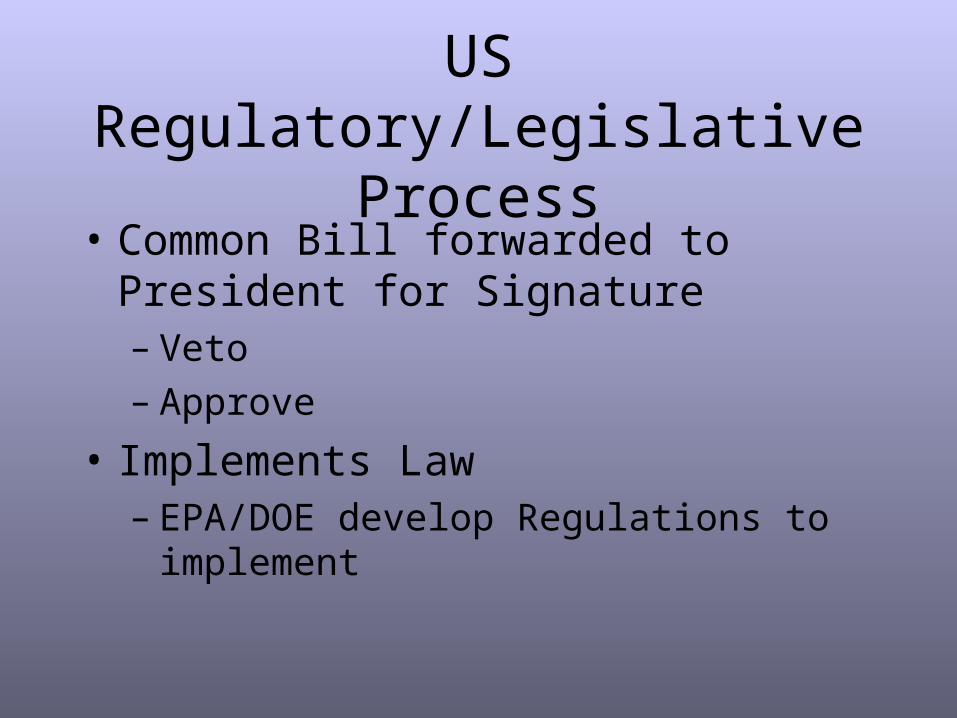
US Regulatory/Legislative Process
• Common Bill forwarded to President for Signature– Veto– Approve
• Implements Law– EPA/DOE develop Regulations to implement
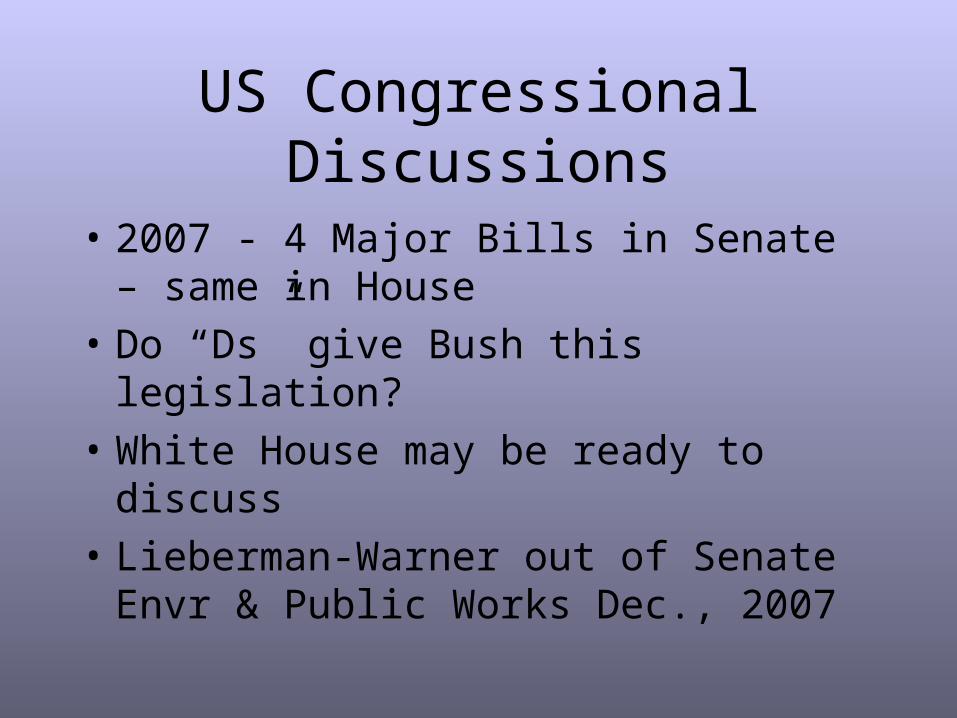
US Congressional Discussions
• 2007 - 4 Major Bills in Senate – same in House
• Do “Ds” give Bush this legislation?
• White House may be ready to discuss
• Lieberman-Warner out of Senate Envr & Public Works Dec., 2007
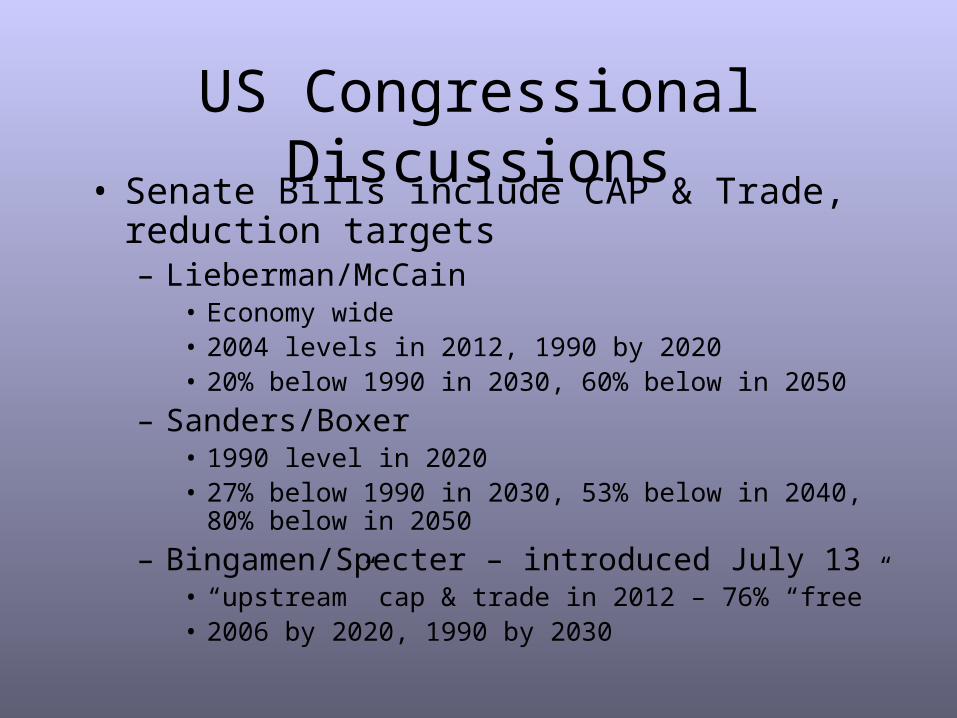
US Congressional Discussions• Senate Bills include CAP & Trade, reduction
targets– Lieberman/McCain
• Economy wide• 2004 levels in 2012, 1990 by 2020• 20% below 1990 in 2030, 60% below in 2050
– Sanders/Boxer• 1990 level in 2020• 27% below 1990 in 2030, 53% below in 2040, 80% below in
2050
– Bingamen/Specter – introduced July 13• “upstream” cap & trade in 2012 – 76% “free”• 2006 by 2020, 1990 by 2030
1
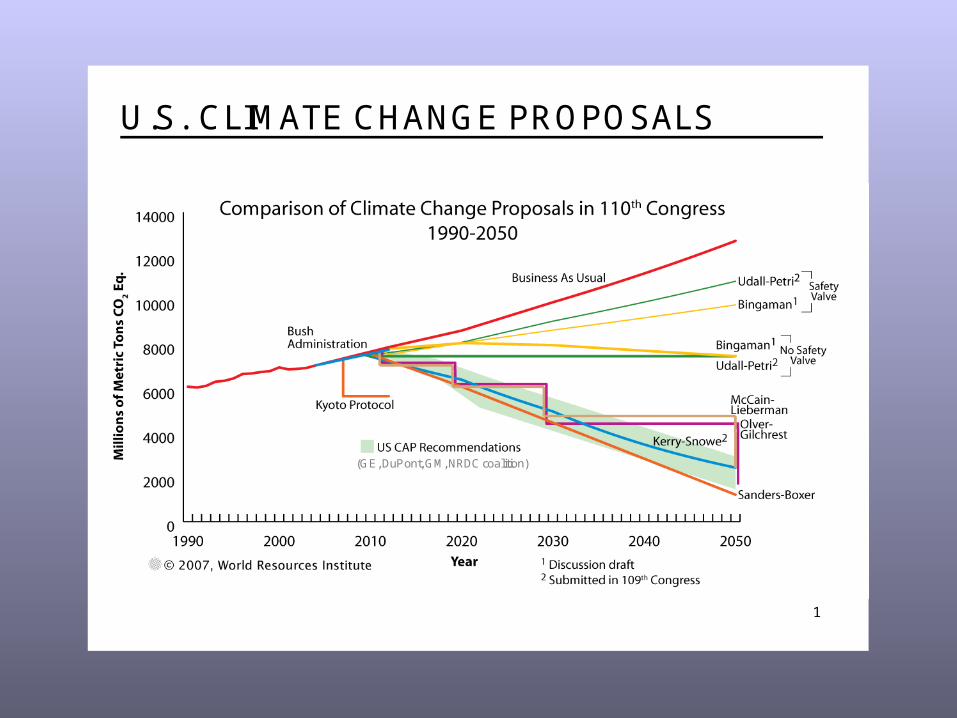
U.S. CLIMATE CHANGE PROPOSALS
(GE, DuPont, GM, NRDC coalition)
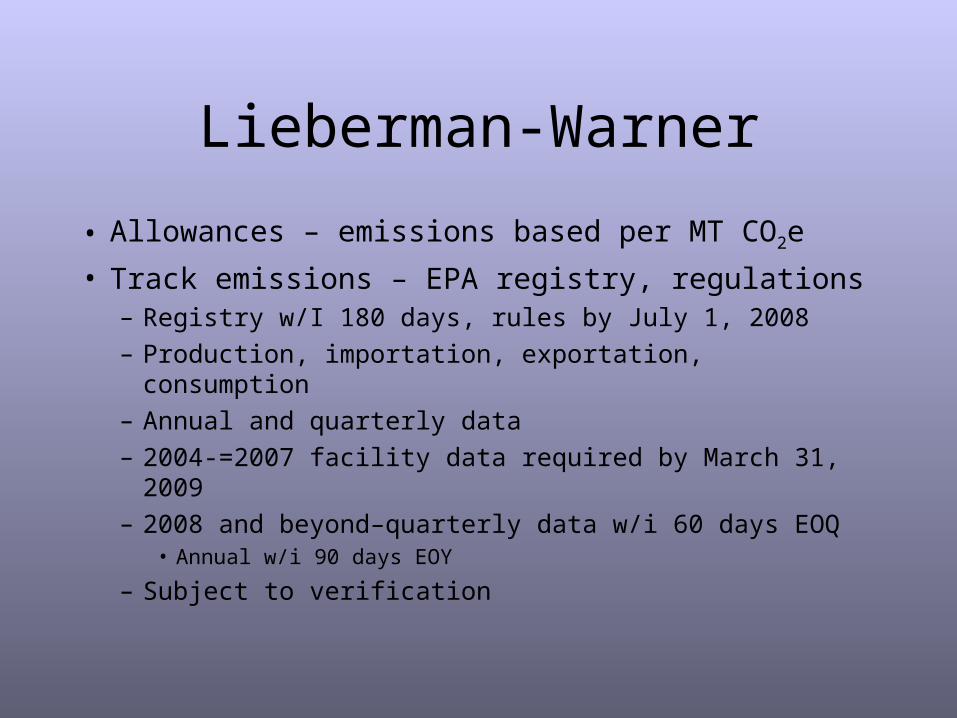
Lieberman-Warner
• Allowances – emissions based per MT CO2e
• Track emissions – EPA registry, regulations – Registry w/I 180 days, rules by July 1, 2008
– Production, importation, exportation, consumption
– Annual and quarterly data
– 2004-=2007 facility data required by March 31, 2009
– 2008 and beyond–quarterly data w/i 60 days EOQ• Annual w/i 90 days EOY
– Subject to verification
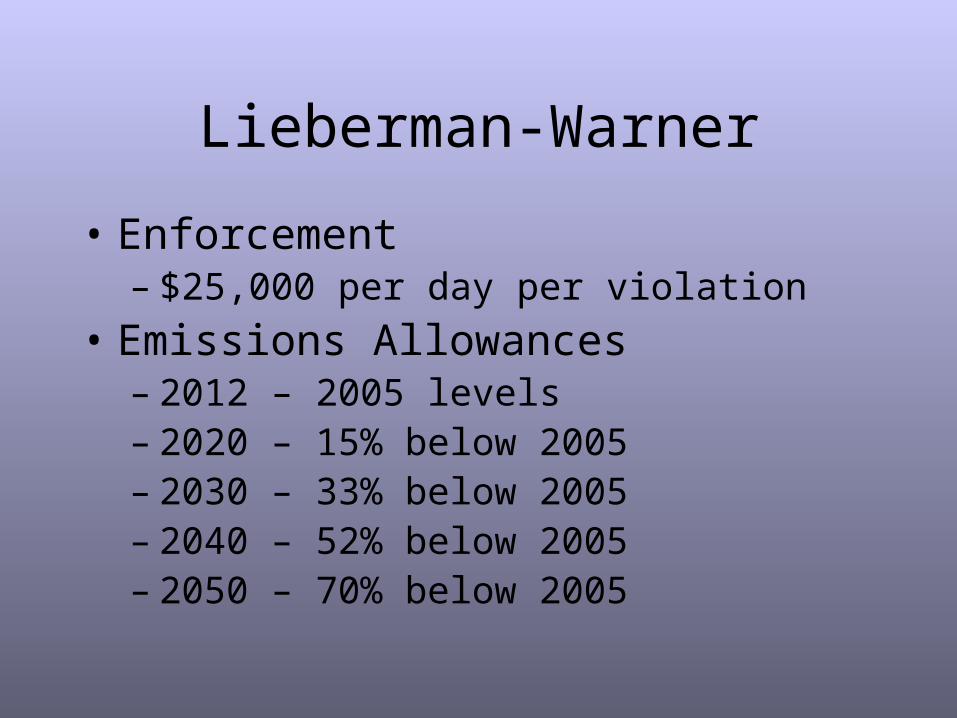
Lieberman-Warner
• Enforcement– $25,000 per day per violation
• Emissions Allowances– 2012 – 2005 levels– 2020 – 15% below 2005– 2030 – 33% below 2005– 2040 – 52% below 2005– 2050 – 70% below 2005
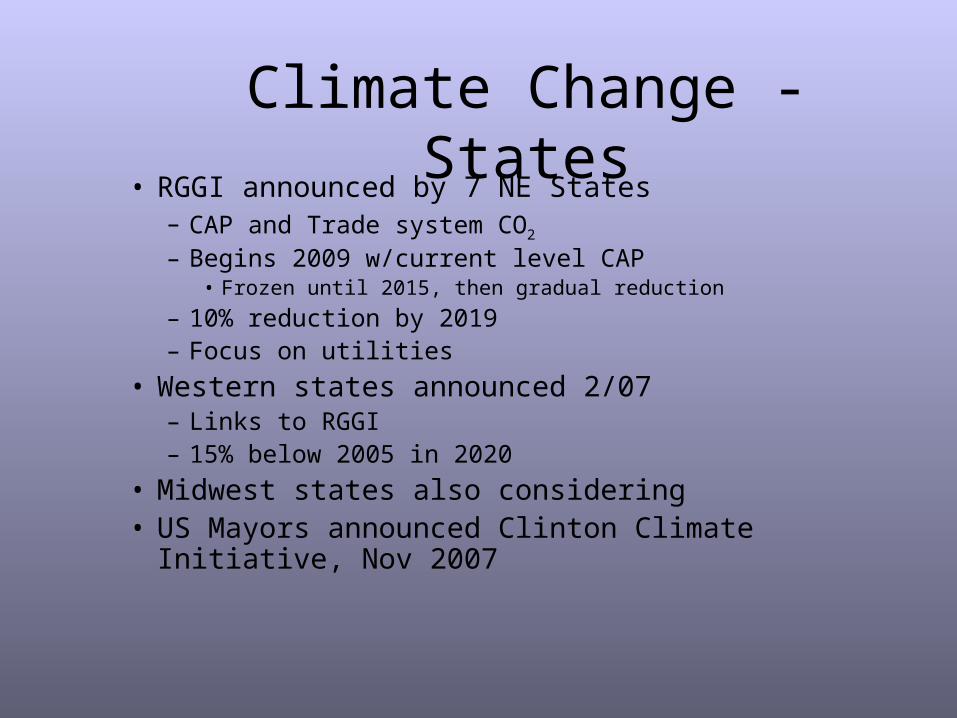
Climate Change - States• RGGI announced by 7 NE States
– CAP and Trade system CO2 – Begins 2009 w/current level CAP
• Frozen until 2015, then gradual reduction
– 10% reduction by 2019– Focus on utilities
• Western states announced 2/07– Links to RGGI– 15% below 2005 in 2020
• Midwest states also considering• US Mayors announced Clinton Climate Initiative, Nov 2007
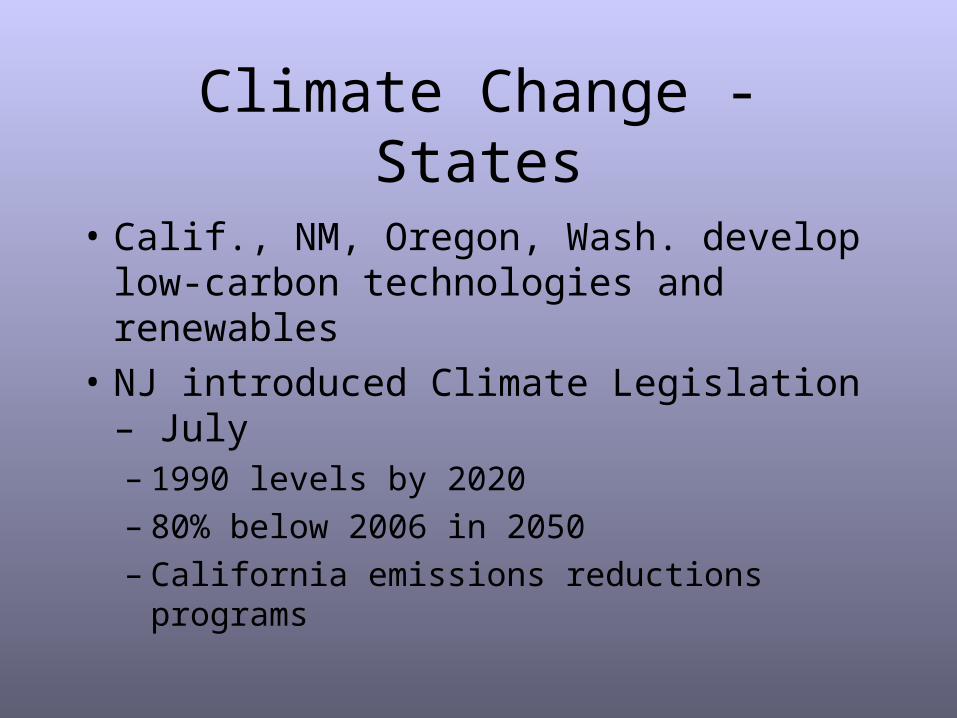
Climate Change - States
• Calif., NM, Oregon, Wash. develop low-carbon technologies and renewables
• NJ introduced Climate Legislation – July– 1990 levels by 2020– 80% below 2006 in 2050– California emissions reductions programs
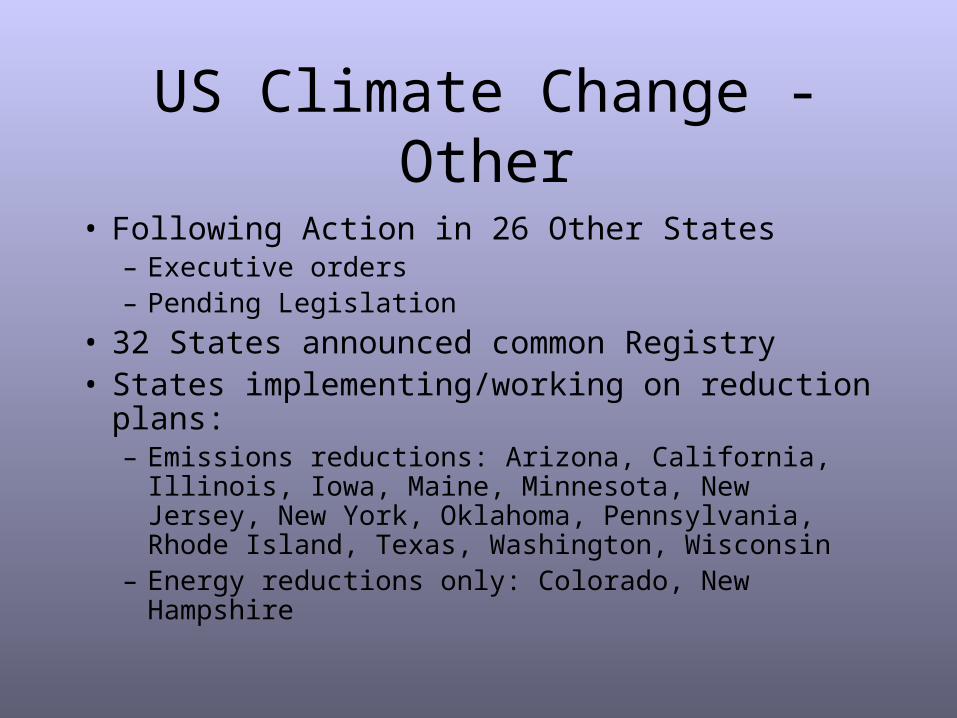
US Climate Change - Other
• Following Action in 26 Other States– Executive orders– Pending Legislation
• 32 States announced common Registry• States implementing/working on reduction plans:
– Emissions reductions: Arizona, California, Illinois, Iowa, Maine, Minnesota, New Jersey, New York, Oklahoma, Pennsylvania, Rhode Island, Texas, Washington, Wisconsin
– Energy reductions only: Colorado, New Hampshire
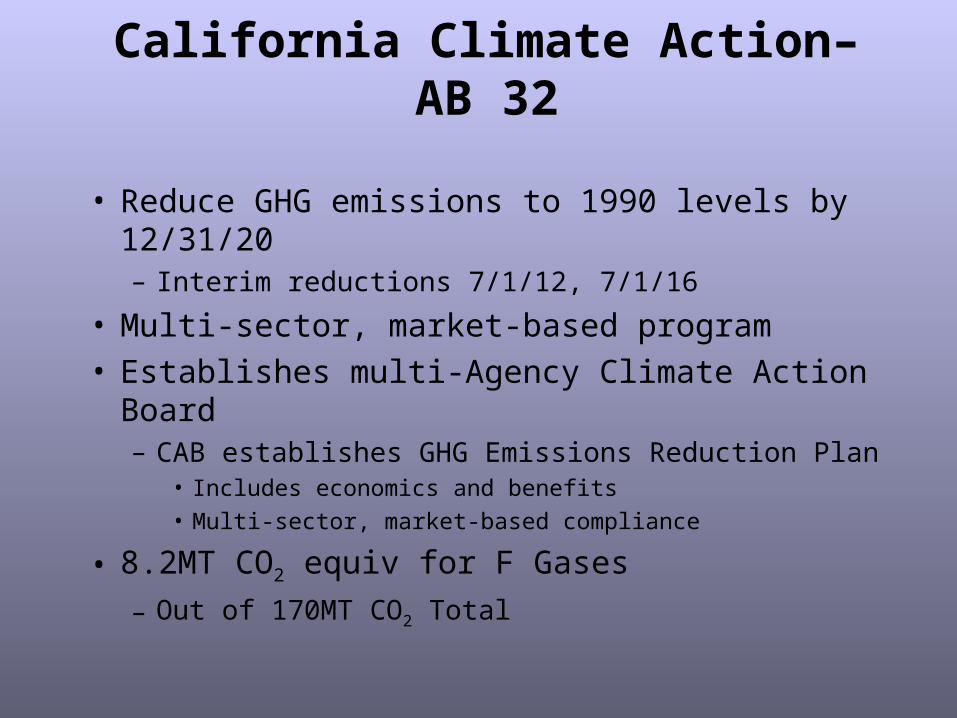
California Climate Action–AB 32
• Reduce GHG emissions to 1990 levels by 12/31/20– Interim reductions 7/1/12, 7/1/16
• Multi-sector, market-based program• Establishes multi-Agency Climate Action Board
– CAB establishes GHG Emissions Reduction Plan• Includes economics and benefits
• Multi-sector, market-based compliance
• 8.2MT CO2 equiv for F Gases
– Out of 170MT CO2 Total
California Climate Action–AB 32
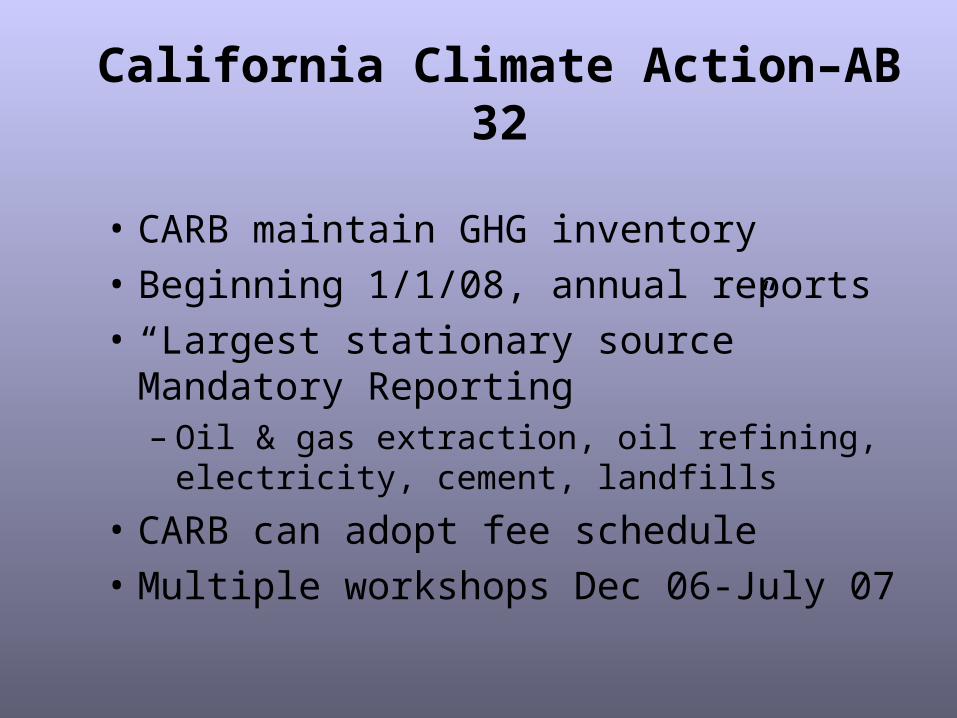
• CARB maintain GHG inventory
• Beginning 1/1/08, annual reports
• “Largest stationary source” Mandatory Reporting– Oil & gas extraction, oil refining, electricity,
cement, landfills
• CARB can adopt fee schedule
• Multiple workshops Dec 06-July 07
California Climate ActionAB 32
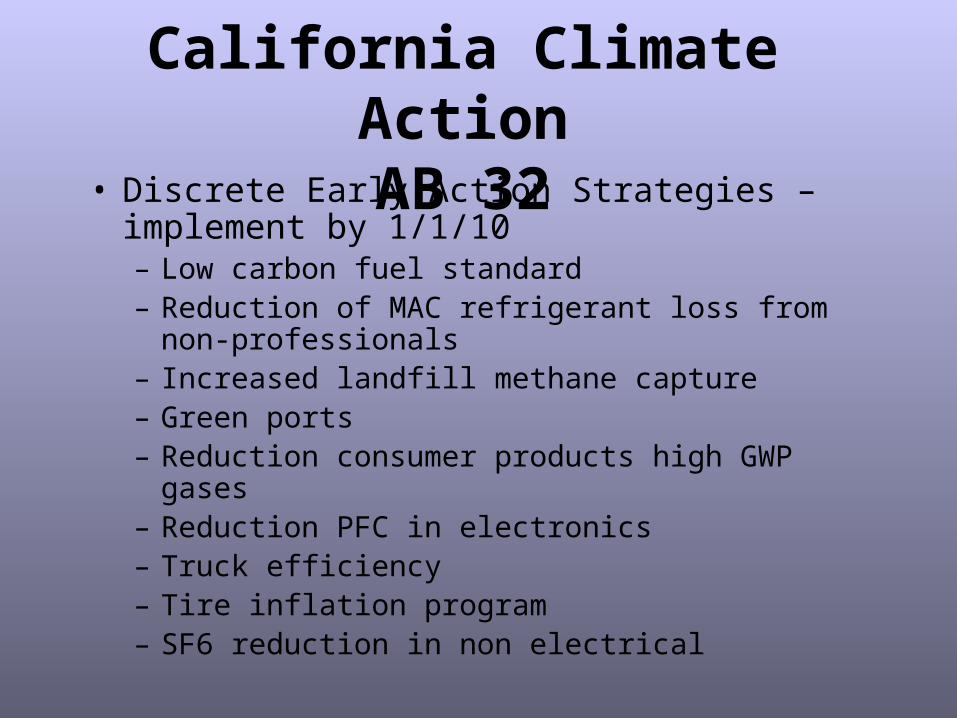
• Discrete Early Action Strategies – implement by 1/1/10– Low carbon fuel standard – Reduction of MAC refrigerant loss from non-
professionals– Increased landfill methane capture– Green ports– Reduction consumer products high GWP gases – Reduction PFC in electronics– Truck efficiency– Tire inflation program– SF6 reduction in non electrical
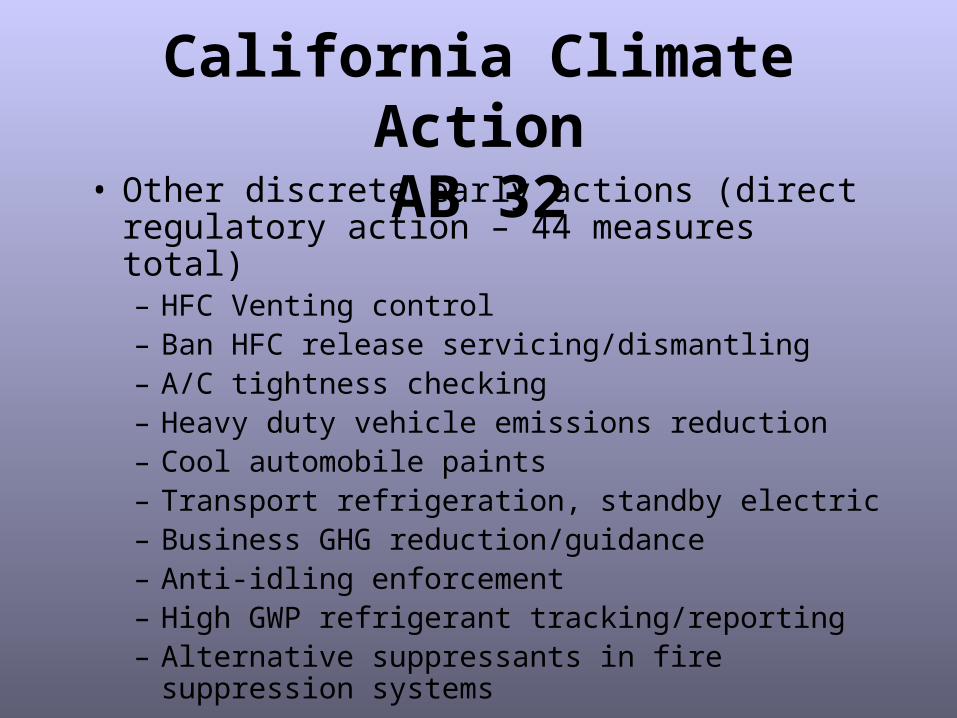
California Climate ActionAB 32• Other discrete early actions (direct regulatory
action – 44 measures total)– HFC Venting control– Ban HFC release servicing/dismantling– A/C tightness checking– Heavy duty vehicle emissions reduction– Cool automobile paints– Transport refrigeration, standby electric– Business GHG reduction/guidance– Anti-idling enforcement– High GWP refrigerant tracking/reporting– Alternative suppressants in fire suppression systems
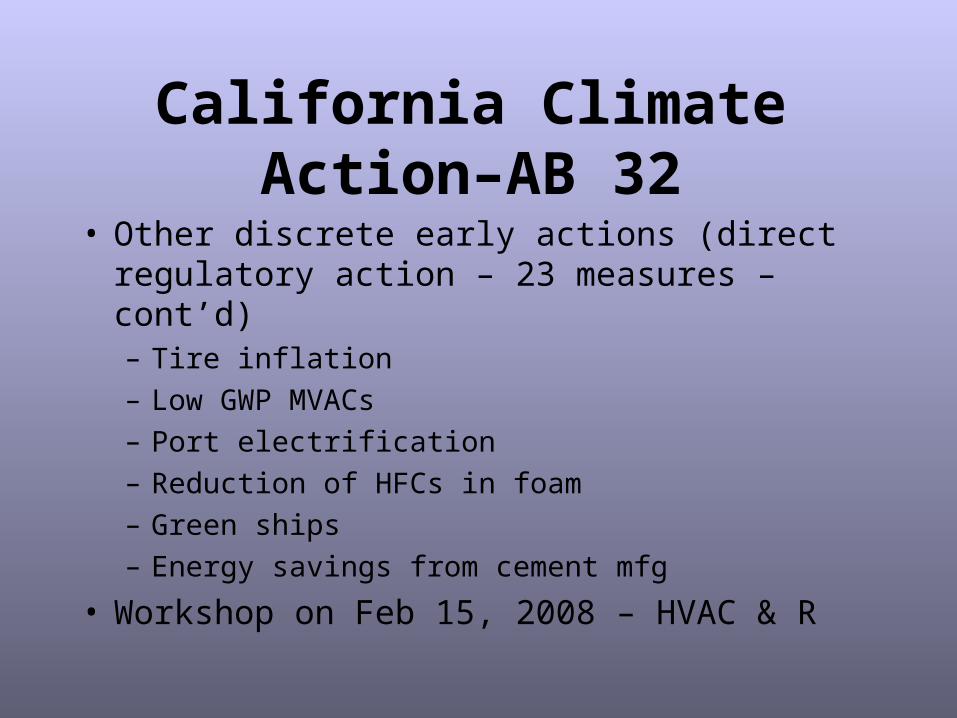
California Climate Action–AB 32
• Other discrete early actions (direct regulatory action – 23 measures – cont’d)– Tire inflation
– Low GWP MVACs
– Port electrification
– Reduction of HFCs in foam
– Green ships
– Energy savings from cement mfg
• Workshop on Feb 15, 2008 – HVAC & R
Climate Change Alliance & Others
0
100
200
300
400
50020
05
2006
2007
2008
2009
2010
2011
2012
2013
2014
2015
2016
2017
2018
2019
2020
Mill
ion
To
ns
CO
2e
q
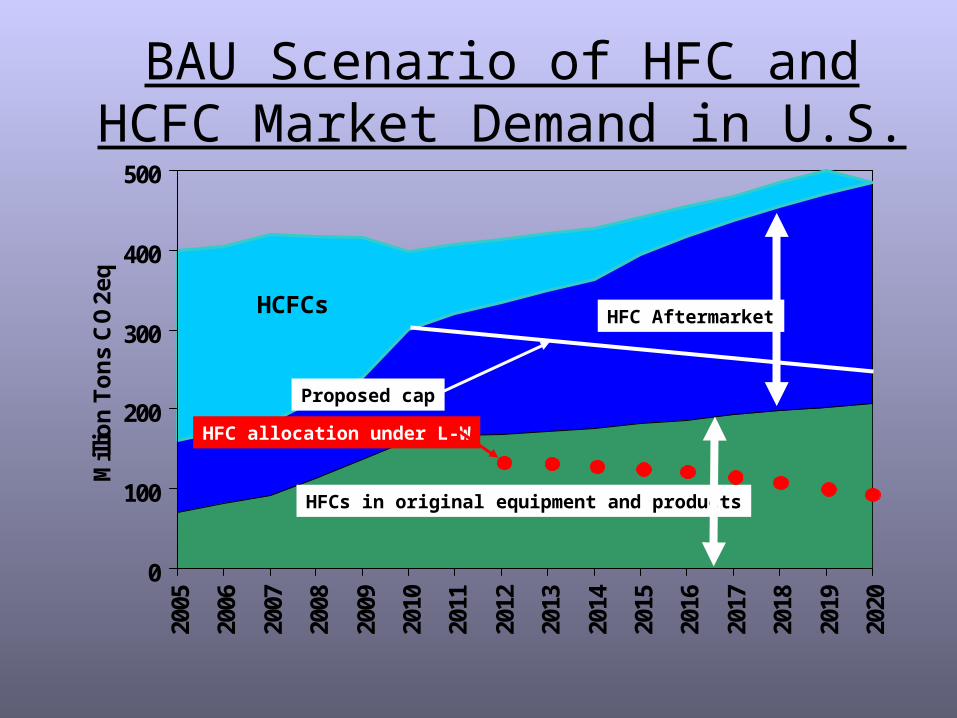
HFCs in original equipment and products
HFC AftermarketHCFCs
BAU Scenario of HFC and HCFC Market Demand in U.S.
Proposed cap
HFC allocation under L-W
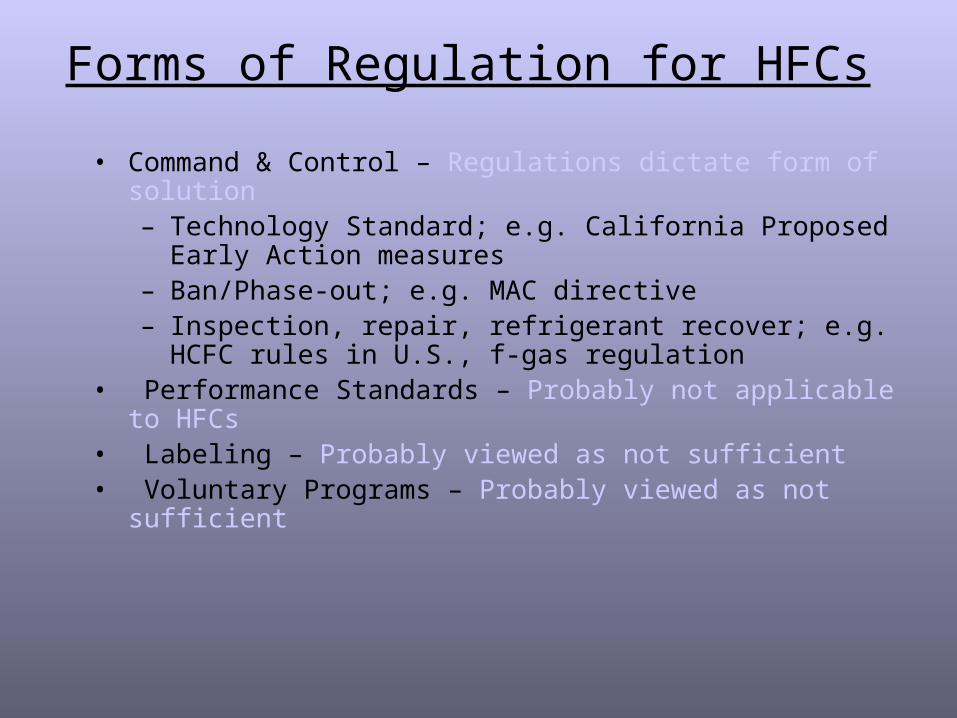
Forms of Regulation for HFCs
• Command & Control – Regulations dictate form of solution– Technology Standard; e.g. California Proposed Early Action measures – Ban/Phase-out; e.g. MAC directive– Inspection, repair, refrigerant recover; e.g. HCFC rules in U.S., f-gas
regulation• Performance Standards – Probably not applicable to HFCs• Labeling – Probably viewed as not sufficient• Voluntary Programs – Probably viewed as not sufficient
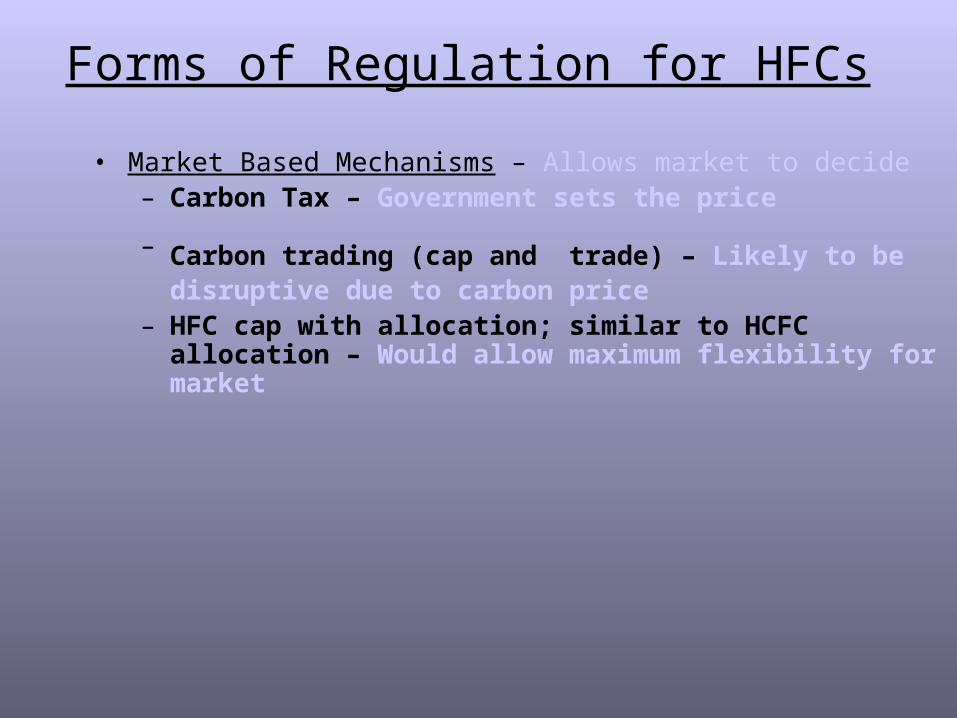
Forms of Regulation for HFCs
• Market Based Mechanisms – Allows market to decide– Carbon Tax – Government sets the price
– Carbon trading (cap and trade) – Likely to be disruptive due to carbon price
– HFC cap with allocation; similar to HCFC allocation – Would allow maximum flexibility for market
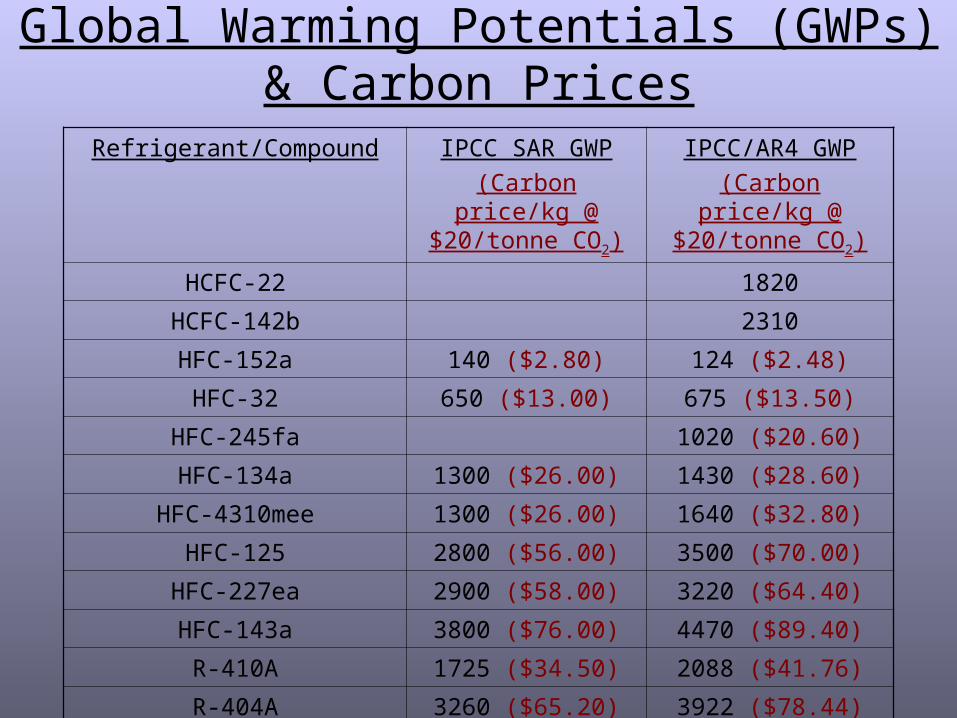
Global Warming Potentials (GWPs) & Carbon Prices
Refrigerant/Compound IPCC SAR GWP
(Carbon price/kg @ $20/tonne CO2)
IPCC/AR4 GWP
(Carbon price/kg @ $20/tonne CO2)
HCFC-22 1820
HCFC-142b 2310
HFC-152a 140 ($2.80) 124 ($2.48)
HFC-32 650 ($13.00) 675 ($13.50)
HFC-245fa 1020 ($20.60)
HFC-134a 1300 ($26.00) 1430 ($28.60)
HFC-4310mee 1300 ($26.00) 1640 ($32.80)
HFC-125 2800 ($56.00) 3500 ($70.00)
HFC-227ea 2900 ($58.00) 3220 ($64.40)
HFC-143a 3800 ($76.00) 4470 ($89.40)
R-410A 1725 ($34.50) 2088 ($41.76)
R-404A 3260 ($65.20) 3922 ($78.44)
Alliance & Others Activity
• Montreal Protocol allocation– Essentially CAP & Trade– Declining CAP brought steady rise in product
prices, which passed through market– Customers demanded and producers brought
lower ODP products to market
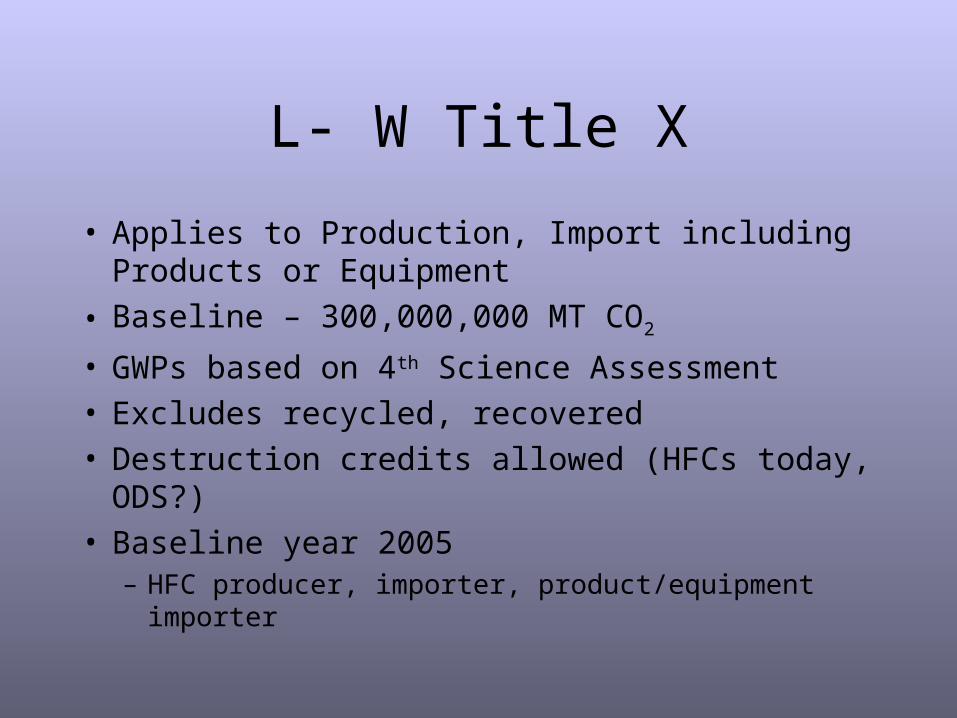
L- W Title X
• Applies to Production, Import including Products or Equipment
• Baseline – 300,000,000 MT CO2
• GWPs based on 4th Science Assessment• Excludes recycled, recovered• Destruction credits allowed (HFCs today, ODS?)• Baseline year 2005
– HFC producer, importer, product/equipment importer
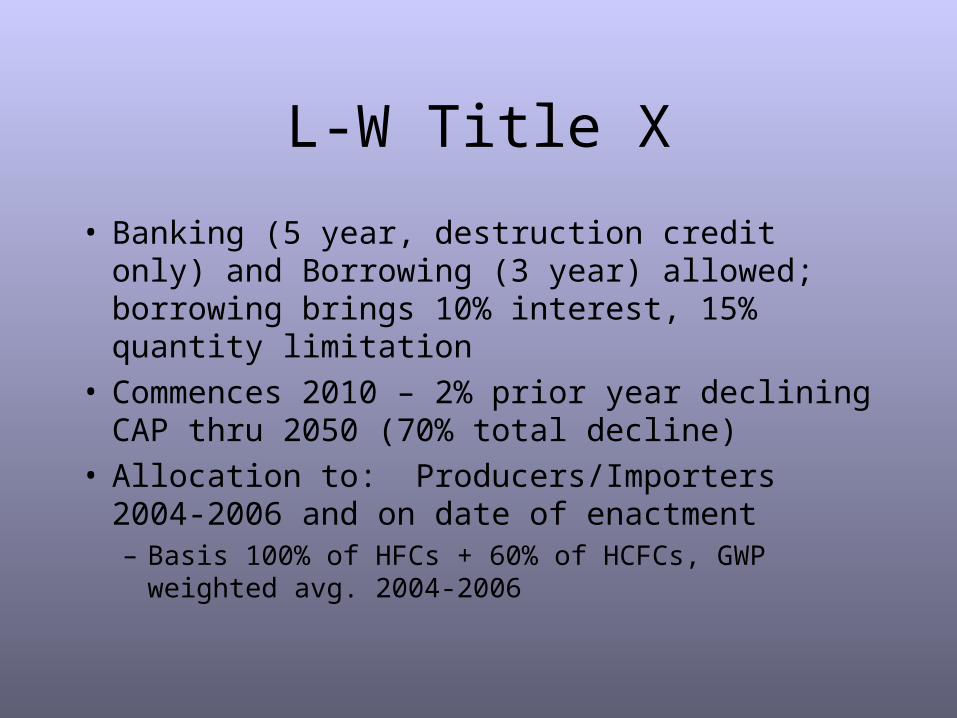
L-W Title X
• Banking (5 year, destruction credit only) and Borrowing (3 year) allowed; borrowing brings 10% interest, 15% quantity limitation
• Commences 2010 – 2% prior year declining CAP thru 2050 (70% total decline)
• Allocation to: Producers/Importers 2004-2006 and on date of enactment– Basis 100% of HFCs + 60% of HCFCs, GWP weighted
avg. 2004-2006
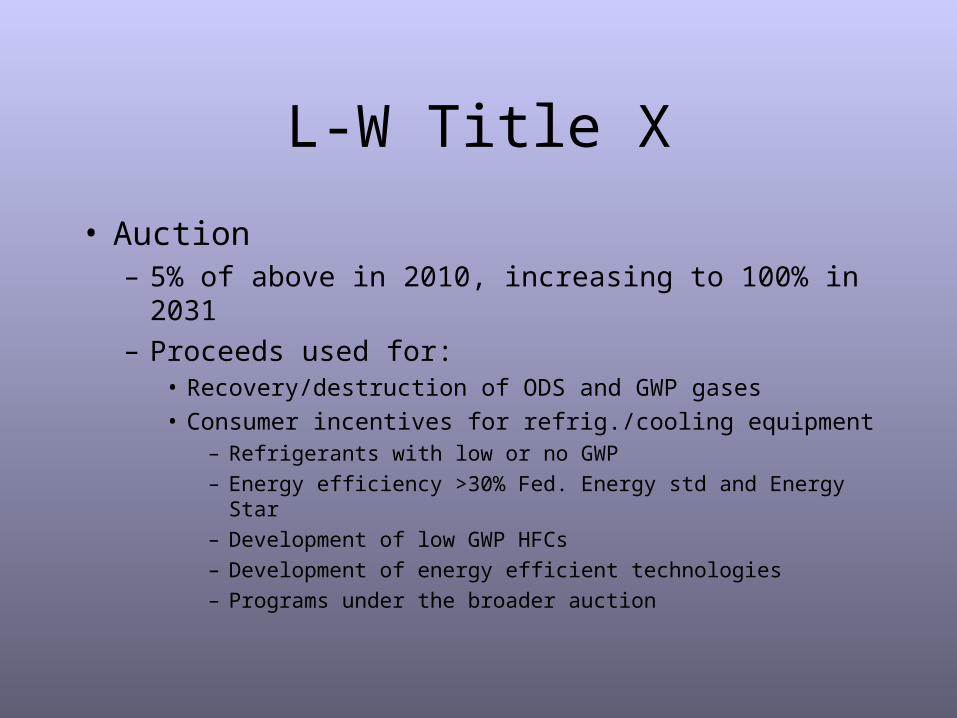
L-W Title X
• Auction– 5% of above in 2010, increasing to 100% in 2031
– Proceeds used for:• Recovery/destruction of ODS and GWP gases
• Consumer incentives for refrig./cooling equipment– Refrigerants with low or no GWP
– Energy efficiency >30% Fed. Energy std and Energy Star
– Development of low GWP HFCs
– Development of energy efficient technologies
– Programs under the broader auction
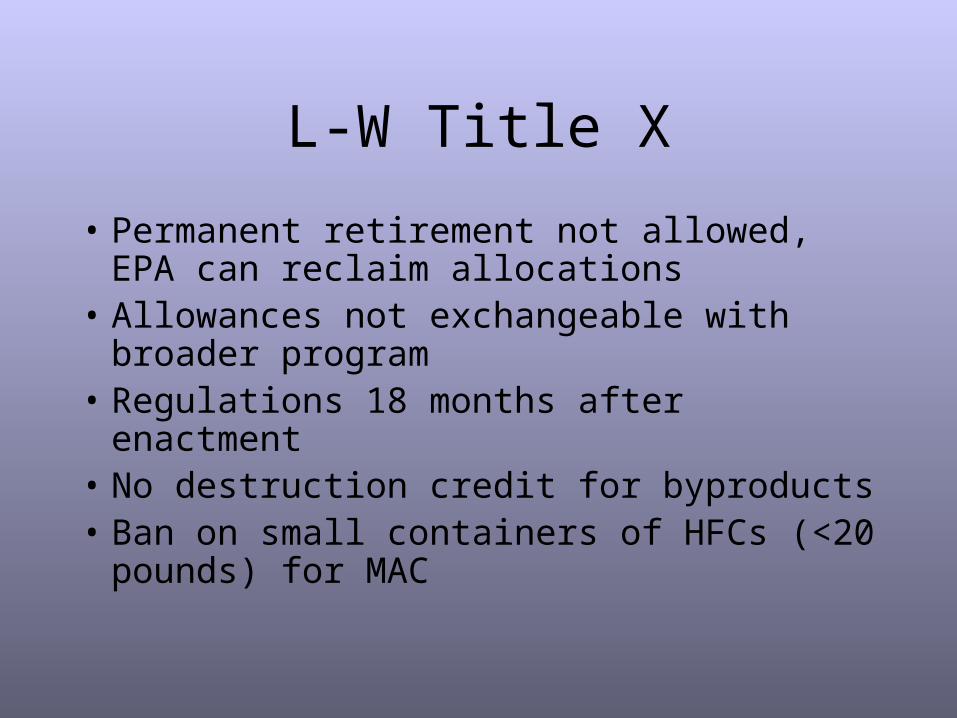
L-W Title X
• Permanent retirement not allowed, EPA can reclaim allocations
• Allowances not exchangeable with broader program
• Regulations 18 months after enactment• No destruction credit for byproducts• Ban on small containers of HFCs (<20
pounds) for MAC
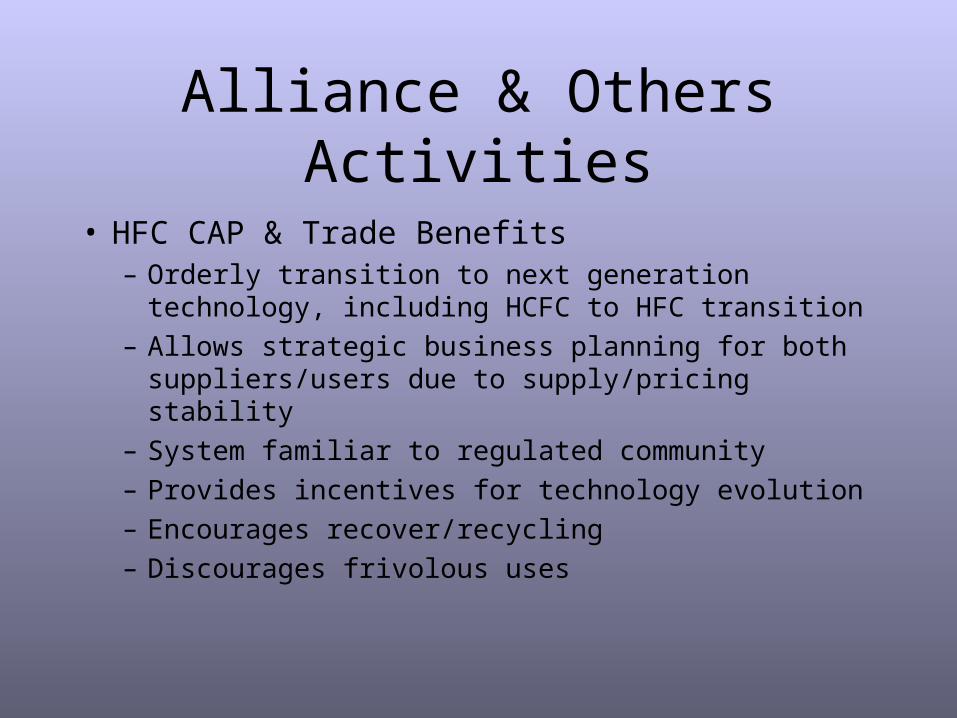
Alliance & Others Activities
• HFC CAP & Trade Benefits– Orderly transition to next generation technology,
including HCFC to HFC transition
– Allows strategic business planning for both suppliers/users due to supply/pricing stability
– System familiar to regulated community
– Provides incentives for technology evolution
– Encourages recover/recycling
– Discourages frivolous uses
Ozone -Science
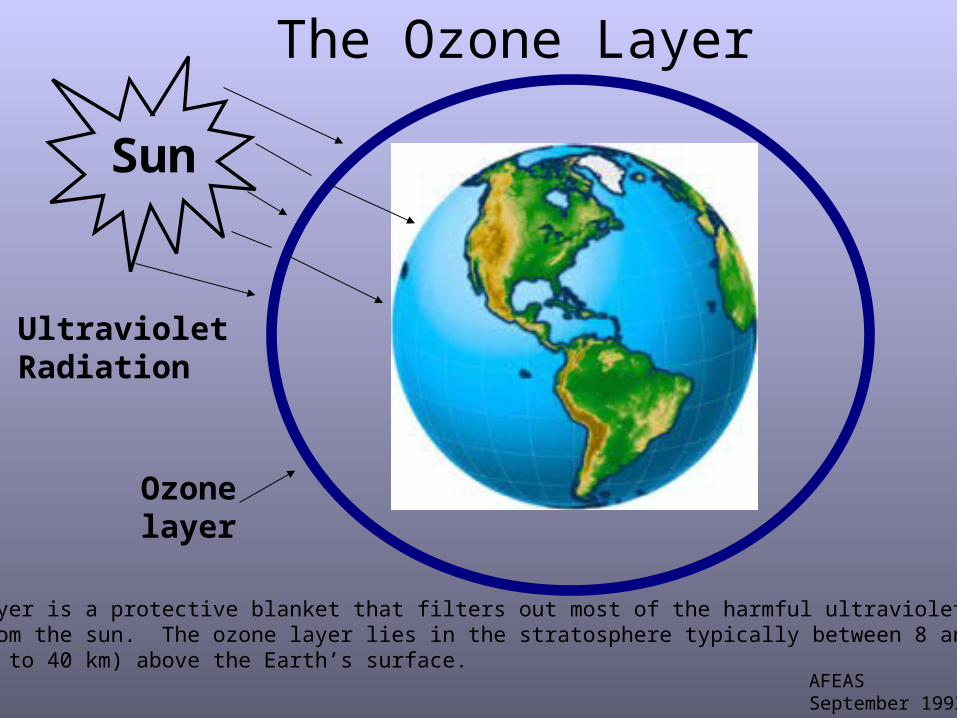
The Ozone Layer
Sun
UltravioletRadiation
Ozonelayer
The ozone layer is a protective blanket that filters out most of the harmful ultravioletRadiation from the sun. The ozone layer lies in the stratosphere typically between 8 and25 miles (13 to 40 km) above the Earth’s surface.
AFEASSeptember 1993
ReservoirComponents
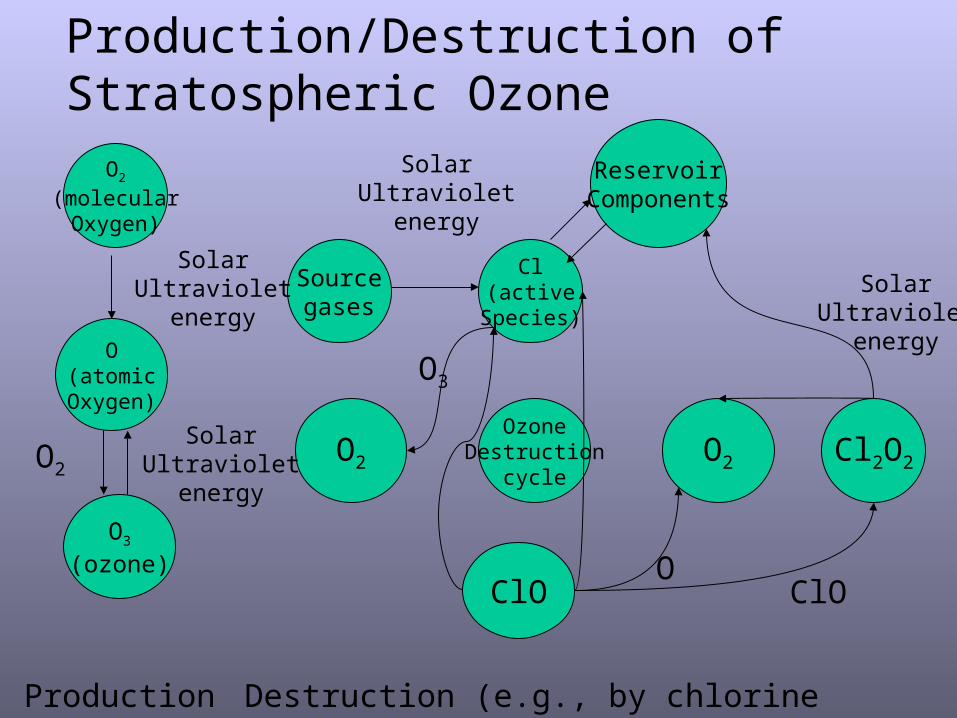
Production/Destruction of Stratospheric Ozone
O2
(molecularOxygen)
O(atomicOxygen)
O3
(ozone)
Sourcegases
O2O2
Cl(active
Species)
OzoneDestruction
cycle
ClO
O2 Cl2O2
ClOO
SolarUltraviolet
energy
SolarUltraviolet
energy
O3
SolarUltraviolet
energy
SolarUltraviolet
energy
Production Destruction (e.g., by chlorine
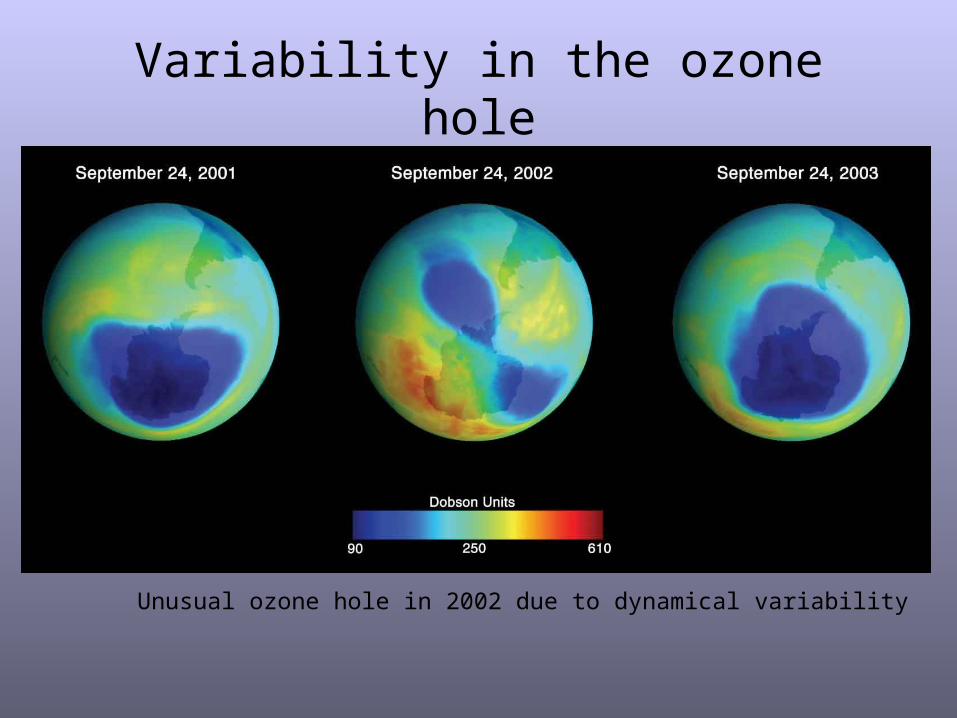
Variability in the ozone hole
Unusual ozone hole in 2002 due to dynamical variability
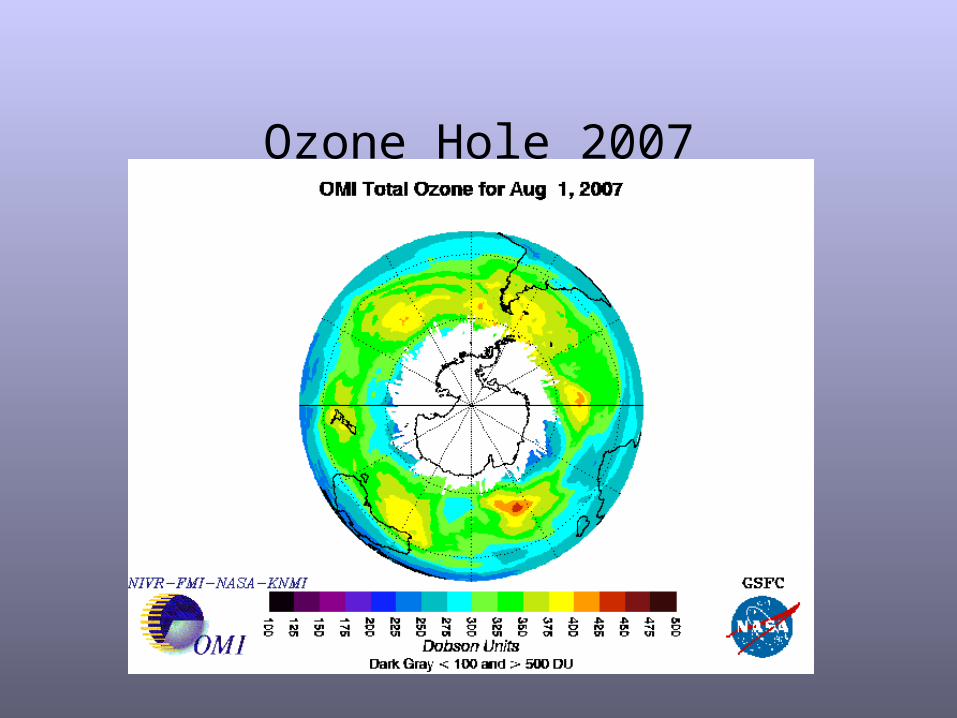
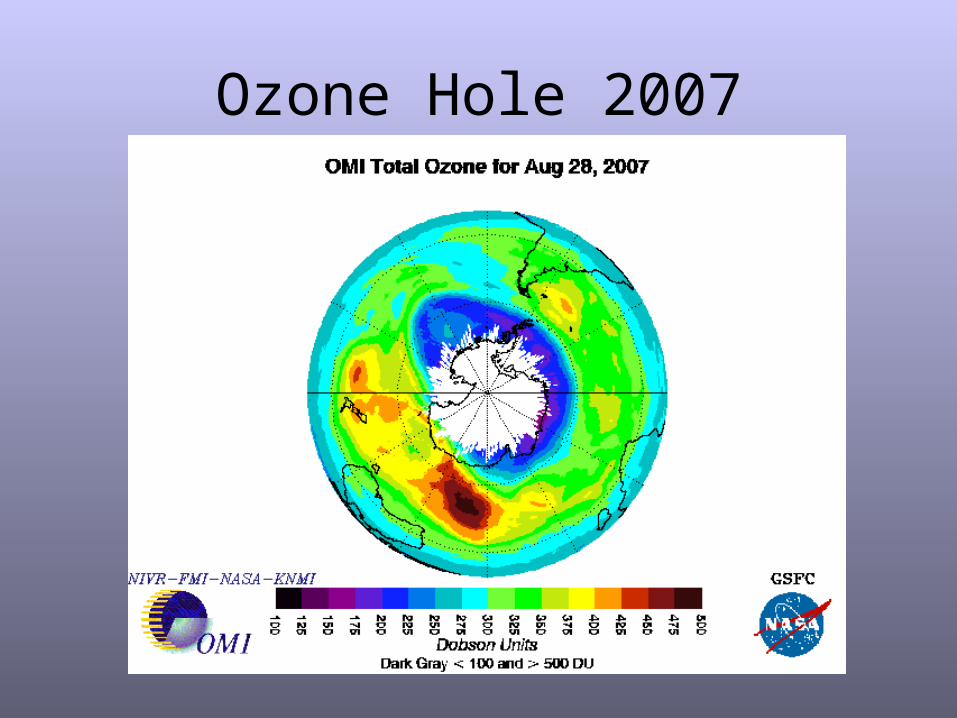
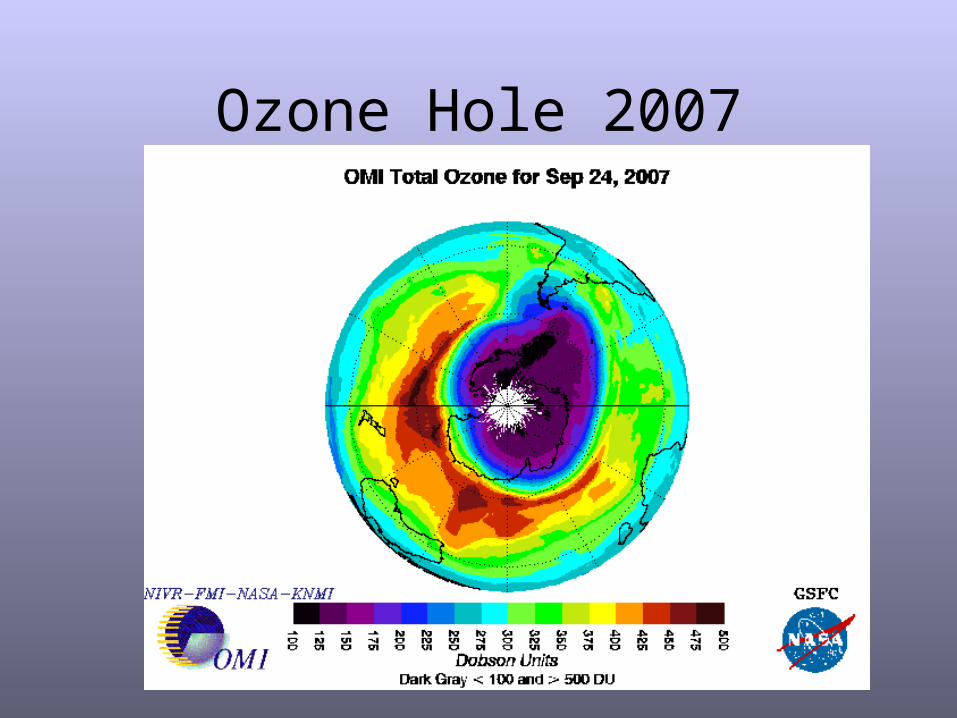
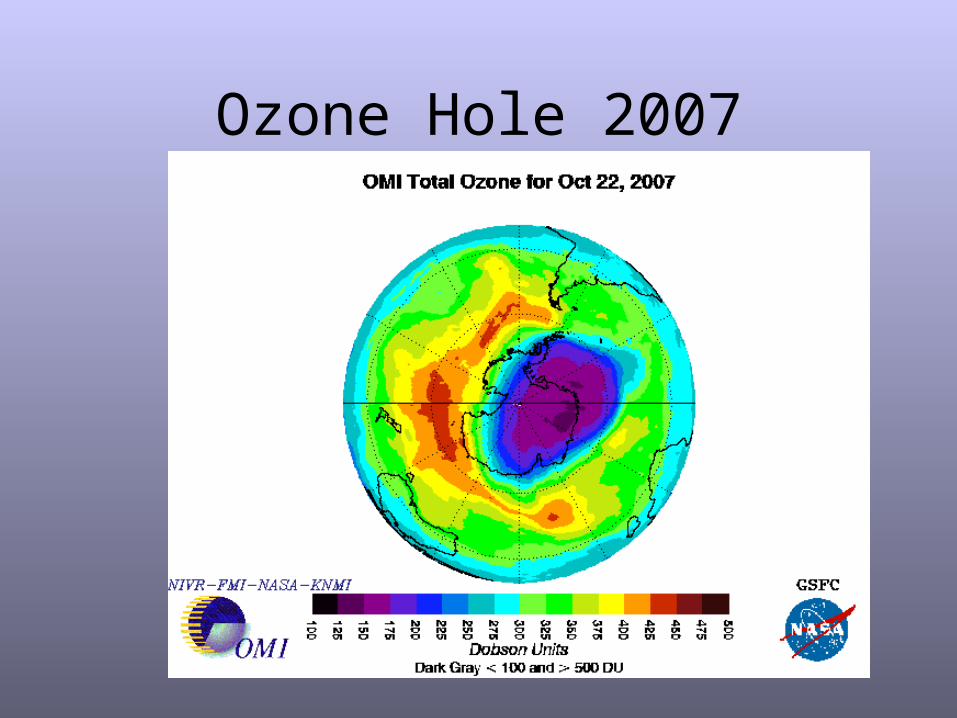
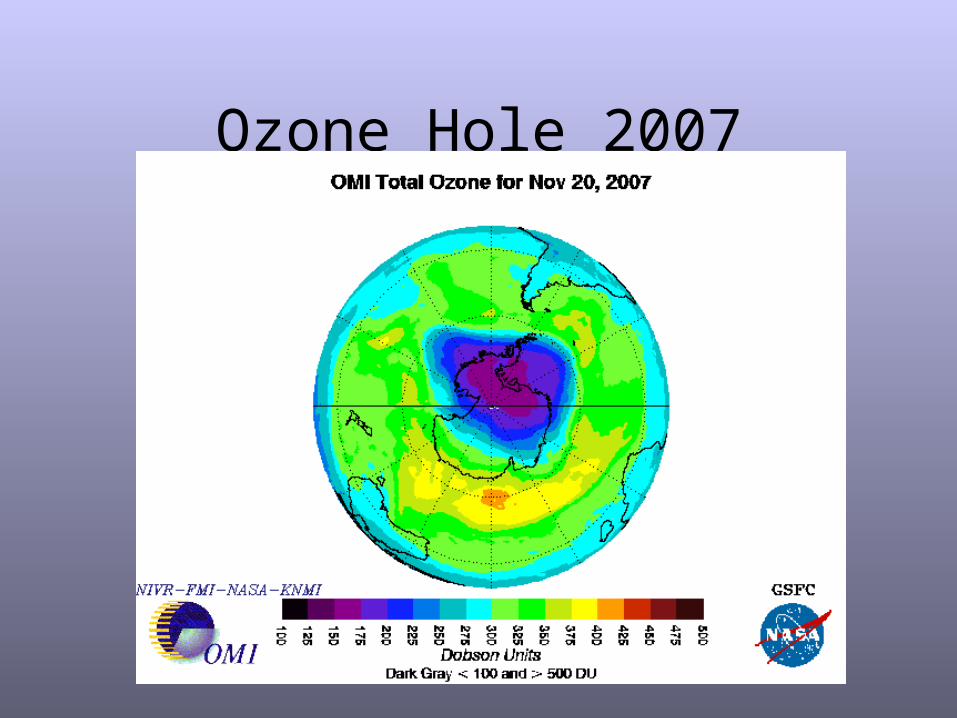
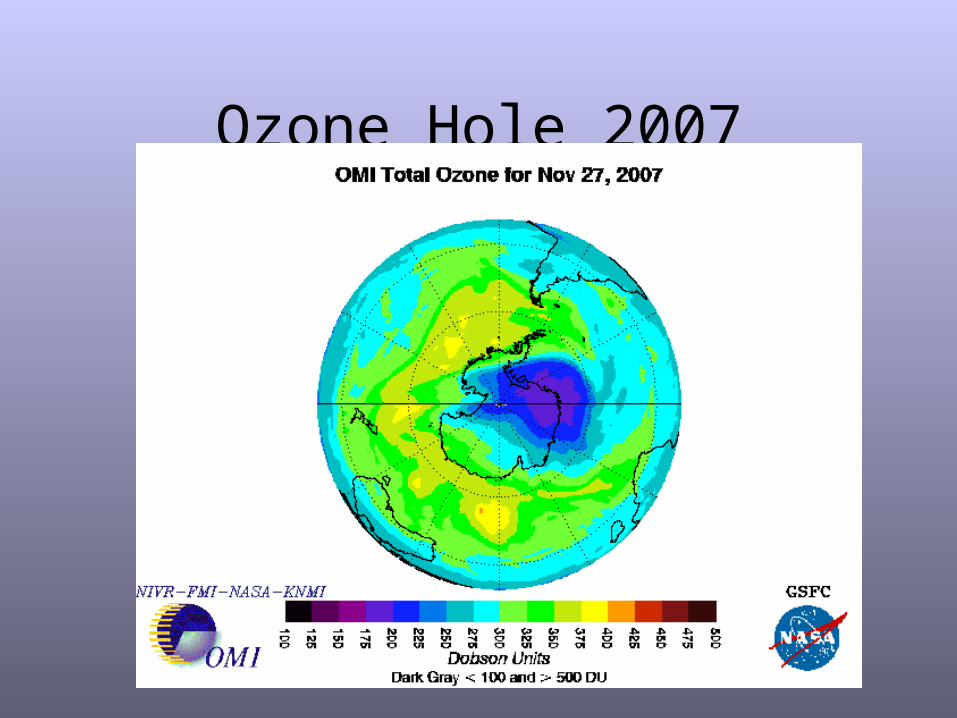
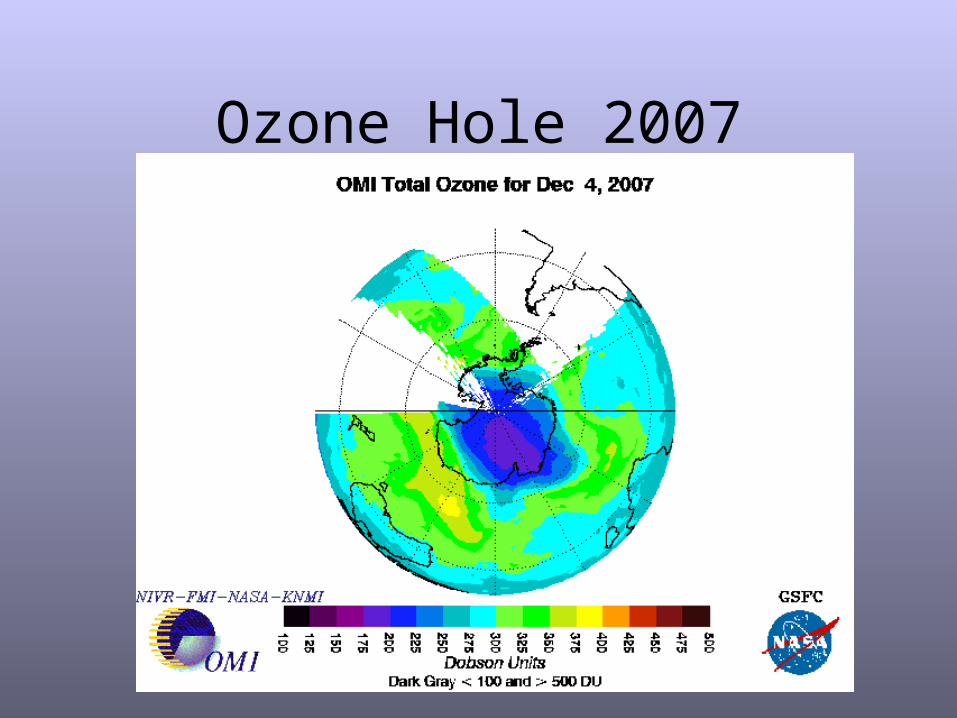
Ozone Hole 2007
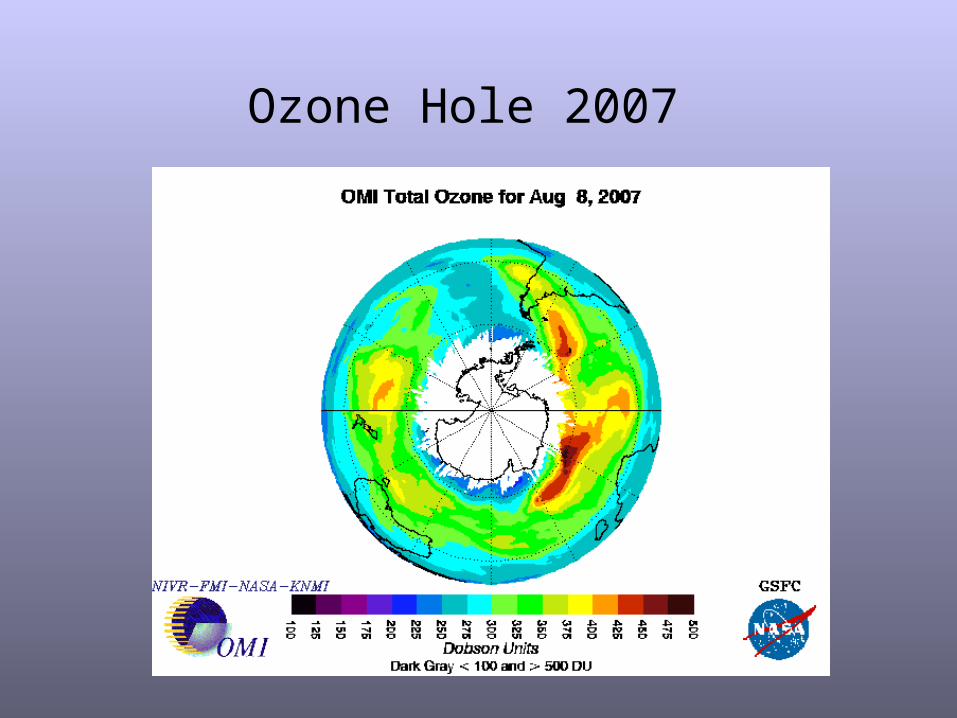
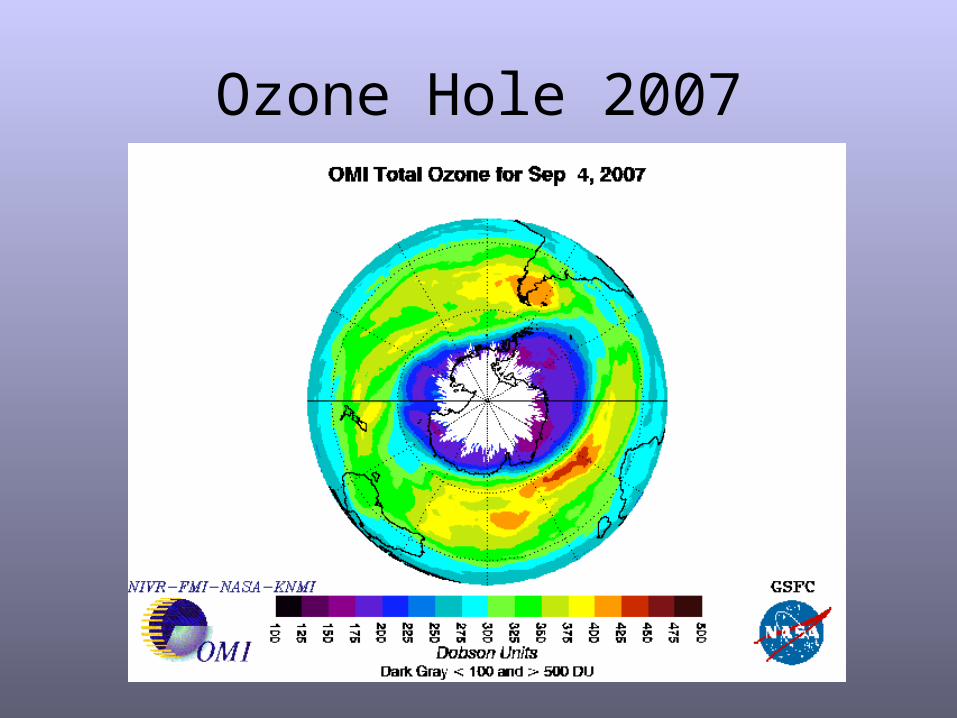
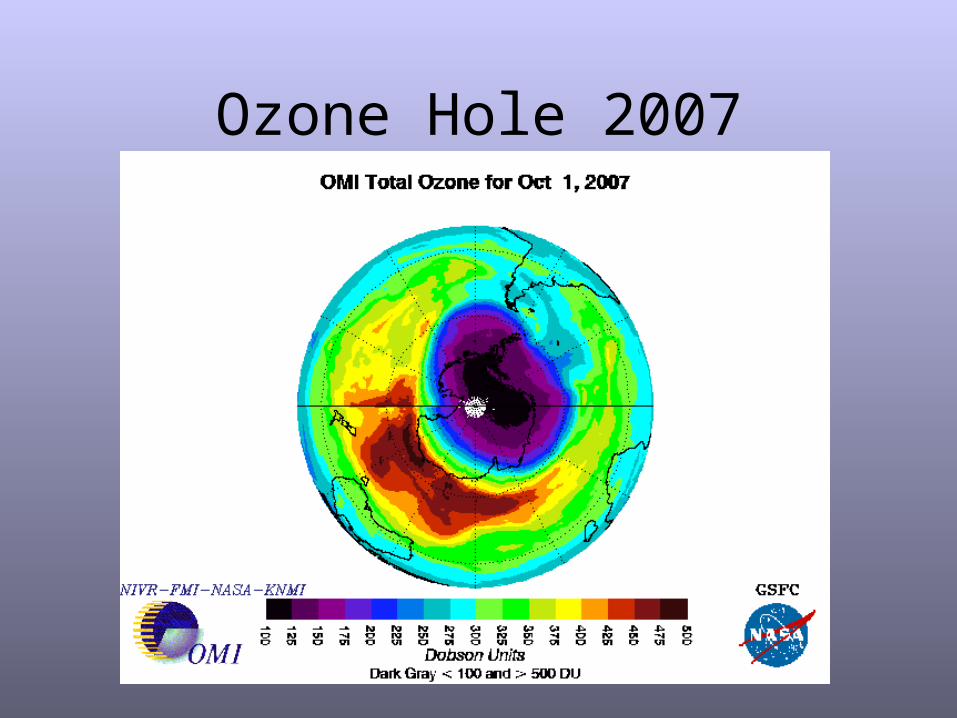
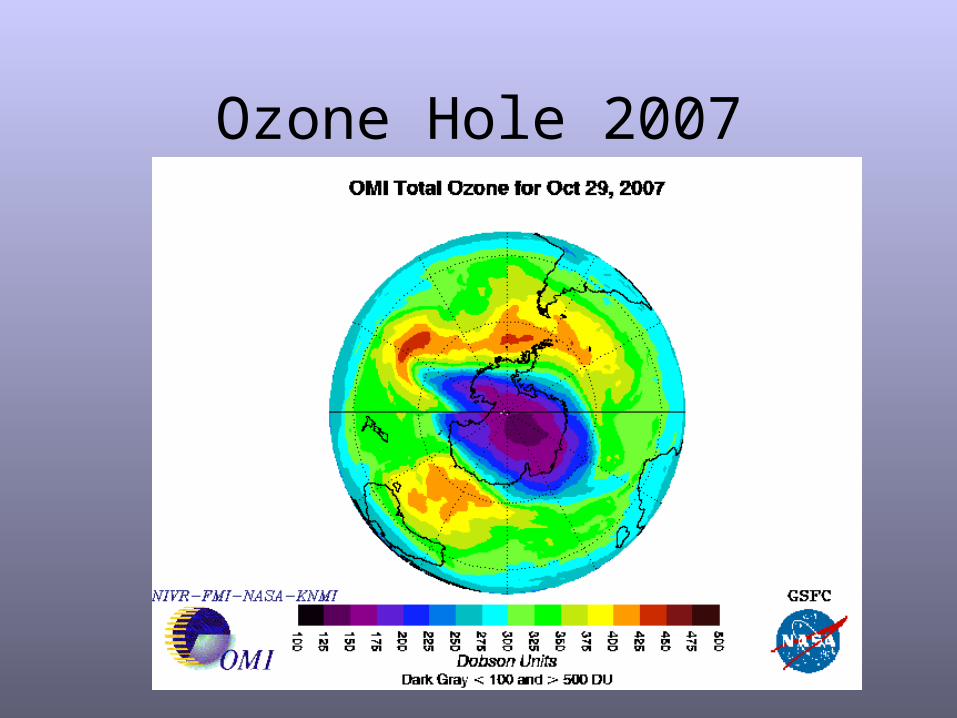
Ozone Hole 2007
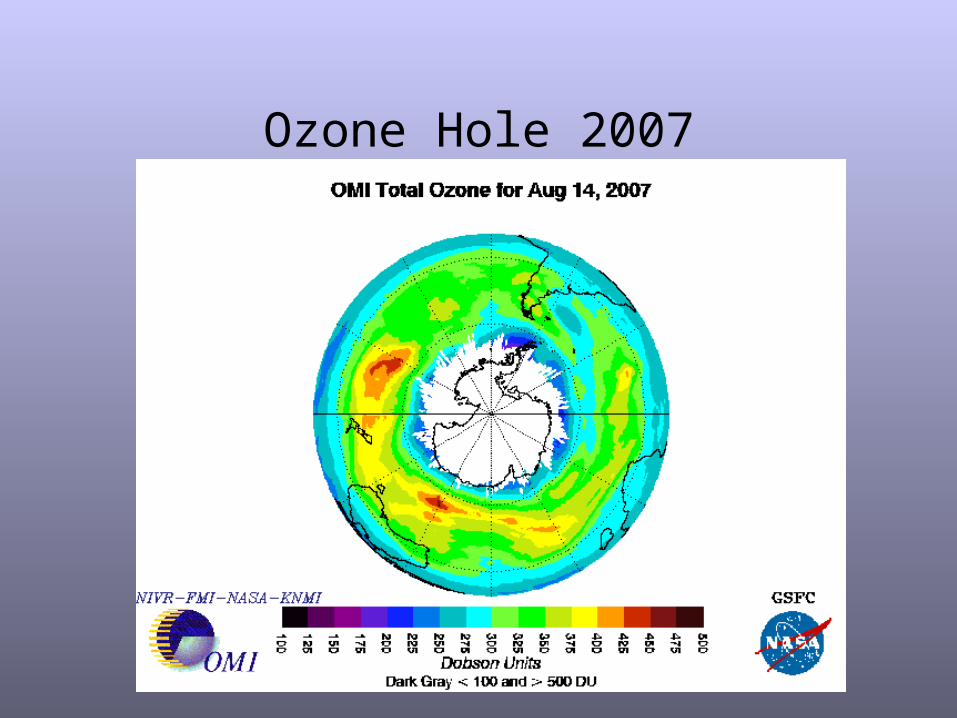
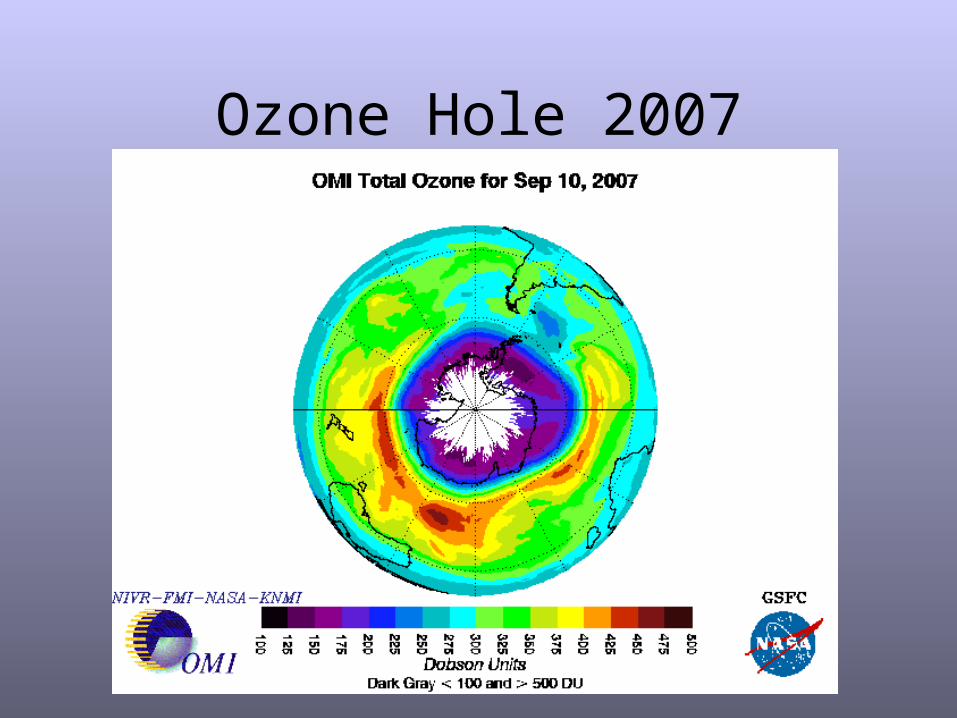
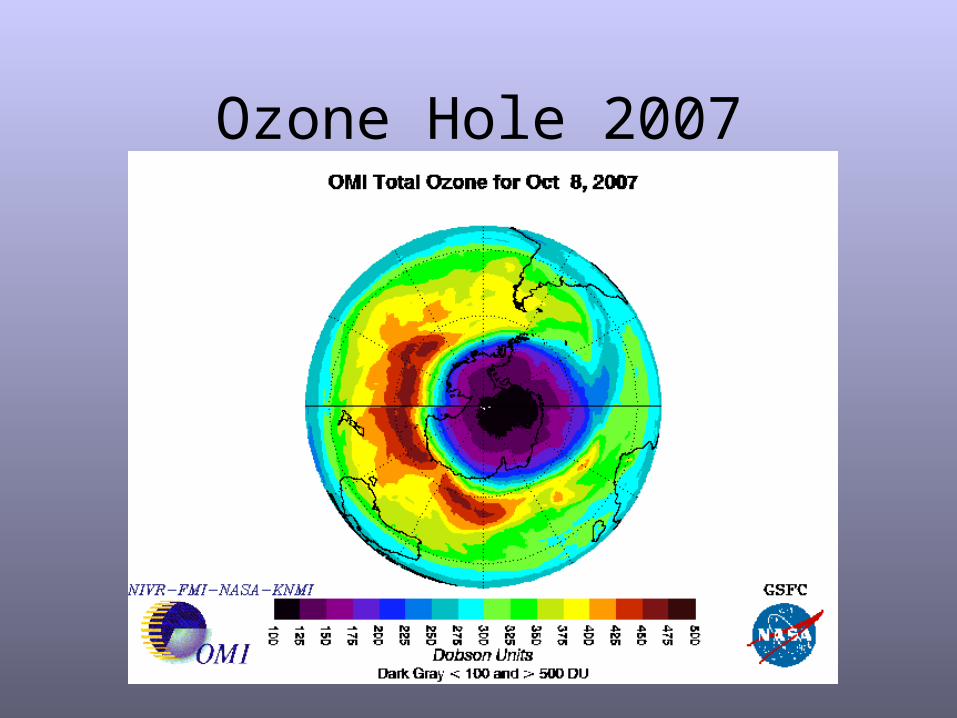
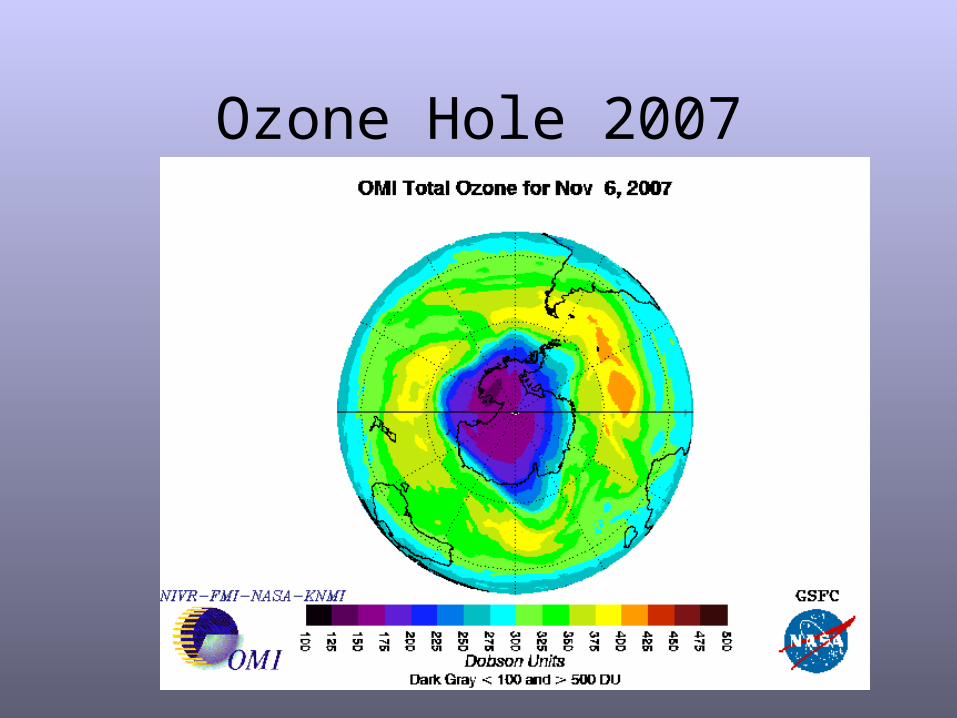
Ozone Hole 2007
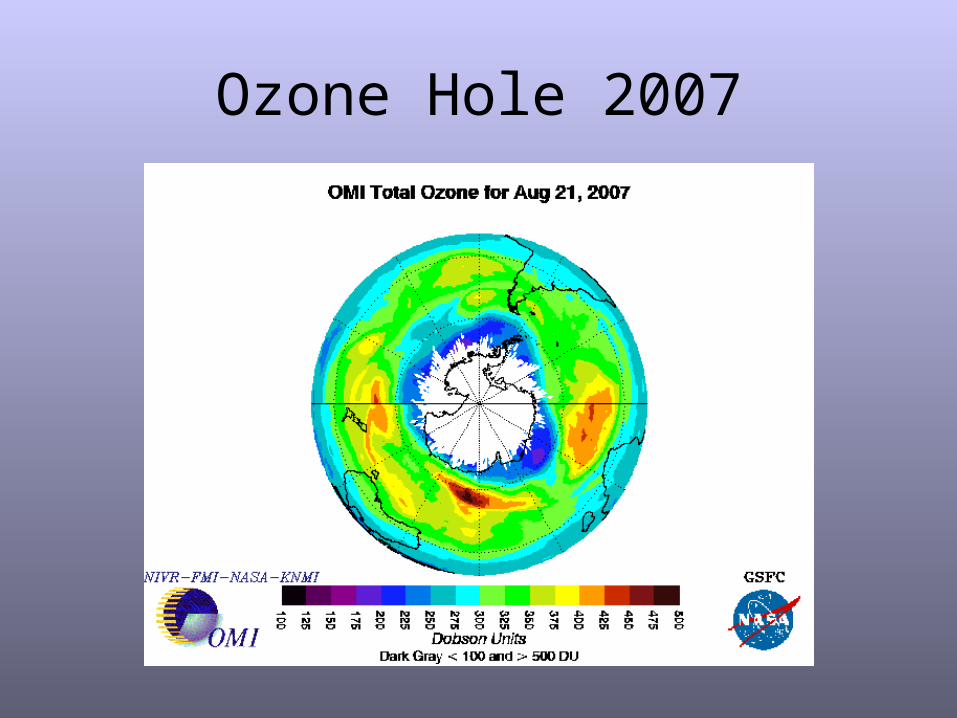
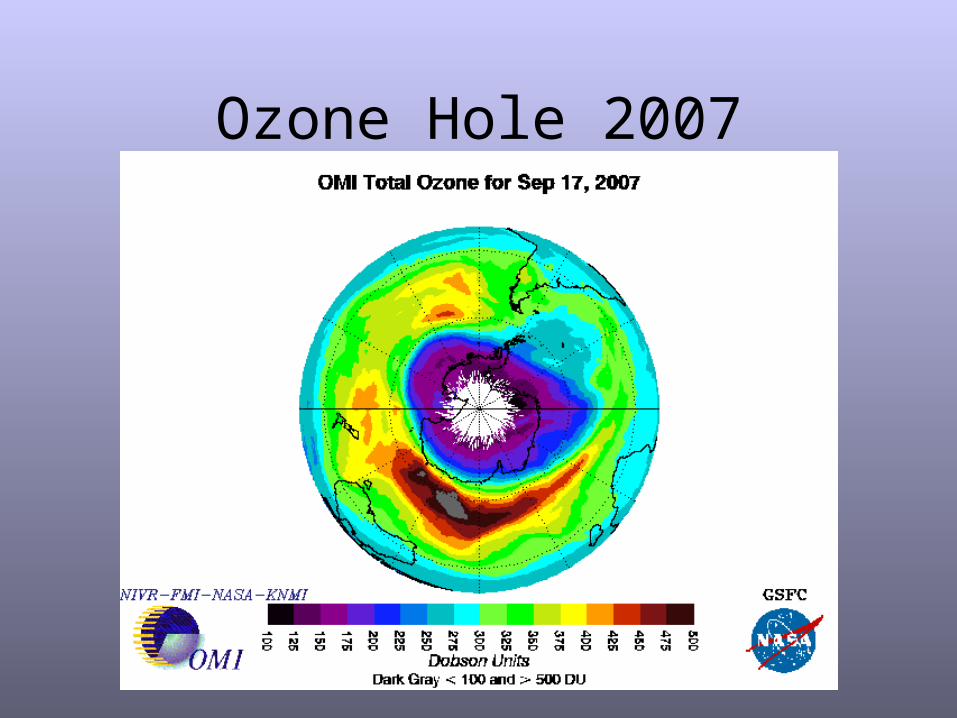
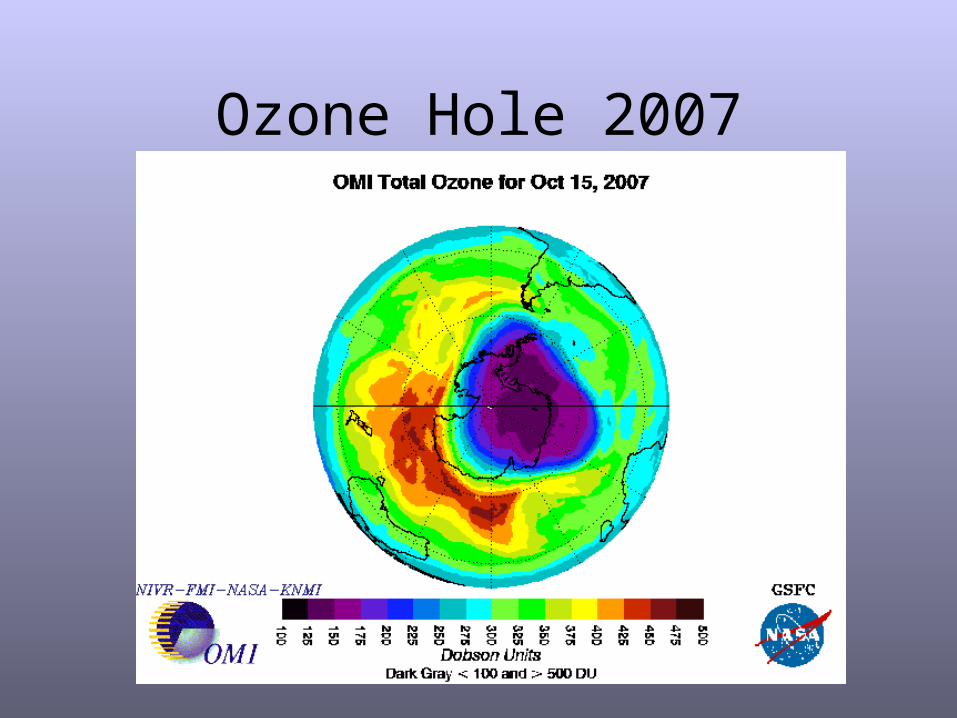
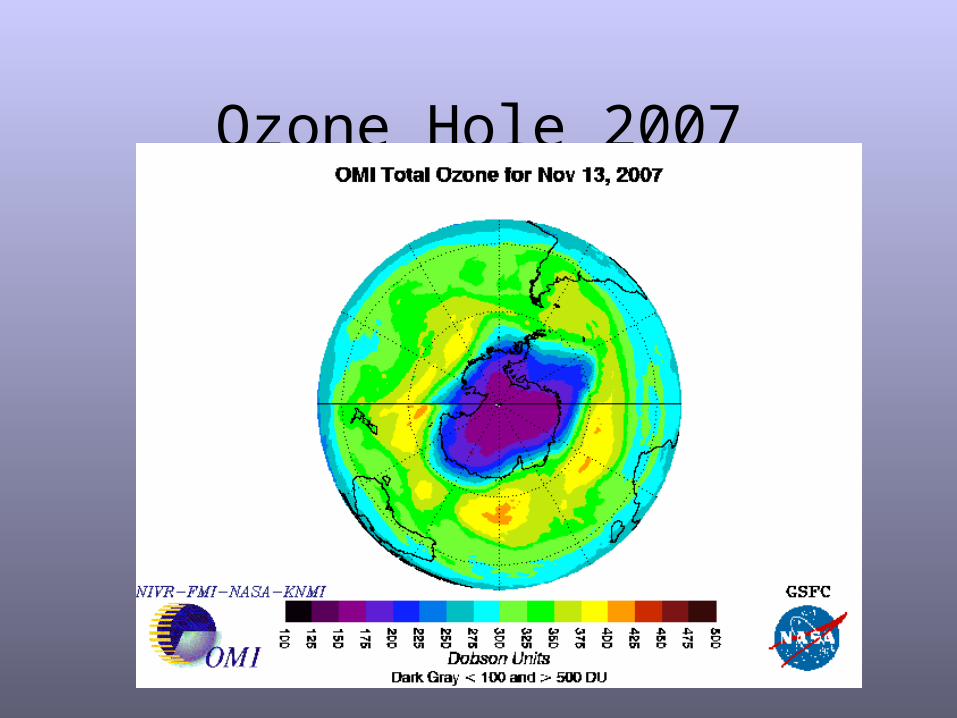
Ozone Hole 2007
Ozone Hole 2007
Ozone Hole 2007
Ozone Hole 2007
Ozone Hole 2007
Ozone Hole 2007
Ozone Hole 2007
Ozone Hole 2007
Ozone Hole 2007
Ozone Hole 2007
Ozone Hole 2007
Ozone Hole 2007
Ozone Hole 2007
Ozone Hole 2007
Ozone Hole 2007
Ozone Hole 2007
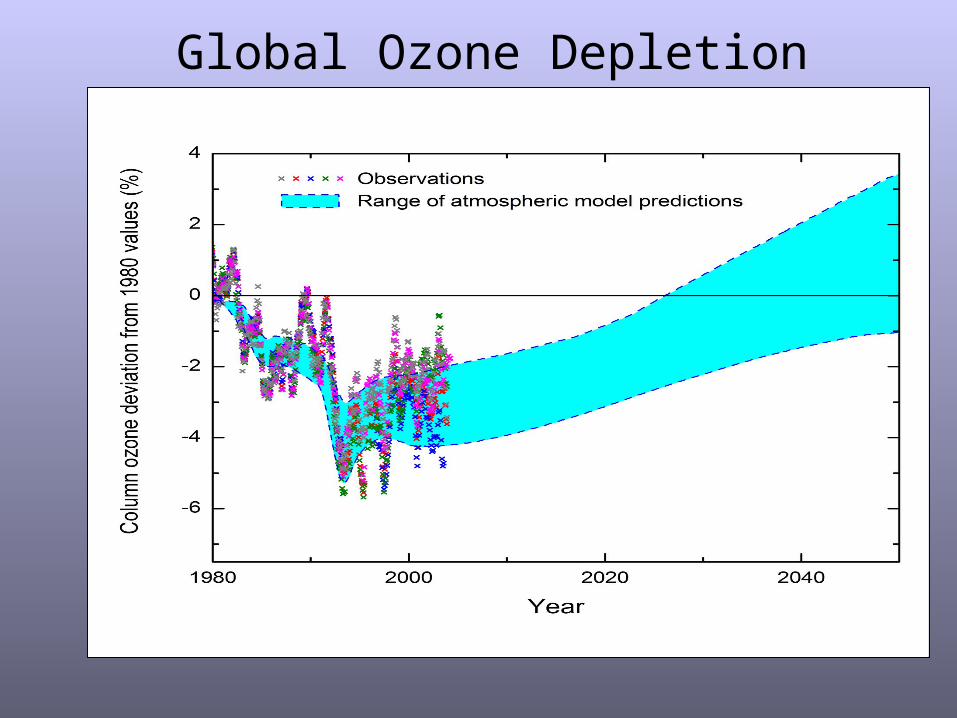
Global Ozone Depletion
Montreal Protocol International
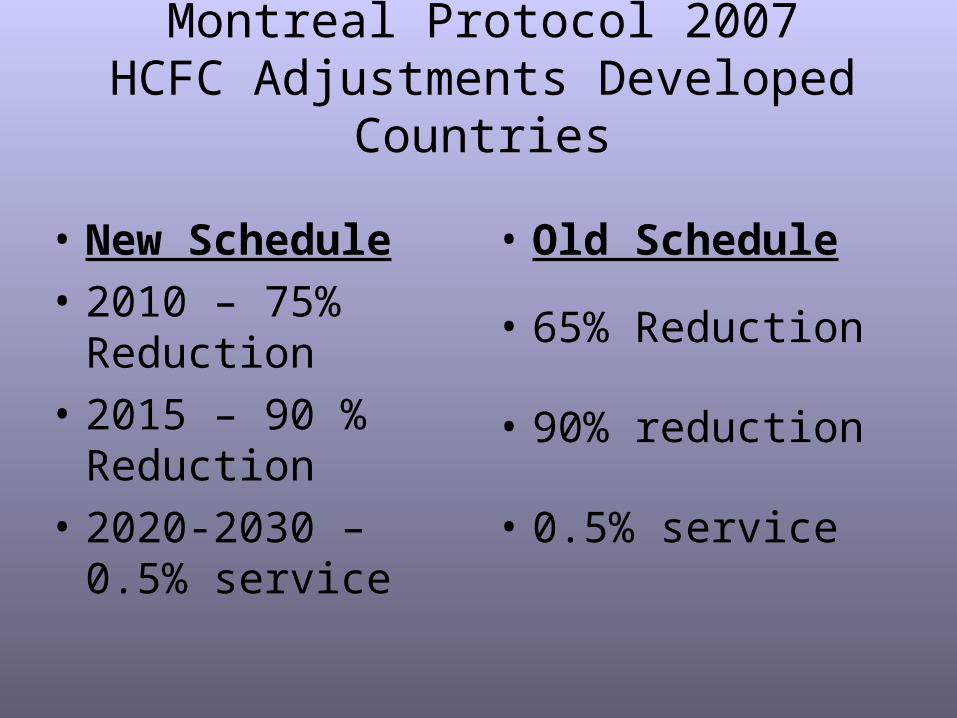
Montreal Protocol 2007HCFC Adjustments Developed Countries
• New Schedule
• 2010 – 75% Reduction
• 2015 – 90 % Reduction
• 2020-2030 – 0.5% service
• Old Schedule
• 65% Reduction
• 90% reduction
• 0.5% service
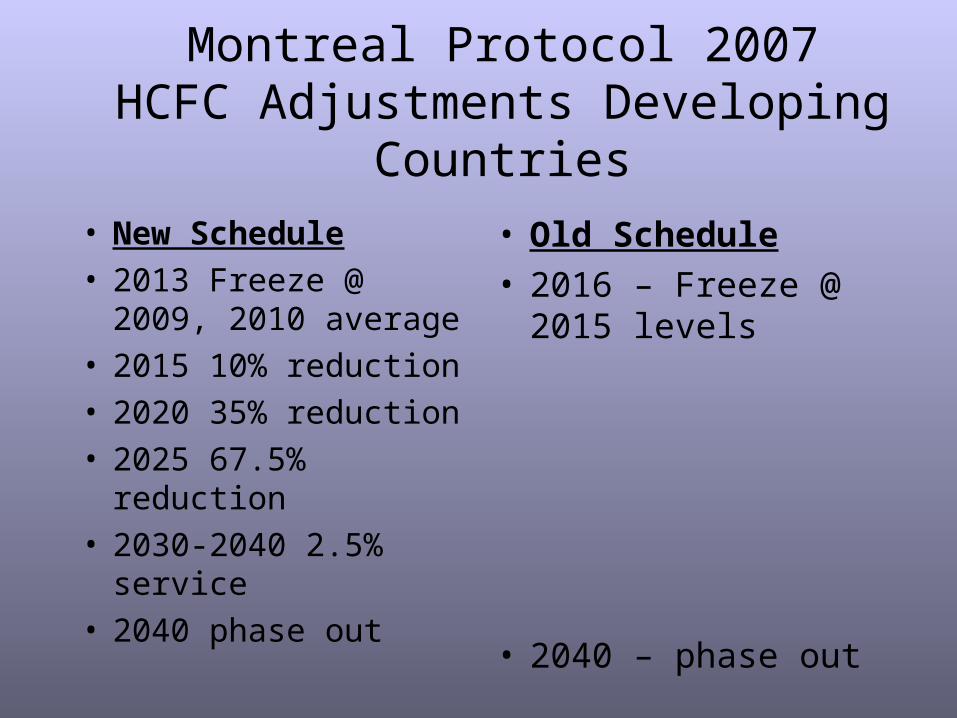
Montreal Protocol 2007HCFC Adjustments Developing Countries
• New Schedule• 2013 Freeze @ 2009,
2010 average• 2015 10% reduction• 2020 35% reduction• 2025 67.5% reduction• 2030-2040 2.5%
service• 2040 phase out
• Old Schedule• 2016 – Freeze @ 2015
levels
• 2040 – phase out
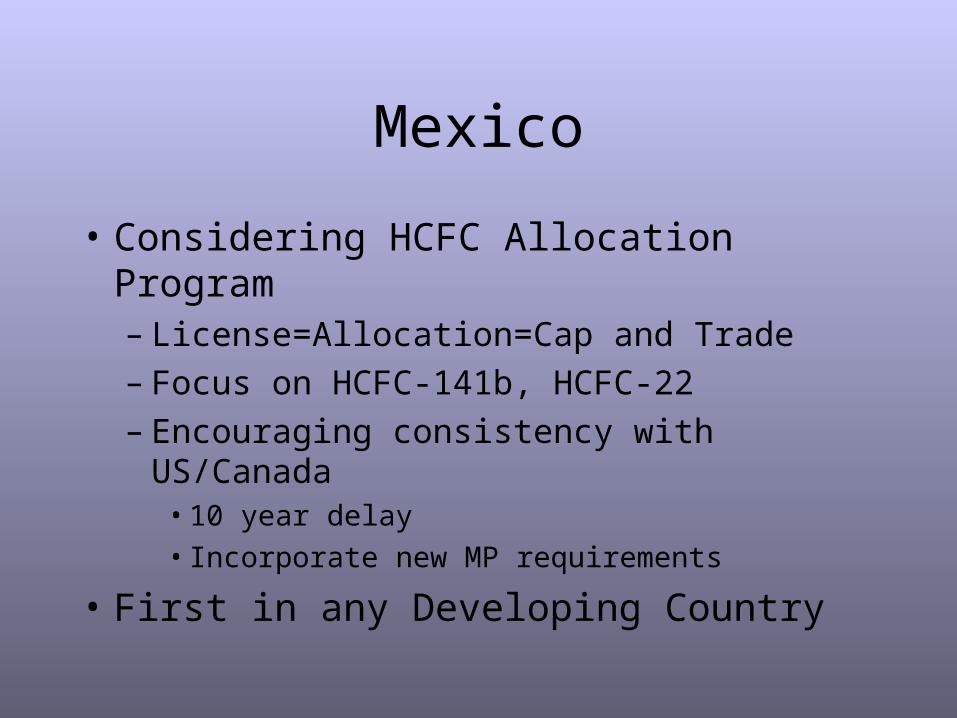
Mexico
• Considering HCFC Allocation Program– License=Allocation=Cap and Trade– Focus on HCFC-141b, HCFC-22– Encouraging consistency with US/Canada
• 10 year delay
• Incorporate new MP requirements
• First in any Developing Country
Refrigerant Responsible Use
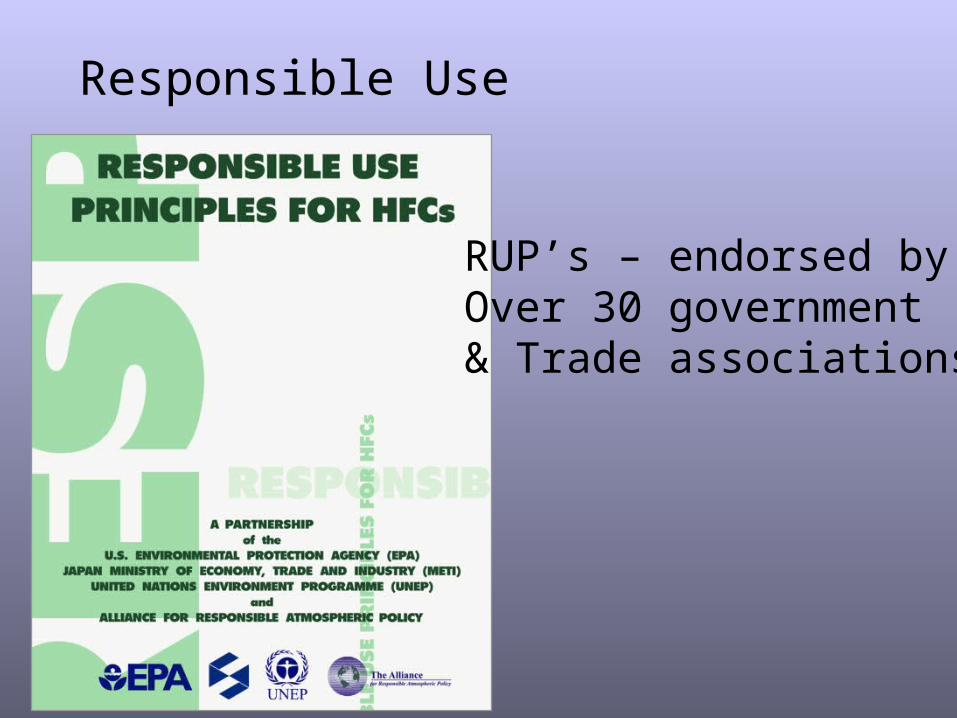
Responsible Use
RUP’s – endorsed byOver 30 government & Trade associations
Responsible Use Guide
• Current steps– Works w/i framework of RUP– Market Sector Specific– Being developed by each sector– Target audiences in developing countries– Voluntary development and implementation
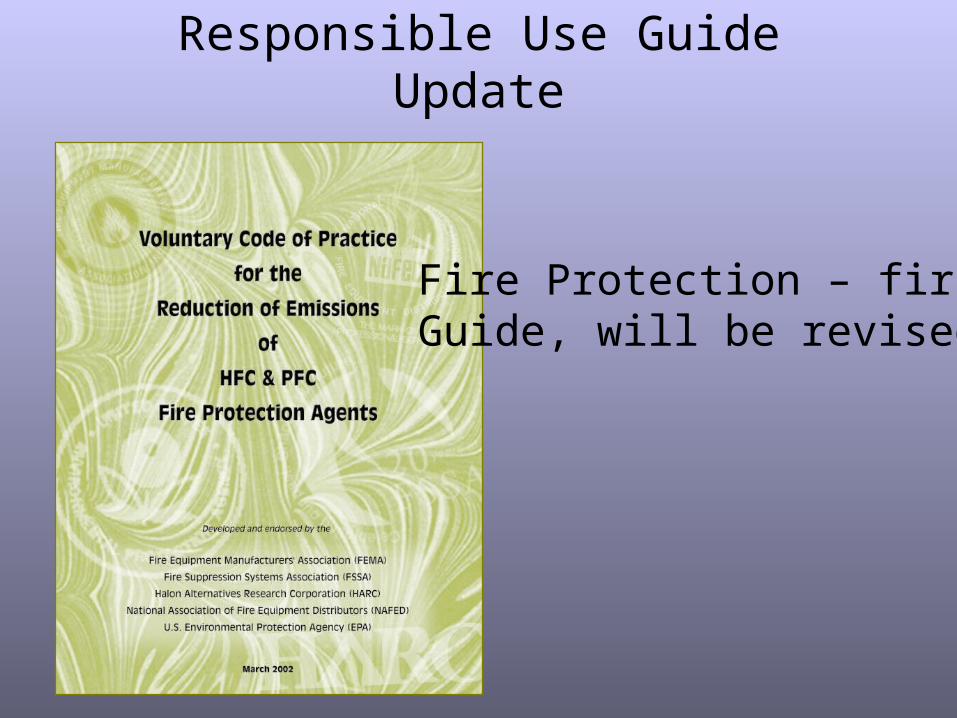
Responsible Use Guide Update
Fire Protection – first Guide, will be revised
Responsible Use Guide
Air conditioning &Refrigeration –The newest guide
Responsible Use Guides
Refrigerators – veryComprehensive forFoams & refrigeration
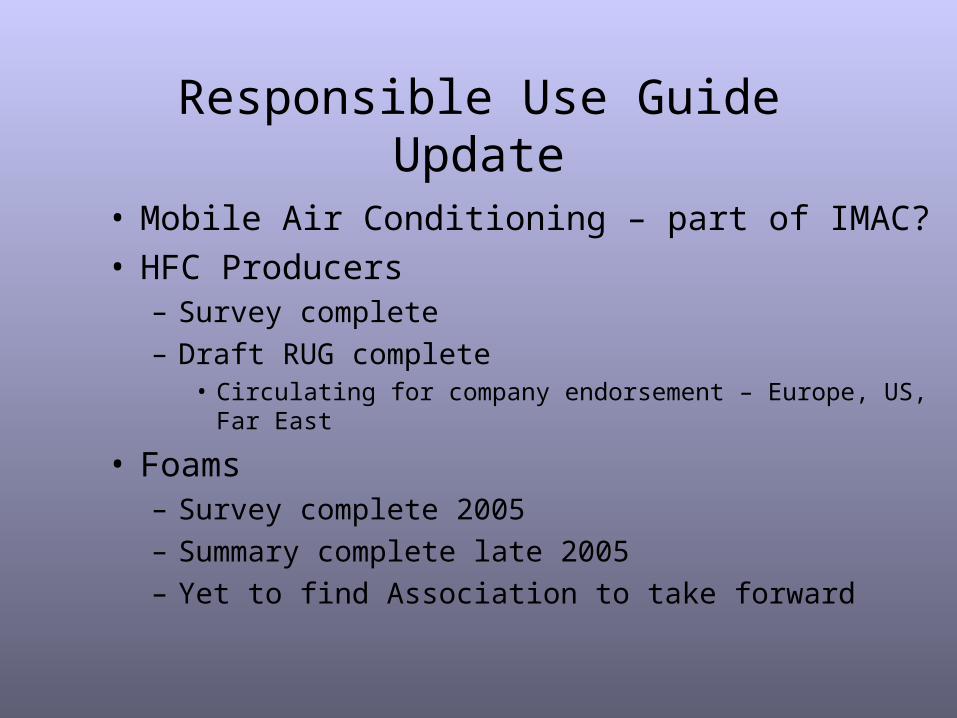
Responsible Use Guide Update
• Mobile Air Conditioning – part of IMAC?• HFC Producers
– Survey complete
– Draft RUG complete• Circulating for company endorsement – Europe, US, Far East
• Foams– Survey complete 2005
– Summary complete late 2005
– Yet to find Association to take forward
Personal Responses to Climate Change
Driving
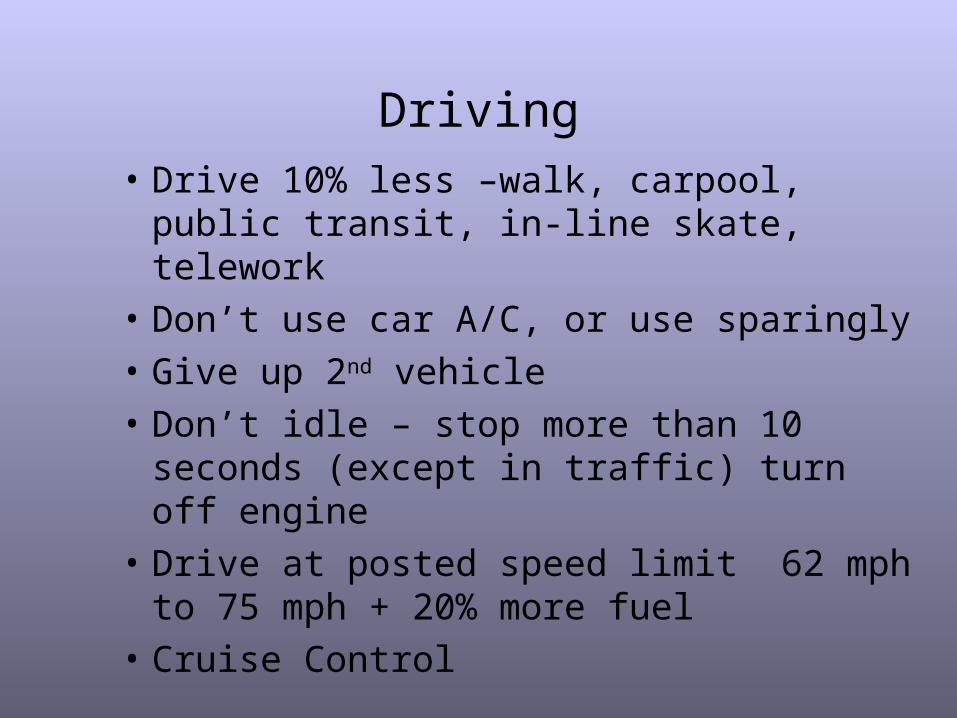
• Drive 10% less –walk, carpool, public transit, in-line skate, telework
• Don’t use car A/C, or use sparingly
• Give up 2nd vehicle
• Don’t idle – stop more than 10 seconds (except in traffic) turn off engine
• Drive at posted speed limit 62 mph to 75 mph + 20% more fuel
• Cruise Control
Driving
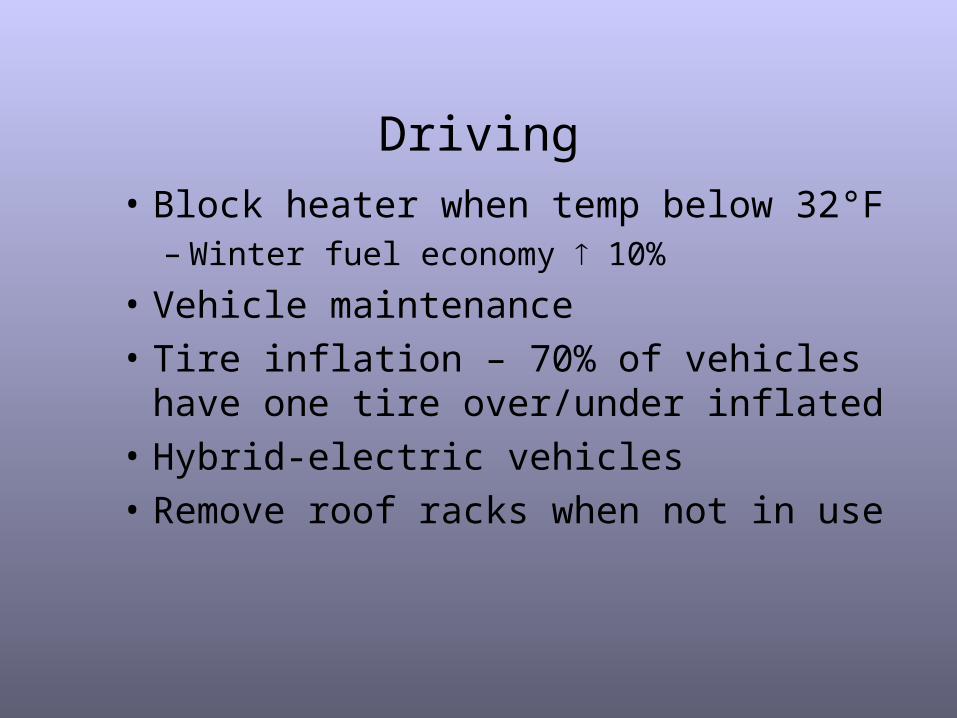
• Block heater when temp below 32°F– Winter fuel economy 10%
• Vehicle maintenance
• Tire inflation – 70% of vehicles have one tire over/under inflated
• Hybrid-electric vehicles
• Remove roof racks when not in use
Home
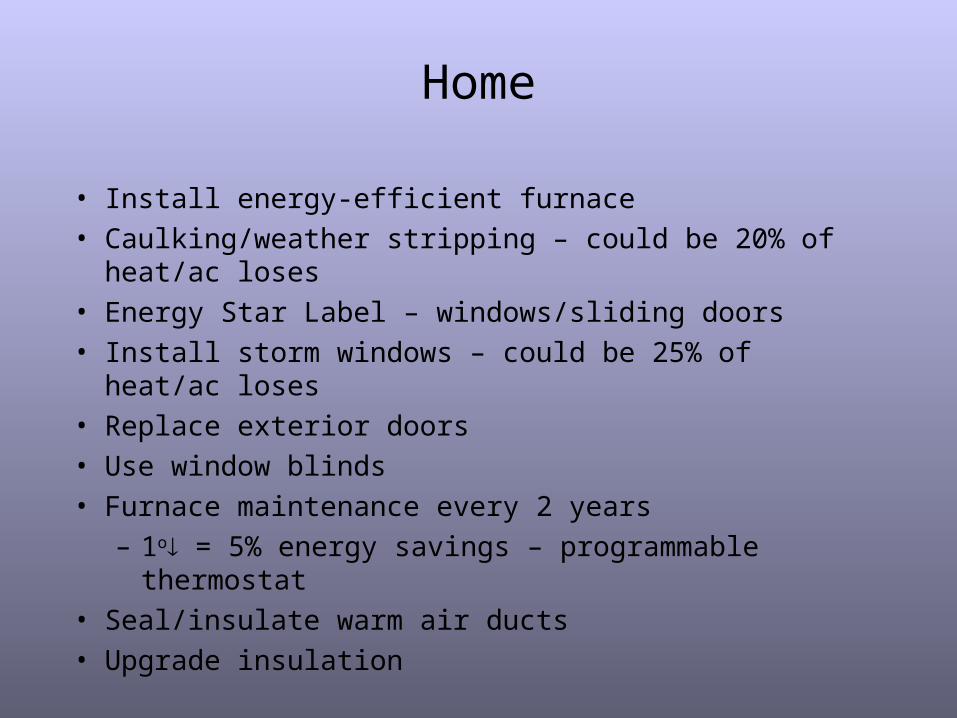
• Install energy-efficient furnace
• Caulking/weather stripping – could be 20% of heat/ac loses
• Energy Star Label – windows/sliding doors
• Install storm windows – could be 25% of heat/ac loses
• Replace exterior doors
• Use window blinds
• Furnace maintenance every 2 years
– 1o = 5% energy savings – programmable thermostat
• Seal/insulate warm air ducts
• Upgrade insulation
Home
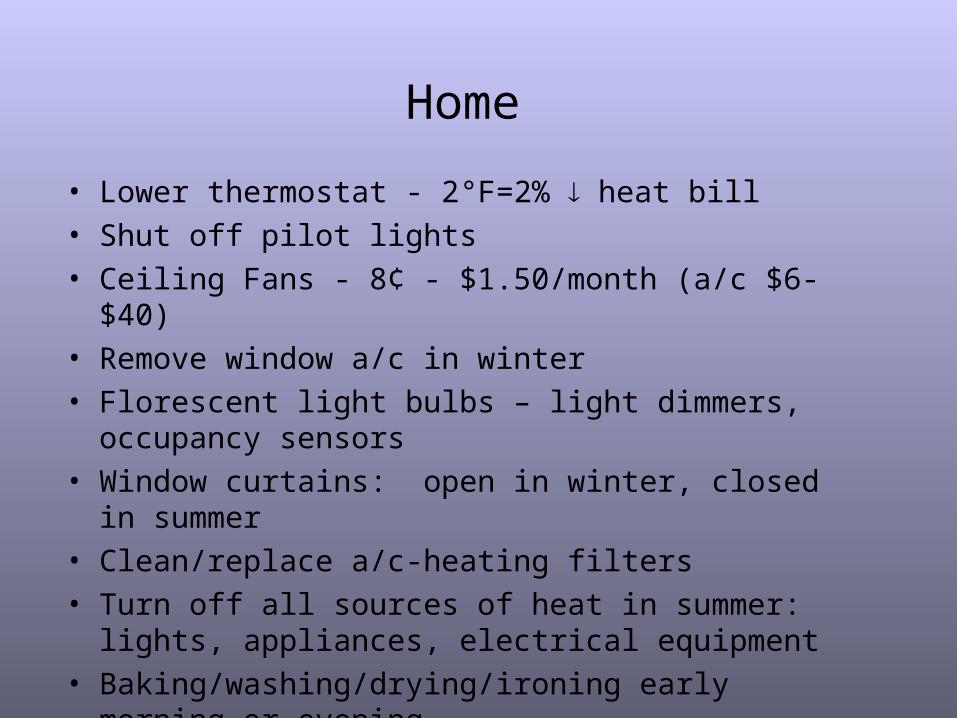
• Lower thermostat - 2°F=2% heat bill
• Shut off pilot lights
• Ceiling Fans - 8¢ - $1.50/month (a/c $6-$40)
• Remove window a/c in winter
• Florescent light bulbs – light dimmers, occupancy sensors
• Window curtains: open in winter, closed in summer
• Clean/replace a/c-heating filters
• Turn off all sources of heat in summer: lights, appliances, electrical equipment
• Baking/washing/drying/ironing early morning or evening
Appliances• Clean refrigerator coils regularly• Energy Star• Unplug second refrigerator or freezer• Dishwasher no-heat/air dry cycle, not hand wash• Maintain refrigerator @ 35°F, freezer @ 0°F• Cloths rinse in cold, wash in warm water• Don’t overdry, hang clothes to dry
– Purchase dryer with moisture sensor
• Hot water tank pre 2004, insulate
Appliances• Purchase front load washer – 40% less water per load
• Efficient light bulbs-LED or fluorescent
• Install outdoor automatic timers
• Computer system with energy-saver option
– Computer running full time: $70-$100 energy per year
– Use “sleep” or “hibernate” mode
– Smart Strip Power Strip
• Use as little paper as possible
• Buy right size monitor
• Turn off computer at night – 1/3rd left on
• 40% of appliance energy used when off
Lawn
• Capture/reuse rainwater
• Leave grass clippings on lawn
• Water early in morning
• Avoid chemical use
• Limit use of gas powered mowers, tools
• Pool efficiency
• Plant trees
Home Water
• Low-flow showerheads• High-efficiency water heaters• Quick showers• Avoid running the tap• Insulate water pipes – (not w/i 6” of exhaust
pipe)• Turn off cottage water heater• Turn water off when shaving/brushing teeth