db leverage conf final 2
TRANSCRIPT

Deutsche Bank Leveraged Finance Conference September 27, 2016

Disclaimer
This presentation and any related statements contain certain “forward-looking statements” about MPG’s financial results and estimates and business prospects within the meaning of the Private Securities Litigation Reform Act of 1995. Forward-looking statements may be identified by words such as “expects,” “intends,” “anticipates,” “plans,” “projects,” “believes,” “seeks,” “targets,” “forecasts,” “estimates,” “will” or other words of similar meaning and include, but are not limited to, statements regarding the outlook for the Company’s future business, prospects and financial performance; the industry outlook, our backlog and our 2016 financial guidance. Forward-looking statements are based on management’s current expectations and assumptions, which are subject to inherent uncertainties, risks and changes in circumstances that are difficult to predict. Actual outcomes and results may differ materially due to global political, economic, business, competitive, market, regulatory, and other factors and risks, among them being: volatility in the global economy impacting demand for new vehicles and our products; a decline in vehicle production levels, particularly with respect to platforms for which we are a significant supplier, or the financial distress of any of our major customers; cyclicality and seasonality in the light vehicle, industrial and commercial vehicle markets; our significant competition; our dependence on large-volume customers for current and future sales; a reduction in outsourcing by our customers, the loss or discontinuation of material production or programs, or a failure to secure sufficient alternative programs; our failure to offset continuing pressure from our customers to reduce our prices; our inability to realize all of the sales expected from awarded business or fully recover pre-production costs; our failure to increase production capacity or over-expanding our production in times of overcapacity; our reliance on key machinery and tooling to manufacture components for powertrain and safety-critical systems that cannot be easily replicated; program launch difficulties; a disruption in our supply or delivery chain which causes one or more of our customers to halt production; the damage to or termination of our relationships with key third-party suppliers; work stoppages or production limitations at one or more of our customer’s facilities; a catastrophic loss of one of our key manufacturing facilities; failure to protect our know-how and intellectual property; the disruption or harm to our business as a result of any acquisitions or joint ventures we make; a significant increase in the prices of raw materials and commodities we use; our failure to maintain our cost structure; the incurrence of significant costs if we close any of our manufacturing facilities; potential significant costs at our facility in Sandusky, Ohio; the incurrence of significant costs, liabilities, and obligations as a result of environmental requirements and other regulatory risks; extensive and growing governmental regulations; the incurrence of material costs related to legal proceedings; our inability to recruit and retain key personnel; any failure to maintain satisfactory labor relations; pension and other postretirement benefit obligations; risks related to our global operations; competitive threats posed by global operations and entering new markets; foreign exchange rate fluctuations; our substantial indebtedness; our inability, or the inability of our customers or our suppliers, to obtain and maintain sufficient debt financing, including working capital lines; our exposure to a number of different tax uncertainties; the mix of profits and losses in various jurisdictions adversely affecting our tax rate.
For the reasons described above, we caution you against relying on any forward-looking statements, which should also be read in conjunction with the other cautionary statements that are included elsewhere in this press release and in our public filings, including under the heading “Risk Factors” in our filings that we make from time to time with the Securities and Exchange Commission. You should not consider any list of such factors to be an exhaustive statement of all the risks, uncertainties, or potentially inaccurate assumptions that could cause our current expectations or beliefs to change. Further, any forward-looking statement speaks only as of the date on which it is made, and we undertake no obligation to update or revise any forward-looking statement to reflect events or circumstances after the date on which the statement is made or to reflect the occurrence of unanticipated events, except as otherwise may be required by law.
2

Non-GAAP Financial Measures
Combined Net Sales We define Combined Net Sales as the Net Sales of MPG plus the Net Sales of Grede prior to our acquisition of Grede. We present Combined Net Sales because our
management considers it to be a useful, supplemental indicator of our performance when comparing periods before and after our acquisition of Grede. For a reconciliation of Combined Net Sales to Net Sales, the most directly comparable U.S. generally accepted accounting principles “GAAP” measure, see Appendix to this presentation.
Adjusted EBITDA and Combined Adjusted EBITDAWe define Adjusted EBITDA as net income (loss) before interest expense, provision for (benefit from) income taxes and depreciation and amortization, with further
adjustments to reflect the additions and eliminations of certain income statement items, including (i) gains and losses on foreign currency and fixed assets and debt transaction expenses, (ii) stock-based compensation and other non-cash charges, (iii) sponsor management fees and other income and expense items that we consider to be not indicative of our ongoing operations, (iv) specified non-recurring items and (v) other adjustments. We define Combined Adjusted EBITDA as Adjusted EBITDA plus the Adjusted EBITDA of Grede prior to our acquisition of Grede. We believe Adjusted EBITDA is used by investors as a supplemental measure to evaluate the overall operating performance of companies in our industry. Management uses Adjusted EBITDA (i) as a measurement used in comparing our operating performance on a consistent basis, (ii) to calculate incentive compensation for our employees, (iii) for planning purposes, including the preparation of our internal annual operating budget, (iv) to evaluate the performance and effectiveness of our operational strategies and (v) to assess compliance with various metrics associated with our agreements governing our indebtedness. Accordingly, we believe that Adjusted EBITDA provides useful information to investors and others in understanding and evaluating our operating performance in the same manner as our management. We present Combined Adjusted EBITDA because our management considers it to be a useful, supplemental indicator of our performance when comparing periods before and after our acquisition of Grede. For a reconciliation of Adjusted EBITDA and Combined Adjusted EBITDA to income before tax, the most directly comparable measure determined under GAAP, see Appendix to this presentation.
Adjusted Free Cash Flow
We define Adjusted Free Cash Flow as Adjusted EBITDA less capital expenditures. Capital expenditures are on an accrual basis of accounting and can be calculated by taking the capital expenditures found in the investing section of our consolidated statements of cash flows and adjusting for the change in the period of the capital expenditure in accounts payables found in the supplemental cash flow information on our consolidated statements of cash flows. We present Adjusted Free Cash Flow because our management considers it to be a useful, supplemental indicator of our performance. When measured over time, Adjusted Free Cash Flow provides supplemental information to investors concerning our results of operations and our ability to generate cash flows to satisfy mandatory debt service requirements and make other non-discretionary expenditures. For a reconciliation of Adjusted Free Cash Flow to income before tax, the most directly comparable GAAP measure, see Appendix to this presentation.
Free Cash FlowWe define Free Cash Flow as net cash provided by operating activities, as stated on the Company’s condensed consolidated statement of cash flows, less capital
expenditures, as stated on the Company’s condensed consolidated statement of cash flows.
Adjusted EPSWe define Adjusted EPS as Adjusted Net Income Attributable to Stockholders, defined as net income attributable to stockholders before the after-tax impact of (i) gains
and losses on foreign currency transactions, including the re-measurement of the Company’s Euro denominated term loan (the “Euro Term Loan”), (ii) specific non-recurring items, and (iii) other adjustments, divided by the weighted average number of shares outstanding for the period on a diluted basis.
For a reconciliation of Adjusted EPS to diluted EPS, the most directly comparable measure determined under GAAP, see "RECONCILIATION OF ADJUSTED EPS TO US GAAP DILUTED EPS”.
3

BUSINESS OVERVIEW AND 2016 PRIORITIES

The MPG Story
5
MPG is a Powerful CashFlow Engine…
…Positioned for Long-Term
Growth
1. Based on 2015 Net Sales excluding wheel bearings
…with Strong Margins and Market Positions…
Q2 2016 LTM Results
• Adjusted EBITDA –Capex of $313 million
• Net Debt reduction and dividends of $119 million
• Adjusted EBITDA margin of 18%
• Processes • Forging• Ductile Iron Casting
• Products• Powertrain
Concentration in higher growth powertrain applications
73% of Net Sales1

The MPG Value Proposition
6
Leader in Advanced Metal Processes
UniqueCapabilities
Powerful Customer Value Proposition
• Broad range of metal forming processes
• Expertise in complex, highly engineered components
• Global footprint– ~60 locations
– 13 countries
– ~12,000 employees
• Leading NA capacity in supply constrained industry
• Light weighting and performance solutions
• Unique components for critical powertrain applications
• Seamless vertical integration capabilities

Broad Global Footprint
• ~60 locations in 13 countries
• Supports OEM global powertrain applications
• Leading NA capacity in supply constrained industry
• Expansion in both Mexico and China to support customer growth
7
U.S.
Brazil
South KoreaGermany
Mexico
England
Spain
Luxembourg
France
Czech Republic
China
India
Japan38
4
1
1
2
3
2
2
1
1
3
1
1
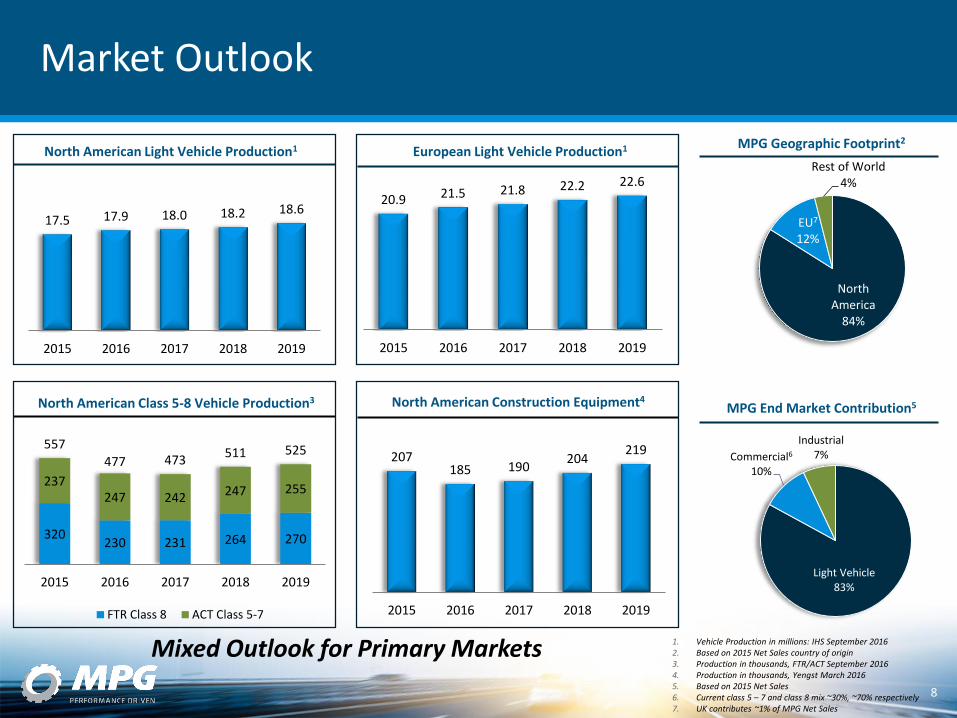
320230 231 264 270
237247 242 247 255
557477 473
511 525
2015 2016 2017 2018 2019
FTR Class 8 ACT Class 5-7
17.5 17.9 18.0 18.2 18.6
2015 2016 2017 2018 2019
20.9 21.5 21.8 22.2 22.6
2015 2016 2017 2018 2019
Mixed Outlook for Primary Markets 1. Vehicle Production in millions: IHS September 20162. Based on 2015 Net Sales country of origin3. Production in thousands, FTR/ACT September 20164. Production in thousands, Yengst March 20165. Based on 2015 Net Sales6. Current class 5 – 7 and class 8 mix ~30%, ~70% respectively 7. UK contributes ~1% of MPG Net Sales
MPG Geographic Footprint2
North American Light Vehicle Production1 European Light Vehicle Production1
Market Outlook
North America
84%
EU7
12%
Rest of World4%
North American Construction Equipment4North American Class 5-8 Vehicle Production3
Light Vehicle83%
Commercial6
10%
Industrial7%
MPG End Market Contribution5
8
207185 190
204219
2015 2016 2017 2018 2019
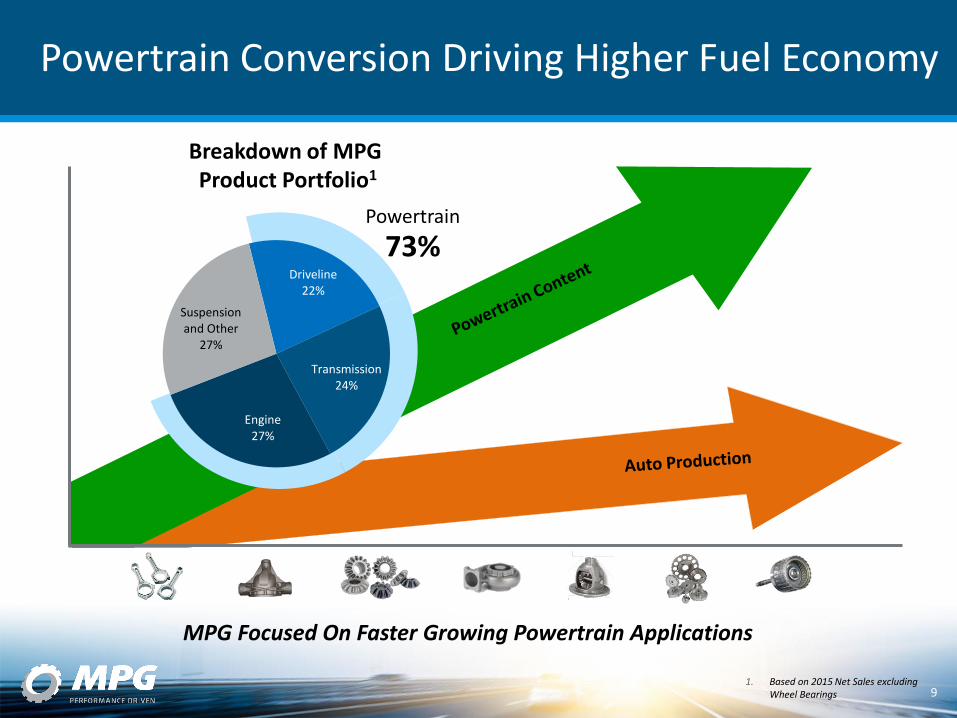
Driveline22%
Transmission24%
Engine27%
Suspension and Other
27%
1. Based on 2015 Net Sales excluding Wheel Bearings
Powertrain Conversion Driving Higher Fuel Economy
Breakdown of MPG Product Portfolio1
Powertrain
73%
9
MPG Focused On Faster Growing Powertrain Applications

MPG Drives Fuel Efficiency
10
Light Weighting
Vibration Reduction
Noise Reduction
Strength
MPG Engineered Solutions
• Powertrain Conversions− Downsizing of
Engines
− Higher speed transmissions
• Vehicle weight reduction
Supporting Industry Trends
Industry Focus
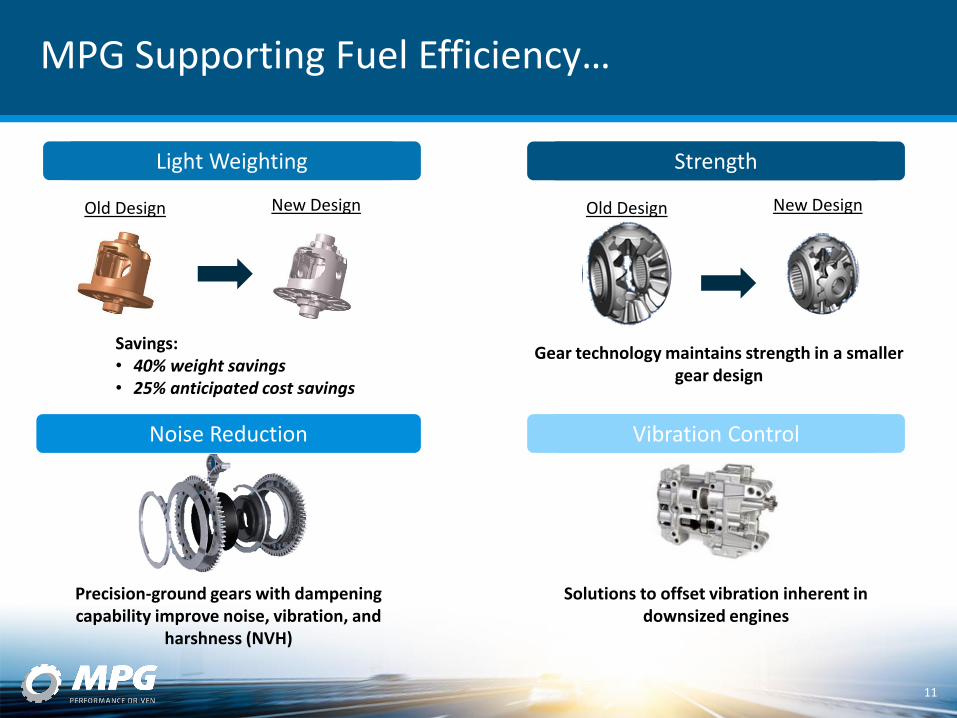
MPG Supporting Fuel Efficiency…
11
Old Design New Design
Savings:• 40% weight savings• 25% anticipated cost savings
Light Weighting
Solutions to offset vibration inherent in downsized engines
Precision-ground gears with dampening capability improve noise, vibration, and
harshness (NVH)
Vibration ControlNoise Reduction
Strength
Old Design New Design
Gear technology maintains strength in a smaller gear design

… Leading to Profitable Growth
$672$727
$392
$400
$600
2014 2015 2016
YTD3
1. New business is peak annual Net Sales. Programs generally launch and ramp up over the next 5 years.
2. Combined Metaldyne, HHI, and Grede 2014 New Business Awards
3. Through August 31, 2016
New Business Awards1
$ in millions
Original Goal
12
On pace to book ~$2 billion of New Business Awards
2016 Forecast
2
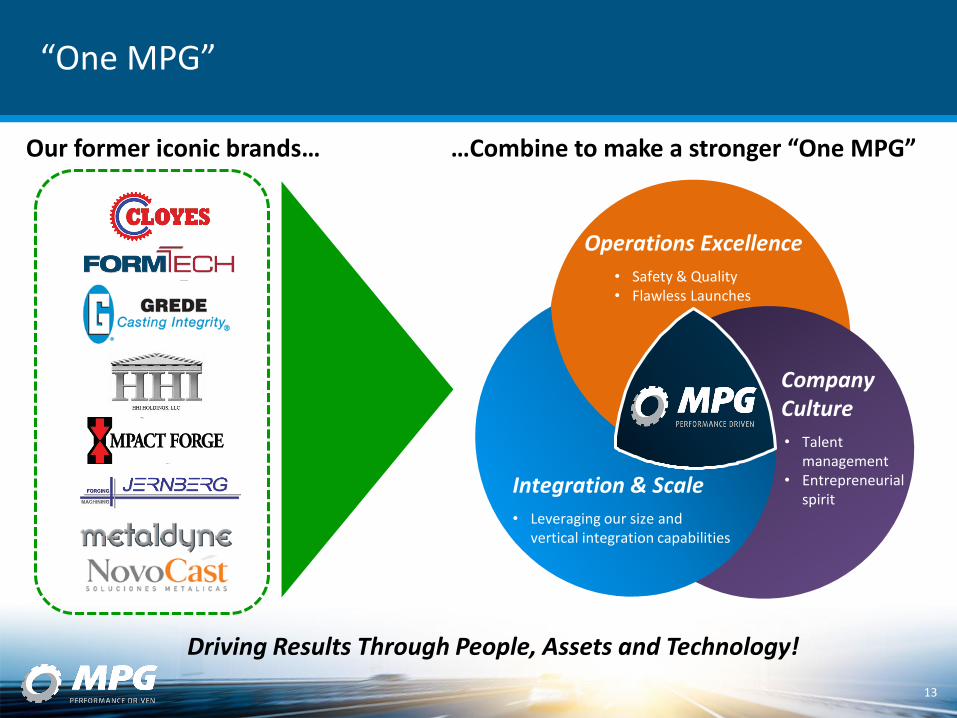
“One MPG”
Driving Results Through People, Assets and Technology!
13
Company Culture
• Talent management
• Entrepreneurialspirit
Integration & Scale
• Leveraging our size and vertical integration capabilities
Operations Excellence
• Safety & Quality • Flawless Launches
Our former iconic brands… …Combine to make a stronger “One MPG”

Brillion Acquisition
• MPG Strategy – Opportunistic acquisition - $14 million purchase price
– Industry consolidation; similar equipment, process, and products
– Acquisition brings:
• Book of business – ~$66 million LTM revenue
• EBITDA/Cash Flow – Relocation and transition investment in 2016; positive EBITDA/Cash Flow anticipated in 2017
• Equipment – Brillion recently invested in new equipment which will be transferred to other MPG facilities
$158
$109$132
$95$66
$33
$20
$6
$9
-$2
-$9 -$4-10
-5
0
5
10
15
20
25
-50
0
50
100
150
200
2012 2013 2014 2015 2016 LTM 2016 YTD
Sales
Adj. EBITDA
1. LTM and YTD financials as of Q2 20162. All financial information from ACW company presentations
Select Customers
1
Brillion Sales and EBITDA
14
$ in millions
1

FINANCIALS AND 2016 OUTLOOK

Financial Results
Second Quarter Second Quarter YTD
2016 2015 2016 2015
Net Sales $728 $800 $1,468 $1,565
Adjusted EBITDA1 $135 $154 $273 $286
Adjusted EBITDA margin 18.6% 19.2% 18.6% 18.3%
Capital Expenditures2 $46 $52 $91 $98
Free Cash Flow3 $24 $11 $33 $3
Adjusted Free Cash Flow2 $89 $102 $182 $188
Adjusted Free Cash Flow margin 12.2% 12.8% 12.4% 12.0%
Fully Diluted EPS $0.51 $0.64 $0.87 $1.11
Adjusted EPS1 $0.49 $0.69 $1.04 $1.12
1. See Appendix for reconciliation to GAAP2. Capital Expenditures on an accrual basis, See
definition of Adjusted Free Cash Flow3. Net cash provided by operating activities less
capital expenditures
Overall Strong Financial Results
$ in million USD rounded except EPS
16

$800 $759 $728
0 (17)(24) (10)
(28) 7
Q2 2015 Foreign Currency Metals Planned Attritionof Non-Core Wheel
Bearings
Q2 2015 Adj. forMacro Effects andPlanned Attrition
Price Industrial/Commercial
Light Vehicle Q2 2016
Second Quarter Bridge 2015 – 2016 N
et
Sale
sA
dju
ste
d E
BIT
DA
1
17
Macro Effects
$154 $148 $135
1 4 (11)(10) (3) 0
Q2 2015 Foreign Currency Metals Planned Attrition ofNon-Core Wheel
Bearings
Q2 2015 Adj. forMacro Effects andPlanned Attrition
Price All Other Vol/Mix Net Perf/Econ/CostRed/Other
Q2 2016
1. See Appendix for reconciliation to GAAP
$ in million USD rounded

$1,565 $1,466 $1,468
(4)(54) (41) (14) (47) 63
Q2 YTD 2015 Foreign Currency Metals Planned Attritionof Non-Core Wheel
Bearings
Q2 2015 Adj. forMacro Effects andPlanned Attrition
Price Industrial/Commercial
Light Vehicle Q2 YTD 2016
Second Quarter YTD Bridge 2015 – 2016 N
et
Sale
sA
dju
ste
d E
BIT
DA
1
18
Macro Effects
$286 $271 $273
1 5 (21) (14) 9 7
Q2 YTD 2015 Foreign Currency Metals Planned Attrition ofNon-core wheel
bearings
Q2 YTD 2015 Adj.for Macro Effects
and PlannedAttrition
Price All other Vol/Mix Net Perf/Econ/CostRed
Q2 YTD 2016
1. See Appendix for reconciliation to GAAP
$ in million USD rounded
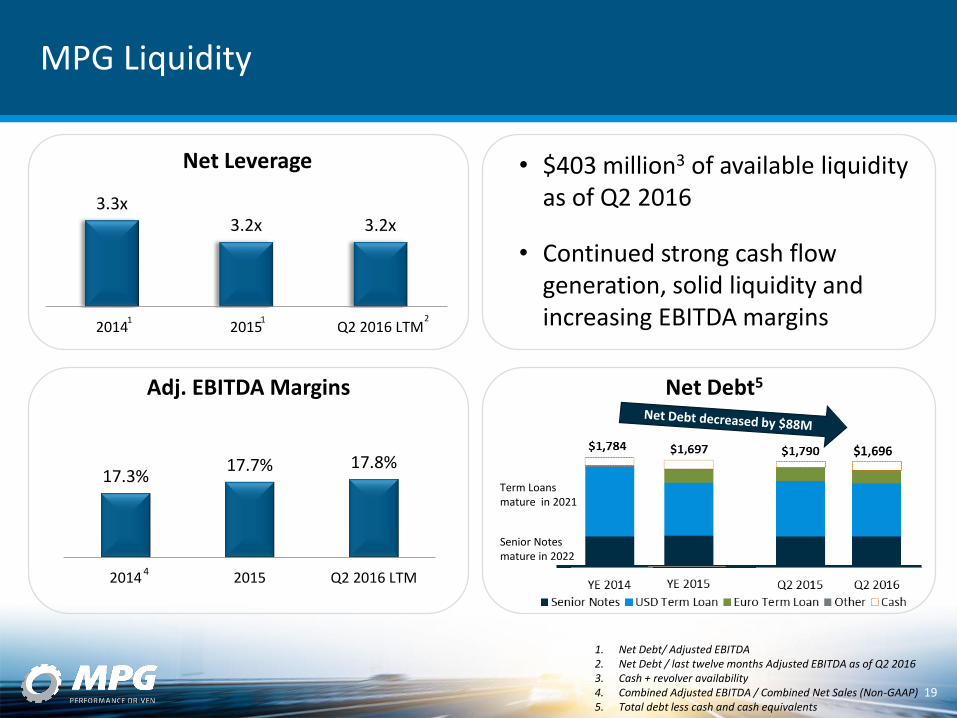
MPG Liquidity
19
3.3x3.2x 3.2x
2014 2015 Q2 2016 LTM
Net Leverage • $403 million3 of available liquidity as of Q2 2016
• Continued strong cash flow generation, solid liquidity and increasing EBITDA margins
17.3%17.7% 17.8%
2014 2015 Q2 2016 LTM
Adj. EBITDA Margins Net Debt5
Senior Notes mature in 2022
Term Loans mature in 2021
1. Net Debt/ Adjusted EBITDA2. Net Debt / last twelve months Adjusted EBITDA as of Q2 20163. Cash + revolver availability4. Combined Adjusted EBITDA / Combined Net Sales (Non-GAAP)5. Total debt less cash and cash equivalents
4
211

Reinvesting in the Business
Continuing to build backlog with new business awards and capital investment thatsupports future growth and returns
Accelerate our Shareholder Value
Cash flow to reduce net debt and repurchase shares
• Share repurchase upsized to $35M
• Voluntary debt reduction plan of $10M
Rewarding our Shareholders
$0.0925 per share dividend declared
$3.0 million in debt payments and $11.8 million in share repurchases
$45.5 million in capital investment1
Dividend declared of $6.3 million
Balanced Use of Cash Flow
Q2 2016 Shareholder Value Creation
Val
ue
Cre
atio
n
1. Capital Expenditures On an accrual basis, See definition of Adjusted Free Cash Flow
20

Why Invest in MPG – Continued Shareholder Value Creation and Long-Term Growth
~$3B
2016 Guidance
• Adj. Free Cash Flow1: $310 – $330 million
• Free Cash Flow3: ~$145 million
• Adj. EBITDA margin: ~18%
Q2 2016 Results
• Adj. Free Cash Flow1: $89 million
• Adj. EBITDA margin: 18.6%
• New business wins2: $392 million YTD
Near-Term Focus
1. Capital Expenditures on an accrual basis, See definition of Adjusted Free Cash Flow
2. Based on peak Net Sales; through August 20163. Net cash provided by operating activities less Capex
(cash basis)
Targeted Growth
$4BNet Sales
• Execute on new business wins
• Realize growth in value-added, powertrain content
• Continue strategic global expansion
Future Drivers
21

APPENDIX
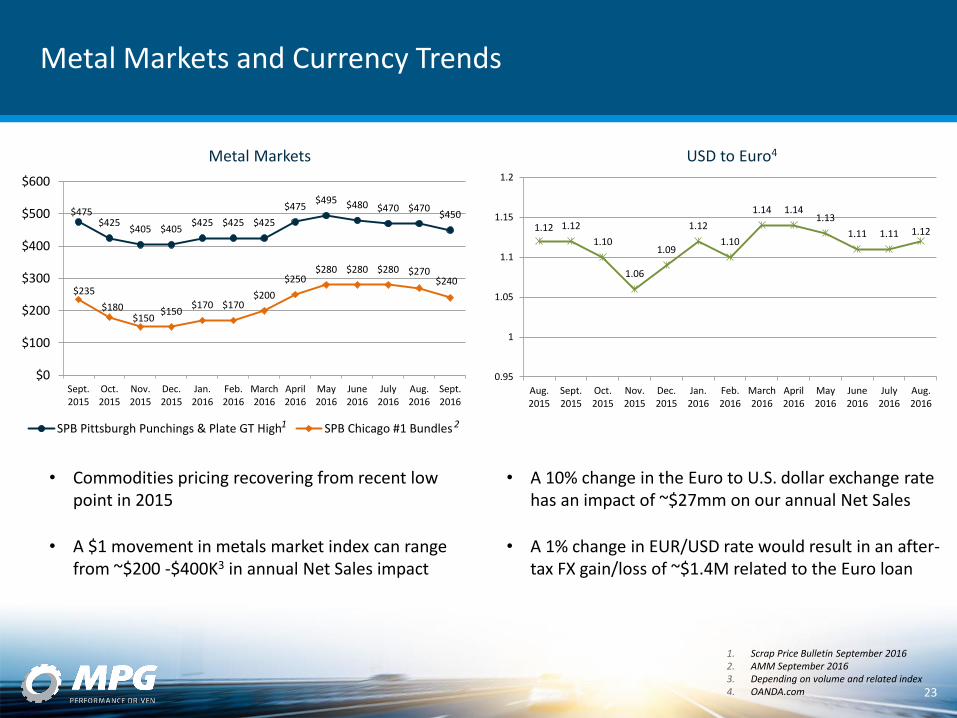
Metal Markets and Currency Trends
23
1. Scrap Price Bulletin September 20162. AMM September 20163. Depending on volume and related index4. OANDA.com
Metal Markets USD to Euro4
$475$425
$405 $405$425 $425 $425
$475$495 $480 $470 $470
$450
$235
$180$150
$150$170 $170
$200
$250$280 $280 $280 $270
$240
$0
$100
$200
$300
$400
$500
$600
Sept.2015
Oct.2015
Nov.2015
Dec.2015
Jan.2016
Feb.2016
March2016
April2016
May2016
June2016
July2016
Aug.2016
Sept.2016
SPB Pittsburgh Punchings & Plate GT High SPB Chicago #1 Bundles
1.12 1.12
1.10
1.06
1.09
1.12
1.10
1.14 1.141.13
1.11 1.11 1.12
0.95
1
1.05
1.1
1.15
1.2
Aug.2015
Sept.2015
Oct.2015
Nov.2015
Dec.2015
Jan.2016
Feb.2016
March2016
April2016
May2016
June2016
July2016
Aug.2016
1 2
• Commodities pricing recovering from recent low point in 2015
• A $1 movement in metals market index can range from ~$200 -$400K3 in annual Net Sales impact
• A 10% change in the Euro to U.S. dollar exchange rate has an impact of ~$27mm on our annual Net Sales
• A 1% change in EUR/USD rate would result in an after-tax FX gain/loss of ~$1.4M related to the Euro loan

Reconciliation of Adjusted EPS to U.S. GAAP Diluted EPS
24
METALDYNE PERFORMANCE GROUP INC.
RECONCILIATION OF ADJUSTED EPS
TO US GAAP DILUTED EPS
(In millions except per share amounts)Quarter Ended Six Months Ended
July 3, 2016 June 28, 2015 July 3, 2016 June 28, 2015
Net income attributable to stockholders $ 35.5 44.1 $ 60.4 76.5
Weighted average shares outstanding - Diluted 69.8 68.7 69.3 68.7
Net income per share attributable to stockholders - Diluted $ 0.51 0.64 $ 0.87 1.11
Adjustments to Arrive at Adjusted Net Income Attributable to Stockholders
Loss (gain) on re-measurement of Euro Term Loan $ (5.5) (4.1) $ 5.5 (4.1)
Loss (gain) on foreign currency transactions - other (2.6) 0.2 0.7 (4.8)
Loss on debt extinguishment — 0.4 — 0.4
Debt transaction expenses — 1.6 — 1.7
Non-recurring acquisition related items 2.1 0.4 3.4 0.1
Non-recurring operational items (1) 3.8 6.7 6.0 7.1
Tax impact of adjustments to net income attributable to stockholders 0.6 (1.6) (4.0) (0.1)
Adjusted Net Income Attributable to Stockholders $ 33.9 47.7 72.0 76.8
Weighted average shares outstanding - Diluted 69.8 68.7 69.3 68.7
Adjusted EPS $ 0.49 0.69 $ 1.04 1.12
(1) Included in non-recurring operational items are impairment charges and exit costs associated with the closures of Grede's Berlin, Wisconsin, and Bessemer,
Alabama facilities.

Reconciliation of Income Before Tax to Adjusted EBITDA and Adjusted Free Cash Flow
25
RECONCILIATION OF US GAAP INCOME BEFORE TAX TO
ADJUSTED EBITDA AND ADJUSTED FREE CASH FLOW
(In millions)
Quarter Ended Six Months Ended
July 3, 2016 June 28, 2015 July 3, 2016 June 28, 2015
Income before tax $ 50.7 58.3 $ 84.9 108.2
Addbacks to Arrive at Unadjusted EBITDA
Interest expense, net 25.9 26.9 52.4 54.5
Depreciation and amortization 55.4 58.8 110.6 115.2
Unadjusted EBITDA $ 132.0 144.0 $ 247.9 277.9
Adjustments to Arrive at Adjusted EBITDA
Loss (gain) on foreign currency (8.1) (3.9) 6.2 (8.9)
Loss on fixed assets 0.9 0.2 1.2 0.4
Loss on debt extinguishment 0.0 0.4 — 0.4
Debt transaction expenses — 1.6 — 1.7
Stock-based compensation expense 4.5 4.2 8.2 7.5
Non-recurring acquisition related items 2.1 0.4 3.4 0.1
Non-recurring operational items (1) 3.8 6.7 6.0 7.1
Adjusted EBITDA $ 135.2 153.6 $ 272.9 286.2
Capital expenditures (2) 45.5 51.8 90.5 97.9
Adjusted Free Cash Flow $ 89.7 101.8 $ 182.4 188.3
(1) Included in non-recurring operational items are impairment charges and exit costs associated with the closures of Grede's Berlin, Wisconsin, and Bessemer,
Alabama facilities.
(2) Capital expenditures are shown on an accrual basis as described in the definition of Adjusted Free Cash Flow.

2016 GAAP Reconciliation
26
METALDYNE PERFORMANCE GROUP INC.
RECONCILIATION OF 2016 GUIDANCE
INCOME BEFORE TAX TO ADJUSTED EBITDA AND ADJUSTED
FREE CASH FLOW
(In millions)
2016 Guidance 2016 Guidance
Low End of Range High End of Range
Income before tax $ 130.7 170.7
Addbacks to Arrive at Unadjusted EBITDA
Interest expense, net 104.4 104.4
Depreciation and amortization 238.4 238.4
Unadjusted EBITDA 473.5 513.5
Adjustments to Arrive at Adjusted EBITDA
Stock-based compensation expense 18.0 18.0
Non-recurring operational items (1) 8.5 8.5
Adjusted EBITDA $ 500.0 540.0
Capital expenditures (2) (190.0) (210.0)
Adjusted Free Cash Flow $ 310.0 330.0
(1) Non-recurring operational items include charges for disposed operations and other.
(2) Capital expenditures are shown on an accrual basis as described in the definition of Adjusted Free Cash Flow.

Reconciliation of Income Before Tax to Adjusted EBITDA and Adjusted Free Cash Flow
$ in Millions
Year End December 31,
2015 2014
Income before tax 173.9 54.2
Addbacks to Arrive at Unadjusted EBITDA
Interest expense, net 107.5 99.9
Loss on debt extinguishment 0.4 60.7
Depreciation and amortization 229.8 210.8
Unadjusted EBITDA 511.6 425.6
Adjustments to Arrive at Adjusted EBITDA
(20.2) (15.7)Gain on foreign currency
Loss on fixed assets 2.8 2.1
Debt transaction expenses 1.7 3.0
Stock-based compensation expense 27.7 17.3
Sponsor management fee - 5.1
Non-recurring acquisition and purchase accounting related items 3.0 23.0
Non-recurring operational items 11.6 18.2
Adjusted EBITDA 538.2 478.6
Capital expenditures 219.6 177.2
Adjusted Free Cash Flow 318.6 301.4
27
RECONCILIATION OF US GAAP INCOME BEFORE TAX TO
ADJUSTED EBITDA AND ADJUSTED FREE CASH FLOW
(In millions)
Quarter Ended
July 3,
Year Ended
December 31,
Quarter Ended
June 28,
Year Ended
December 31,
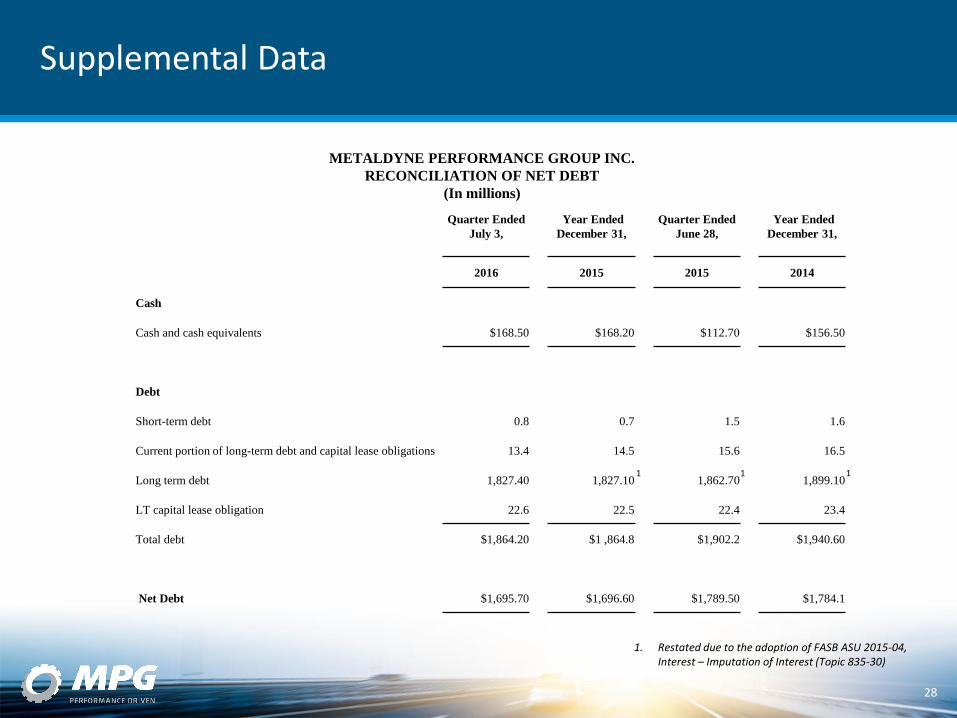
2016 2015 2015 2014
Cash
Cash and cash equivalents $168.50 $168.20 $112.70 $156.50
Debt
Short-term debt 0.8 0.7 1.5 1.6
Current portion of long-term debt and capital lease obligations 13.4 14.5 15.6 16.5
Long term debt 1,827.40 1,827.10 1,862.70 1,899.10
LT capital lease obligation 22.6 22.5 22.4 23.4
Total debt $1,864.20 $1 ,864.8 $1,902.2 $1,940.60
Net Debt $1,695.70 $1,696.60 $1,789.50 $1,784.1
Supplemental Data
28
METALDYNE PERFORMANCE GROUP INC.
RECONCILIATION OF NET DEBT
(In millions)
1
1. Restated due to the adoption of FASB ASU 2015-04, Interest – Imputation of Interest (Topic 835-30)
11

Supplemental Data
Quarter Ended
July 3,
Year Ended
December 31,
Year Ended
December 31,
2016 2015 2014
Net Debt $ 1,695.7 $ 1,696.6 $ 1,784.1
Adjusted EBITDA $ ,524.9 $ ,538.2 $ ,545.1
Net Leverage 3.2 3.2 3.3
29
METALDYNE PERFORMANCE GROUP INC.
RECONCILIATION OF NET LEVERAGE
(In millions)
1. Last twelve months Adjusted EBITDA as of Q2 20162. Combined Adjusted EBITDA
1 2

Combined Non-GAAP Financial Information
MPG SCHEDULE OF COMBINED NON-GAAP FINANCIAL INFORMATION
30
Full Year Ended
December 31,
2014
Net Sales $ 2,717.0
Grede pre-acquisition Net Sales 427.0
Combined Non-GAAP Net Sales 3,144.0
Adjusted EBITDA 478.6
Grede pre-acquisition Adjusted EBITDA 66.5
Combined Adjusted EBITDA $ 545.1
$ in Millions