d&b us economic health briefing (feb. 2014)
TRANSCRIPT

Paul Ballew, Chief Data & Analytic Officer, D&B
February 6, 2014
Introducing A New Way To Assess U.S. Economic Activity
Follow us on Twitter #DnBEconomy
#DnBEconomy

Introducing D&B’s Economic Health TrackerA multi-dimensional view of the economy

3
Small Business Health Index

The Small Business Health has been remarkably stable for the first time post recession
Some signs of modest softening but the US is still positioned to grow above 2%
4Source: D&B Proprietary Data
Q1 2011
Q2 2011
Q3 2011
Q4 2011
Q1 2012
Q2 2012
Q3 2012
Q4 2012
Q1 2013
Q2 2013
Q3 2013
Q4 201370
75
80
85
90
95
100
105
Overall Small Business Health Index: Past 3 years
2011 2012 2013
-2.0%
0.0%
2.0%
4.0%
6.0%
8.0%
10.0%
Overall Small Business Health Index: YOY Changes

The recovery process for small businesses remains uneven
Industries which seemed to be lagging behind in the recovery process are gradually accelerating
5
Manufacturing Transportation Personal Services-10.0%
-5.0%
0.0%
5.0%
10.0%
15.0%
20.0%
25.0%
Small Business Health Index by Vertical: YOY Changes
2011 2012 2013
Source: D&B Proprietary Data

…. And a few sectors that bounced back quickly have leveled off
On the other hand, industries which were initially leading the recovery have slowed down in the past year
6
Retail Real Estate Business Services Construction-5.0%
0.0%
5.0%
10.0%
15.0%
20.0%
Small Business Health Index by Vertical: YOY Changes
2011 2012 2013
Source: D&B Proprietary Data

Credit growth has accelerated for small businesses
Post recession, the small businesses have experienced more credit growth through the more conventional avenues, although credit card loans have also been on the upturn in the past two years
7
2010 Q1
2010 Q2
2010 Q3
2010 Q4
2011 Q1
2011 Q2
2011 Q3
2011 Q4
2012 Q1
2012 Q2
2012 Q3
2012 Q4
2013 Q1
2013 Q2
2013 Q3$17,200
$17,600
$18,000
$18,400
$18,800
$19,200
Credit Card Current Balances ($M)
2% decline
4% rise in the
past 2 years
2010 Q1
2010 Q2
2010 Q3
2010 Q4
2011 Q1
2011 Q2
2011 Q3
2011 Q4
2012 Q1
2012 Q2
2012 Q3
2012 Q4
2013 Q1
2013 Q2
2013 Q3$40,000
$45,000
$50,000
$55,000
$60,000
$65,000
$70,000
$75,000
$1,000
$1,100
$1,200
$1,300
$1,400
$1,500
$1,600
Loans Current Balances
Commercial & Industrial Loans, All Commercial Banks ($Bn, left)Small Business Loans, D&B Database ($Mn, right)
44 % growth

Overall credit usage and availability has improved
Although still falling short of pre-recession levels, access to credit for US businesses is on an upturn
8Source: D&B Proprietary Data
Q4
2005
Q1
2006
Q2
2006
Q3
2006
Q4
2006
Q1
2007
Q2
2007
Q3
2007
Q4
2007
Q1
2008
Q2
2008
Q3
2008
Q4
2008
Q1
2009
Q2
2009
Q3
2009
Q4
2009
Q1
2010
Q2
2010
Q3
2010
Q4
2010
Q1
2011
Q2
2011
Q3
2011
Q4
2011
Q1
2012
Q2
2012
Q3
2012
Q4
2012
Q1
2013
Q2
2013
Q3
2013
Q4
2013
-40.00%
-30.00%
-20.00%
-10.00%
0.00%
10.00%
20.00%
30.00%
40.00%
Card Utilization Index
Y/Y
Perc
enta
ge C
hg.
9
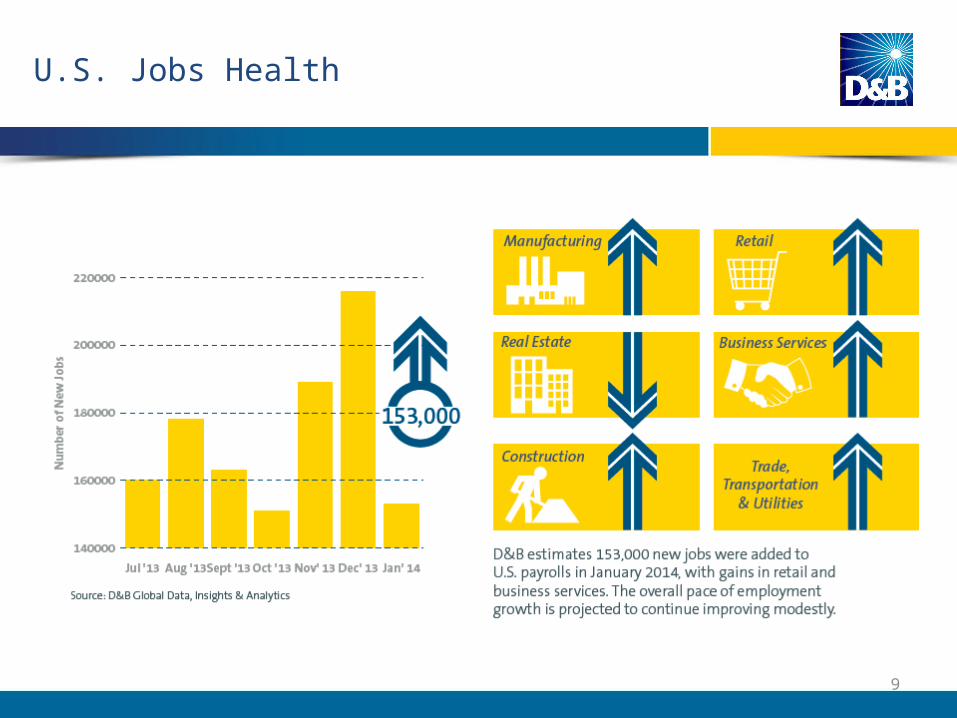
U.S. Jobs Health

10
U.S. Business Health Index

U.S. Business Health Index
11
Dec-10
Feb-11
Apr-11
Jun-11
Aug-11
Oct-11
Dec-11
Feb-12
Apr-12
Jun-12
Aug-12
Oct-12
Dec-12
Feb-13
Apr-13
Jun-13
Aug-13
Oct-13
Dec-13
44
46
48
50
52
54
56
Overall
• The overall US business health index improved in January for the fourth-consecutive month—reaching 52.8%.
• This was the highest level recorded since the inception of the index in December 2010.

U.S. Business Health Index
12
• On a year-over-year basis the overall index increased 5.9 percentage points (pp.)—the strongest growth since June 2012.
• Viability (+14.8 pp.), Total Loss Predictor (+2.2 pp.) and the Delinquency (+0.9 pp.) components all increased on a 12-month basis.
May-13 Jun-13 Jul-13 Aug-13 Sep-13 Oct-13 Nov-13 Dec-13 Jan-14-10.0%
-5.0%
0.0%
5.0%
10.0%
15.0%
20.0%
Overall Viab Delinq TLP
Y/Y
Perc
ent C
hg.
Strong growth in Viability helped to lift the overall indicator

Summary
13
• The Small Business Health Index declined modestly in the current month and warrants tracking going forward. A number of factors including the weather may be influencing so D&B remains confident in our economic outlook
• The recovery for small business remains uneven although there are signs that some lagging sectors are gaining momentum. One important driver of growth is credit availability and usage and there are improving signs on this front
• Based on the Small Business Health Index, D&B expects economic growth in excess of 2.5% and improvement in nonfarm payroll employment
• As 2014 begins, composite risk and balance sheets among U.S. businesses continue to improve. The overall index was once again above the “no change” threshold continuing its trend higher. January’s reading bodes well for the future of U.S. businesses health.

Join us every month on the Tuesday prior to the first Friday at 8:30 AM EST for the latest economic update
14#DnBEconomy

Follow us on Twitter for up to the minute information and analysis
15
For more information, visit www.dnb.com/tracker
And follow the conversation on Twitter at
@DnBEconomy