dba africa management review
TRANSCRIPT
DBA AFRICAMANAGEMENTREVIEW
A Quarterly publication of the Department of Business Administration, School of Business,
University of Nairobi
I S S N N O : 2 2 2 4 - 2 0 2 3
M O D E R A T I O N E F F E C T O F M A C R OE N V I R O N M E N T O N T H E R E L A T I O N S H I P
B E T W E E N C O M P E T I T I V E S T R A T E G YD R I V E R S A N D P E R F O R M A N C E O F
M A N U F A C T U R I N G S M A L L A N DM E D I U M E N T E R P R I S E S I N N A I R O B I
C O U N T Y , K E N Y A
V I C T O R L A I B U N I B A A R I UD R . J A M E S G A T H U N G U , P H D , C P S ( K )
P R O F . B I T A N G E N D E M O . P H D
V O L U M E 1 0 N O . 5
2 0 2 0

http://journals.uonbi.ac.ke/damr ISSN - 2224-2023
November 2020 Vol 10 No 5 Pgs 107-133
107 | All rights reserved Department of Business Administration School of Business University of Nairobi DBA Africa Management Review
Received Date
12/11/2020
Accepted Date
23/11/2020
MODERATION EFFECT OF MACRO ENVIRONMENT ON THE
RELATIONSHIP BETWEEN COMPETITIVE STRATEGY DRIVERS
AND PERFORMANCE OF MANUFACTURING SMALL AND
MEDIUM ENTERPRISES IN NAIROBI COUNTY, KENYA
Victor Laibuni Baariu1, Dr. James Gathungu, PhD, CPS (K)2, Prof. Bitange
Ndemo. PhD3 Abstract
This study establishes the moderating effect of macro environment on the relationship between
competitive strategy drivers and the performance of small and medium enterprises (SMEs) in the
manufacturing sector in Nairobi City County in Kenya. SMEs are the backbone of many
economies through creation of employment opportunities as well as wealth creation for
entrepreneurs. Strong competitive strategy drivers have been found to enable SMEs achieve
favorable performance and remain competitive in their own markets. The macro environment
could have a significant moderating effect in the relationship between competitive strategy drivers
and firm performance. This study was based on Resource-Based theory which was augmented by
the open systems theory, combining to provide a framework for examining the moderating effect
of macro environment on the relationship between strategy drivers and performance of
manufacturing SMEs in Nairobi County, Nairobi. For the methodology, a cross-sectional survey
was done covering 334 manufacturing small and medium enterprises in Nairobi County, Kenya.
Structured questionnaires were used for data collection with a response rate of 89.6%. Various
descriptive statistics were used to project the demographic characteristics of the association and
the respondents. Inferential statistics was used to build up the connection between the factors and
test the model. The results of the study on the moderating effect of macro environment on the
relationship between competitive drivers and firm performance showed a very strong
relationship, implying that the competitive strategy drivers depend on macro environment in
determining the performance of manufacturing SMEs and consequently supporting the
formulated hypothesis. The results suggest that manufacturing SMEs need to edge their
operations by considering macro environment dynamics as they undertake their service and
product development. The findings in this research will have implications on business
management practices as well as be beneficial to business owners by way of improving their
management practice, for instance on the importance by manufacturing SMEs to scan their
political, economic, social, technological, ecological environment as they adopt various competitive
strategy drivers so as to enhance their performance. The researcher recommends similar research
to be undertaken in other SMEs and also have more managers respond to the questionnaires in
order to enrich the collected data.
Key Words: Competitive strategy drivers, Environment based drivers, Hybrid Strategy drivers, Value
chain, Performance, Macro Environment
1 School of Business, University of Nairobi, Kenya 2 School of Business, University of Nairobi, Kenya 3 School of Business, University of Nairobi, Kenya
DBA Africa Management Review

http://journals.uonbi.ac.ke/damr ISSN - 2224-2023
November 2020 Vol 10 No 5 Pgs 107-133
108 | All rights reserved Department of Business Administration School of Business University of Nairobi DBA Africa Management Review
Introduction
SMEs are central to achieving successful
economic growth through promotion of
innovation, creation of employment
opportunities, sharpening of
entrepreneurship skills and supporting
social integration (Dahmen & Rodriguez,
2014). This recognition is derived from the
knowledge that they fuel economic growth
in most economies and if their performance
is undermined, economic development
suffers significantly (Sidik, 2012). Nairobi
County has the largest concentration of
microenterprises in Kenya, accounting for
approximately 25% of total employment in
the sector (KNBS, 2013).
According to Salavou (2015), a strategy
driver is a deliberate set of clearly defined
activities that are planned and implemented
with the aim of achieving a competitive
advantage. A manufacturing SME can
improve or erode its market position within
its industry through the strategy it adopts. In
furtherance of this view, Peteraf (1993)
emphasizes that the competitive strategy
drivers ought to be aligned to a firm’s long-
term strategy in an endeavor to achieve a
competitive position and achieve long term
profitability. The manufacturing SMEs
competitive strategy drivers in this study are
categorized as environmental-based
strategy drivers, resource-based strategy
drivers and hybrid strategy drivers.
Environmental drivers include cost
leadership and (product) differentiation. On
the resource-based theory, manufacturing
SMEs must optimize their resources if they
are to sustain a competitive advantage.
Gathungu and Baariu (2018) identify these
resources as human resources, intellectual
property, materials and organization brand
as well as capabilities, such as
innovativeness, efficiency and quality. For
this study, the resource-based strategy
drivers comprise of manufacturing SMEs
capital-raising capacity, technology
development, human capital and value
chain. The hybrid strategy drivers are
classified as a blend of low cost and
differentiation. The hybrid strategy is a
more complex strategic driver compared to
generic strategic approaches because it
involves a number of strategic focuses.
The resource-based theory argues that a
firm’s competitive advantage is mainly
derived from its ability to mobilize
resources to its advantage (Barney, 1991),
and hence the need to carefully identify,
evaluate and select competitive strategy
drivers to drive performance. According to
open systems theory of entrepreneurship, as
enterprises perform their trades, they will be
subjected to events and changes in their
macro environments. Recognizing
organizations as open entities, there is need
for their careful management to gratify and
stabilize internal needs and enable
adaptation to macro circumstances (Burnes,
2000). The open systems theory identifies
the surrounding environment as having an
impact on a firm’s change and survival.
This is so since enterprises are environment
serving and reliant (Ansoff & McDonell,
1990). The theory also explains how
strategy helps an organization to achieve
sustainable competitive advantage.
A firm’s macro environment as defined by
Hitt, Ireland and Hoskisson (2011) is a
blend of business environmental factors that
influence the firm’s operations or
functioning. Since the dynamics in the
macro environment are continuously
evolving, there should be regular re-
assessments of business strategies (Adeoye
& Elegunde, 2012). Macro environment is
central to SMEs because it offers business
opportunities. Risks and prospects in the
macro environment exist in the form of

http://journals.uonbi.ac.ke/damr ISSN - 2224-2023
November 2020 Vol 10 No 5 Pgs 107-133
109 | All rights reserved Department of Business Administration School of Business University of Nairobi DBA Africa Management Review
different types of threats and challenges
facing SMEs. Macro environment is also an
important source of resources that firms
need for its day to day operations. For this
study, macro environment has been
represented by Political, Economic, Social,
Technological, Legal and Ecological
factors affecting manufacturing SME
businesses. The macro environment is
influenced politically for instance, by the
extent to which government operations
affect the economy. Specifically, political
factors include government policies on tax,
trade, tariffs, and general political stability.
These factors may also include goods and
services which the government wants or
does not want provided (Chen, Du, & Chen,
2011)). The political situation of a region or
country in which the manufacturing SMEs
operates will have greater impact on their
existences. The government authorities play
a critical role as the market regulator,
promoter and planner. The government of
the day plays a major role in dictating the
political environment and political stability
as this remains an essential factor that
affects the growth of manufacturing SMEs
(Gathungu & Baariu, 2018). The
philosophy of political parties in power also
influences business practices. Noteworthy
is that the pro-business attitude allows
arrangements such as mergers, acquisition,
joint venture, business allowances and
outsourcing arrangements in between the
manufacturing SMEs.
On the other hand, the legal framework in a
country or region also plays an important
role in how SMEs operate. Legal factors
include law provisions that guide the
general SMEs operations including the
management of labour (Chen et al., 2011).
These factors can affect how a firm
operates, its costs and the demand for its
products. The socio-cultural dimension of
the macro environment includes customs,
way of life and morals that characterize the
society in which the SMEs operate. Social
factors are the cultural aspects that include
health consciousness, population growth
rate, age distribution, career attitudes and
emphasis on safety.
SMEs may change their management
strategies to adjust to the social trends
(Ndife, 2014). Culture is the result of
complex factors that include religion,
language, education and ethical beliefs
where social class is identified by income,
occupation, life style and class norms. A
socio-cultural component of the macro
environment influences the ability of the
SMEs to obtain resources, market its goods
and services, and function within the
society. This enables SMEs to identify the
opportunities and threats for their
businesses (Gathungu et al., 2014). Other
macroeconomic aspects such as economic,
environmental and technological impact the
operations and performance of firms, and
manufacturing SMS in varied ways. The
dynamic nature of the macro environment,
today, provides a challenge for determining
which environment that manufacturing
SMEs need to choose for them to thrive, the
timing of their operations and activities as
well as how to deal with the environmental
challenges. This ever-changing
environment forces organizations to remain
agile in order to survive (McMahon & Carr,
1999).
Richard, Devinney, Yip and Johnson (2009)
define firm performance as the firm’s
ability to achieve planned results as
estimated against its proposed yields and
expected outcomes in terms of financial
performance, market performance and
shareholder return. Moullin (2003) provides
that there is a need to come up with
measures that can be quantified through
identification of aspects of the business
http://journals.uonbi.ac.ke/damr ISSN - 2224-2023
November 2020 Vol 10 No 5 Pgs 107-133
110 | All rights reserved Department of Business Administration School of Business University of Nairobi DBA Africa Management Review
operations or objectives that need regular
evaluation or improvement and whose final
achievements enable the evaluation of the
overall business performance at the end of
the period. These assessments include both
financial and non-financial measures
depending on value, importance and
individual business circumstances.
Common measures of firm performance in
SMEs include financial and non –financial
measures. Financial measures of
performance include return on asset,
investment and equity. Non-financial
measures of performance include
operational efficiency and market share,
employee turnover, entrepreneur
satisfaction and longevity of the firm
(Gentry & Vaidyanathan, 2010). There are
few studies seeking to establish the
moderating effect of macro environment on
the relationship between competitive
strategy drivers and performance especially
in the context of manufacturing SMEs in
Nairobi County. There is therefore a need to
undertake studies in the foregoing area with
a view to enhancing the performance of
these firms.
Literature Review
Entrepreneurship is the process of
identifying an opportunity in the business
environment, pooling of resources,
exploiting the opportunity, make profit and
meeting the needs of customers. It mainly
involves taking risks, creativeness and
being innovative. Several theories explain
entrepreneurship, among them, the
resource-based theory of entrepreneurship
and open systems theory of
entrepreneurship. The resource-based
theory, which largely drives this study
contends that a distinct bundle of resources
that are at the firm’s disposal generate
sustained competitive advantage (Barney,
1991; Conner & Prahalad, 1996). In this
study, the theory conceptualizes the
position that firm performance is enhanced
when firms use and manage their unique
resources to enable the firm attain a
competitive advantage position. The open
systems theory argues that organizational
performance is significantly related to the
vibrant evolutionary nature of fit amid the
business environment and the firm
(Machuki & Aosa, 2011). The theory only
concentrates on the environmental effects
but does not explain the critical role of
competitive strategy drivers, well aligned
with the environmental forces, in enabling a
firm achieve performance.
It can therefore be conceptualized that this
theory can explain the relationship that
arises from the interaction between
competitive strategy drivers that arises from
the macro influence in terms of norms,
culture and policies on environment and
also the entrepreneurial nature of the
owners. The open systems view assumes
that firms are forced to act under situations
of constrained freedom and that they tend to
serve external actors who afford them
resources. While organizations rely on their
environment for critical resources, the
environment is considered to be
unpredictable as it is beyond the firm’s
administrative control. Therefore, firms
tend to build relationships with surrounding
actors in order to reduce uncertainty
(Dubois, 1998). As organizations network
with actors, they often become obligated to
act under conditions of interdependence.
Interdependence is a situation where the
outcome of an action relies on two or more
actors (Pfeffer &Salancik, 1978). As firms
controls varying bundles of resources and
undertake various activities, networks of
firms come up, where no one is in total
control over their own operations.

http://journals.uonbi.ac.ke/damr ISSN - 2224-2023
November 2020 Vol 10 No 5 Pgs 107-133
111 | All rights reserved Department of Business Administration School of Business University of Nairobi DBA Africa Management Review
Perceiving, understanding and responding
to environmental conditions have
implications on competitive strategy drivers
and performance of every firm. Empirical
evidence on the effect of macro business
environment on organizations in terms of
competitive strategy drivers and firm
performance indicate that environment is a
source of opportunities as well as threats for
all organizations (Pearce & Robinson,
2011). Environmental scanning, a critical
aspect in strategy formulation is conducted
to identify important factors and forces that
exist outside the organization and can
possibly specifically or in an indirect way
influence the focused procedures and
execution. To attain a competitive
advantage, firms are required to critically
think and decide on the competitive
advantage that they will try to gain and the
degree to which it will achieve it.
Researches that have conclusively linked
macro environment and firm performance
are few, yet performance depends on
organizations alignment with
environmental changes (Machuki & Aosa,
2011). Literature on the macro environment
of organizations and its direct and indirect
effect on business processes and outcomes
are documented (Osborn & Hunt, 1974).
However, several subsequent studies have
treated macro environment as an
independent variable and performance as
dependent (Machuki & Aosa, 2011;
Venkatraman & Prescott, 1990).
To remain competitive, manufacturing
SMEs must be recognize any stimulus from
the macro environment and ought to
continuously adjust to it. An organization’s
ability to adapt to the changes in the macro
environment will determine its success and
sustainability as well as its survival. There
are many competitive pressures and risks
which hinder the businesses from achieving
their intended goals (Akdogan & Cingoz,
2012). Any manufacturing SME is an open
system between itself and its macro
environment up to a series of relationships
that influence each other (Muhammad,
2014). SMEs influence the macro
environment primarily through their service
or products offerings and are geared toward
relationships with other organizations
making their mark on the community to
which they belong. Analysis of competition
and positioning is essential to realizing
sustainable competitive advantages for
organizations (Selvam, Vanitha, Gayathri,
Bennet, & Nageswari, 2010). The macro
environment includes organizations in the
industry that produce similar products,
suppliers, customers, potential new entrants
and also, products.
Method
Research Procedure and Sample
Characteristics
The study was used the cross-sectional
study design, considered appropriate for
entrepreneurship research (Davidsson,
2004). This design enabled pooling of
quantitative data and allowed the researcher
to identify patterns of association amongst
the variables that confirmed the general
interpretation of the associations among the
study variables. The principal research tool
of data collection of this study was a
structured questionnaire. Respondents
included SME’s owners or senior
managers/persons in charge of the SME
who by virtue of their positions were better
placed to give informed and reliable
responses. The study population comprised
of all manufacturing SMEs in Nairobi
County. The enterprises were in two
categories; category A with between 5-19
employees and category B with between 20-
49 employees. The sample size for the study
was calculated using the formula for finite
population as proposed by Israel (2009).

http://journals.uonbi.ac.ke/damr ISSN - 2224-2023
November 2020 Vol 10 No 5 Pgs 107-133
112 | All rights reserved Department of Business Administration School of Business University of Nairobi DBA Africa Management Review
n = N .
1+N(e2 )
Where:
n= Desired Sample Size
N= Population
e = Margin of Error at 5% (standard value
of 0.05)
The size of the sample in this research will
be:
n = 2050
1+ 2050(0.05)2
n= 334 Manufacturing SMEs
A stratified random was used to establish
proportianate sample from each strata as
follows:
Table 1: Sample Size Determination
Strata Population Sample Percent
Building, Mining and Construction 61 10 3
Chemical and Allied 325 53 16
Energy, Electrical and Electronic 153 25 7
Agriculture and Fresh Produce 49 8 2
Food and Beverages 344 56 17
Leather and Footwear 25 4 1
Metal and Allied 301 49 15
Automotive 129 21 6
Paper and Board 172 28 8
Pharmaceutical and Medical Equipment 123 20 6
Plastics and Rubber 270 44 13
Textiles and Apparel 43 7 2
Timber, Word and Furniture 55 9 3
Total 2,050 334 100
Source: Nairobi County Licensing Office (2019)
Measures
The questionnaire used nominal and ordinal
scaled items on a five-point Likert scale
ranging from Strongly disagree (1) to
Strongly agree (5) and are shown in Table
2, Table 3 and Table 4 below:
The variables and respective measurement
items for macro environment are articulated
under Appendix 1, those of competitive
strategy drivers are under Appendix 2 and
those of firm performance under Appendix
3
On the whole, the measurement instrument
was highly reliable with an overall
Cronbach alpha of 0.813.
Analytical Procedure
To describe the demographic characteristics
of the association and the respondents,

http://journals.uonbi.ac.ke/damr ISSN - 2224-2023
November 2020 Vol 10 No 5 Pgs 107-133
113 | All rights reserved Department of Business Administration School of Business University of Nairobi DBA Africa Management Review
descriptive statistics, that is, frequency and
percentages were used. Manifestation of the
study variables were analyzed using mean,
standard deviation, coefficient of variation,
skewness and kurtosis. To test the normality
of the data, measures of dispersion (SD)
were utilized while factor analysis test was
carried out to reduce the set of study items
to subgroups which could directly be
explained. Inferential measurements were
used to test the data drawn from the
respondents from manufacturing SMEs in
Nairobi County with respect to the stated
hypothesis. The study performed inferential
tests to understand the relationship between
different variables and validate/invalidate
theories. Pearson product of correlation
coefficient was used to measure the
direction and magnitude of relationship
between the study variables. It varied from
-1 to +1. Coefficient of determination (R2)
was used to measure the goodness of fit of
the model. The hypothesis was tested using
hierarchical regression analysis.
Results
Measurement model
Confirmatory factor extraction was done to
confirm the structures for entrepreneurial
orientation measures of innovativeness,
proactiveness, risk taking, competitive
aggressiveness as well as the overall factor
as shown in Table 2 below.
Table 2: Variables and Factor Statistics
Variable Dimension/Structure/Factor
No of
Items
Scale Mean
Scores
Macro Environment
Overall Macro Environment 32 3.76
Political 3 4.12
Economical 8 3.74
Social 9 3.61
Technological 1 3.57
Environmental/Ecological 5 3.82
Legal 6 3.67
Competitive Strategy
Drivers
Overall Competitive Strategy Drivers 14 3.78
Environmental Based Drivers 5 3.87
Resource Based Drives 4 3.55
Hybrid Based Drivers 5 3.92
Firm Performance
(Non-financial)
Overall Firm Non-Financial
Performance 12 3.74
Entrepreneurial Satisfaction 3 3.88
Growth in Employment 4 3.65
Business Longevity 5 3.69

http://journals.uonbi.ac.ke/damr ISSN - 2224-2023
November 2020 Vol 10 No 5 Pgs 107-133
114 | All rights reserved Department of Business Administration School of Business University of Nairobi DBA Africa Management Review
On the whole, our measurement model
shows acceptable good levels of statistical
fit as indicated by the confirmatory factor
analyses.
Table.3: Descriptive Statistics
Response Rate
Frequency Percent
Returned Usable Questionnaires 300 89.82
Returned Non-Usable Questionnaires 5 1.50
Non-Returned Questionnaires 29 8.68
Total 334 100.00
Reliability
Variable Components of
Variables
Cronbach’s
Alpha
No of
items Decision
Competitive strategy drivers
Environmental Based
Drivers, Resource
Based Drivers and
Hybrid Strategy
Drivers
0.812 14 Reliable
Macro environment
Political, Economic,
Social, Technological,
Ecological, Legal
0.909 32 Reliable
Entrepreneurial orientation
Innovativeness,
Proactiveness, Risk
taking and Competitive
aggressiveness
0.731 18 Reliable
Performance of Manufacturing SMEs
Financial measures;
ROI
0.91 12 Reliable Non-financial
measures; Entrepreneur
satisfaction, Growth in
Employee numbers,
business longevity
Overall 0.841 76 Reliable

http://journals.uonbi.ac.ke/damr ISSN - 2224-2023
November 2020 Vol 10 No 5 Pgs 107-133
115 | All rights reserved Department of Business Administration School of Business University of Nairobi DBA Africa Management Review
Age of the Firm
Frequency percent
1-5 years 54 18.16
5-10 years 167 55.5
10-15 years 47 15.6
Over 15 years 32 10.74
Total 300 100%
Ownership
Sole proprietor 266 88.75
Partnership 28 9.21
Company 6 2.05
Total 300 100%
The study achieved a response rate of 89.82
percent which was considered adequate for
further analysis. The measurement
instrument was highly reliable with an
overall Cronbach alpha of 0.813, thus, the
information obtained was reliable and could
be used in decision making. Further
majority of the firms had been in operation
for a period of 5 to 10 years. In terms of
business classification; sole proprietorship
was the most popular model followed by
partnership and companies respectively.

http://journals.uonbi.ac.ke/damr ISSN - 2224-2023
November 2020 Vol 10 No 5 Pgs 107-133
116 | All rights reserved Department of Business Administration School of Business University of Nairobi DBA Africa Management Review
Figure 1: Financial Performance-Return on Investment
There was an upward trend of ROI for the
period 2013-2017 in most of the sectors.
This trend over a period of time suggests
that firms improved their performance with
time and they were responding better to
their macro environment situations.
Positive ROI values show that the firm’s
total returns exceed total costs. It further
shows that firm’s profitability is steadily
rising with time.
Correlation Analysis
0
5
10
15
20
25
2013 2014 2015 2016 2017
RO
I %
Yearstimber, wood and furnituretextile and apparelsplastic and rubberpharmaceutical and medical equipmentpaper and boardsbuilding,mining and constructionchemical and alliedenergy, elecrtical and electronicsagriculture and fresh producefood and beveargesleather and footwearsmetal and allied
http://journals.uonbi.ac.ke/damr ISSN - 2224-2023
November 2020 Vol 10 No 5 Pgs 107-133
117 | All rights reserved Department of Business Administration School of Business University of Nairobi DBA Africa Management Review
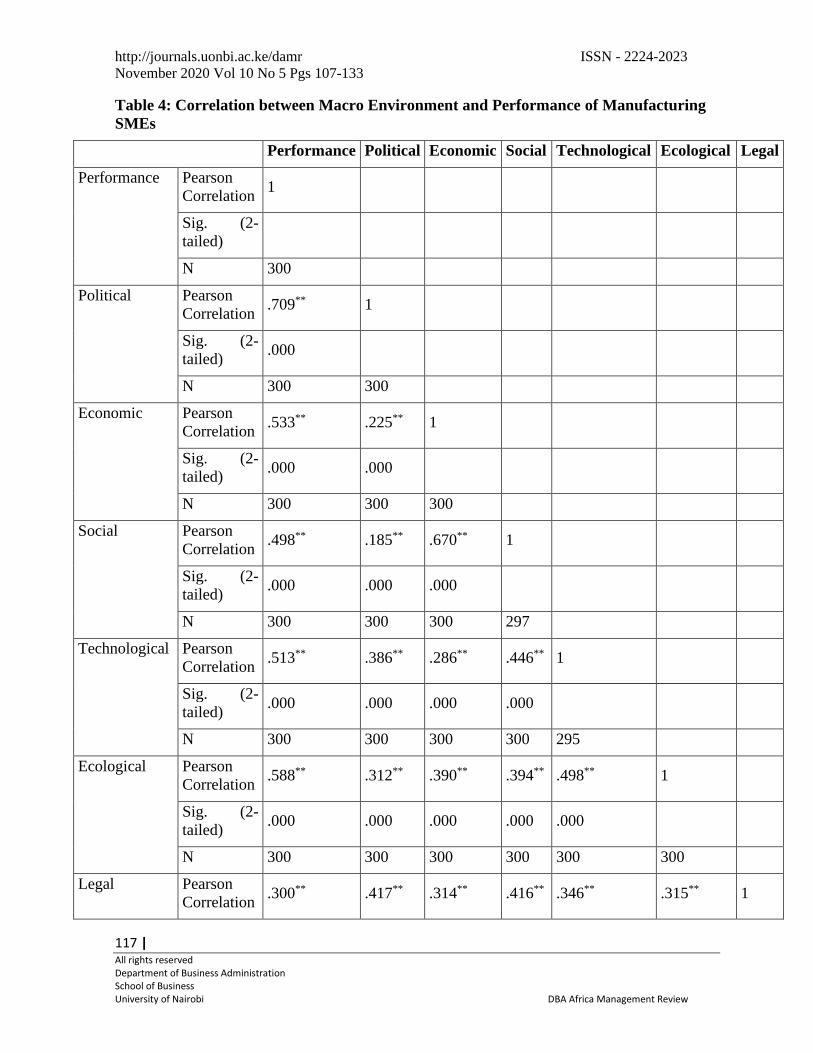
Table 4: Correlation between Macro Environment and Performance of Manufacturing
SMEs
Performance Political Economic Social Technological Ecological Legal
Performance Pearson
Correlation 1
Sig. (2-
tailed)
N 300
Political Pearson
Correlation .709** 1
Sig. (2-
tailed) .000
N 300 300
Economic Pearson
Correlation .533** .225** 1
Sig. (2-
tailed) .000 .000
N 300 300 300
Social Pearson
Correlation .498** .185** .670** 1
Sig. (2-
tailed) .000 .000 .000
N 300 300 300 297
Technological Pearson
Correlation .513** .386** .286** .446** 1
Sig. (2-
tailed) .000 .000 .000 .000
N 300 300 300 300 295
Ecological Pearson
Correlation .588** .312** .390** .394** .498** 1
Sig. (2-
tailed) .000 .000 .000 .000 .000
N 300 300 300 300 300 300
Legal Pearson
Correlation .300** .417** .314** .416** .346** .315** 1
http://journals.uonbi.ac.ke/damr ISSN - 2224-2023
November 2020 Vol 10 No 5 Pgs 107-133
118 | All rights reserved Department of Business Administration School of Business University of Nairobi DBA Africa Management Review
Sig. (2-
tailed) .000 .000 .000 .000 .000 .000
N 300 300 300 300 300 300 300
**. Correlation is significant at the 0.01 level (2-tailed).
Source: Field Data (2019)
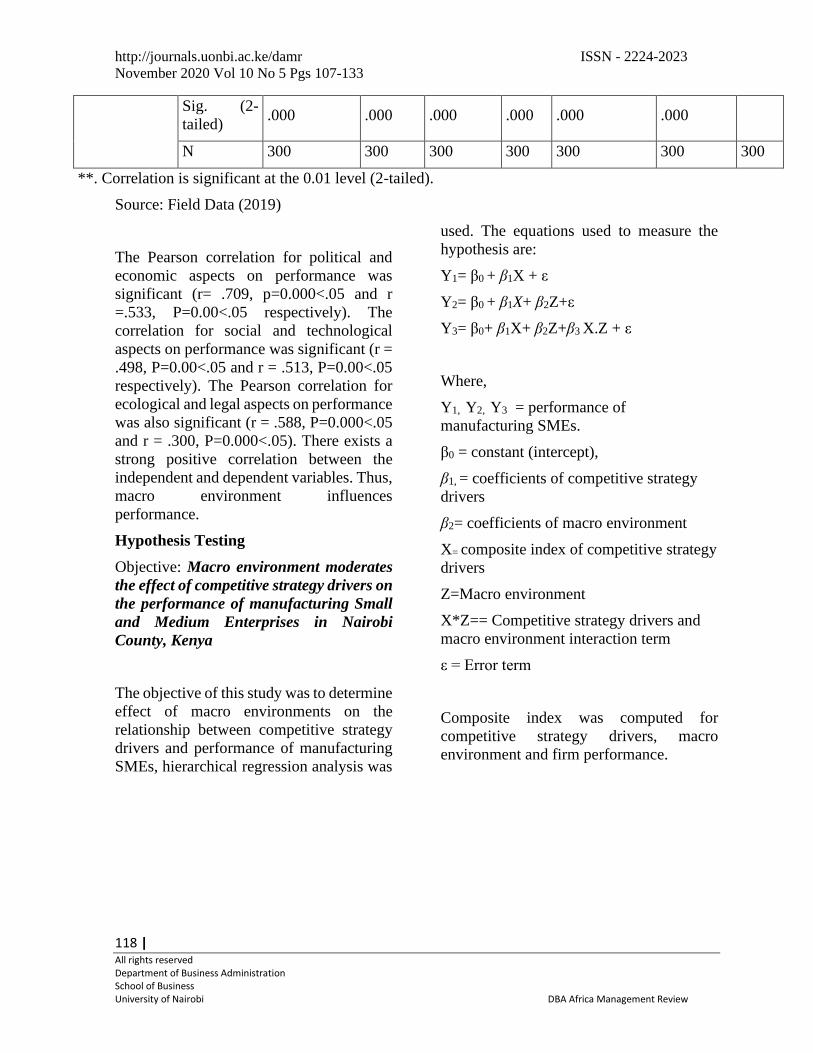
The Pearson correlation for political and
economic aspects on performance was
significant (r= .709, p=0.000<.05 and r
=.533, P=0.00<.05 respectively). The
correlation for social and technological
aspects on performance was significant (r =
.498, P=0.00<.05 and r = .513, P=0.00<.05
respectively). The Pearson correlation for
ecological and legal aspects on performance
was also significant (r = .588, P=0.000<.05
and r = .300, P=0.000<.05). There exists a
strong positive correlation between the
independent and dependent variables. Thus,
macro environment influences
performance.
Hypothesis Testing
Objective: Macro environment moderates
the effect of competitive strategy drivers on
the performance of manufacturing Small
and Medium Enterprises in Nairobi
County, Kenya
The objective of this study was to determine
effect of macro environments on the
relationship between competitive strategy
drivers and performance of manufacturing
SMEs, hierarchical regression analysis was
used. The equations used to measure the
hypothesis are:
Y1= β0 + β1X + ε
Y2= β0 + β1X+ β2Z+ε
Y3= β0+ β1X+ β2Z+β3 X.Z + ε
Where,
Y1, Y2, Y3 = performance of
manufacturing SMEs.
β0 = constant (intercept),
β1, = coefficients of competitive strategy
drivers
β2= coefficients of macro environment
X= composite index of competitive strategy
drivers
Z=Macro environment
X*Z== Competitive strategy drivers and
macro environment interaction term
ε = Error term
Composite index was computed for
competitive strategy drivers, macro
environment and firm performance.

http://journals.uonbi.ac.ke/damr ISSN - 2224-2023
November 2020 Vol 10 No 5 Pgs 107-133
119 | All rights reserved Department of Business Administration School of Business University of Nairobi DBA Africa Management Review
Table 5: Regression Results for Moderation Results of the Effect of Macro Environment
on competitive strategy drivers and Performance
Model Summary
Model
R
R
Square
Adjusted R
Square
Std.
Error of
the
Estimate
Change Statistics
R
Square
Change
F
Change
df1 df2 Sig. F
Change
1 Competitive
Strategy
Drivers
.352a .124 .121 .61984 .124 42.113 1 298 .000
2 Competitive
Strategy
Drivers,
Macro
Environment
.447a .200 .197 .46321 .200 74.332 1 298 .000
3 Competitive
Strategy
Drivers,
Macro
environment
interaction
.489a .239 .234 .57874 .239 46.568 2 297 .000
ANOVA
Model Sum of Squares df Mean
Square
F Sig.
1 Competitive
Strategy Drivers
Regression 16.180 1 16.180 42.113 .000b
Residual 114.492 298 .384
Total 130.671 299
2 Competitive
Strategy Drivers,
Macro
Environment
Regression 15.949 1 15.949 74.332 .000b
Residual 63.940 298 .215
Total 79.889 299
3 Competitive
Strategy Drivers,
Macro
environment
interaction
Regression 31.195 2 15.597 46.568 .000b
Residual 99.476 297 .335
Total 130.671 299
Coefficients
http://journals.uonbi.ac.ke/damr ISSN - 2224-2023
November 2020 Vol 10 No 5 Pgs 107-133
120 | All rights reserved Department of Business Administration School of Business University of Nairobi DBA Africa Management Review
Model
Unstandardized
Coefficients
Standardized
Coefficients
T
Sig.
Collinearity Statistics
B Std. Error Beta Tolerance VIF
1
2
(Constant) 1.849 .202 9.143 .000
Competitive
Strategy Drivers .390 .060 .352 6.489 .000 1.000 1.000
(constant) 1.608 .151 10.646 .000
Competitive
Strategy Drivers,
Macro
Environment
.387 .045 .447 8.622 .000 1.000 1.000
Competitive
Strategy Drivers,
Macro
environment
interaction
.485 .072 .379 6.696 .000 .800 1.249
a. Dependent Variable: Firm performance
b. Predictors: (Constant), Competitive strategy drivers, Macro environment
Source: Field Data (2019)
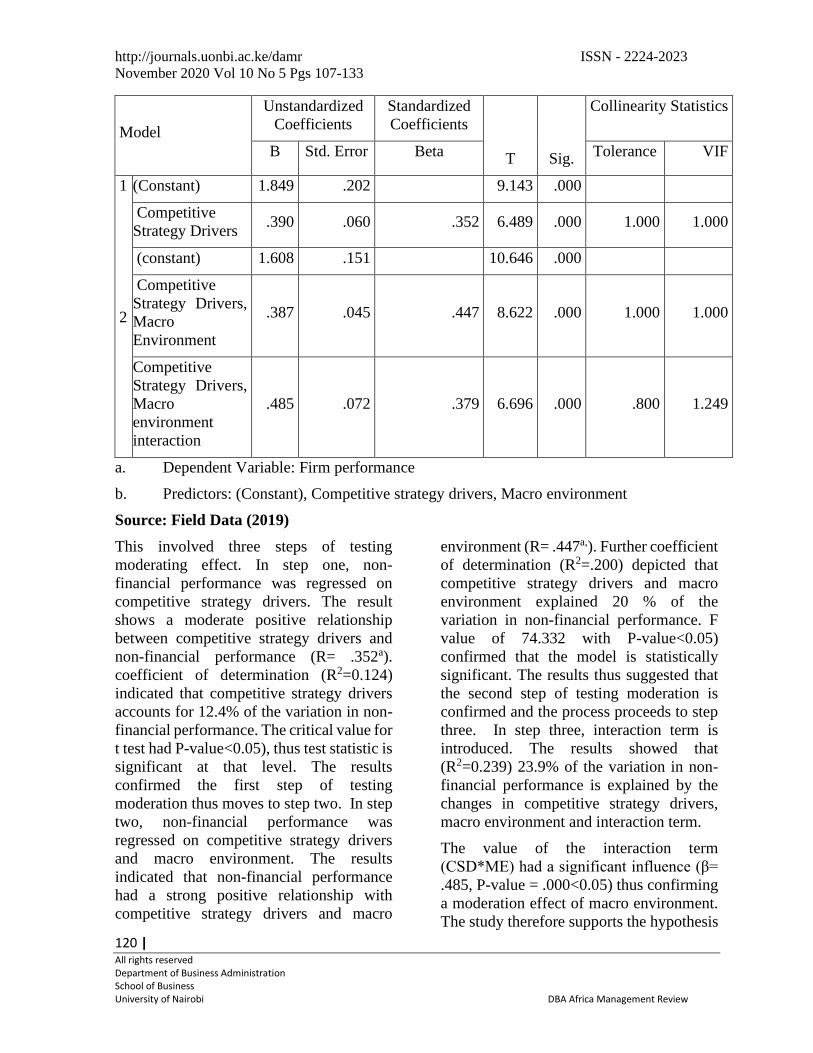
This involved three steps of testing
moderating effect. In step one, non-
financial performance was regressed on
competitive strategy drivers. The result
shows a moderate positive relationship
between competitive strategy drivers and
non-financial performance (R= .352a).
coefficient of determination (R2=0.124)
indicated that competitive strategy drivers
accounts for 12.4% of the variation in non-
financial performance. The critical value for
t test had P-value<0.05), thus test statistic is
significant at that level. The results
confirmed the first step of testing
moderation thus moves to step two. In step
two, non-financial performance was
regressed on competitive strategy drivers
and macro environment. The results
indicated that non-financial performance
had a strong positive relationship with
competitive strategy drivers and macro
environment (R= .447a,). Further coefficient
of determination (R2=.200) depicted that
competitive strategy drivers and macro
environment explained 20 % of the
variation in non-financial performance. F
value of 74.332 with P-value<0.05)
confirmed that the model is statistically
significant. The results thus suggested that
the second step of testing moderation is
confirmed and the process proceeds to step
three. In step three, interaction term is
introduced. The results showed that
(R2=0.239) 23.9% of the variation in non-
financial performance is explained by the
changes in competitive strategy drivers,
macro environment and interaction term.
The value of the interaction term
(CSD*ME) had a significant influence (β=
.485, P-value = .000<0.05) thus confirming
a moderation effect of macro environment.
The study therefore supports the hypothesis

http://journals.uonbi.ac.ke/damr ISSN - 2224-2023
November 2020 Vol 10 No 5 Pgs 107-133
121 | All rights reserved Department of Business Administration School of Business University of Nairobi DBA Africa Management Review
that macro environment moderates the
effect of competitive strategy drivers on
non-financial performance of
manufacturing SMEs in Nairobi County.
Table 6: Regression Results for Moderation Results of the Effect of Macro Environment
on competitive strategy drivers and Financial Performance (Return on
Investment)
Model Summary
Model R R Square
Adjusted
R
Square
Std. Error of the
Estimate
1 Competitive strategy
drivers 0.323 0.104 0.081 0.0374771
Competitive strategy
drivers 0.351 0.123 0.076 0.0375788
2 Macro environment
3
Competitive strategy
drivers
0.358 0.128 0.055 0.0379914 Macro environment
Interaction term
ANOVA
Model Sum of
Squares df Mean Square F Sig.
1 Competitive
strategy drivers
Regression 0.006 1 0.006 4.418 0.042
Residual 0.298 298 0.001
Total 0.304 299
2
Competitive
strategy drivers Regression 0.007 2 0.004 2.594 0.088
Macro
environment Residual 0.297 297 0.001
Total 0.304 299
3
Competitive
strategy drivers Regression 0.008 3 0.003 1.759 0.001
Macro
environment Residual 0.296 296 0.001
http://journals.uonbi.ac.ke/damr ISSN - 2224-2023
November 2020 Vol 10 No 5 Pgs 107-133
122 | All rights reserved Department of Business Administration School of Business University of Nairobi DBA Africa Management Review
Interaction term Total 0.304 299
Coefficients
Model
Unstandardized
Coefficients
Standardized
Coefficients t Sig.
B Std. Error Beta
1
(Constant) -0.006 0.032 -0.182 0.857
Competitive
strategy
drivers
0.019 0.009 0.323 2.102 0.042
(Constant) -0.027 0.04 -1.669 0.007
Competitive
strategy
drivers
0.015 0.01 0.26 1.936 0.003
2 Macro
environment 0.009 0.011 0.151 0.891 0.379
3
(Constant) 0.038 0.151 0.254 0.801
Competitive
strategy
drivers
-0.006 0.048 -0.094 -2.117 0.008
Macro
environment -0.009 0.042 -0.144 -2.212 0.003
Interaction
term 0.006 0.013 0.552 2.448 0.007
Model 1 Predictors (Constant) Competitive strategy drivers
Model 2 Predictors: (Constant) Competitive strategy drivers and macro environment
Model 3 Predictors: (Constant) Competitive strategy drivers, macro environment and
Interaction term.
Dependent Variable: Return on Investment
Source: Field Data (2019).
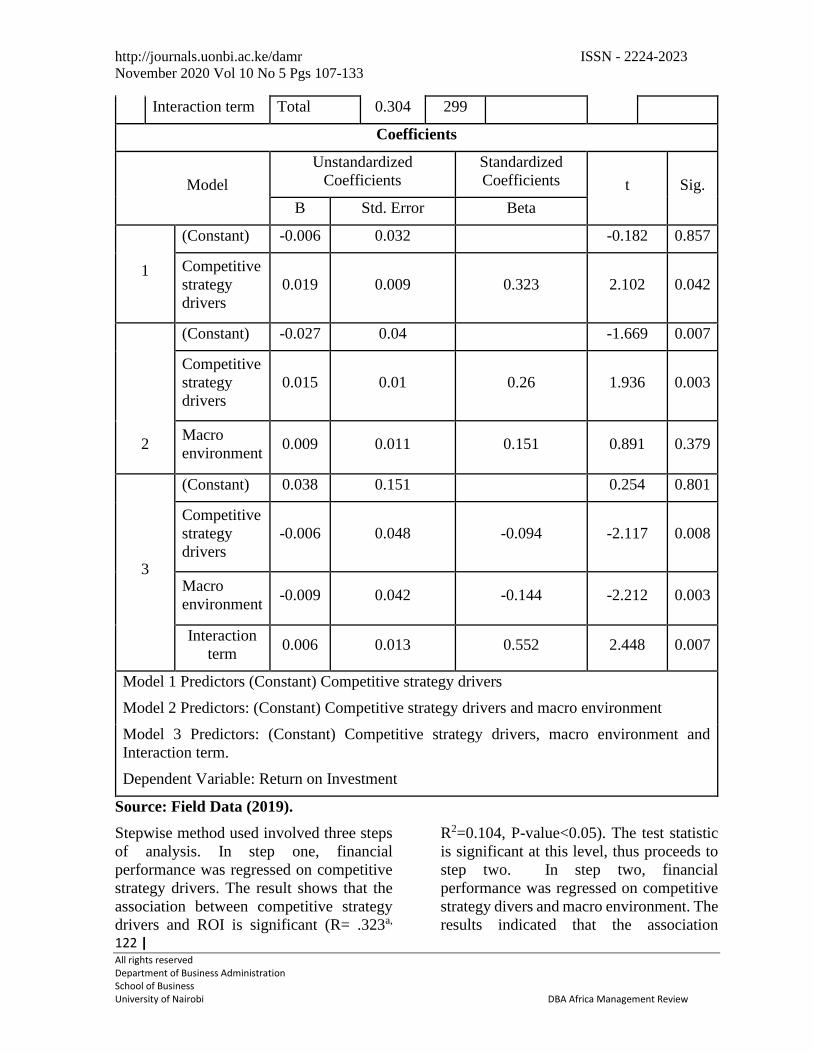
Stepwise method used involved three steps
of analysis. In step one, financial
performance was regressed on competitive
strategy drivers. The result shows that the
association between competitive strategy
drivers and ROI is significant (R= .323a,
R2=0.104, P-value<0.05). The test statistic
is significant at this level, thus proceeds to
step two. In step two, financial
performance was regressed on competitive
strategy divers and macro environment. The
results indicated that the association

http://journals.uonbi.ac.ke/damr ISSN - 2224-2023
November 2020 Vol 10 No 5 Pgs 107-133
123 | All rights reserved Department of Business Administration School of Business University of Nairobi DBA Africa Management Review
between competitive strategy divers, macro
environment and financial performance is
significant (R= .351a, R2=.123, P-
value<0.05). the results, thus, suggested
that the second step of testing moderation is
satisfied and the process proceed to step
three. In step three, the interaction term was
introduced to test on moderation. The
results indicated that competitive strategy
drivers, macro environment and interaction
term accounts for 12.8% of the variation in
financial performance (R= .358a, R2=0.128,
P-value<0.05). Further, the value of the
interaction term (CSD*ME) had a
significant influence (β=.006, P-value =
.007<0.05) thus confirming a moderation
effect of the macro environment. The
hypothesis that macro environment
moderates the relationship between
competitive strategy drivers and financial
performance of manufacturing SMES was
supported.
Table 7: Summary of Regression Results for Moderating Influence of Macro
Environment
Hypothesis Results Hypothesis Remarks
H1 Macro environment
moderates the effect of
competitive strategy
drivers on the non-
financial performance of
manufacturing SMEs in
Nairobi County, Kenya.
R2=0.239
F= 46.568, P-Value=
0.000<0.05
β= 0.485, t= 6.696, P-
Value=0.000<0.05
Supported
H1 Macro environment
moderates the effect of
competitive strategy
drivers on financial
performance (return on
investment) of
manufacturing SMEs in
Nairobi County, Kenya.
R2=0.128
F= 1.759, P-Value=
0.01<0.05
β= 0.006, t= 2.448, P-
Value=0.007<0.05
Supported
H1a Political environment
moderates the effect of
competitive strategy
drivers on the
performance of
manufacturing SMEs in
Nairobi County, Kenya.
R2=0.177
F= 31.919, P-Value=
0.000<0.05
β= 0.005, t= 2.500, P-
Value=0.001<0.05
Supported
H1b Economic environment
moderates the effect of
competitive strategy
drivers on the
performance of
R2=0.131
F= 30.739, P-Value=
0.000<0.05 Supported

http://journals.uonbi.ac.ke/damr ISSN - 2224-2023
November 2020 Vol 10 No 5 Pgs 107-133
124 | All rights reserved Department of Business Administration School of Business University of Nairobi DBA Africa Management Review
manufacturing SMEs in
Nairobi County, Kenya.
β=0.115, t= 3.710, P-
Value=0.001<0.05
H1c Social environment
moderates the effect of
competitive strategy
drivers on the
performance of
manufacturing SMEs in
Nairobi County, Kenya.
R2=0.151
F= 30.323, P-Value=
0.001<0.05
β= 0.221, t= 2.146, P-
Value=0.002<0.05
Supported
H1d Technological
environment moderates
the effect of competitive
strategy drivers on the
performance of
manufacturing SMEs in
Nairobi County, Kenya.
R2=0.209
F= 34.202, P-Value=
0.003<0.05
β=0.322, t= 3.188, P-
Value=0.000<0.05
Supported
H1e Ecological environment
moderates the effect of
competitive strategy
drivers on the
performance of
manufacturing SMEs in
Nairobi County, Kenya.
R2=0.221
F= 27.992, P-Value=
0.000<0.05
β=0.278, t= 2.122, P-
Value=0.000<0.05
Supported
H1f Legal environment
moderates the effect of
competitive strategy
drivers on the
performance of
manufacturing SMEs in
Nairobi County, Kenya.
R2=0.110
F= 33.544, P-Value=
0.000<0.05
β=0.116, t=0.899, P-
Value=0.073>0.05
Not supported
The results above indicate that macro
environment moderates the relationship
between competitive strategy drivers and
firm performance except for the legal
environment. All the macroeconomic
aspects except the legal one individually
moderates the relationship between
competitive strategy drivers and firm
performance.
Conclusion
The objective of the study was to assess the
effect of macro environment on the
relationship between competitive strategy
drivers and the performance of
manufacturing SMEs. In order to achieve
this objective, a hypothesis which stated
that macro environment moderates the
effect of competitive strategy drivers on the
firm performance was formulated. Macro
environment was operationalized into six

http://journals.uonbi.ac.ke/damr ISSN - 2224-2023
November 2020 Vol 10 No 5 Pgs 107-133
125 | All rights reserved Department of Business Administration School of Business University of Nairobi DBA Africa Management Review
aspects, that is, political, economic, social,
technological, Legal and Ecological.
Moderation takes effect if the interaction
term between the moderator variable and
independent variable in the model is
significant (p-value<0.05). The study
findings supported the hypothesis that the
macro environment moderates competitive
strategy and firm performance relationship.
Political, economic, social, technological
and ecological aspects were found to
individually moderate the relationship
between competitive strategy drivers and
firm performance. Legal aspect on its own
did not moderate the relationship between
competitive strategy drivers and firm
performance. This finding concurs with the
resource-based theory of entrepreneurship
which argues that unique bundle of
resources at the disposal of the firm
generate sustained competitive advantage
(Barney, 1991; Conner & Prahalad, 1996).
Thus, entrepreneurs develop strategies
based on the resources available in the firm
and also based on the environmental
conditions and also the pro-activeness and
innovative nature of the entrepreneurs.
Resources that are valuable, rare, and
difficult to imitate or substitute are deemed
to be strategic enough to offer sustainable
competitive advantage (Barney, 1991).
Such strategic resources strengthen
organizations’ ability to uniquely
differentiate their products or service
offerings. These results showed that owners
of manufacturing SMEs need to scan their
political, economic, social, technological
environment as they adopt various
competitive strategy drivers so as to
enhance performance as proposed by
Conner (1991). Developing strategies in an
industry is the starting point for achieving
competitive advantage. However, firms do
not operate in a vacuum, they instead
operate in a n environment macro
environment creates both opportunities and
threats which then influence the strategies
adopted by the firms. Rohitratana and
Boon-Itt, (2011), argues that the present
business environment conditions cannot
allow companies to ignore the key impacts
of value for its focused position. Thus,
owners of manufacturing SMEs should take
cognizant of customers, competitors,
suppliers facilitate alignment between
competitive strategy drivers and macro
environments.
Recommendations
The results revealed significant relationship
between macro environment as a moderator
of the relationship between competitive
strategy drivers and performance of
manufacturing SMEs. This indicates that
owners of manufacturing SMEs should
embrace scanning of the environment in
which they operate as they formulate their
strategies. It was also revealed that legal
aspect of macro environment does not
moderate the relationship between
competitive strategy drives and
performance. On this basis, the study
recommends further analysis so as to find
the reasons behind this insignificant
moderating effect. Further manufacturing
SMEs across the board should adapt
appropriate competitive strategy drives in
line with the environment in which they
operate which would increase their
performance. The present study relies on a
single informant who had knowledge of the
firms’ activities and their level of
commitment. The use of multiple
respondents from each firm is preferable
and would provide additional data.
Limitations of the Study
This study had limitations encountered in
the process of writing the report. The
research was limited to a descriptive cross-

http://journals.uonbi.ac.ke/damr ISSN - 2224-2023
November 2020 Vol 10 No 5 Pgs 107-133
126 | All rights reserved Department of Business Administration School of Business University of Nairobi DBA Africa Management Review
sectional survey approach method for
which data was collected analyzed at
interpretation done at a specific time a cross
all the sampled SMEs as opposed to
longitudinal approach which allows for
collection, analysis and interpretation of
data over a period of time. Secondly only
one respondent for the target SMEs in the
manufacturing sector was used. This
required that the respondent be much
conversant with the operations of the SMEs
in the manufacturing sector. The research
was also aimed at SME owners/managers
who would not always have time to
respond. Further, the research only focused
on manufacturing SMEs in Nairobi County
thus there is a need to extend the research to
other counties for comparison of findings.
The questionnaire tool used was also a
limitation as it had closed ended questions
only. We encourage that future research
work deploys both open and closed ended
questions to allow for deeper insights into
the issue being studied. Future research may
also consider qualitative research
approaches to examine the above issues as
they would provide useful insights and
complement already existing quantitative
approaches in this area.
Acknowledgement
The author would like to thank the
University of Nairobi, main campus for
allowing access to the library facilities
including their very supportive staff
members.
Author Notes
This journal is an extract from the author’s
PhD thesis undertaken at the School of
Business, University of Nairobi, Kenya.
Declaration
The authors declare that they have no
conflict of interest with respect to research,
authorship or publication.
Funding
This research received no specific grant
from any funding agency in the public,
commercial, or not-for-profit sectors.
References
Adeoye, A. O., & Elegunde, A. F. (2012). Impacts
of external business environment on
organizational performance in the food and
beverage industry in Nigeria. British
Journal of Arts and Social Sciences, 6(2),
56-65.
Akdogan, A. A., & Cingoz, A. (2012). An empirical
study on determining the attitudes of small
and medium sized businesses (SMEs)
related to competition. Social and
Behavioral Sciences, 58, 252-258.
Ansoff, H. I., & McDonnell, E. J. (1990). Implanting
Strategic Management. (2ndEd). NY:
Prentice-Hall.
Barney, J. B. (1991). Firm resources and sustained
competitive advantage. Journal of
Management, 17(1), 99-120.
Burnes, B. (2000). Managing Change: A Strategic
Approach to Organisational Dynamics.
Harlow: UK: Pearson Education.
Chen, G., Du, H., & Chen, Y. (2011). Research on
Entrepreneurial Orientation and
Entrepreneurial Behavior: An Empirical
Study. In Management and Service Science
(MASS), International Conference, 1-3.
Conner, K. R., & Prahalad, C. (1996). A resource-
based theory of the firm: Knowledge versus
opportunism. Organization Science, 7(5),
477-501.
Dahmen, P. & Rodríguez, E. (2014). Financial
Literacy and the Success of Small
Businesses: An Observation from a Small
Business Development Center.
Numeracy,7(1), 3.
David, F. R. (2001). Strategic Management (18th
end). Upper River, NJ: Prentice-Hall.

http://journals.uonbi.ac.ke/damr ISSN - 2224-2023
November 2020 Vol 10 No 5 Pgs 107-133
127 | All rights reserved Department of Business Administration School of Business University of Nairobi DBA Africa Management Review
Davidsson, P. (2004). Researching
Entrepreneurship. NY: Springer.
Dubois, A. (1998). Organizing Industrial Activities
across Firm Boundaries. London:
Rutledge.
Gathungu, J. M., Aiko, D. M., & Machuki, V. N.
(2014). Entrepreneurial Orientation,
Networking, External Environment, and
Firm Performance. European Scientific
Journal, 10 (7).
Gathungu, J., & Baariu, V. L. (2018). Competitive
Strategies Entrepreneurial Orientation,
External Environment and Performance of
Small and Medium Enterprises in the
Manufacturing Sector in Nairobi City
County, Kenya. Journal of Arts and
Humanities, 7(9).
Gentry, J., & Vaidyanathan, R. (2010). A weighted
cash conversion cycle. Financial
Management, 19, 90-99.
Goll, I., & Rasheed, A. A. (2004). The Moderating
Effect of Business Environmental
Munificence and Dynamism on the
Relationship between Discretionary Social
Responsibility and Firm Performance.
Journal of Business Ethics, 49, 41- 54.
Machuki, V. N., & Aosa, E. (2011). The Influence
of external environment on the performance
of publicly quoted companies in Kenya.
Business Administration and Management
Journal, 1(7), 205-2018.
McMahon, D., & Carr, J. C. (1999). The
contributions of Chester Barnard to
strategic management theory. Journal of
Management History, 5, 228-240.
Miller, D. (1992). Generic strategies: Classification,
combination and context. In: Srivasta, P.
(Ed). Advances in Strategic Management,
8, 391-408.
Moullin, M. (2003). “Defining performance
measurement”. Perspectives on
Performance, 2(1/2), 3.
Muhammad, W. J. K. (2014). Strategic Planning and
Reality of External Environment of
Organizations in Contemporary Business
Environments. Business Management and
Strategy, 5, 2.
Ndife, C. F. (2014). Business Environment and
Survival of the Tourism Industry. Journal
of Business and Management 16, (10) Ver.
III.
Osborn, N. R., & Hunt, G. J. (1974). Environment
and organizational effectiveness.
Administrative Science Quarterly Review,
19(2), 231-246.
Pearce, J., & Robinson, G. (2011). Strategic
Management: Formulation,
Implementation and Control (12th Ed.).
NY: Irwin/McGraw-Hill.
Peteraf, M. (1993). The Cornerstones of Competitive
Advantage: A Resource-based View.
Strategic Management Journal, 14, 179-
191.
Pfeffer, J., & Salancik, G. R. (1978). The External
Control of Organizations: A Resource
Dependence Perspective. NY: Harper and
Row.
Richard, P. J., Devinney, T. M., Yip, G. S., &
Johnson, G. (2009). Measuring
Organizational Performance: Towards
Methodological Best Practice. Journal of
Management, 35(3), 718-804.
Salavou, H. (2015). Profitability in market -oriented
SMEs: does product innovation matter?
European Journal of Innovation
Management, 5(3), 164-171.
Selvam, M., Vanitha, S., Gayathri, J., Bennet, E.,
&Nageswari, P. (2010). The Determinants
of shareholders‟ wealth of acquiring firms
in India. Journal of Modern Accounting
and Auditing, 6(1), 46-54.
Sermon, D. G., Hitt, M. A., & Ireland, R. D. (2006).
Managing Firm Resources in Dynamic
Environments to Create Value: Looking
Inside the Box. Academy of Management,
32, 273-292.
Sidik, I. G. (2012). Conceptual framework of factors
affecting SME development: Mediating
factors on the relationship of entrepreneur
traits and SME performance. Procedia
Economics and Finance, 4 (2012), 373 –
383.
Spanos, Y., Zaralis, G., &Lioukas, S. (2004).
Strategy and Industry Effects on
Profitability: Evidence from Greece.
Strategic Management Journal, 25(2), 139-
165.

http://journals.uonbi.ac.ke/damr ISSN - 2224-2023
November 2020 Vol 10 No 5 Pgs 107-133
128 | All rights reserved Department of Business Administration School of Business University of Nairobi DBA Africa Management Review
Venkatraman, N., & Prescott, J. E. (1990).
Environment-strategy co-alignment: An
empirical test of its performance
implications. Strategic Management
Journal, 11(1), 1-23.
http://journals.uonbi.ac.ke/damr ISSN - 2224-2023
November 2020 Vol 10 No 5 Pgs 107-133
129 | All rights reserved Department of Business Administration School of Business University of Nairobi DBA Africa Management Review
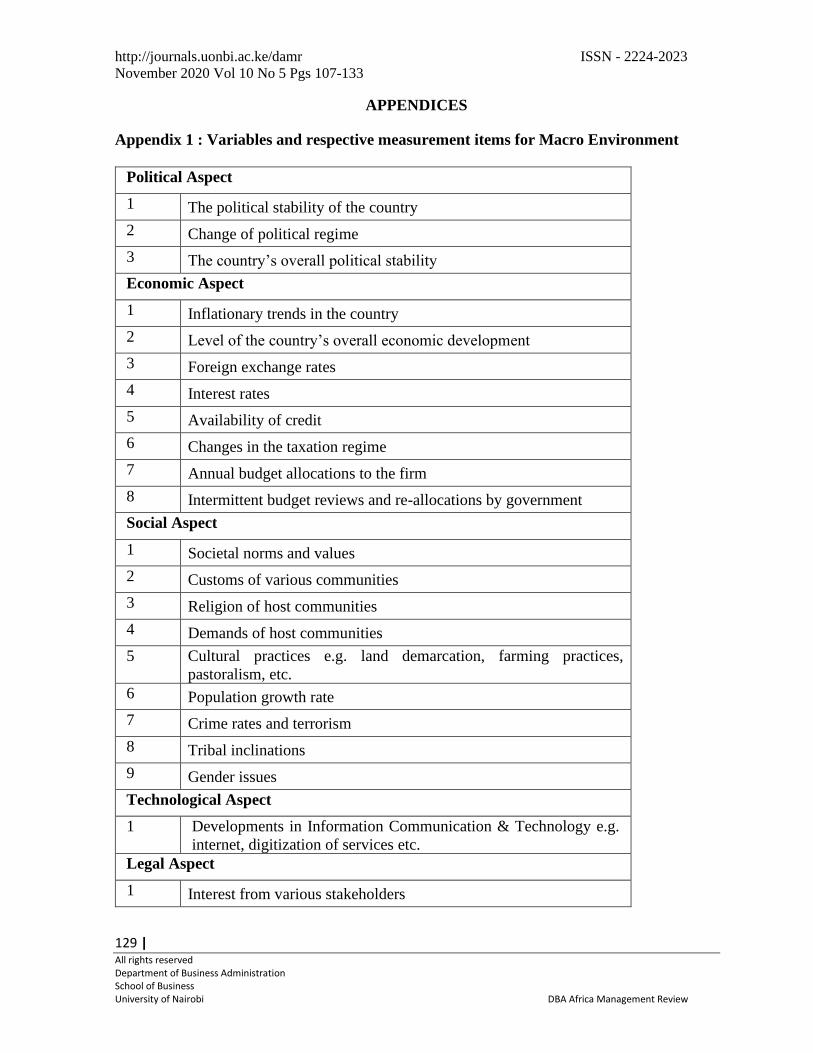
APPENDICES
Appendix 1 : Variables and respective measurement items for Macro Environment
Political Aspect
1 The political stability of the country
2 Change of political regime
3 The country’s overall political stability
Economic Aspect
1 Inflationary trends in the country
2 Level of the country’s overall economic development
3 Foreign exchange rates
4 Interest rates
5 Availability of credit
6 Changes in the taxation regime
7 Annual budget allocations to the firm
8 Intermittent budget reviews and re-allocations by government
Social Aspect
1 Societal norms and values
2 Customs of various communities
3 Religion of host communities
4 Demands of host communities
5 Cultural practices e.g. land demarcation, farming practices,
pastoralism, etc.
6 Population growth rate
7 Crime rates and terrorism
8 Tribal inclinations
9 Gender issues
Technological Aspect
1 Developments in Information Communication & Technology e.g.
internet, digitization of services etc.
Legal Aspect
1 Interest from various stakeholders

http://journals.uonbi.ac.ke/damr ISSN - 2224-2023
November 2020 Vol 10 No 5 Pgs 107-133
130 | All rights reserved Department of Business Administration School of Business University of Nairobi DBA Africa Management Review
2 Government pronouncements on changes in policy from time to time
3 Devolved Government structure
4 Occurrences in the natural environment e.g. floods, drought etc.
5 Civil society firm’s agitation for rights
Legal Aspect
1 Government’s fiscal policies
2 Taxation policies
3 Changes in the Kenya Constitution 2010 and subsequent legislation
4 The legal framework prescribing the mandate of the firm
5 Legislative activities touching on the firm’s business
6 Environmental legislation

http://journals.uonbi.ac.ke/damr ISSN - 2224-2023
November 2020 Vol 10 No 5 Pgs 107-133
131 | All rights reserved Department of Business Administration School of Business University of Nairobi DBA Africa Management Review
Appendix 2 : Variables and respective measurement items for Competitive strategy
drivers
Environmental based drivers
1 We have the ability to deliver high quality products and
services
2 We have effective sales and marketing team
3 The market understands the benefits offered by the
differentiated offerings
4 Products and services different from and more attractive than
those of our competitors
5 We have brand image that our customers value
6 We concentrate on particular niche markets
7 We understand the dynamics of the niche market and the
unique needs of customers within it
8 We build strong brand loyalty amongst our customers thus
making our particular market segment less attractive to
competitors
9 We offer unique features that fulfill the demands of a narrow
market
10 The firm concentrate on a particular market
11 The firm charge low prices relative to other firms that compete
within the target market
12 The firm practice the lowest cost of operation in the industry
13 Our production process is backed by innovation
14 The firm acquire quality raw materials at the lowest price
15 The firm produces highly standardized product using advanced
technology
Resource based drivers
1 Our firm can easily mobilise resources
2 Our firm has a strong business plan
3 Our firm has clear strategy and competitive edge
4 Our management team are competent and valuable
5 Our business valuation and scalability are in line with investors
needs
6 Our firm embraces the development of individual and
institutional ingenuity
7 Digitization of performance management not only provides
more precise data but also positively influences management
process
8 Technology facilitate a culture of continuous feedback thus
everyone knows where they stand on a regular basis
9 Technology enables collection of more objective performance
data on a real time basis

http://journals.uonbi.ac.ke/damr ISSN - 2224-2023
November 2020 Vol 10 No 5 Pgs 107-133
132 | All rights reserved Department of Business Administration School of Business University of Nairobi DBA Africa Management Review
10 Our firm has high skilled labour so as to produce economic
value
11 Human capital is the most essential capital in our firm
12 The firm value knowledge, experience, skill, attitudes,
abilities, behaviour and obligation of employees
13 The ability to effectively acquire, control and utilize
knowledge in every business activity is the differentiator
between our firm and competitors
14 A tool of managing increasingly complex global value chain
networks
15 The firm focuses on optimizing volumes and value based on
cross functional management
16 The firm integrate decision making throughout the value chain
Hybrid strategy drivers
1 Our firm achieve both high quality and productivity at the same
time
2 Our firm embraces mass customizations
3 Our firm makes consistent low cost strategic decisions on how
to pursue competitive advantages and align resources and
capabilities
4 It is a way of responding to changes in the competitive
environment more flexibly and effectively and stay
competitive

http://journals.uonbi.ac.ke/damr ISSN - 2224-2023
November 2020 Vol 10 No 5 Pgs 107-133
133 | All rights reserved Department of Business Administration School of Business University of Nairobi DBA Africa Management Review
Appendix 3 : Firm Performance
Entrepreneur Satisfaction
1 You are generally satisfied with your current business
2 Your current business meets your expectations
3 Your current business is your most ideal
Growth in Employment
1 Number of employees have significantly increased in line with our
business expansion
2 Local market plays a role in employment growth
3 Our firm promotes and hire new employees annually
4 Our firm experience low employee turnover annually
Business longevity
1 Financial strength influences our longevity
2 Customer orientation determine business lifespan
3 Internal capabilities influence our longevity
4 Strategic perspective defines our firm lifespan
5 Learning and growth influences our firm longevity