dba - environmental protection agency · september 2016 noise survey at tulligmore quarry solutions...
TRANSCRIPT
Septe
Tullig
O’Rega
Tulli
Client CuOB
Prepared by Da
Re
damia
based in Cork,damianbrosna
This report and its contepermission. The report ispersonal and non-assigna
|||||||||||||||||||||||||| Da
damian brosn
mber 2016 noise survey at
more Quarry Solutions &
n’s Quarry Products facility,
gmore, Dripsey, Co. Cork
Licence ref. W0255-02
thbert EnvironmentalO Tulligmore Quarry Solutions
mian Brosnan BSc MSc MIOA MIEI
port no Date Status079.1.1 13.10.16 Release 1
n brosnan acoustics
serving Ireland 086 813 [email protected] damianbrosnan.com
nts are copyright of damian brosnan acoustics. It may not be reproduced withoutto be used only for its intended purpose. The report is confidential to the client, and isble. No liability is admitted to third parties. © damian brosnan acoustics 2016
mian Brosnan – assisting clients since 2001 ||||||||||||||||||||||||||
an acoustics is part of the DixonBrosnan Group
dBAdamian brosnan acoustics

September 2016 noise survey at Tulligmore Quarry Solutions & O’Regan’s Quarry Products facility, Dripsey, Co. Cork DBA report 079.1
© damian brosnan acoustics 2
Contents
1 Introduction 3
2 Results 3
3 Conclusions 4
Appendix 1: Noise stations 5
Appendix 2: W0255-02 noise conditions 6
Appendix 3: Survey details 7
Appendix 4: Noise data 8
Appendix 5: Profiles & spectra 9
Appendix 6: Glossary 10
Summary
On 02.09.16, Damian Brosnan Acoustics carried out a daytime environmental
noise survey in the vicinity of the Tulligmore Quarry Solutions facility at Tulligmore,
Dripsey, Co. Cork. The survey is an annual requirement of waste licence W0255-
02 which relates to the site.
Activities subject to licence W0255-02 have not yet commenced at the facility.
However, the related firm O’Regan’s Quarry Products is also based at the site,
and quarrying and processing operations associated with same were underway
throughout the survey.
Site noise emissions were audible to varying degrees at all five measurement
stations. Site specific LAeq 30 min levels at four boundary stations were 36-51 dB. At
a fifth offsite station, the site specific level was less than 37 dB. These levels are
lower than the 55 dB limit specified in waste licence W0255-02. No audible tones
or impulses were noted in facility emissions, thus complying with schedule B.4 of
the licence.
September 2016 noise survey at Tulligmore Quarry Solutions & O’Regan’s Quarry Products facility, Dripsey, Co. Cork DBA report 079.1
© damian brosnan acoustics 3
1 Introduction
1.1 Damian Brosnan Acoustics was instructed by Cuthbert Environmental, on behalf of their client Tulligmore Quarry
Solutions, to carry out a noise survey at their facility at Tulligmore, Dripsey, Co. Cork. The survey is an annual
requirement of waste licence W0255-02 issued 21.03.13 by the Environmental Protection Agency in respect of the
facility. The objectives of the survey were as follows:
To undertake noise monitoring in accordance with International Standard ISO 1996-2:2007 Acoustics –
Description, measurement and assessment of environmental noise, Part 2: Determination of environmental noise
levels (2007).
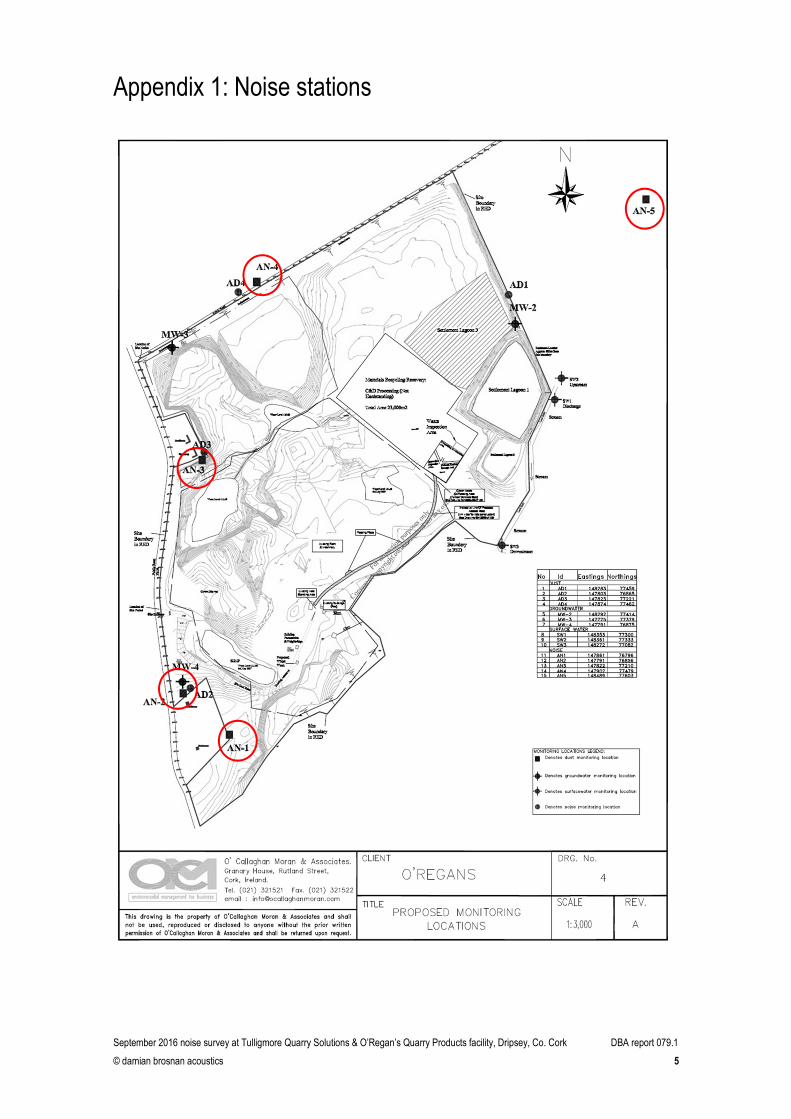
To measure noise levels at four boundary stations and one offsite station specified in licence W0255-02, as shown
in appendix 1.
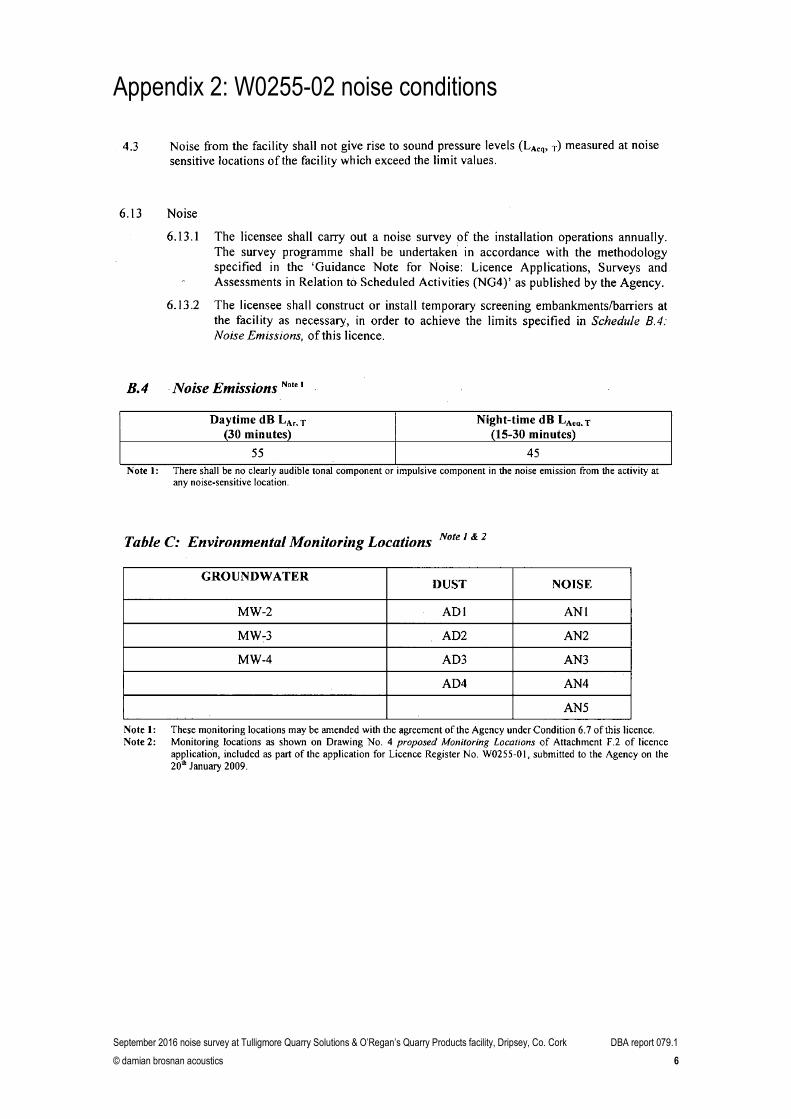
To assess measured levels in the context of noise limits specified in the waste licence, reproduced in appendix 2.
1.2 The noise survey was undertaken during daytime hours Friday 02.09.16. Activities subject to licence W0255-02
have not yet commenced at the facility. However, the related firm O’Regan’s Quarry Products is also based at the
site, and quarrying and processing operations associated with same were underway throughout the survey, with
emissions arising from processing plant near the weighbridge, an aggregate washing plant, three loaders in
intermittent use, occasional truck movements, and maintenance garage activity. It was agreed with the applicant that
survey methodology would follow that set out in the Environmental Protection Agency 2006 document Guidance note
for noise in relation to scheduled activities. Survey methodology, equipment specifications and weather conditions
are listed in appendix 3.
2 Results
2.1 Noise data recorded are presented in appendix 4, and summarised in table 1 over. Frequency spectra and time
history profiles are shown in appendix 5.
2.2 LAeq 30 min levels at the four boundary stations AN1-AN4 were 40-47 dB. The soundscape here was influenced by
offsite sources such as road traffic. All four stations were affected to varying degrees by onsite sources, chiefly
occasional trucks movements on the site access road and continuous emissions from the processing and washing
plants. The specific contribution from site activities was calculated at 36-41 dB at AN1, AN3 and AN4, rising to 51 dB
at AN2 due to the influence of passing trucks on the nearby access road. These contributions are lower than the 55
dB daytime limit specified in waste licence W0255-02.
2.3 The LAeq 30 min level at AN5, the only offsite station, was 52 dB. This level was influenced by local and distant road
traffic, in addition to activity at any adjacent premises. Activities at the applicant’s quarry facility were slightly audible
on the breeze, with their contribution was estimated at less than 37 dB.

September 2016 noise survey at Tulligmore Quarry Solutions & O’Regan’s Quarry Products facility, Dripsey, Co. Cork DBA report 079.1
© damian brosnan acoustics 4
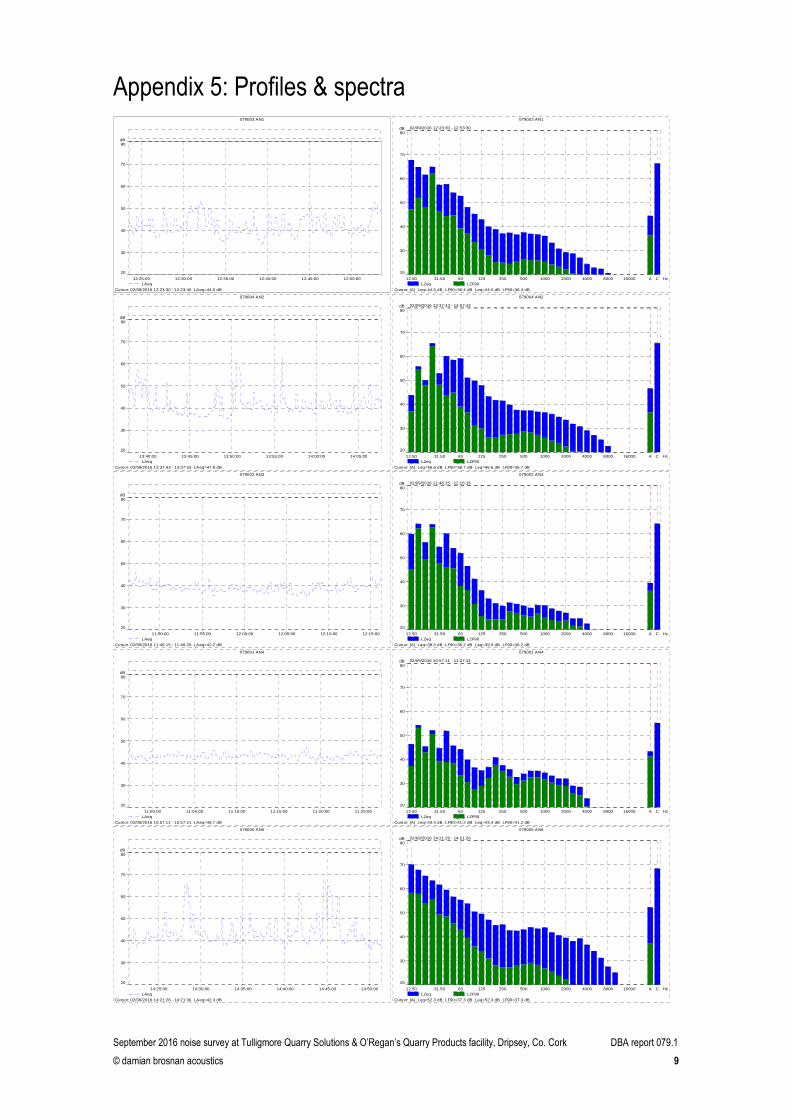
2.4 No audible tones or impulses were noted in facility emissions. Third octave band frequency analysis detected
significant energy in the 16 and 25 Hz bands at stations AN1-AN4, with the signal continuous and steady throughout
each interval and thus apparent in LZeq 30 min and LZF90 30 min spectra. When assessed using annex D of International
Standard ISO 1996-2:2007 Acoustics – Description, measurement and assessment of environmental noise, Part 2:
Determination of environmental noise levels (2007), the signal was sufficiently strong to be tonal at AN1 (LZF90 30 min
only), AN2 (LZeq 30 min and LZF90 30 min) and AN3 (LZF90 30 min only). The source of the signal was not identified, and was
not audibly detected by the survey operator.
Table 1: Noise data summary.
Station AN1 AN2 AN3 AN4 AN5
Period Daytime Daytime Daytime Daytime Daytime
Ambient LAeq 30 min (dB) 45 47 40 43 52
Facility specific LAeq 30 min (dB) 38 51 36 41 <37
Tone objectively detected x x
Tone attributable to facility ? ? ? x x
Facility audibly tonal x x x x x
Facility audibly impulsive x x x x x
Facility rated LReq 30 min (dB) 38 51 36 41 <37
Limit (dB) 55 55 55 55 55
Compliance
3 Conclusions
3.1 Site noise emissions were audible to varying degrees at all five stations. Site specific LAeq 30 min levels at the four
boundary stations were 36-51 dB. At the offsite station, the site specific level was less than 37 dB. These levels are
lower than the 55 dB limit specified in waste licence W0255-02.
3.2 No audible tones or impulses were noted in facility emissions, thus complying with schedule B.4 of the licence.
September 2016 noise survey at Tulligmore Quarry Solutions & O’Regan’s Quarry Products facility, Dripsey, Co. Cork DBA report 079.1
© damian brosnan acoustics 5
Appendix 1: Noise stations
September 2016 noise survey at Tulligmore Quarry Solutions & O’Regan’s Quarry Products facility, Dripsey, Co. Cork DBA report 079.1
© damian brosnan acoustics 6
Appendix 2: W0255-02 noise conditions

September 2016 noise survey at Tulligmore Quarry Solutions & O’Regan’s Quarry Products facility, Dripsey, Co. Cork DBA report 079.1
© damian brosnan acoustics 7
Appendix 3: Survey details
File Project ref. 079
Client Cuthbert Environmental OBO Tulligmore Quarry Solutions
Location TQS / O’Regans quarry Tulligmore Dripsey Co Cork
Stations Onsite: AN1 AN2 AN3 AN4 Offsite: AN5
Purpose Waste licence compliance survey
Comment TQS operations not yet commenced O’Regans quarry operating
Event Period Daytime
Date 02.09.16
Day Friday
Time 1045-1500
Operator Damian Brosnan BSc MSc MIOA MIEI
Sound level meter 2250: All stations
Conditions Cloud cover Varying 80-100 %
Precipitation 0 mm
Temperature 17 increasing to 20 °C
Wind Direction NW
Speed 0-2 m/s
Measurement Anemo anemometer 2 m above ground level
Sound level meter Instrument Bruel & Kjaer Type 2250
Instrument serial no. 2506594
Microphone serial no. 2529531
Application BZ7224 Version 2.5
Bandwidth Broadband & 1/3 octaves
Max. input level 141.16 dB
Broadband weightings Time: Fast Frequency: AC
Spectrum weightings Time: Fast Frequency: Z
Windscreen correction UA-1650
Sound field correction Free-field
UKAS calibration 08.02.16
Calibrating laboratory Bruel & Kjaer Denmark
Calibration certificate Available on request
Onsite calibration Time 02/09/2016 10:53:15
Type External
Sensitivity 48.05 mV/Pa
Post survey check 93.9 dB
Onsite calibrator Instrument Bruel & Kjaer Type 4231
Instrument serial no. 1723667
UKAS calibration 05.02.16
Calibrating laboratory Bruel & Kjaer Denmark
Calibration certificate Available on request
Uncertainty Instrumentation ±1 dB (IEC 61672:2002 Class 1)
External ±0-3 dB (station & weather dependent, estimated)
Total ±5 dB (estimated, including expanded uncertainty)
Methodology Standards ISO 1996 (2007 & 2016) EPA (2006) (client request)
Microphone position Free field, 1.5 m above ground level
Intervals 30 min logging at 10 s

September 2016 noise survey at Tulligmore Quarry Solutions & O’Regan’s Quarry Products facility, Dripsey, Co. Cork DBA report 079.1
© damian brosnan acoustics 8
Appendix 4: Noise data
See glossary at end of report for definition of parameters
Station Date Time Wind
vector
LAeq 30 min
dB
LAF10 30 min
dB
LAF90 30 min
dB
Specific
LAeq 30 min dB
AN1
02.09.16 1223-1253 - 45 48 36 38
Facility: No emissions audible apart from several truck movements on access road, quite audible when
present. No emissions audible from rest of site.
Extraneous: Intermittent R619 traffic clearly audible when passing, and audible in distance. Bird song/calls
and aircraft. Lightly rustling vegetation. Activity at premises outside boundary regularly clearly audible,
including banging noise, with angle grinder in frequent use clearly audible.
Specific LAeq T determination: Typical truck LAF peaking at 54 dB; 5 events of 10 s normalised to 30 min.
AN2
02.09.16 1337-1407 - 47 47 37 51
Facility: Several truck movements on access road dominant when present. Processing plant near
weighbridge continuously audible at low level. Loader movements around weighbridge area also audible at
low level.
Extraneous: Intermittent R619 traffic dominant when present. Bird song/calls and aircraft. No emissions
audible from offsite premises due to screening by bank.
Specific LAeq T determination: Typical truck LAF peaking at 68 dB; 4 events of 10 s normalised to 30 min,
added to L90 re washing plant.
AN3
02.09.16 1146-1216 - 40 42 36 36
Facility: Washing plant continuously slightly audible, partially screened by intervening stockpiles. Loader
activity near weighbridge area also slightly audible at intervals.
Extraneous: Offsite road traffic not audible due to measurement position at base of bank. Bird song/calls and
aircraft.
Specific LAeq T determination: L90 considered representative of washing plant emissions. Loader emissions
negligible.
AN4
02.09.16 1057-1127 x 43 45 41 41
Facility: Washing plant continuously audible at low level. No other emissions audible.
Extraneous: Sporadic traffic outside boundary clearly audible when present. Intermittent traffic on R619 quite
audible. Bird song/calls, aircraft.
Specific LAeq T determination: L90 considered representative of washing plant.
AN5
02.09.16 1421-1451 + 52 49 37 <37
Facility: Washing plant emissions slightly audible almost continuously, fluctuating on breeze.
Extraneous: Sporadic traffic on local road to N clearly audible when present. R619 traffic audible at low level.
Occasional forklift truck activity at compound at 100 m audible at low level. Bird song/calls and aircraft. Vehicle
movement x1 on adjacent access road at 1428 intrusive, and again 1441, and also 1444-1446.
Specific LAeq T determination: Insufficient to influence L90, thus <L90.
Audibility scale: Inaudible; faintly audible; slightly audible; audible at low level; quite audible; clearly audible; dominant; intrusive; excessive.
September 2016 noise survey at Tulligmore Quarry Solutions & O’Regan’s Quarry Products facility, Dripsey, Co. Cork DBA report 079.1
© damian brosnan acoustics 9
Appendix 5: Profiles & spectra
Cursor: 02/09/2016 12:23:30 - 12:23:40 LAeq=44.0 dB
079003 AN1
12:25:00 12:30:00 12:35:00 12:40:00 12:45:00 12:50:00
20
30
40
50
60
70
80dB
LAeq
Cursor: (A) Leq=44.5 dB LF90=36.4 dB Leq=44.5 dB LF90=36.4 dB
079003 AN1
12.50 31.50 63 125 250 500 1000 2000 4000 8000 16000 A C
20
30
40
50
60
70
80dB 02/09/2016 12:23:30 - 12:53:30
Hz
LZeq LZF90
Cursor: 02/09/2016 13:37:43 - 13:37:53 LAeq=47.8 dB
079004 AN2
13:40:00 13:45:00 13:50:00 13:55:00 14:00:00 14:05:00
20
30
40
50
60
70
80dB
LAeq
Cursor: (A) Leq=46.6 dB LF90=36.7 dB Leq=46.6 dB LF90=36.7 dB
079004 AN2
12.50 31.50 63 125 250 500 1000 2000 4000 8000 16000 A C
20
30
40
50
60
70
80dB 02/09/2016 13:37:43 - 14:07:43
Hz
LZeq LZF90
Cursor: 02/09/2016 11:46:15 - 11:46:25 LAeq=42.2 dB
079002 AN3
11:50:00 11:55:00 12:00:00 12:05:00 12:10:00 12:15:00
20
30
40
50
60
70
80dB
LAeq
Cursor: (A) Leq=39.5 dB LF90=36.2 dB Leq=39.5 dB LF90=36.2 dB
079002 AN3
12.50 31.50 63 125 250 500 1000 2000 4000 8000 16000 A C
20
30
40
50
60
70
80dB 02/09/2016 11:46:15 - 12:16:15
Hz
LZeq LZF90
Cursor: 02/09/2016 10:57:11 - 10:57:21 LAeq=48.7 dB
079001 AN4
11:00:00 11:05:00 11:10:00 11:15:00 11:20:00 11:25:00
20
30
40
50
60
70
80dB
LAeq
Cursor: (A) Leq=43.4 dB LF90=41.2 dB Leq=43.4 dB LF90=41.2 dB
079001 AN4
12.50 31.50 63 125 250 500 1000 2000 4000 8000 16000 A C
20
30
40
50
60
70
80dB 02/09/2016 10:57:11 - 11:27:11
Hz
LZeq LZF90
Cursor: 02/09/2016 14:21:26 - 14:21:36 LAeq=42.3 dB
079005 AN5
14:25:00 14:30:00 14:35:00 14:40:00 14:45:00 14:50:00
20
30
40
50
60
70
80dB
LAeq
Cursor: (A) Leq=52.3 dB LF90=37.3 dB Leq=52.3 dB LF90=37.3 dB
079005 AN5
12.50 31.50 63 125 250 500 1000 2000 4000 8000 16000 A C
20
30
40
50
60
70
80dB 02/09/2016 14:21:26 - 14:51:26
Hz
LZeq LZF90
September 2016 noise survey at Tulligmore Quarry Solutions & O’Regan’s Quarry Products facility, Dripsey, Co. Cork DBA report 079.1
© damian brosnan acoustics 10
Appendix 6: Glossary
Ambient Total noise environment at a location, including all sounds present.
A-weighting Weighting or adjustment applied to sound level to approximate non-linear frequency response of humanear. Denoted by suffix A in parameters such as LAeq T, LAF10 T, etc.
Background level A-weighted sound pressure level of residual noise exceeded for 90 % of time interval T. Denoted LAF90 T.
Broadband Noise which contains roughly equal energy across frequency spectrum. Does not contain tones, and isgenerally less annoying than tonal noise.
Decibel (dB) Unit of noise measurement scale. Based on logarithmic scale so cannot be simply added or subtracted. 3dB difference is smallest change perceptible to human ear. 10 dB difference is perceived as doubling orhalving of sound level. Examples of decibel levels are as follows: 20 dB: very quiet room; 30-35 dB: night-time rural environment; 55-65 dB: conversation; 80 dB: busy pub; 100 dB: nightclub. Throughout thisreport noise levels are presented as decibels relative to 20 µPa.
Fast response 0.125 seconds response time of sound level meter to changing noise levels. Denoted by suffix F inparameters such as LAF10 T, LAF90 T, etc.
Free field Noise environment away from all surfaces other than ground ie. outside near field.
Frequency Number of cycles per second of a sound or vibration wave. Low frequency noise may be perceived as hum,while whine represents higher frequency. Range of human hearing approaches 20-20,000 Hertz.
Hertz (Hz) Unit of frequency measurement.
Impulse Noise which is of short duration, typically less than one second, sound pressure level of which issignificantly higher than background.
Interval Time period T over which noise parameters are measured at position. Denoted by T in LAeq T, LAF90 T, etc.
LAeq T Equivalent continuous sound pressure level during interval T, effectively representing average A-weightednoise level of ambient noise environment.
LAF Sound pressure level averaged over one second, and changing each second in fluctuating noiseenvironment.
LAF10 T Sound pressure level exceeded for 10% of interval T, usually used to quantify traffic noise.
LAF90 T Sound pressure level exceeded for 90% of interval T, usually used to quantify background noise. May alsobe used to describe noise level from continuous steady or almost-steady source, particularly where localnoise environment fluctuates.
LReq T Rating noise level, derived from LAeq T plus specified adjustments for tonal and impulsive characteristics.Equivalent to LAr T used by EPA.
Masking The rendering inaudible of one noise source by another noise source(s) which may be louder, or maycontain significant acoustic energy in the same part of the frequency spectrum. In the latter case, anytone(s) in the original source emissions may become inaudible.
Near field Noise levels recorded near walls or other surfaces, artificially increased due to reflections. Levels near wallsmay be increased by up to 3 dB, and up to 6 dB near corners. Free field conditions may be achieved bymaintaining separation distance of at least 3.5 m from walls.
Noise sensitive location Any dwelling house, hotel or hostel, health building, educational establishment, place of worship orentertainment, or any other facility or area of high amenity which for its proper enjoyment requires absenceof noise at nuisance levels.
1/3 octave band Frequency spectrum may be divided into octave bands. Upper limit of each octave is twice lower limit. Eachoctave may be subdivided into thirds, allowing greater analysis of tones.
Residual level Noise level remaining when specific source is absent or does not contribute to ambient.
September 2016 noise survey at Tulligmore Quarry Solutions & O’Regan’s Quarry Products facility, Dripsey, Co. Cork DBA report 079.1
© damian brosnan acoustics 11
Specific level LAeq T level produced by specific noise source under consideration during interval T, measured directly or byestimation or calculation.
Tone Character of noise caused by dominance of one or more frequencies which may result in increased noisenuisance.
Wind vector May be positive (+), negative (-), neutral (0) or crosswind (x). Positive wind vector blows from source toreceptor, within angular range of ±45°, creating conditions more favourable to propagation. During certainconditions, this range may increase to ±60° by day and ±90° at night. Negative wind vector occurs whenreceptor is upwind of source. Neutral vector arises during still conditions, or upwind when in close proximityto source. Crosswinds typically result in negative vector.
Z-weighting Standard weighting applied by sound level meters to represent linear scale. Denoted by suffix Z inparameters such as LZeq T, LZF90 T, etc. used to describe 1/3 octave band levels in frequency spectra.
In this report units are generally presented using US National Institute Of Standards & Technology guidelines.